


 География
Похожие презентации:


 based on analysis of data from CHAMP satellite")


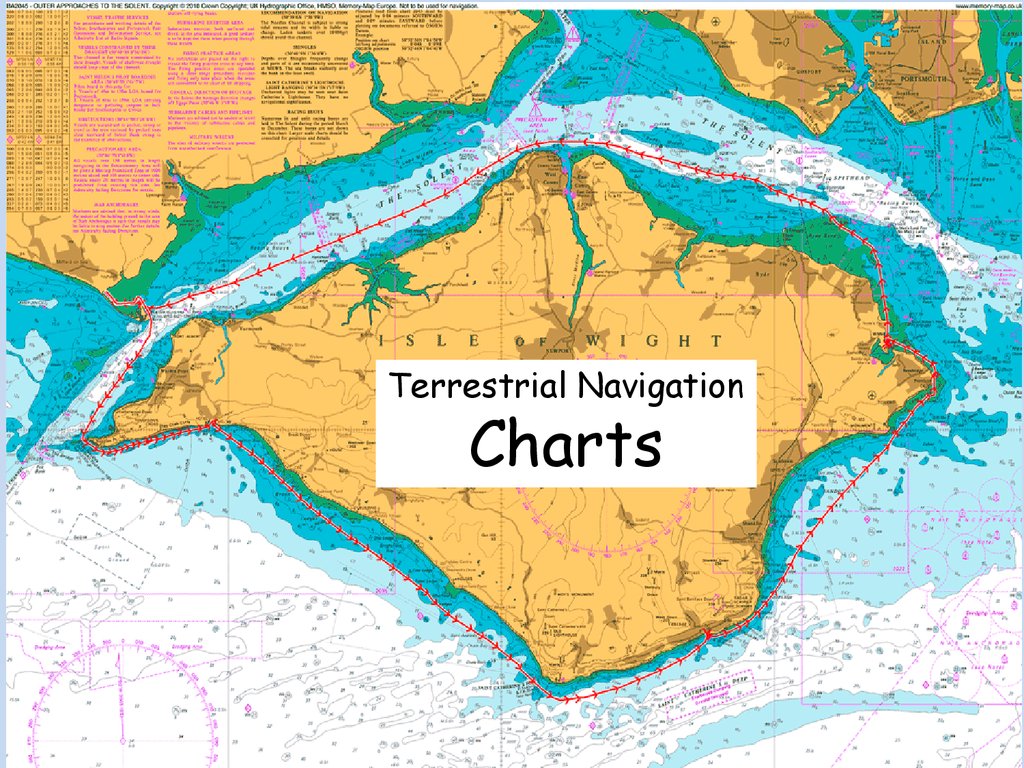
Terrestrial navigation charts
1.
Terrestrial NavigationCharts
2.
Topics covered- basic knowledge of chart projections
- 'natural scale' of a chart
- requirements of a chart appropriate for
marine navigation
- Mercator chart and the principles of its construction
- properties of the chart and the degree to which
it meets navigational requirements and its limitations
- use of a chart catalogue ( during chart work )
3.
4.
Projection : method of representing a spheroidal surfaceon a plane.
There are many ways ; some look quite odd ,but there will
be always some distortion.
5.
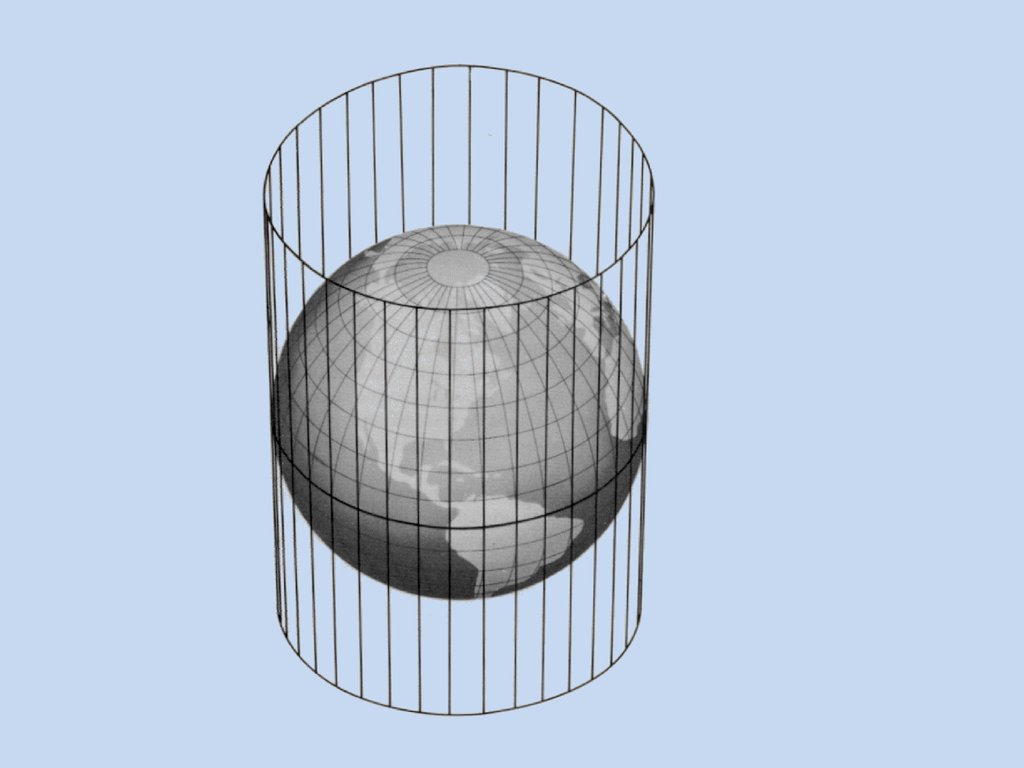
A projection could be thought as being created bywrapping a plane around a sphere, switching a light on
at a certain position in the sphere, and projecting
features form the sphere (earth) onto the plane.
6.
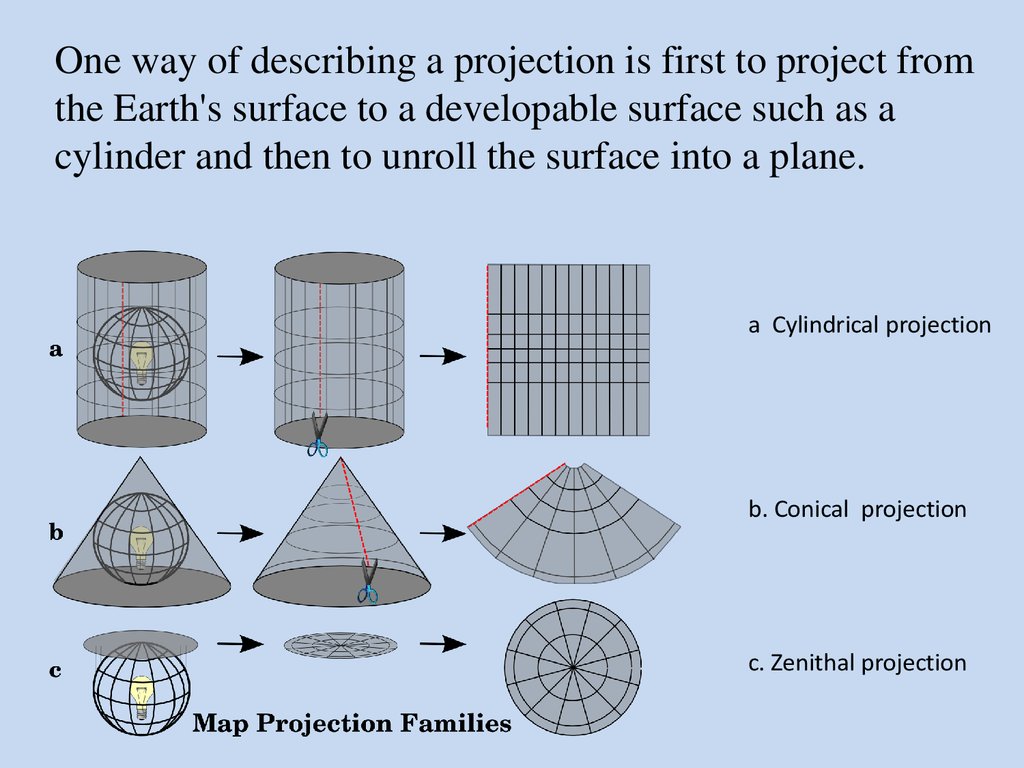
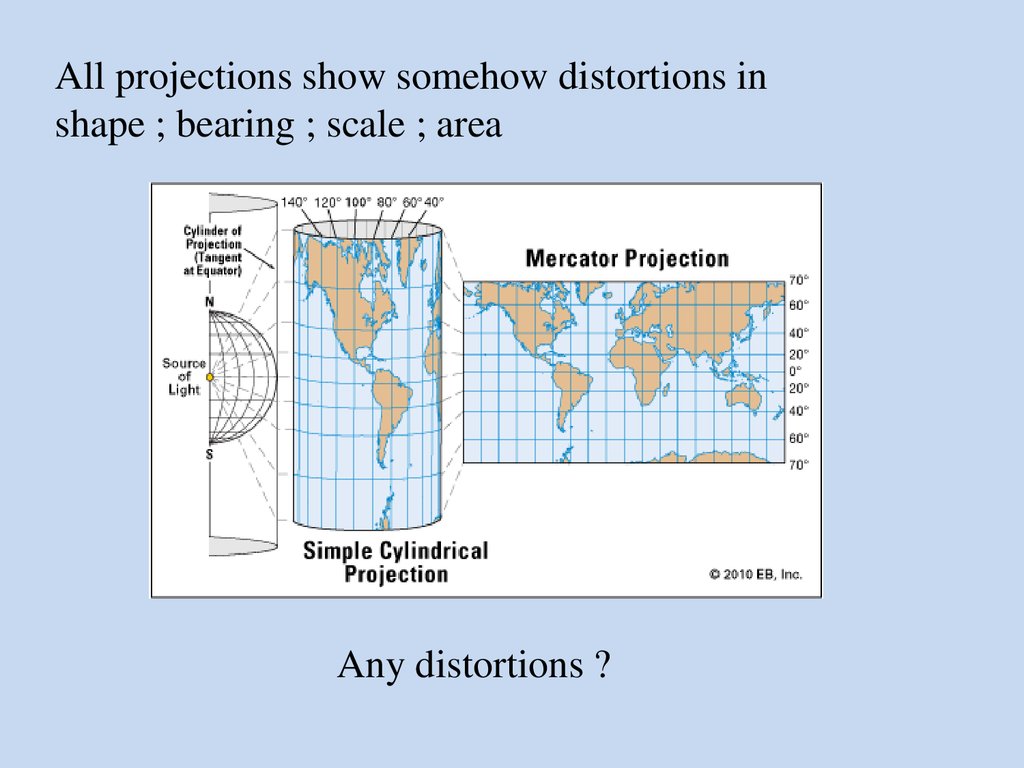
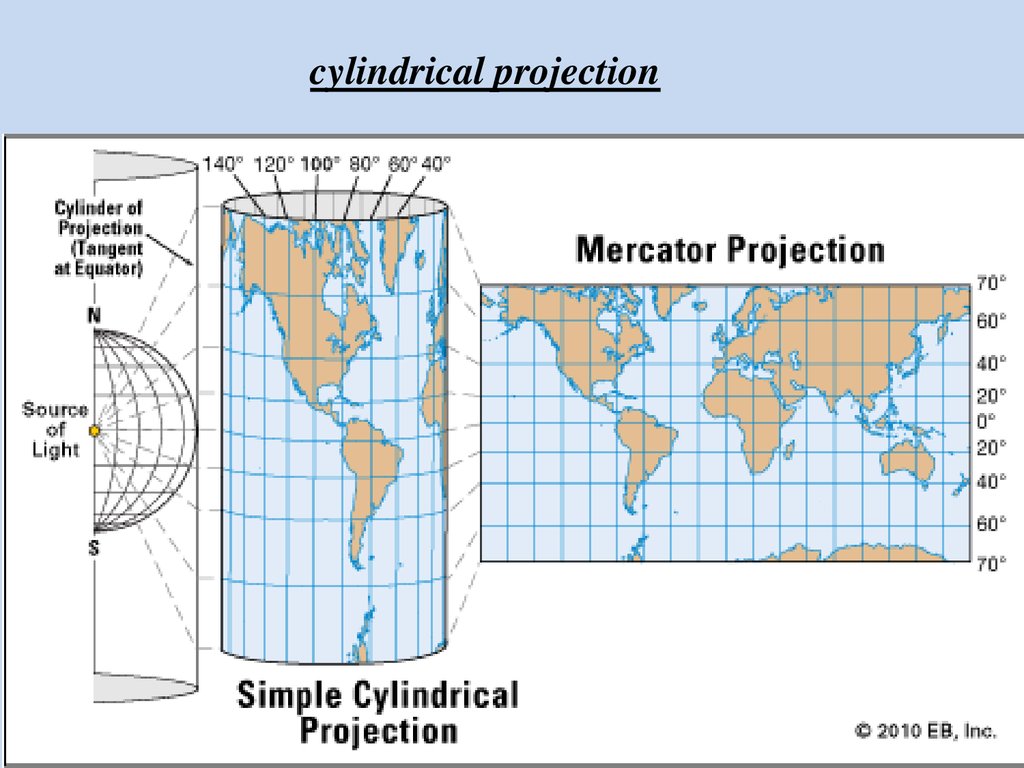
One way of describing a projection is first to project fromthe Earth's surface to a developable surface such as a
cylinder and then to unroll the surface into a plane.
a Cylindrical projection
b. Conical projection
c. Zenithal projection
7.
All projections show somehow distortions inshape ; bearing ; scale ; area
Any distortions ?
8.
The choice of the projection depend on the requirementsof the user.
The mariners’ chart requirements are :
- course line (rhumbline / great circle) is a straight line
- Orthomorphism ( conformity)
- change of scale negligible
This means correct shape ; bearing and distances ( scale)
This cannot be met in one single projection, most times
only shape and bearing at the expense of scale.
9.
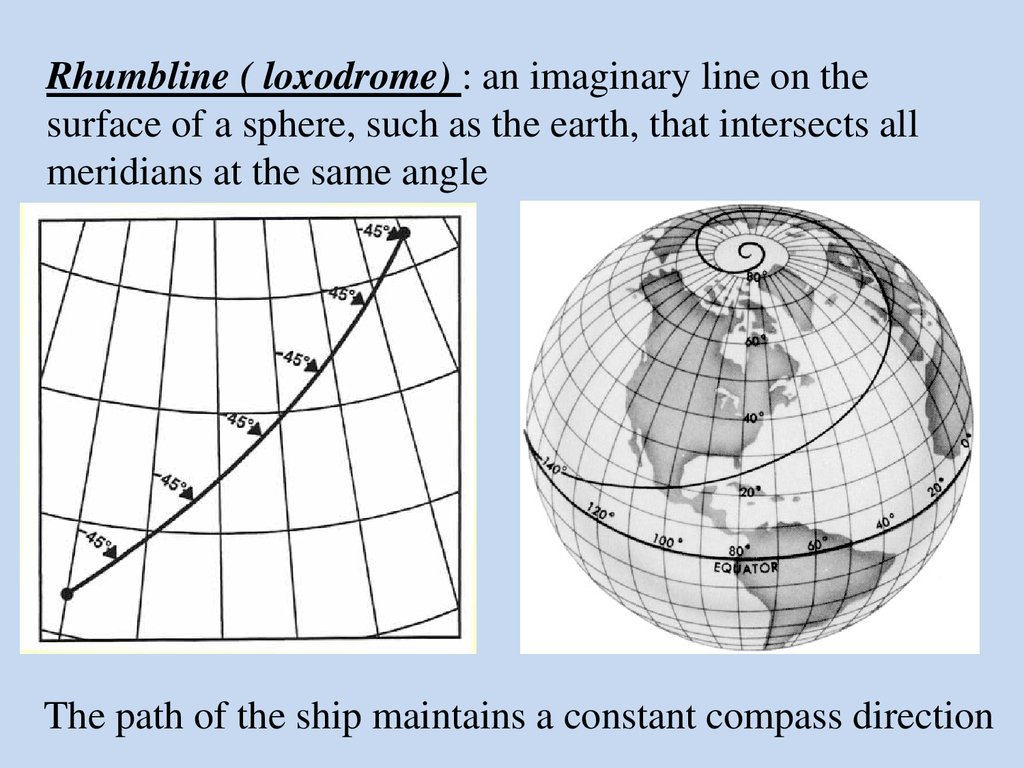
Rhumbline ( loxodrome) : an imaginary line on thesurface of a sphere, such as the earth, that intersects all
meridians at the same angle
The path of the ship maintains a constant compass direction
10.
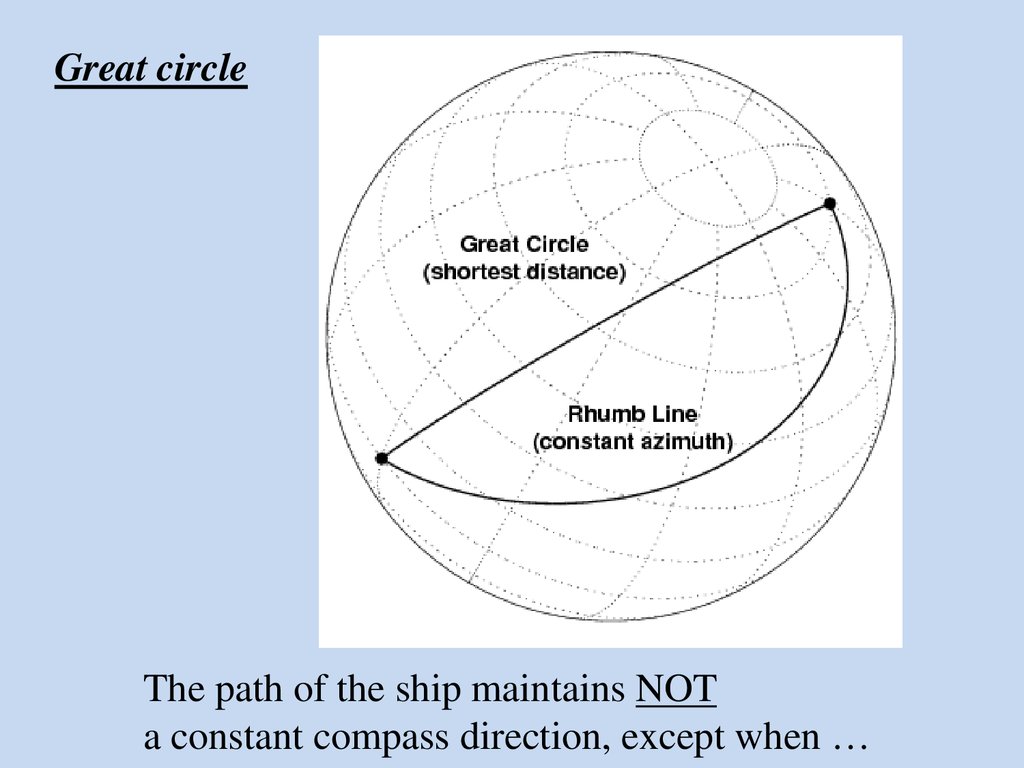
Great circleThe path of the ship maintains NOT
a constant compass direction, except when …
11.
Orthomorphism ( comformity) :The angle on earth is the same as in the chart.
earth
chart
Is the chart conformal ?
12.
The scale of a chart( also called natural scale)
is the ratio of a given
distance on the chart to the
actual distance which it
represents on the earth.
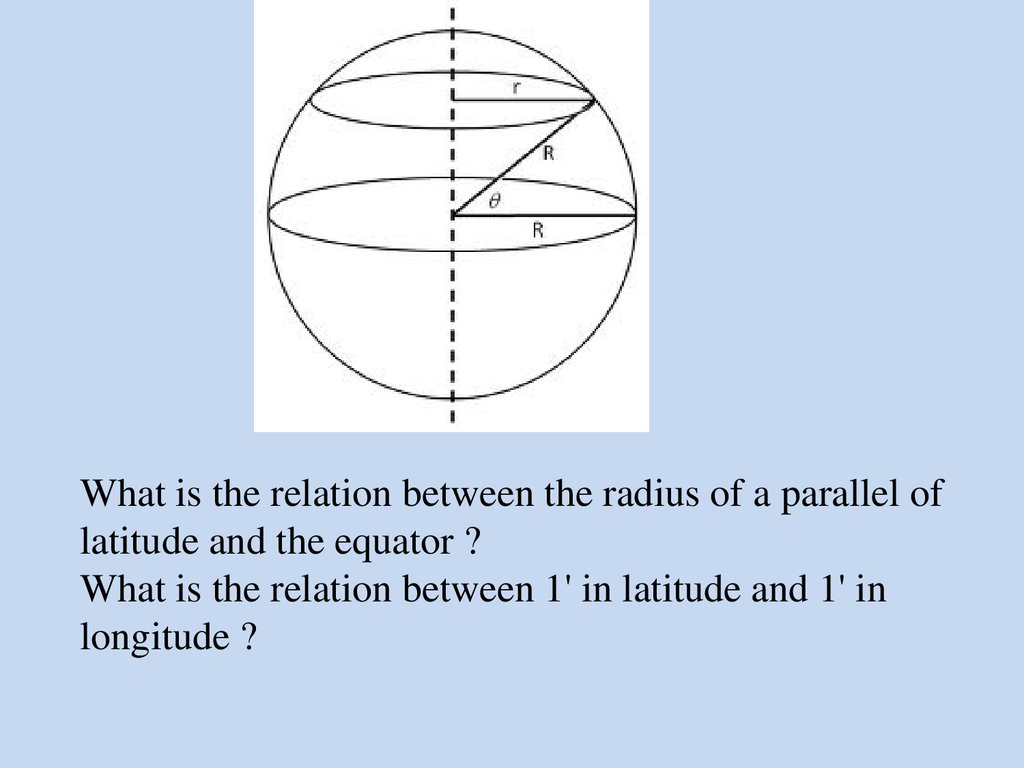
13.
What is the relation between the radius of a parallel oflatitude and the equator ?
What is the relation between 1' in latitude and 1' in
longitude ?
14.
cylindrical projection15.
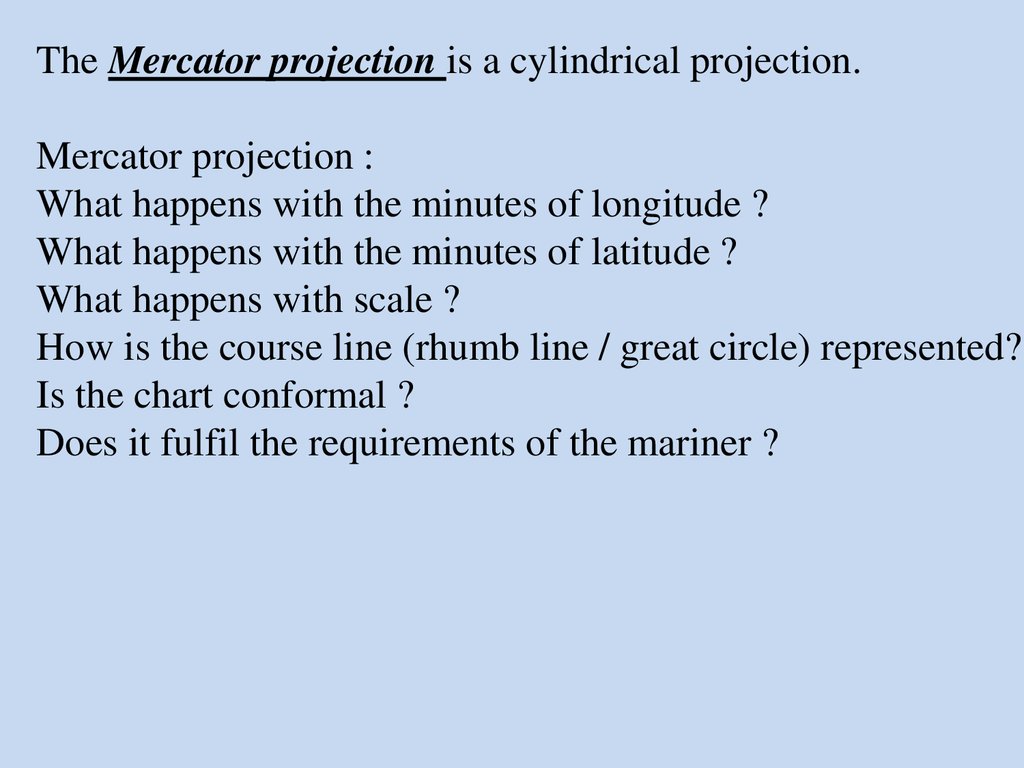
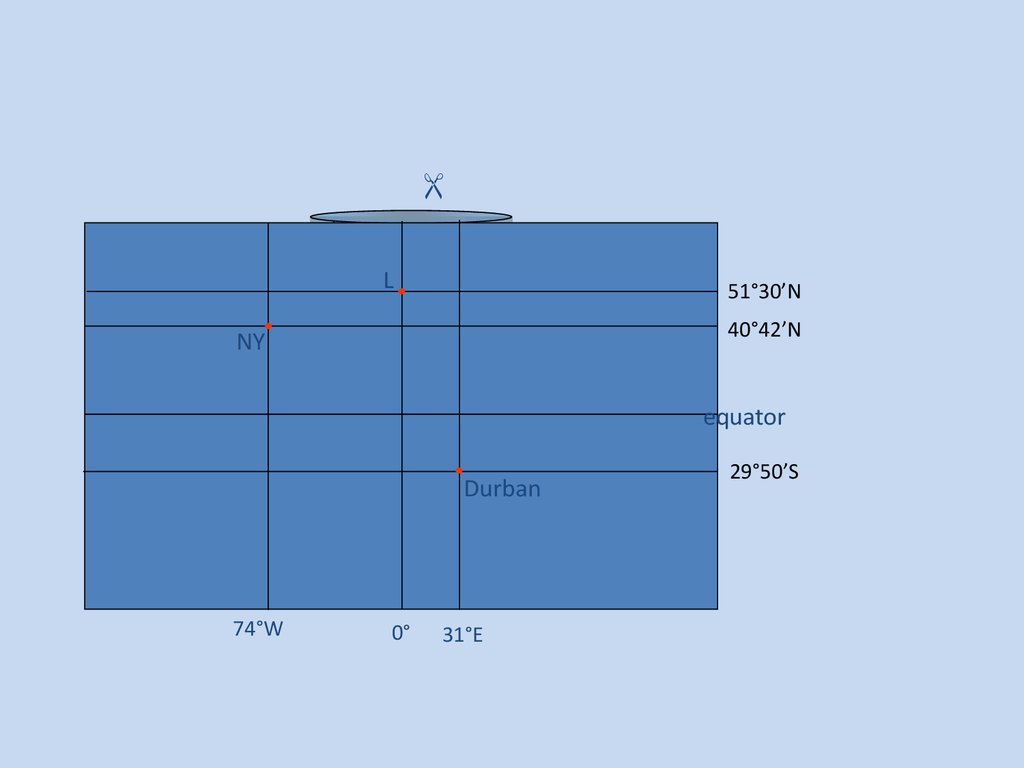
The Mercator projection is a cylindrical projection.Mercator projection :
What happens with the minutes of longitude ?
What happens with the minutes of latitude ?
What happens with scale ?
How is the course line (rhumb line / great circle) represented?
Is the chart conformal ?
Does it fulfil the requirements of the mariner ?
16.
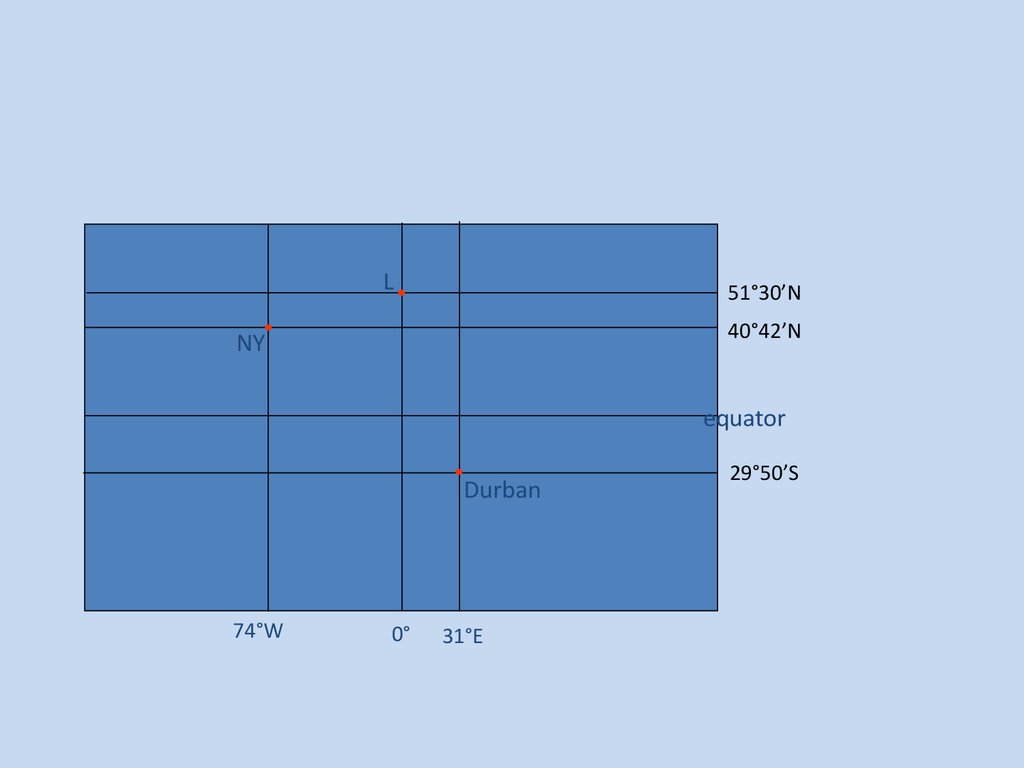
L51°30’N
40°42’N
NY
equator
Durban
74°W
0°
31°E
29°50’S
17.
L51°30’N
40°42’N
NY
equator
Durban
74°W
0°
31°E
29°50’S
18.
L51°30’N
40°42’N
NY
equator
rhumblines
Durban
74°W
0°
31°E
29°50’S
19.
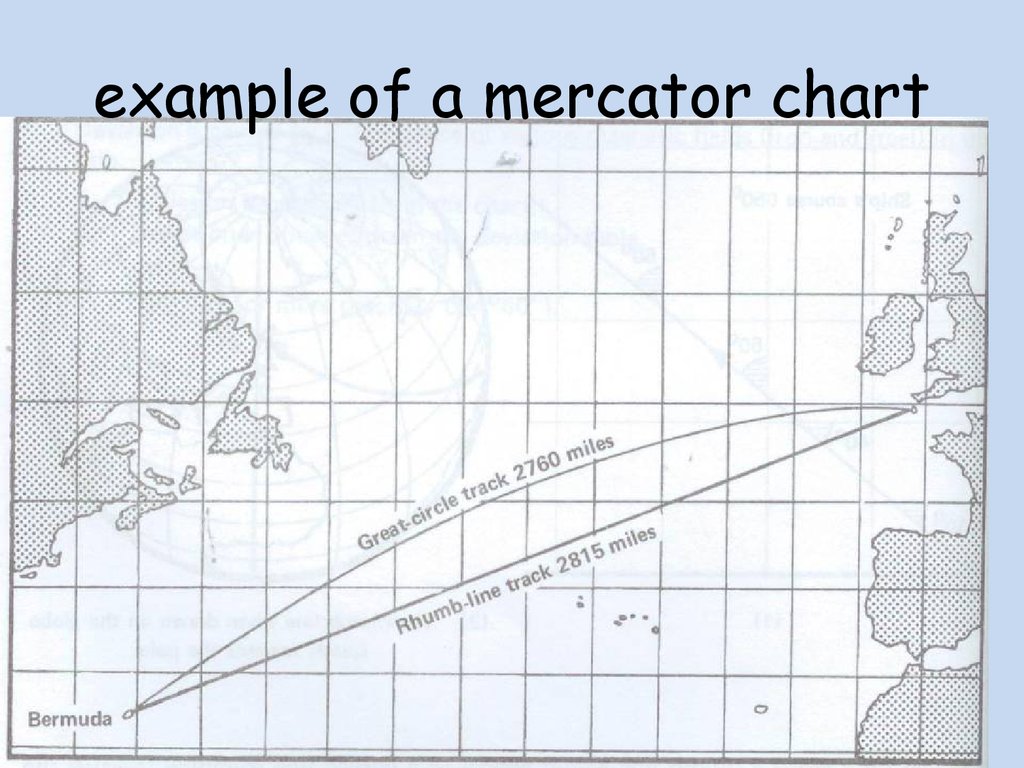
example of a mercator chart20.
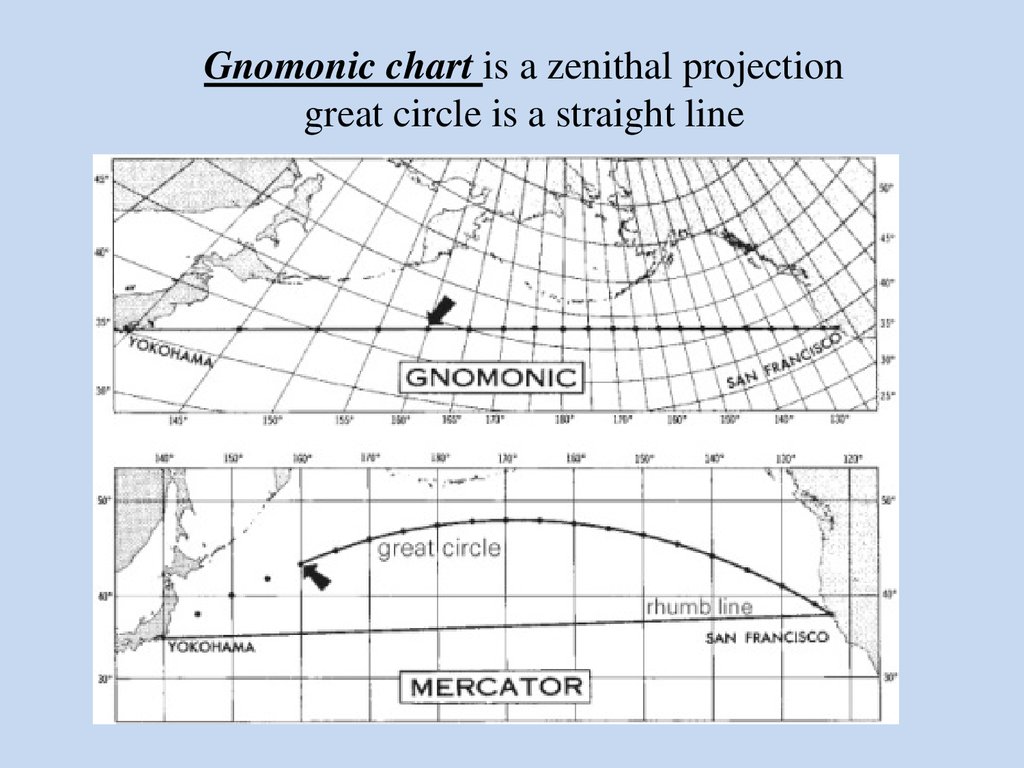
Zenithal projectionPn
1. all great circles
straight lines
2. no conformity
L
NY
Ps
only useful to plot the
shortest track
21.
Gnomonic chart is a zenithal projectiongreat circle is a straight line
22.
Conical projectionPn
Ps
eg conical
projection of
Lambert Gauss
23.
Lambert Gauss is a conical projectionproperties :
- conformal
- great circles are straight lines
- parallels are circles
- rhumbline not a straight line
used e.g. in air navigation
24.
part of a conicalprojection
25.
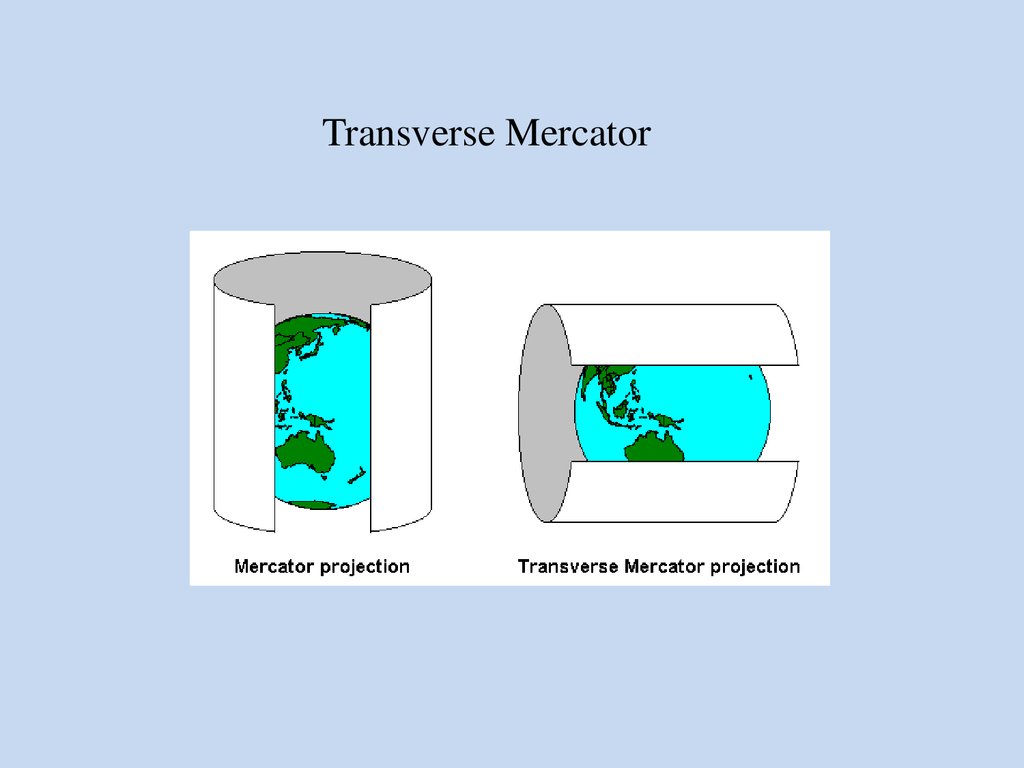
Transverse Mercator26.
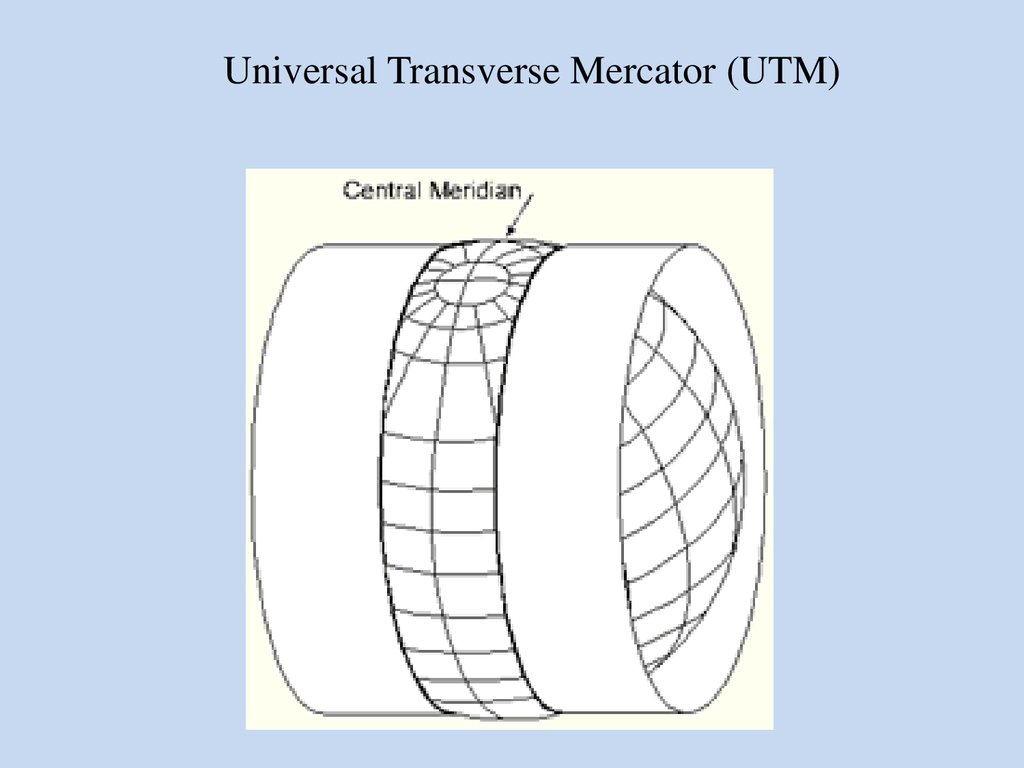
Universal Transverse Mercator (UTM)27.
28.
29.
Universele Transversale Mercator (UTM)Properties :
- rhumbline is not a straight line
- conformal
- scale change is large
Used in Offshore