


 Экономика
Похожие презентации:


")

Demand assessment elementary methods
1.
Demand assessmentelementary methods
1
2.
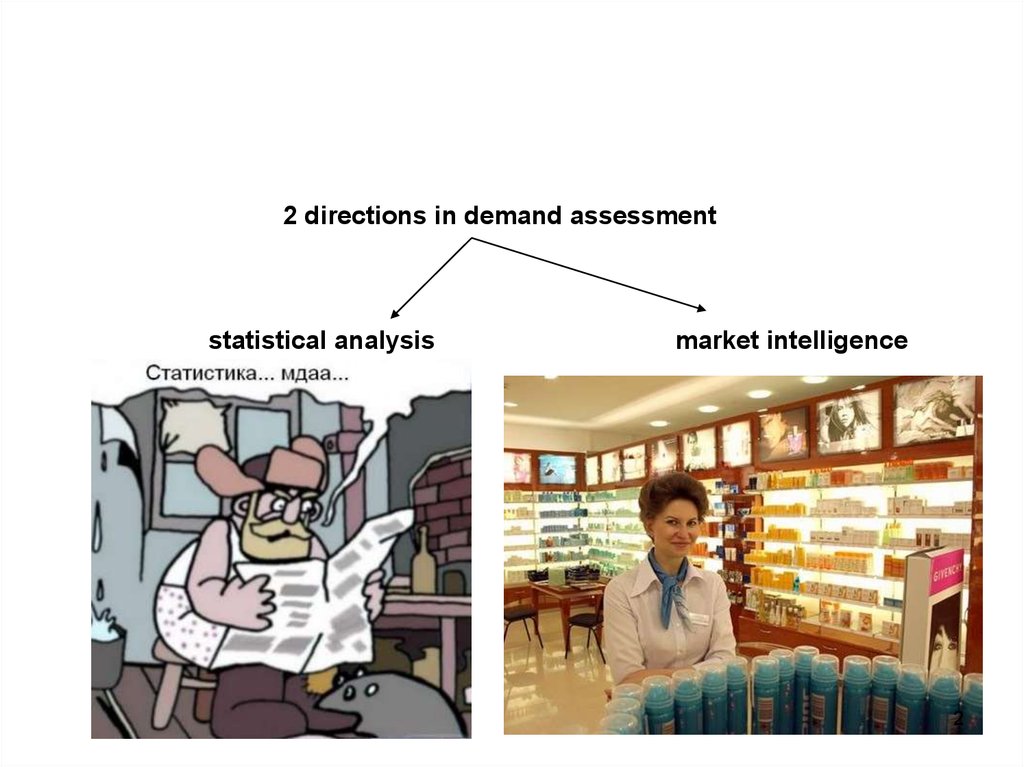
2 directions in demand assessmentstatistical analysis
market intelligence
При
Задача
отсутствии
статистического
надежной
экспериментальной
анализа: определение
информации
параметров необходимо
функции спроса
предпринять
посредствомисследование
использования
рынка
эмпирических данных
2
3.
Statistical analysisSteps:
1) Collection, validation and
assessment of data
2) The choice of the information curve
3) Verification and evaluation of the
selected curve
3
4.
Statistical analysis1) Collection, validation and
assessment of data
time series
cross-sectional data
4
5.
Statistical analysis1) Collection, validation and assessment of data
time series
Examine time changes in the demand for certain types of goods
or services and the corresponding time changes in pricing,
sales volume and other independent variables that affect the
demand
5
6.
time seriesLong time period
Adjustment of necessary information
in order to avoid effects such as inflation
Deflationary correction: divide all nominal figures by the consumer
price index and multiplied by 100. Get "regular money" base
period
And also it is necessary to take into account changes in
population, accounting for seasonal and cyclical fluctuations
6
7.
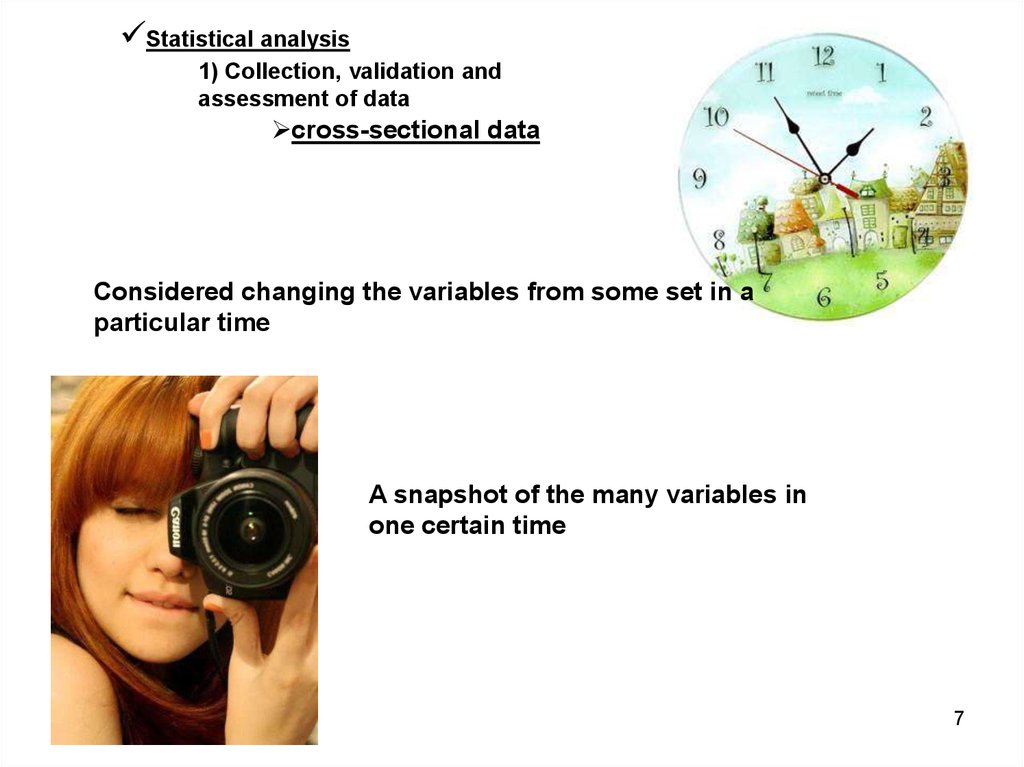
Statistical analysis1) Collection, validation and
assessment of data
cross-sectional data
Considered changing the variables from some set in a
particular time
A snapshot of the many variables in
one certain time
7
8.
Ex: In order to determine the effect of prices ondemand, as a variable can be selected volume of
sales for a particular month,
while the set may include a list of firms producing the
product
8
9.
Statistical analysis2) The choice of the information curve
The results of the observations are used to
estimate the parameters of demand function
This function can then be used to predict values for the
dependent variable for known values of the independent
variables
9
10.
When choosing a curve there are two main questions:1. What type of equation it is necessary to use?
2. How the selected function fits and predicts the
demand?
The choice of the equation depends on two conditions:
а) the number of independent variables and б) the distribution of
the data, i.e. linear or nonlinear distribution
10
11.
If the trend of the experimental values of the dependentvariable is approximately linear, and there are many
independent variables, the estimated equation is:
constant value
The coefficients of the
independent variables
˄
Q
b
b
X
b
X
...
b
X
0
1
1
2
2
X
X
The estimated demand
for the product
The value of the independent
variable
11
12.
If the data can be reduced to a single independent variable (e.g. price)and the trend is almost linear than to find the formula for this straight
line we can use simple (pair) regression analysis
The equation thus is:
A constant value (which determines the point of
intersection of the graph of the function with the Y
axis)
QX a bP
x
The quantity X,
(dependent variable)
The unit price of X
(independent variable)
The regression coefficient for Px
(defining the slope of a line on the graph
of a function)
12
13.
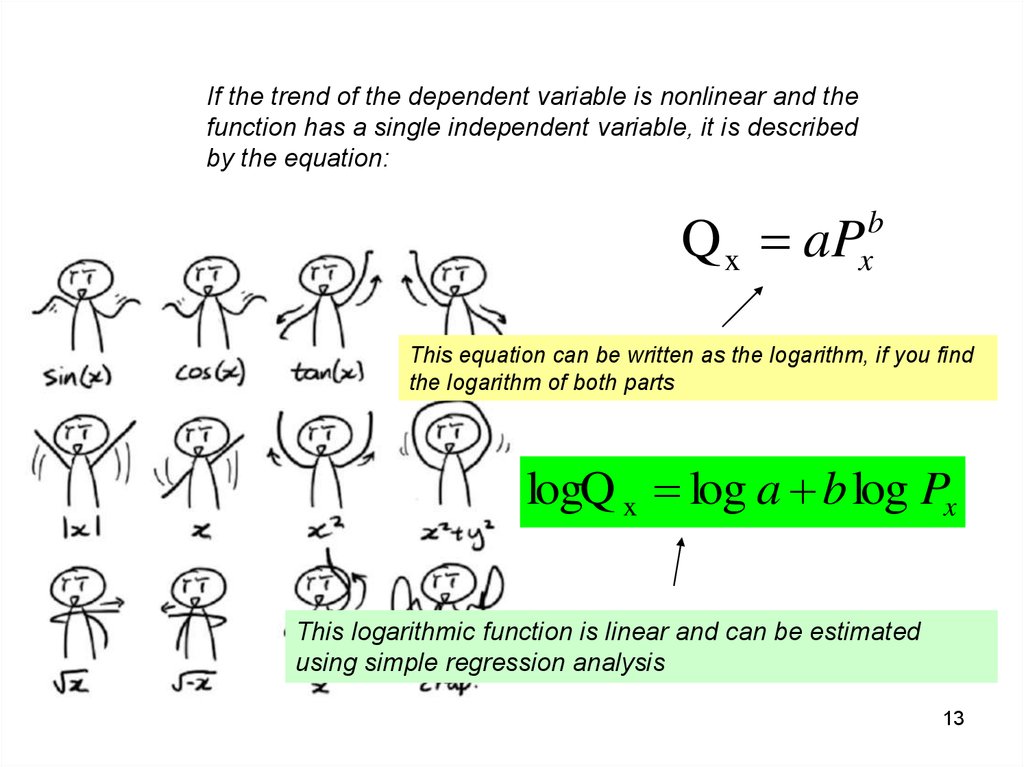
If the trend of the dependent variable is nonlinear and thefunction has a single independent variable, it is described
by the equation:
Q x aP
b
x
This equation can be written as the logarithm, if you find
the logarithm of both parts
logQ x log a b log Px
This logarithmic function is linear and can be estimated
using simple regression analysis
13
14.
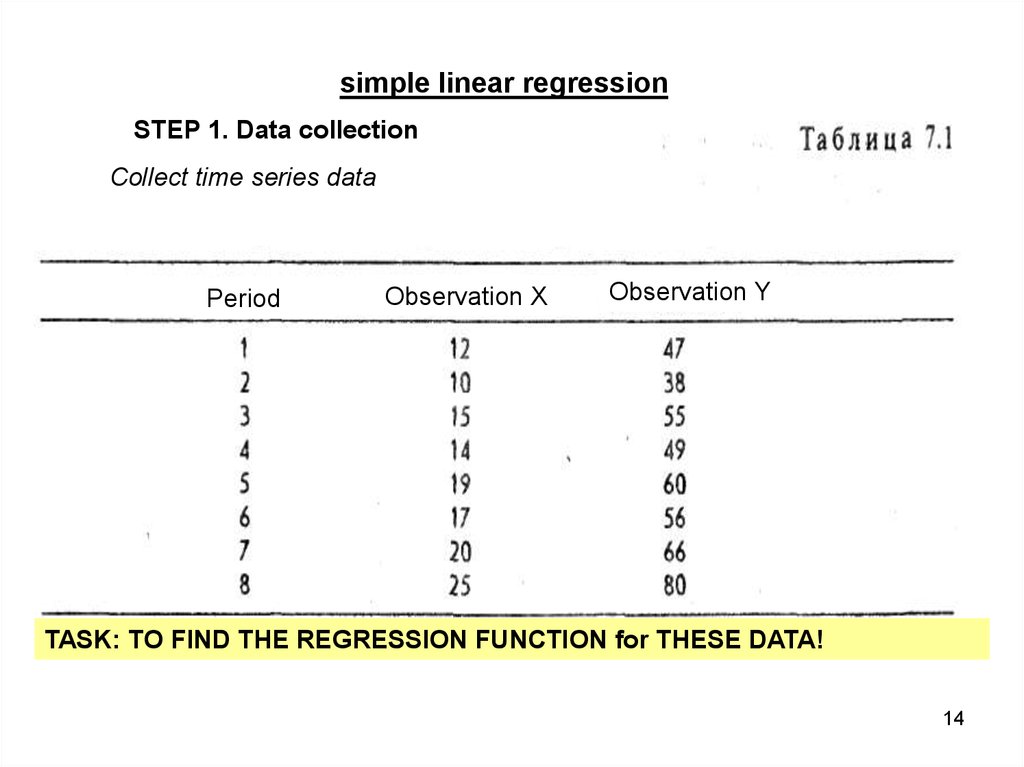
simple linear regressionSTEP 1. Data collection
Collect time series data
Period
Observation X
Observation Y
TASK: TO FIND THE REGRESSION FUNCTION for THESE DATA!
14
15.
simple linear regressionSTEP 2. Organization variables in time
There is a direct relationship between X and Y,
Причины: визуализация;
определение
линейности
with an increase of
X, Y also increases
and if или нелинейности
для выбора
соответствующей
формы кривой
X falls,
Y falls too
X
and
Y
There are no obvious links of the lag-lead between them
(no need to move forward or back in time)
the trend, allocated to each
series, is linear
Period
15
16.
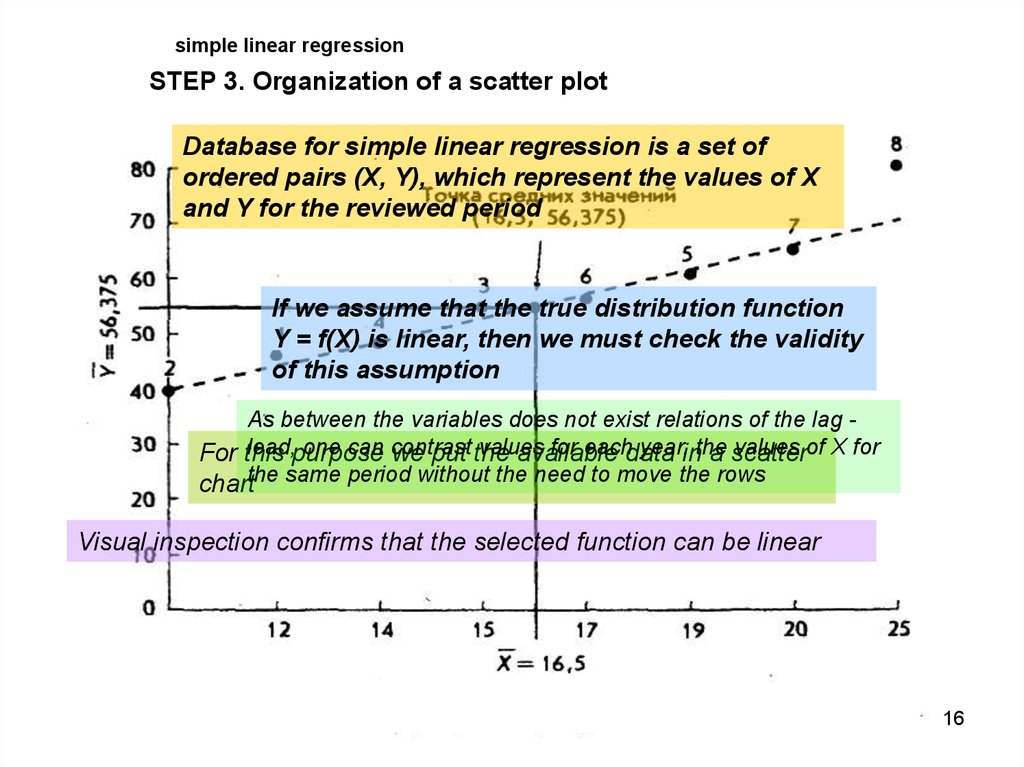
simple linear regressionSTEP 3. Organization of a scatter plot
Database for simple linear regression is a set of
ordered pairs (X, Y), which represent the values of X
and Y for the reviewed period
If we assume that the true distribution function
Y = f(X) is linear, then we must check the validity
of this assumption
As between the variables does not exist relations of the lag lead,purpose
one can contrast
values
for eachdata
year,inthe
values of X for
For this
we put the
available
a scatter
chartthe same period without the need to move the rows
Visual inspection confirms that the selected function can be linear
16
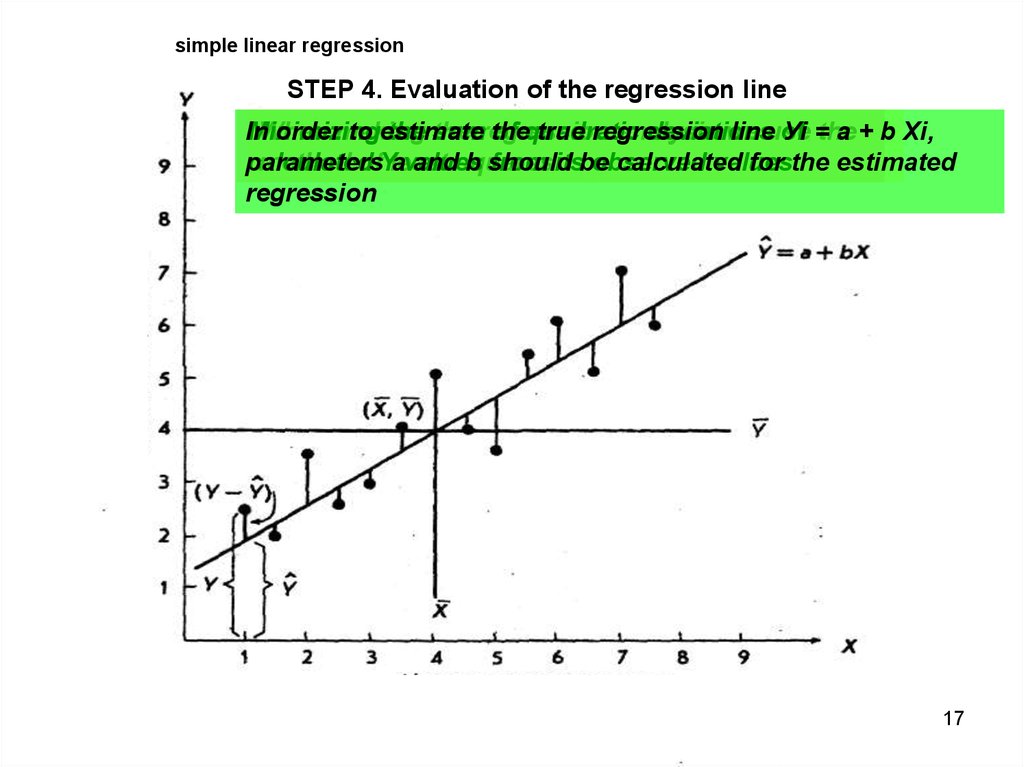
17.
simple linear regressionSTEP 4. Evaluation of the regression line
In
Minimizing
When
ordermaking
to estimate
the the
sumregression
the
of quadratic
true regression
analysis
deviations
we
lineuse
of
Уi =the
а + b Хi,
parameters
calculated
method ofYleast
avalues
andsquares
b should
from itsbe
observed
calculated
values
for the estimated
regression
17
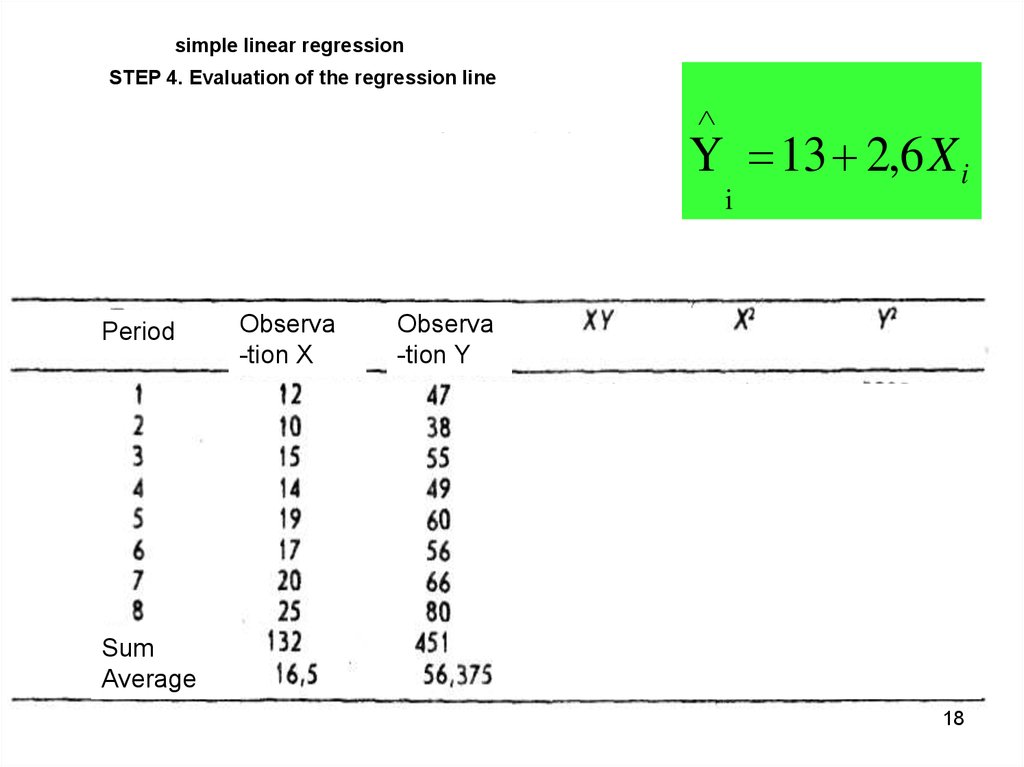
18.
simple linear regressionSTEP 4. Evaluation of the regression line
Y 13 2,6 X i
i
Period
Observa
Observa
-tion
-tionXX
Observa
-tion Y
Sum
Average
18
19.
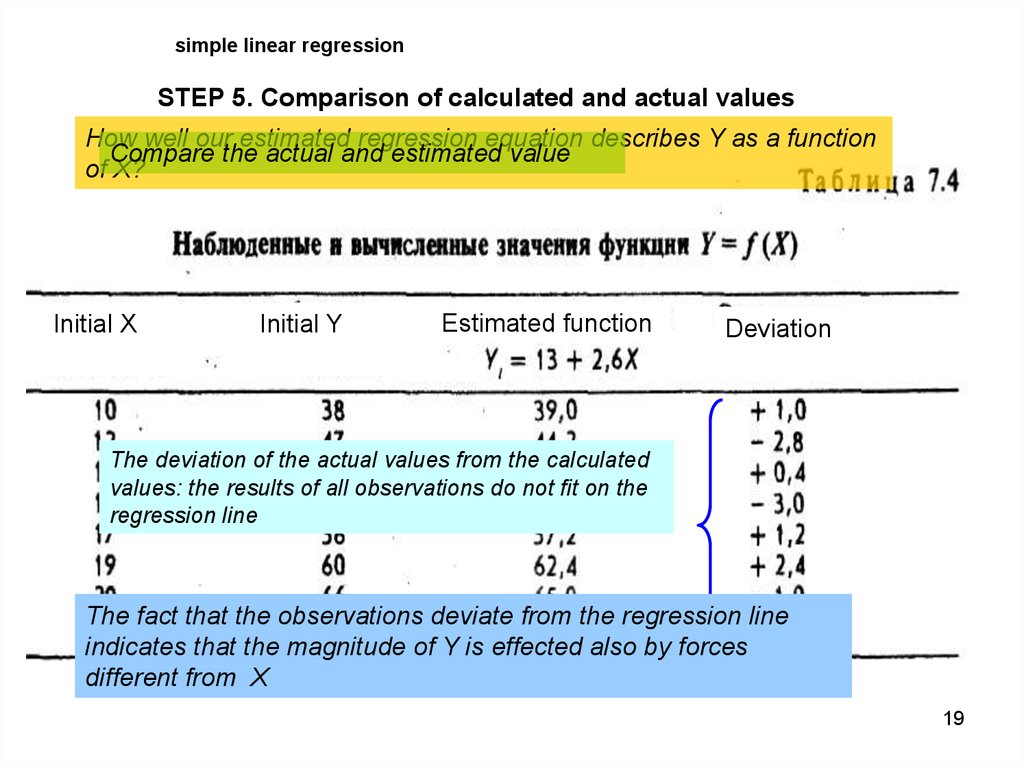
simple linear regressionSTEP 5. Comparison of calculated and actual values
How well our estimated regression equation describes Y as a function
Compare the actual and estimated value
of X?
Initial X
Initial Y
Estimated function
Deviation
The deviation of the actual values from the calculated
values: the results of all observations do not fit on the
regression line
The fact that the observations deviate from the regression line
indicates that the magnitude of Y is effected also by forces
different from X
19
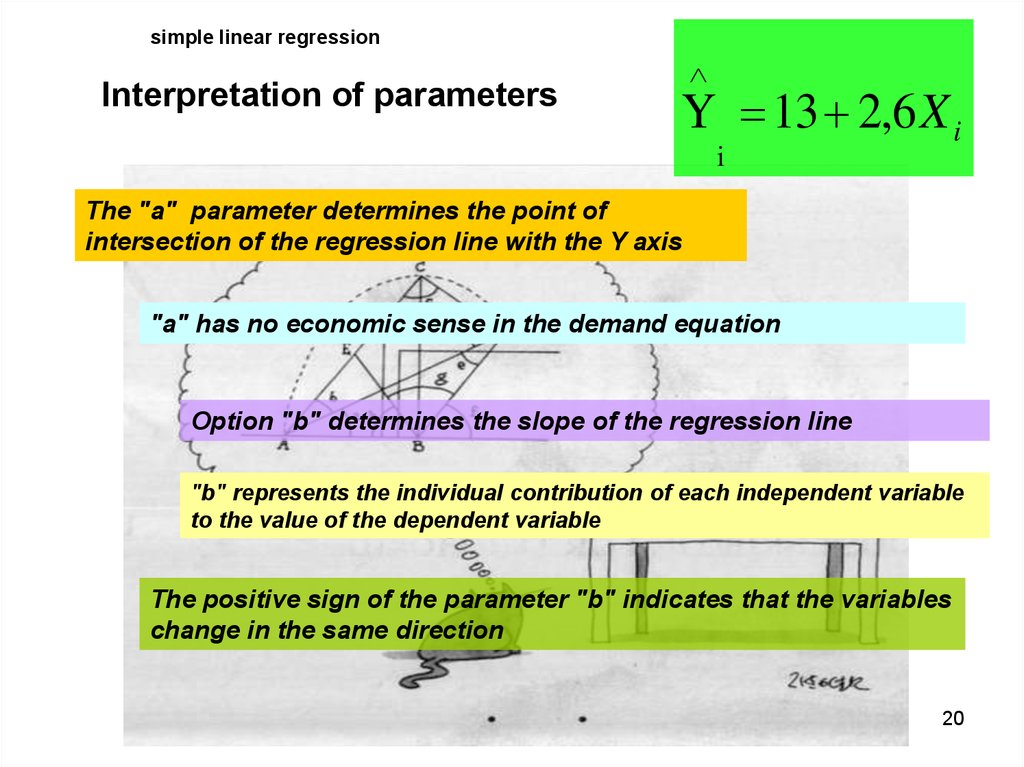
20.
simple linear regressionInterpretation of parameters
Y 13 2,6 X i
i
The "a" parameter determines the point of
intersection of the regression line with the Y axis
"a" has no economic sense in the demand equation
Option "b" determines the slope of the regression line
"b" represents the individual contribution of each independent variable
to the value of the dependent variable
The positive sign of the parameter "b" indicates that the variables
change in the same direction
20
21.
simple linear regressionEvaluation of the regression equation
The goal of linear regression evaluation: to get a linear equation, which can be used to
determine the values of the independent variable Y on any existing values of the
independent variable X
˄
How informative or accurate the determined Y is?
When analyzing simple regression use two statistical
indicators:
The root - mean - square error of the estimation, Se;
The coefficient of determination, r^2, and its square
root, r, which is called the correlation coefficient.
21
22.
1) The root – mean - square error of the estimation, Se;Represents the deviation of experimental points from the
estimated regression line (determines the variance of random
Y values)
22
23.
1) The root - mean - square error of the estimation, Se;Observed Y for Xi
Evaluated Y for Xi
˄ 2
(Y
Y
i
i)
S
e
n k 1
Root-mean-square error
Number of observations
Number of independent
variables
23
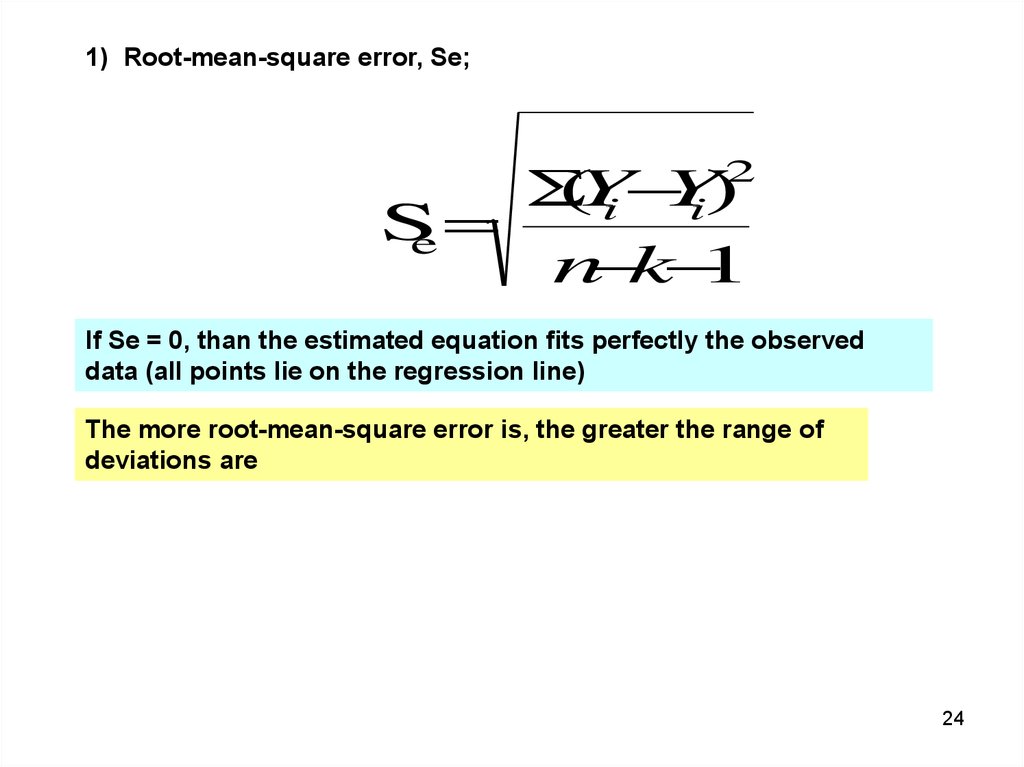
24.
1) Root-mean-square error, Se;(Y
Y
i
i)
S
e
n k 1
2
If Se = 0, than the estimated equation fits perfectly the observed
data (all points lie on the regression line)
The more root-mean-square error is, the greater the range of
deviations are
24
25.
2) coefficient of determination, r^2Shows how well the regression model describes the variation
of the dependent variable
ЕХ: if r^2 = 0,975, than approximately 97.5% of the
changes in the dependent variable explained by the
variation of the independent variable X
Values can range from 0 to 1 or from 0 to 100%
0 - there is no relationship between the variables,
1 - the regression line is perfect (all changes are explained
by changes in X)
25
26.
3) the correlation coefficient, r,Determines the degree of connection between variables
-1 < r > 1
26