


 Информатика
Похожие презентации:


 — Chapter 1 — Farid Feyzi")

Things you need
1. Qlikview 11 Workshop
WITH ECRAFT DATA FROM SPECIAL LECTURE SEP 2015RALF REHN
2. The target of the Workshop
To create a data model using the training material from the ECraft lecture(EXTRACT)
5 Excel files
To have the system create necessary relations
To enhance analyzing by creating new fields (TRANSFORM)
Year
Month
To create some analyzing objects
To answer some business questions
3. Things you need
Download from Moodle the filesSalesdata
Customers
Customeraddress
Division
Region
In Moodle also the corrected files
Customers_corrected
Customeradress_corrected
4. 1. Create a Qlikview 11 file
Locate Qlikview 11 on the computerand start it
File – New
Abort the wizard by Cancel
You have a empty Qlikview file
File – Save – give a location and name
5. 3. Extract the files into Qlikview
3.a File - Edit Script3.b Choose Table files – Locate file - Open
3.c Check the settings depending on file and file structure
Excel file
Labels – Embeddes labels (means first row headers)
3.d Either Finish or go thru next screens by Next until end
3.e Note the SQL statement in the script
3.f Rename the datasource by adding a row affer Directory end the name by : - example
Salesdata:
3.g Exit Edit script with Ok, IMPORTANT! before loading data FILE - SAVE
3.h Read the datasource into memory by File – Reload
Check the your data model by File – Table Viewer
Repeat for all files
6. 3.a Editing the script
File - Edit ScriptEnsure the cursor is on a empty row
like in the picture
Choose Table files – Locate file – Open
to add a new datasource to the model
7. 3.c Check the settings
Check the settings depending on fileand file structure
- Excel file
- Labels – Embeddes labels (means first row
headers)
Either Finish or go thru next screens by Next until end
NOTE: Files Region and Division
need change in settings to Embedded Labels
8. 3.e Note the SQL statement in the script
The script contains now the instructionsFor reading the data from the source
The script can be altered to do
Transformations on data
9. 3.f Rename the datasource
Rename the datasourceby adding a row after Directory
End the name by :
-
example Salesdata:
This is done to easier identify the
source when working with the model
10. 3.g Save File before contnuing
Exit Edit script with OkIMPORTANT!
before loading data FILE – SAVE
(If there is errors in script you could loose the changes since last Save)
11. 43.h Load the data and check the data model
Read the datasources into memory (actually executes the script!)by File – Reload
Check your data model
by File – Table Viewer
12. 4. The Data model after all files loaded
Qlikview created automatically the releationshipsbased on common field names
However as Salesdata and Customer do not have
a common field No relation created
We need to edit the script
13. 5. Relate Salesdata and Customers
From Tuukka Sarkkis presentation material14. 6. Edit Script, Save ,Reload and check model again
15. 7. Add new calculated fields
From Tuukka Sarkkis presentation material16. 8. Change the script
Note this is standard SQL query lanquage check forinstance out http://www.w3schools.com/sql/
17. 9. The datamodel is ready
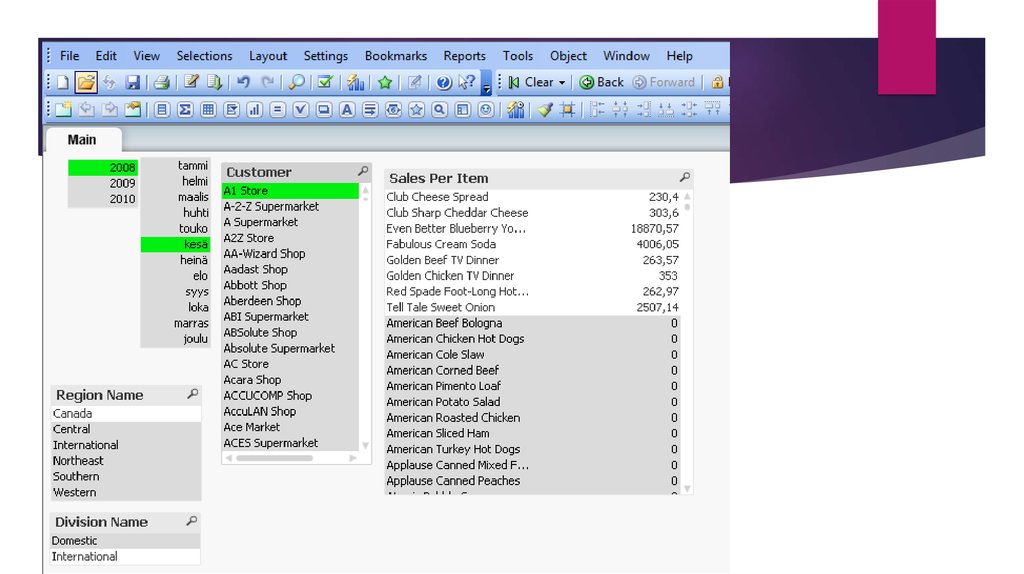
After Save and Reload18. The business question
How much hasThe Customer ”A1 Store”
bought
In June 2008
of Item ”Even Better Blueberry Yogurt”
??
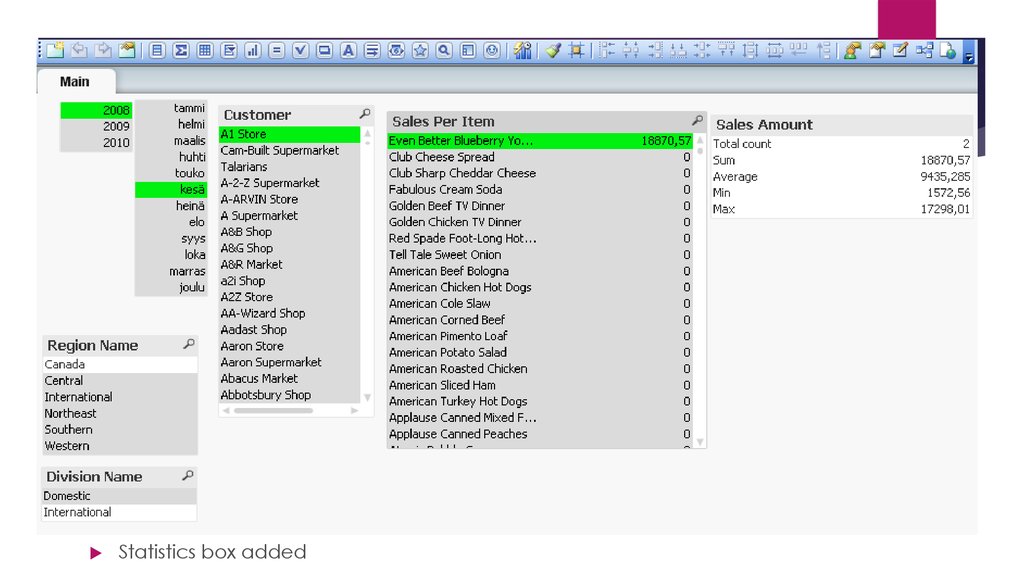
Answer = Even Better Blueberry Yogurt 18870,57
19. 10. Analyzing the data
Add objects to the sheetAdd sheets if wanted
Save in between
You can reset all filters with
Clear in the ment
20. 10. Analyzing the data
From Tuukka Sarkkis presentation material21. 10. Calendar options created
22. 10. Create Item/sales amount
Right click on Sheet – choose New Sheet Object – ListboxTab General
Title ”Sales per Item”
In Field choose Item
Tab Expressions
Add
Create formula sum([Sales Amount])
Press Ok
Tab Number
Coose format Money
Ok and resize object
23. 10. Add Customer , Region name , Division name
Leave the captionMove and resize objects
24.
25.
Statistics box added26. Reloading corrected files
SaveLocate correct files and change the reference in the script
Regards to Customer
Regards to Customeraddress
The reload and if Ok then Save !
27. 11. Correct the reference
28. Additional Questions
What products where sold the most in 2009? (Value)What Customer bought the most in 2008? (Value)
29. Qlikview 11 Workshop
WITH ECRAFT DATA FROM SPECIAL LECTURE SEP 2015RALF REHN