


 Финансы
 Английский язык
Похожие презентации:


")


Analysis of the formation and execution of the state budget of the republic of Kazakhstan
1. Diploma Project
“ANALYSIS OF THE FORMATION AND EXECUTIONOF THE STATE BUDGET OF THE REPUBLIC OF
KAZAKHSTAN”
Prepared by:
Kuttykadam Nuriya - Finance 331
Ibadullayev Adilet - Accounting and Audit 442
Yerlanuly Serzhan - Accounting and Audit 442
Sabirzhanova Diana -Finance 441
1
2.
Customer:Ministry of Finance of the Republic of Kazakhstan
Problem:
Budget deficit in the Republic of Kazakhstan
Hypothesis:
Reduction of state deficit by stabilizing of state revenues
and expenses.
2
3. Aim and tasks of Diploma Project
Aim:• Identify ways of reducing the budget deficit through
the optimization of state revenues and expenses.
Tasks:
• Study theoretical aspects of the state budget
• Review the budget status in the current position
• Offer recommendations to improve the efficiency of
the state budget
3
4. Figure 1. Deficit of the state budget, 2015,million tenge
10,000,000.08,000,000.0
7,711,229.0
7,322,024.7
8,430,909.2
8,388,223.4
6,000,000.0
4,000,000.0
Plan
Fact
2,000,000.0
-1,348,188.6
-915,704.8
0.0
-2,000,000.0
Revenues
Expenses
Deficit
5. Figure 2. The volume of the state budget, million tenge
10,000,000.08,000,000.0
6,000,000.0
Revenues
4,000,000.0
Expenses
Deficit
2,000,000.0
-915,704.8
0.0
-568,618.5
-890,308.7
2011
2012
-2,000,000.0
-700,927.8
2013
-1,086,670.4
2014
2015
5
6. Figure 3. The volume of the state budget, % to GDP
25%25%
20%
20%
20%20%
19%
19%
21%
21%
19%
19%
19%
19%
18%
18%
20%
20%
20%
20%
19%
19%
19%
19%
15%
15%
10%
10%
5%
5%
2%
2%
0%
0%
2011
2011
3%
3%
2012
2012
Revenue % to GDP
Revenue % to GDP
2%
3%
3%
2%
2%
2014
2015
2%
2013
2013
Expenses % to GDP
Expenses % to GDP
2014
Deficit % to GDP
Deficit % to GDP
2015
6
7. Figure 4. Revenues of the state budget, million tenge
120.00%100.00%
22.34%
80.00%
0.93%
2.58%
23.74%
0.90%
4.91%
22.02%
0.88%
2.22%
26.70%
0.97%
2.45%
32.17%
Transfers revenues
0.91%
2.94%
60.00%
Proceeds from the sale of fixed
assets
Non-tax revenues
40.00%
74.15%
70.45%
74.88%
69.88%
63.97%
Tax revenues
20.00%
0.00%
2011
2012
2013
2014
2015
7
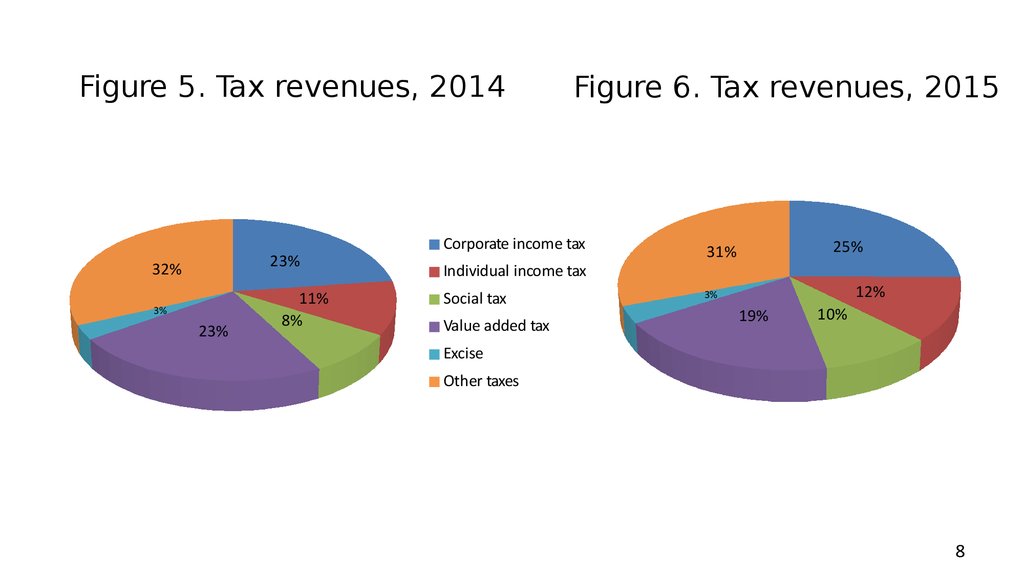
8.
Figure 5. Tax revenues, 201423%
32%
3%
23%
11%
8%
Figure 6. Tax revenues, 2015
Corporate income tax
Individual income tax
Social tax
Value added tax
25%
31%
12%
3%
19%
10%
Excise
Other taxes
8
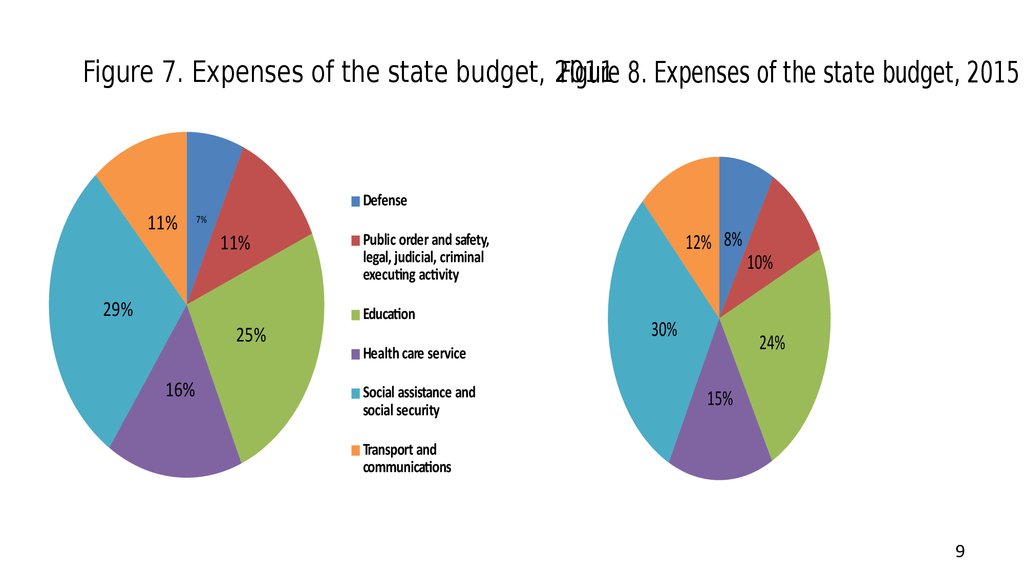
9.
Figure 7. Expenses of the state budget, 2011Figure 8. Expenses of the state budget, 2015
11%
29%
Defense
7%
11%
25%
16%
12% 8%
Public order and safety,
legal, judicial, criminal
executing activity
Education
30%
24%
Health care service
Social assistance and
social security
10%
15%
Transport and
communications
9
10. Recommendations:
• Monitoring and regulation of tax policy.• Targeted use of budgetary funds.
• Attraction of long – term loan from World Bank.
10