


 Экономика
Похожие презентации:


Forecast combinations
1.
Forecast CombinationsJoint Vienna Institute/ IMF ICD
Macro-econometric Forecasting and Analysis
JV16.12, L09, Vienna, Austria, May 24, 2016
Presenter
Mikhail Pranovich
This training material is the property of the International Monetary Fund (IMF) and is intended for use in
IMF’s Institute for Capacity development (ICD) courses. Any reuse requires the permission of ICD.
2.
Lecture Objectives• Introduce the idea and rationale for forecast averaging
• Identify forecast averaging implementation issues
• Become familiar with a number of forecast averaging
schemes
2
3.
ntroduction• Usually, multiple forecasts are available to decision makers
• Differences in forecasts reflect:
• differences in subjective priors
• differences in modeling approaches
• differences in private information
• It is hard to indentify the true DGP
• should we use a single forecast or an “average” of forecasts?
3
4.
ntroduction• Disadvantages of using a single forecasting model:
• may contain misspecifications of an unknown form
• e.g., some variables are missing
• one statistical model is unlikely to dominate all its rivals at all
points of the forecast horizon
• Combining separate forecasts offers :
• a simple way of building a complex, more flexible forecasting
model to explain the data
• some insurance against “breaks” or other non-stationarities that
may occur in the future
4
5.
Outline of the lecture1.
What is a combination of forecasts?
2.
The theoretical problem and implementation issues
3.
Methods to assign weights
4.
Improving the estimates of the theoretical model
performance
5.
Conclusion – Key Takeaways
5
6.
Part I.What is a combination of
forecasts?
General framework and notation
The forecast combination problem
Issues and clarifications
6
7.
General framework• Today (at time T) we want to forecast the value ofyT h (at T+h)
• We have M different forecasts:
model-based (econometric model, or DSGE), or judgmental
(consensus forecasts)
the model(s) or judgment(s) are our own or of others
some models or information sets might be unknown: only the end
product – forecasts – are available
• How to combine M forecasts into one forecast?
• Is there any advantage in combining vs. selecting the “best”
among the M forecasts?
7
8.
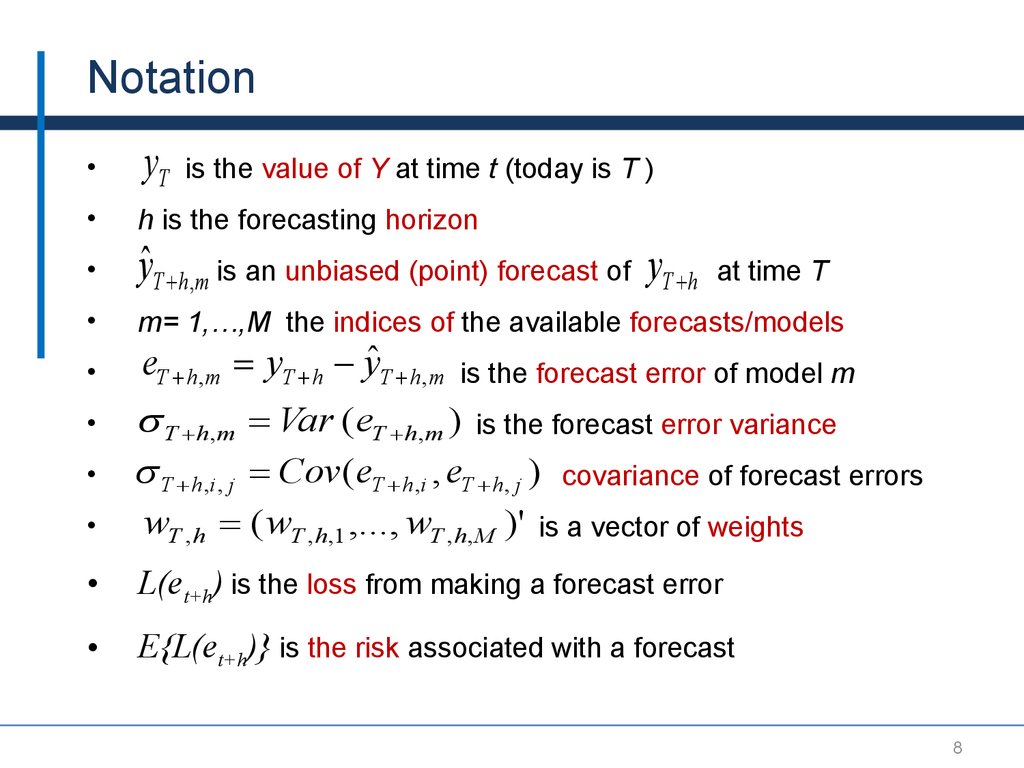
NotationyT
h is the forecasting horizon
yˆT h,m is an unbiased (point) forecast of yT h
m= 1,…,M the indices of the available forecasts/models
is the value of Y at time t (today is T )
at time T
eT h,m yT h yˆT h ,m is the forecast error of model m
T h ,m Var (eT h ,m ) is the forecast error variance
T h ,i , j Cov (eT h ,i , eT h , j ) covariance of forecast errors
wT , h ( wT , h ,1 ,..., wT , h , M )'
L(et+h) is the loss from making a forecast error
E{L(et+h)} is the risk associated with a forecast
is a vector of weights
8
9.
Interpretation of loss function L(e)• Squared error loss (mean squared forecasting error: MSFE)
L(eT h ) (eT h ) 2
• equal loss from over/under prediction
• loss increases quadratically with the error size
• Absolute error loss (mean absolute forecasting error: MAFE)
L(eT h ) | eT h |
• equal loss from over/under prediction
• proportional to the error size
• Linex loss (γ>0 controls the aversion against positive errors,
γ<0 controls the aversion against negative errors)
L(eT h ) exp( eT h ) eT h 1
9
10.
The forecast combination problem• A combined forecast is a weighted average of M forecasts:
M
yˆTc h wT ,h ,m yˆT h ,m
m 1
• The forecast combination problem can be formally stated as:
Problem 1: Choose weights wT,h,i to minimize the loss
M
2
function E[(eTc subject
to
)
h ]
w
m 1
T ,h ,m
1
See Appendix 1 for generalization
• Note: Here we assume MSFE-loss, but it could be any other
10
11.
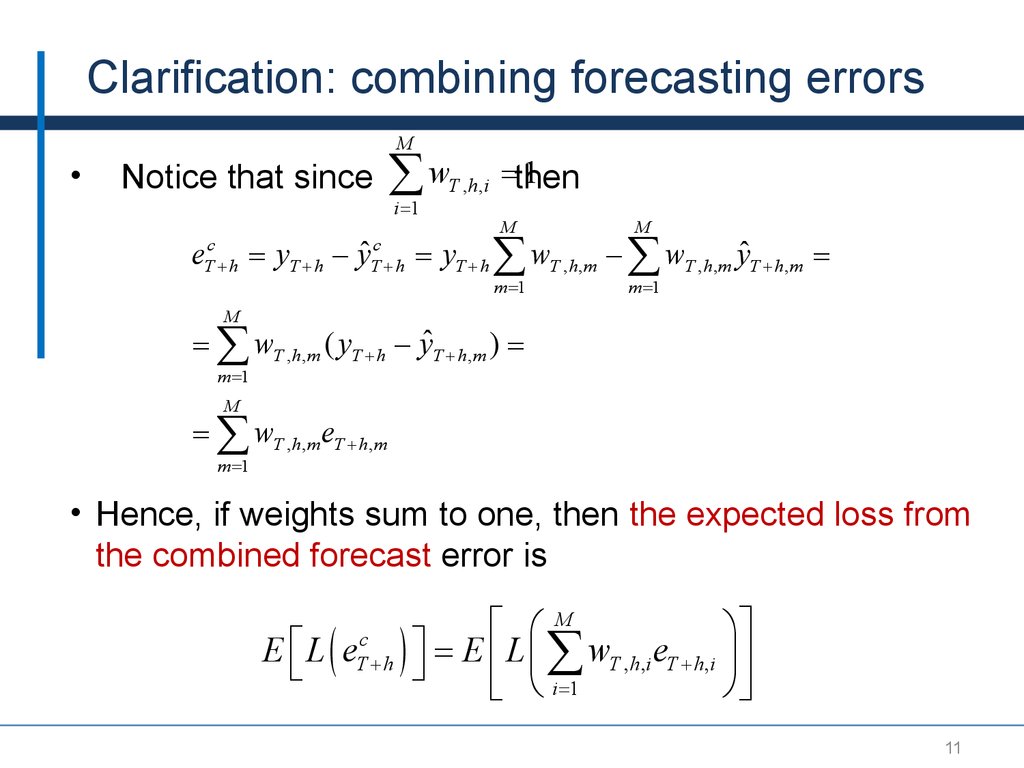
Clarification: combining forecasting errorsM
Notice that since
w
i 1
T , h ,i
then
1
M
M
m 1
m 1
eTc h yT h yˆTc h yT h wT ,h ,m wT ,h ,m yˆT h ,m
M
wT ,h ,m ( yT h yˆT h ,m )
m 1
M
wT ,h ,m eT h ,m
m 1
• Hence, if weights sum to one, then the expected loss from
the combined forecast error is
E éë L ( e
c
T h
é æM
öù
ù
) û E ê L ç wT ,h,i eT h,i ÷ ú
øû
ë è i 1
11
12.
Summary: what is the problem all about? (II)Problem 1: Choose weights wT,h,i to minimize the loss
2
function E[(eTcsubject
)
] to
h
M
w
i 1
T , h ,i
1
We want to find optimal weights (the theoretical solution to
Problem 1)
How can we estimate optimal weights from a sample of
data?
Are these estimates good?
12
13.
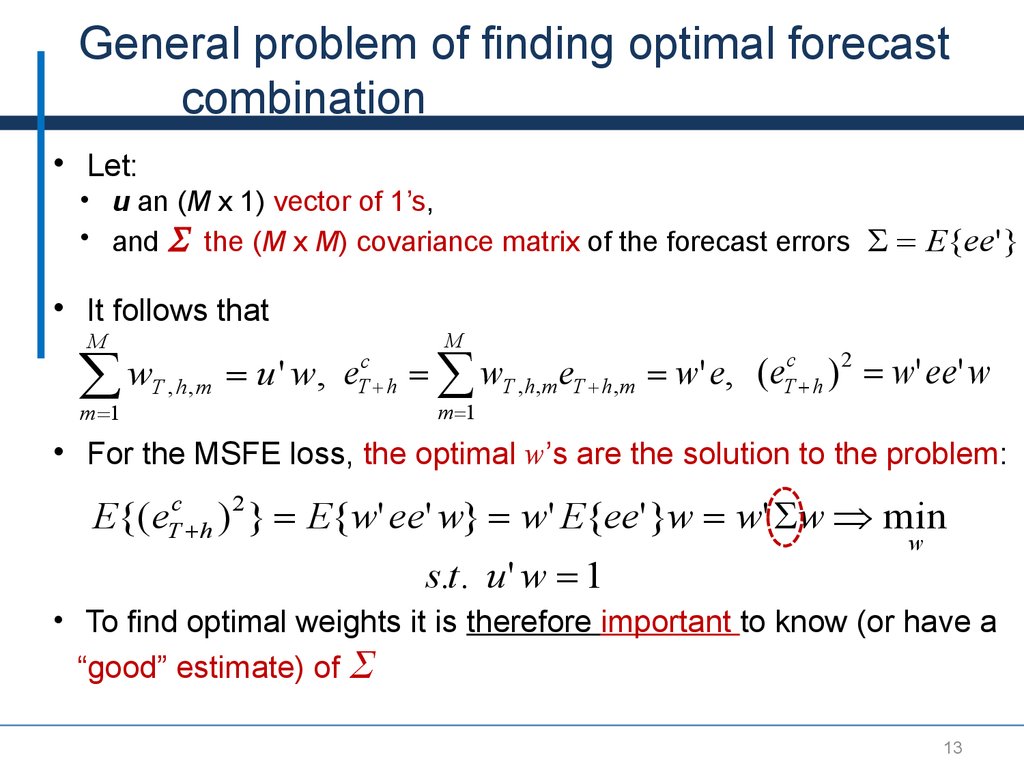
General problem of finding optimal forecastcombination
• Let:
• u an (M x 1) vector of 1’s,
• and the (M x M) covariance matrix of the forecast errors E{ee' }
• It follows that
M
wT ,h,m u ' w, e
m 1
c
T h
M
wT ,h ,m eT h ,m w' e, (eTc h ) 2 w' ee' w
m 1
• For the MSFE loss, the optimal w’s are the solution to the problem:
E{(eTc h ) 2 } E{w' ee' w} w' E{ee'}w w' w min
s.t. u ' w 1
w
• To find optimal weights it is therefore important to know (or have a
“good” estimate) of
13
14.
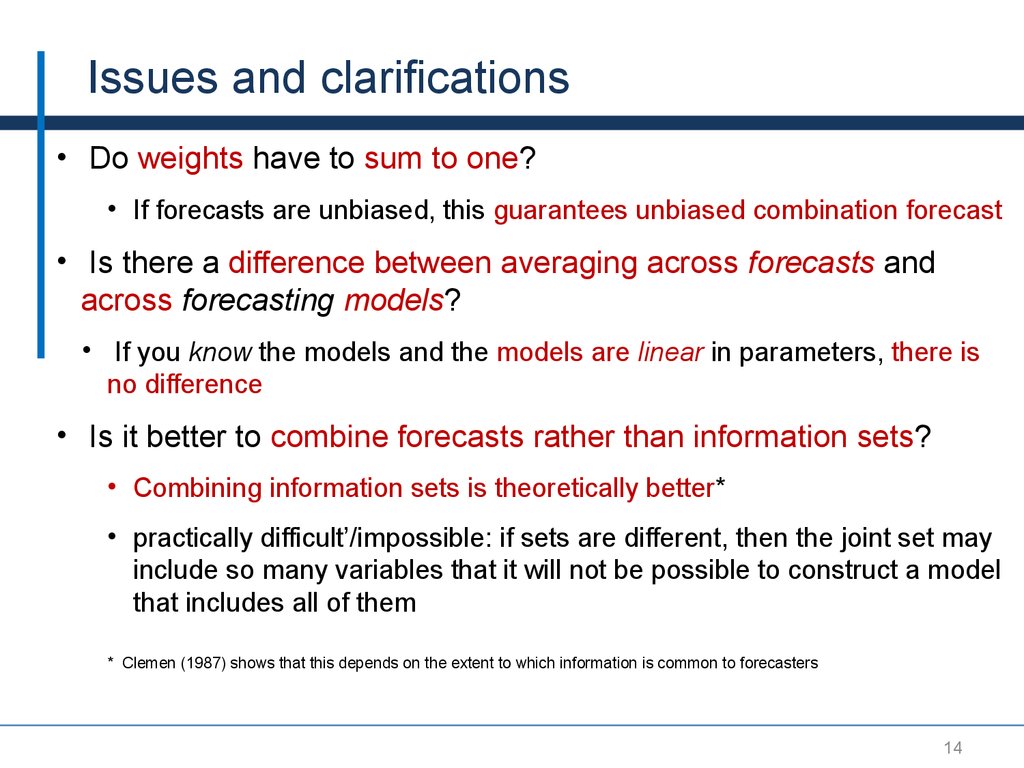
Issues and clarifications• Do weights have to sum to one?
• If forecasts are unbiased, this guarantees unbiased combination forecast
• Is there a difference between averaging across forecasts and
across forecasting models?
• If you know the models and the models are linear in parameters, there is
no difference
• Is it better to combine forecasts rather than information sets?
• Combining information sets is theoretically better*
• practically difficult’/impossible: if sets are different, then the joint set may
include so many variables that it will not be possible to construct a model
that includes all of them
* Clemen (1987) shows that this depends on the extent to which information is common to forecasters
14
15.
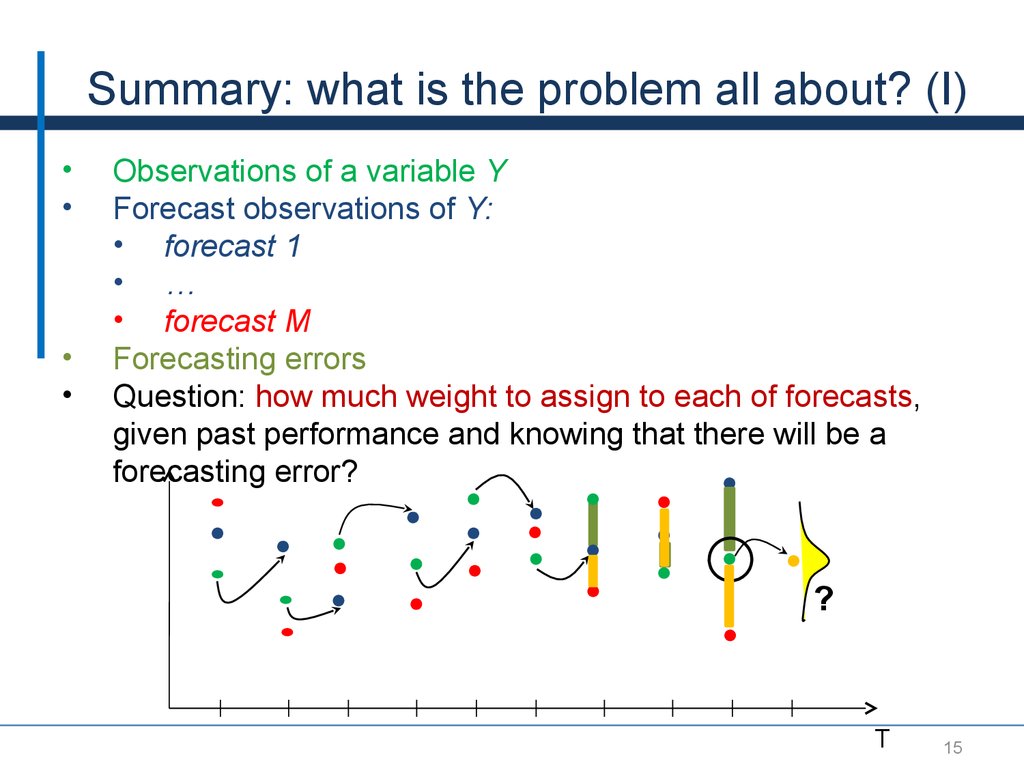
Summary: what is the problem all about? (I)Observations of a variable Y
Forecast observations of Y:
• forecast 1
• …
• forecast M
Forecasting errors
Question: how much weight to assign to each of forecasts,
given past performance and knowing that there will be a
forecasting error?
?
T
15
16.
Part II. The theoretical problemand implementation issues
A simple example with only 2 forecasts
The general N forecast framework
Issue 1: do weights sum to 1?
Issue 2: are weights constant over time?
Issue 3: are estimates of weights good?
16
17.
Optimal weights in population (M = 2)• Assume we have 2 unbiased forecasts (E(eT+h,m) = 0) and
combine:
c
yˆT h wyˆ1,T h (1 w) yˆ 2,T h
E{(eTc h ) 2 } E{( weT h ,1 (1 w)eT h , 2 ) 2 }
w2 T2 h ,1 2 w(1 w) T h ,1, 2 (1 w) 2 T2 h , 2 min
w
Result 1: The solution to Problem 1 is
T2 h , 2 T h ,1, 2
w 2
T h ,1 T2 h , 2 2 T h ,1, 2
weight of
yˆ1,T h
T2 h ,1 T h ,1, 2
1 w 2
T h ,1 T2 h , 2 2 T h ,1, 2
weight of
yˆ 2,T h
17
18.
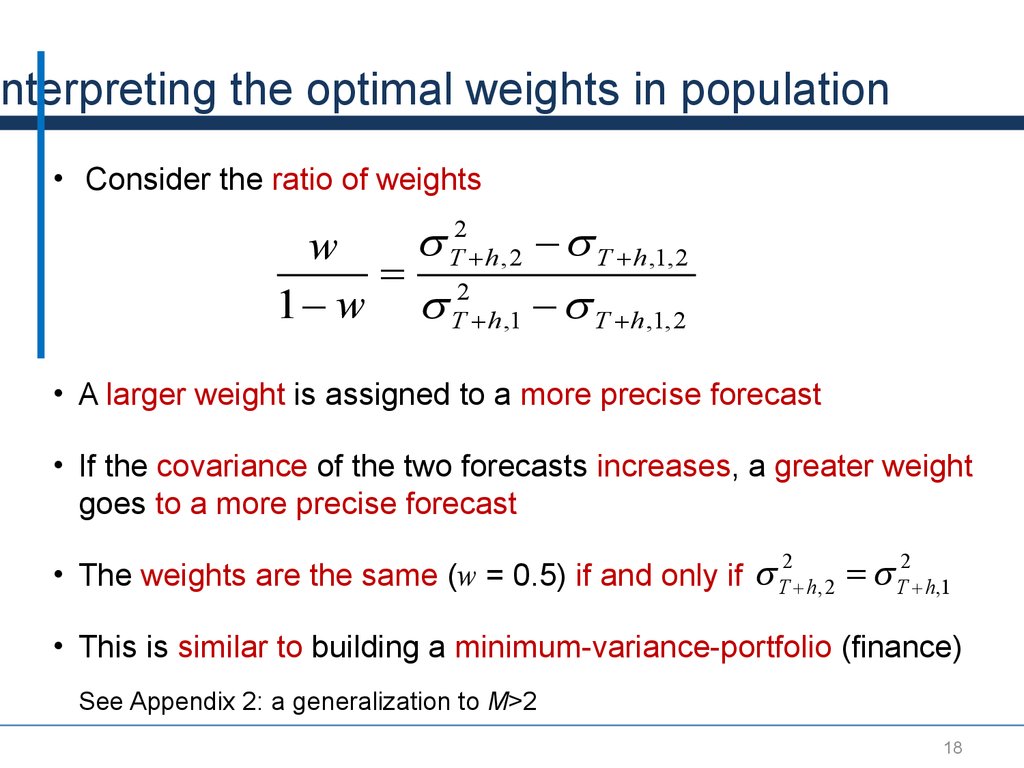
nterpreting the optimal weights in population• Consider the ratio of weights
2
w
T h , 2 T h ,1, 2
2
1 w T h ,1 T h ,1, 2
• A larger weight is assigned to a more precise forecast
• If the covariance of the two forecasts increases, a greater weight
goes to a more precise forecast
• The weights are the same (w = 0.5) if and only if
T2 h , 2 T2 h ,1
• This is similar to building a minimum-variance-portfolio (finance)
See Appendix 2: a generalization to M>2
18
19.
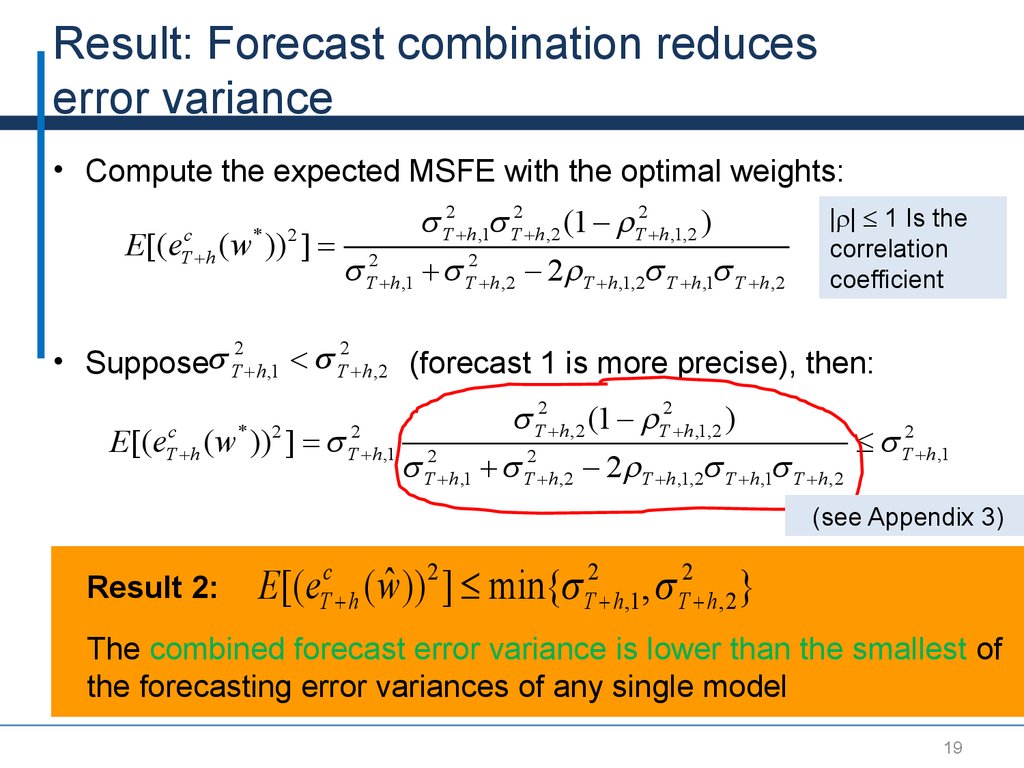
Result: Forecast combination reduceserror variance
• Compute the expected MSFE with the optimal weights:
2
2
2
(1
r
T h ,1 T h ,2
T h ,1,2 )
c
* 2
E[( eT h ( w )) ] 2
T h ,1 T2 h ,2 2rT h ,1,2 T h ,1 T h ,2
|r| 1 Is the
correlation
coefficient
• Suppose T h ,1 < T h ,2 (forecast 1 is more precise), then:
2
2
2
2
(1
r
T h ,2
T h ,1,2 )
c
* 2
2
2
E[( eT h ( w )) ] T h ,1 2
T h ,1
T h ,1 T2 h ,2 2rT h ,1,2 T h ,1 T h ,2
(see Appendix 3)
Result 2:
c
T h
E[(e
2
2
2
ˆ
( w)) ] min{ T h,1 , T h, 2 }
The combined forecast error variance is lower than the smallest of
the forecasting error variances of any single model
19
20.
Estimating• The key ingredient for finding the optimal weights is the
forecast error covariance matrix, e.g. for M=2:
æ T2 h ,1 T h,1, 2 ö
÷
(eT h ,1 , eT h, 2 ) çç
2
÷
T
h
,
1
,
2
T
h
,
2
è
ø
• In reality, we do not know the exact
• we can only estimate
forecasting errors
:
ˆ (and then the weights) using past record of
et,h,1
T
et,h,2
T
20
21.
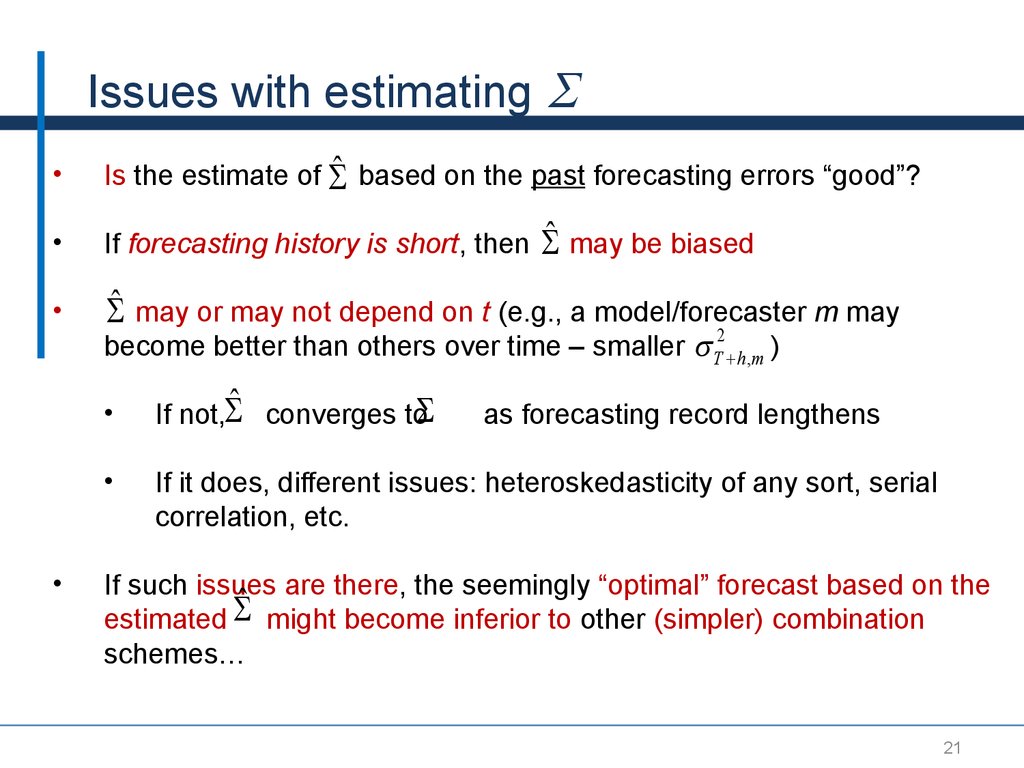
Issues with estimatingˆ based on the past forecasting errors “good”?
Is the estimate of
If forecasting history is short, then
ˆ may or may not depend on t (e.g., a model/forecaster m may
2
become better than others over time – smaller T h ,m )
If not, ˆ converges to
ˆ may be biased
as forecasting record lengthens
If it does, different issues: heteroskedasticity of any sort, serial
correlation, etc.
If such issues are there, the seemingly “optimal” forecast based on the
ˆ
estimated might become inferior to other (simpler) combination
schemes…
21
22.
Optimality of equal weights• The simplest possible averaging scheme uses equal weights
• The equal weights are also optimal weights if:
• the variances of the forecast errors are the same
• the pair-wise covariances of forecast errors are the same and equal
to zero for M > 2
• the loss function is symmetric, e.g. MSFE:
• we are not concerned about the sign or the size of forecast errors
Empirical observation: Equal weights tend to perform
better than many estimates of the optimal weights (Stock
and Watson 2004, Smith and Wallis 2009)
22
23.
Part III.Methods to estimate the weights:
M is small relative to T (M<<T)
23
24.
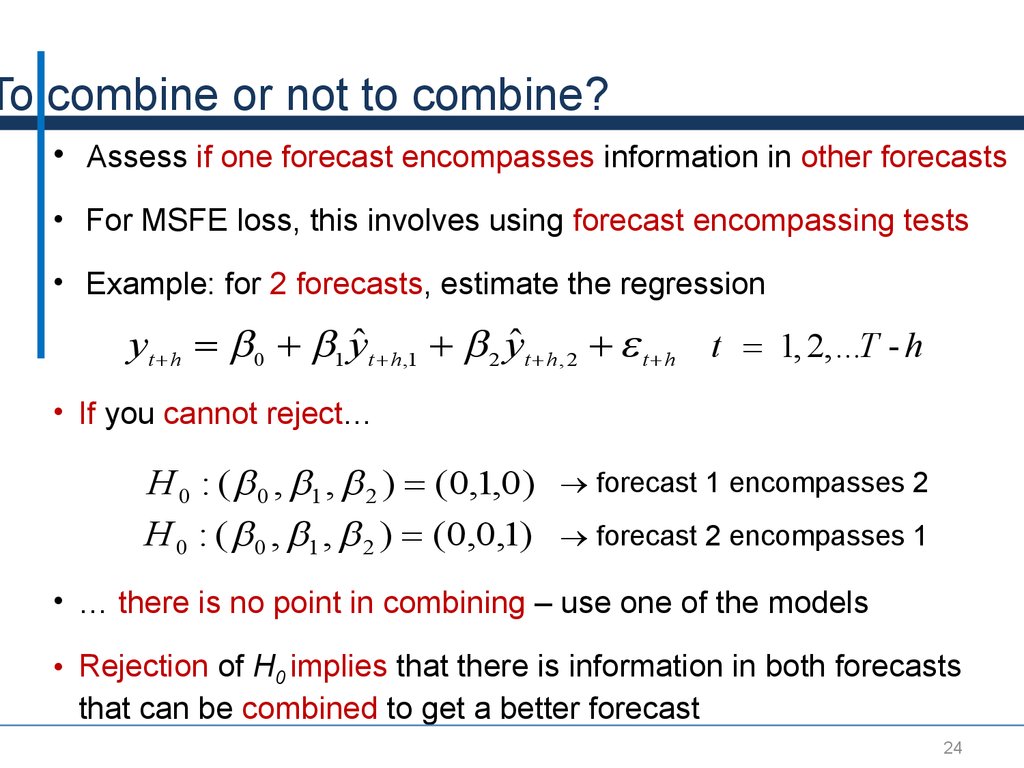
To combine or not to combine?• Assess if one forecast encompasses information in other forecasts
• For MSFE loss, this involves using forecast encompassing tests
• Example: for 2 forecasts, estimate the regression
yt h 0 1 yˆ t h ,1 2 yˆ t h , 2 t h t 1, 2,...T - h
• If you cannot reject…
H 0 : ( 0 , 1 , 2 ) (0,1,0)
H 0 : ( 0 , 1 , 2 ) (0,0,1)
forecast 1 encompasses 2
forecast 2 encompasses 1
• … there is no point in combining – use one of the models
• Rejection of H0 implies that there is information in both forecasts
that can be combined to get a better forecast
24
25.
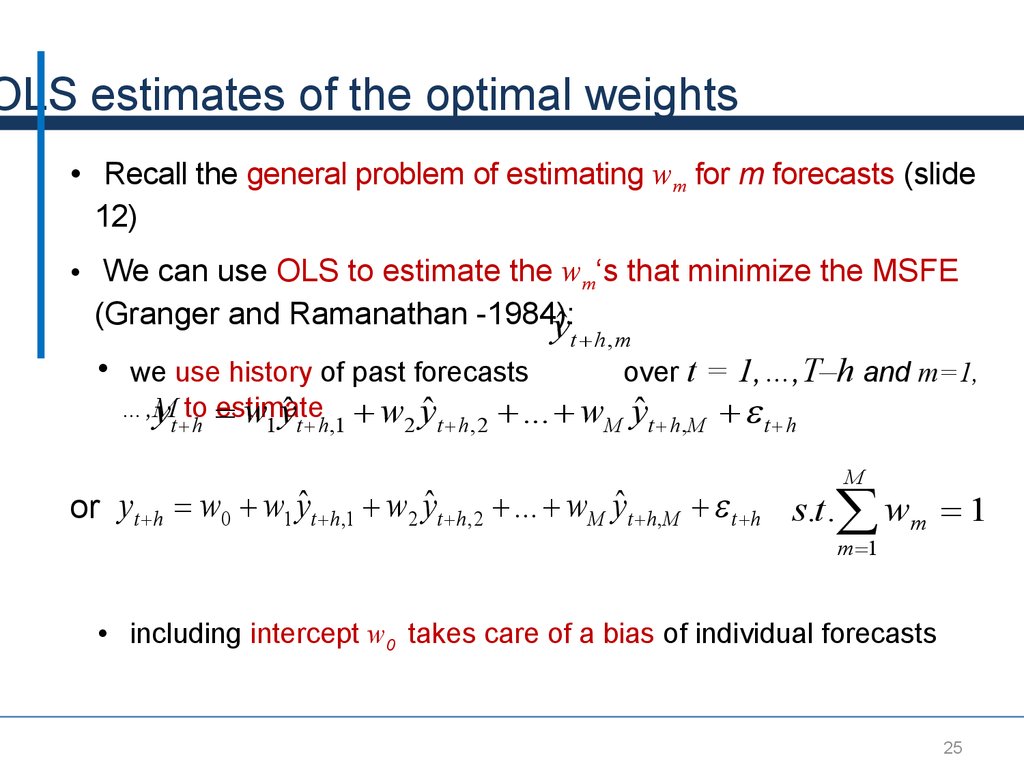
OLS estimates of the optimal weights• Recall the general problem of estimating wm for m forecasts (slide
12)
• We can use OLS to estimate the wm‘s that minimize the MSFE
(Granger and Ramanathan -1984):
yˆ
t h ,m
• we use history of past forecasts
over t = 1,…,T–h and m=1,
…,M
estimate
yt toh
w1 yˆ t h ,1 w2 yˆ t h , 2 ... wM yˆ t h , M t h
M
or yt h w0 w1 yˆ t h ,1 w2 yˆ t h , 2 ... wM yˆ t h , M t h s.t. wm 1
m 1
• including intercept w0 takes care of a bias of individual forecasts
25
26.
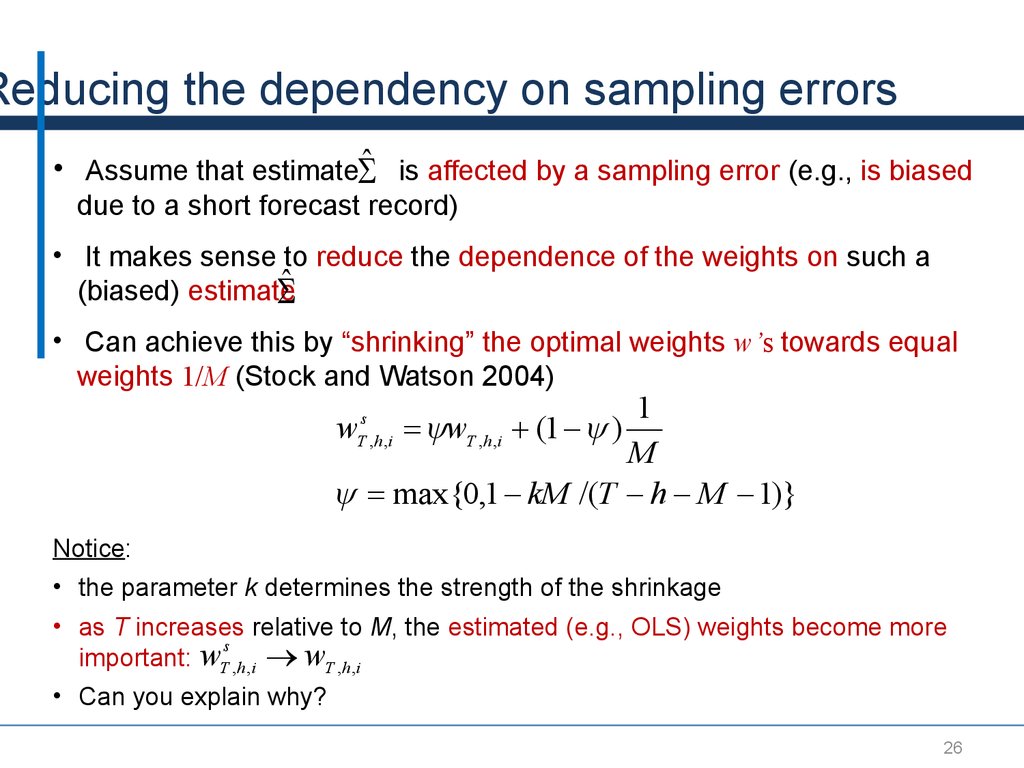
Reducing the dependency on sampling errors• Assume that estimate ˆ is affected by a sampling error (e.g., is biased
due to a short forecast record)
• It makes sense to reduce the dependence of the weights on such a
(biased) estimate
ˆ
• Can achieve this by “shrinking” the optimal weights w’s towards equal
weights 1/M (Stock and Watson 2004)
1
w wT ,h ,i (1 )
M
max{0,1 kM /(T h M 1)}
s
T , h ,i
Notice:
• the parameter k determines the strength of the shrinkage
• as T increases relative to M, the estimated (e.g., OLS) weights become more
s
important: wT ,h ,i wT ,h ,i
• Can you explain why?
26
27.
Part IV.Methods to estimate the weights:
when M is large relative to T
27
28.
Premise: problems with OLS weights• The problem with OLS weights:
• If M is large relative to T–h the OLS estimates loose precision and
may not even be feasible (if M > T–h)
• Even if M is low relative to T–h, the OLS estimates of weights
may be subject to a sampling error
• the estimate
ˆ
may depend on the sample used
• A number of other methods can be used when M is large
relative to T
28
29.
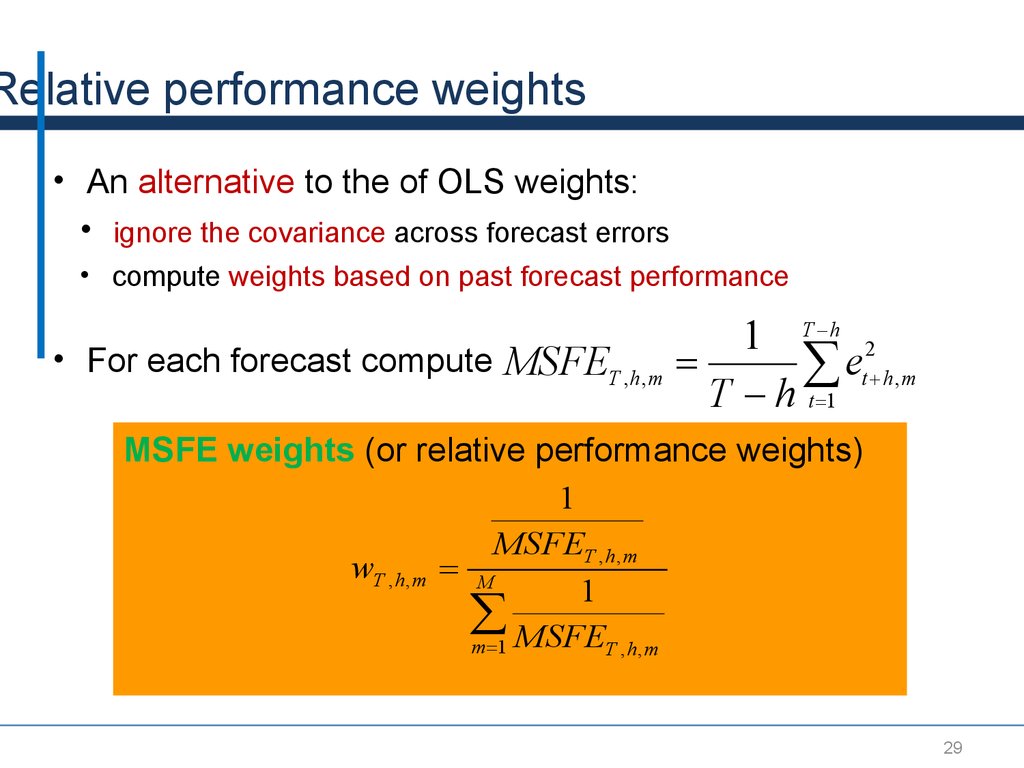
Relative performance weights• An alternative to the of OLS weights:
• ignore the covariance across forecast errors
• compute weights based on past forecast performance
• For each forecast compute
MSFET ,h ,m
1 T h 2
et h ,m
T h t 1
MSFE weights (or relative performance weights)
1
MSFET ,h ,m
wT ,h ,m M
1
m 1 MSFET , h , m
29
30.
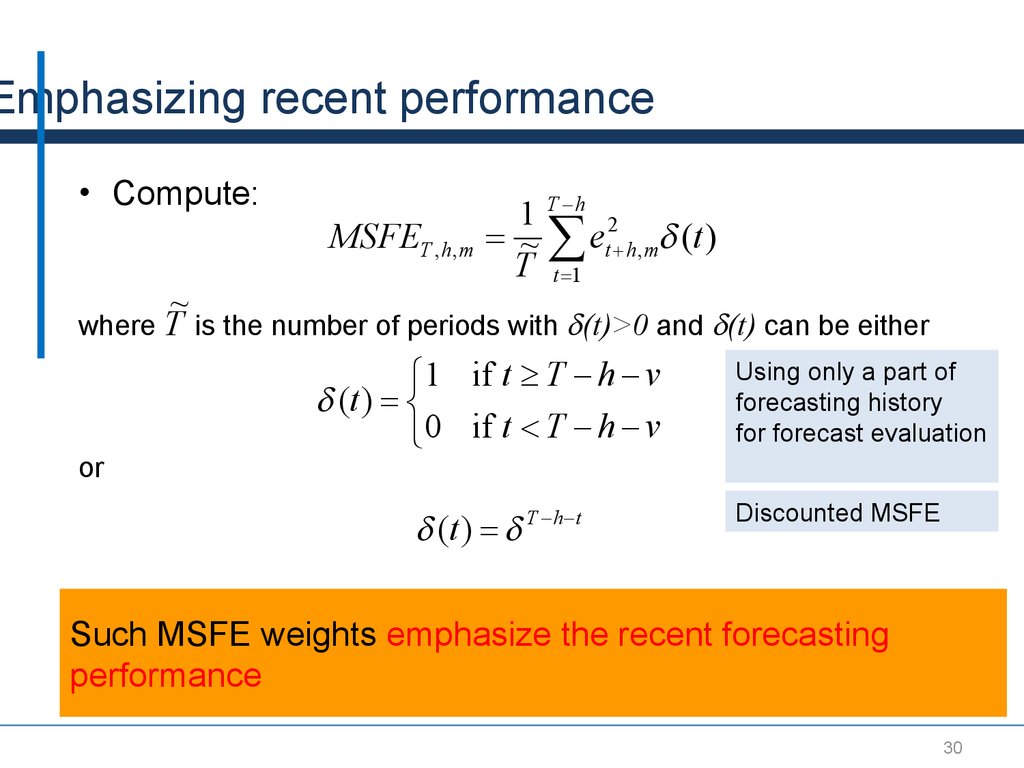
Emphasizing recent performance• Compute:
MSFET ,h ,m
~
1 T h 2
~ et h ,m (t )
T t 1
where T is the number of periods with (t)>0 and (t) can be either
or
ì1 if t ³ T h v
(t ) í
î0 if t < T h v
(t ) T h t
Using only a part of
forecasting history
for forecast evaluation
Discounted MSFE
Such MSFE weights emphasize the recent forecasting
performance
30
31.
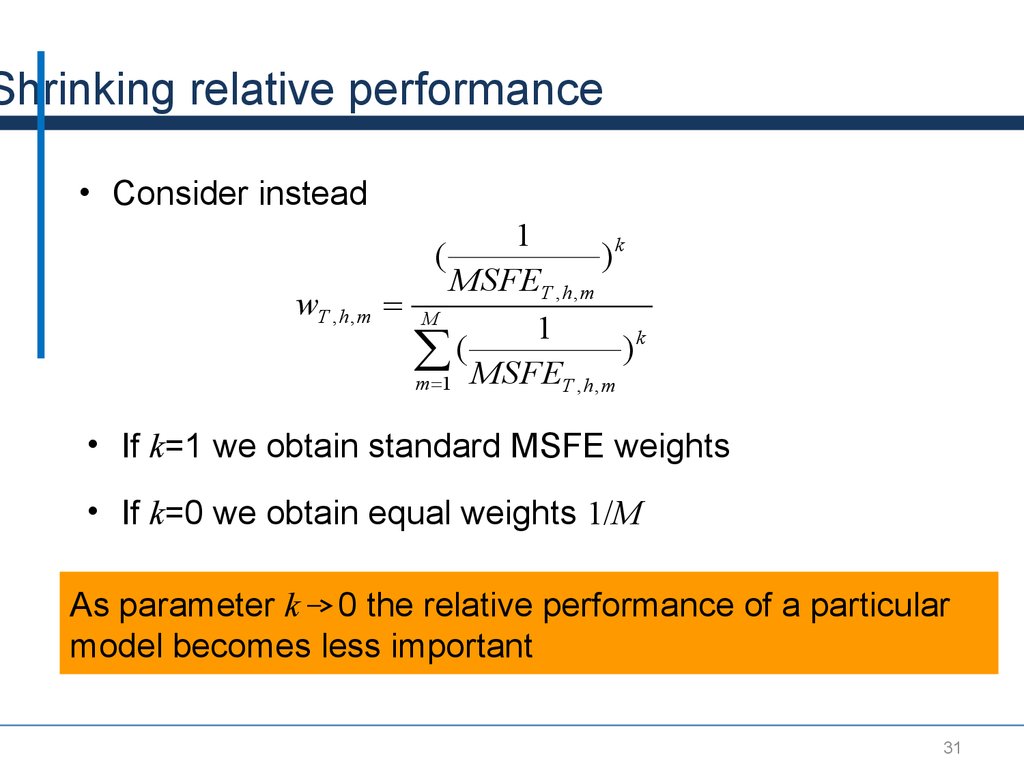
Shrinking relative performance• Consider instead
1
)k
MSFET ,h ,m
M
1
k
(
)
m 1 MSFET , h , m
(
wT ,h ,m
• If k=1 we obtain standard MSFE weights
• If k=0 we obtain equal weights 1/M
As parameter k 0 the relative performance of a particular
model becomes less important
31
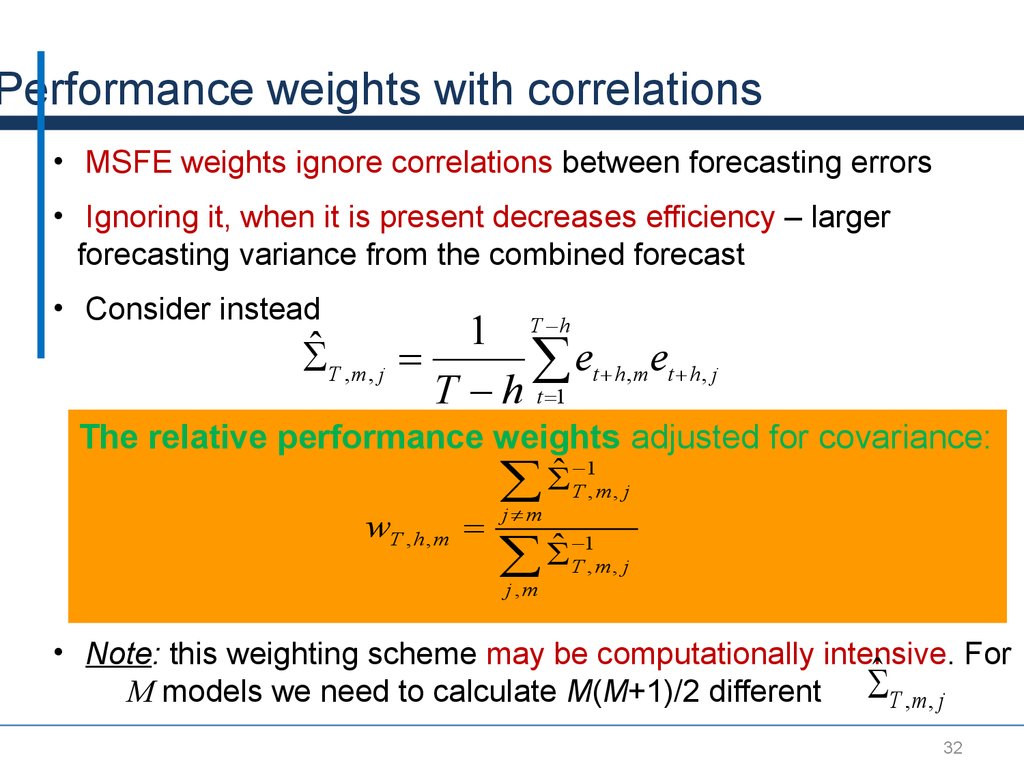
32.
Performance weights with correlations• MSFE weights ignore correlations between forecasting errors
• Ignoring it, when it is present decreases efficiency – larger
forecasting variance from the combined forecast
• Consider instead
ˆ T ,m , j
1 T h
et h ,m et h , j
T h t 1
The relative performance weights adjusted for covariance:
1
ˆ
T ,m, j
j m
wT , h , m
1
ˆ
T ,m, j
j ,m
• Note: this weighting scheme may be computationally intensive. For
ˆ T ,m, j
M models we need to calculate M(M+1)/2 different
32
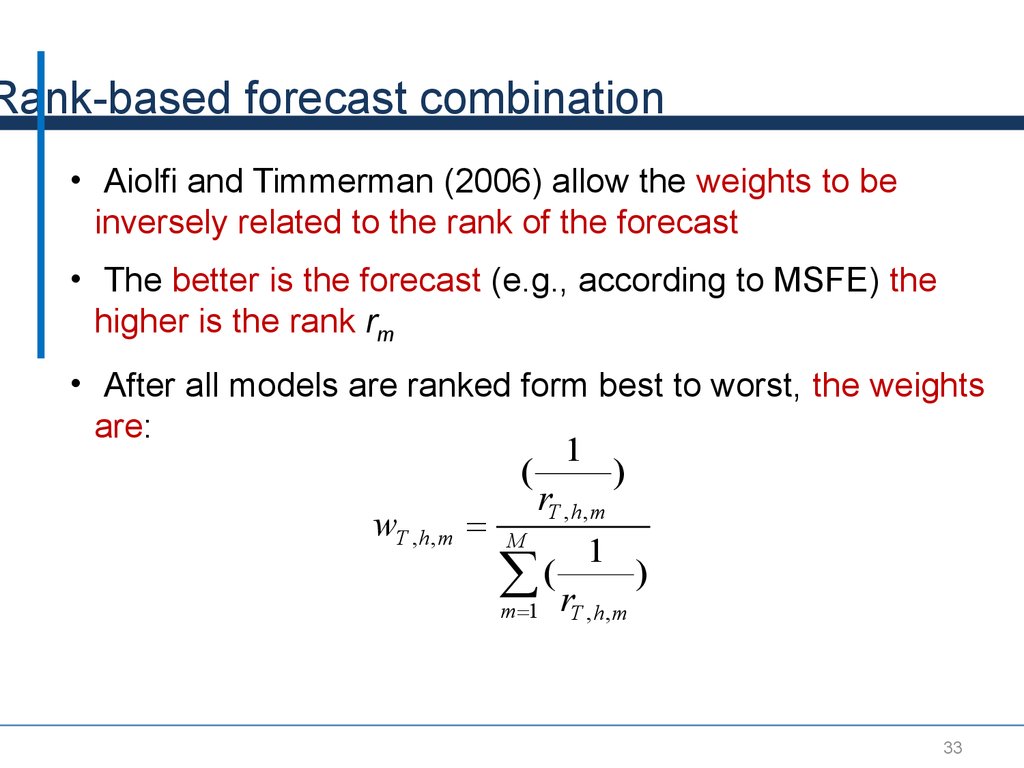
33.
Rank-based forecast combination• Aiolfi and Timmerman (2006) allow the weights to be
inversely related to the rank of the forecast
• The better is the forecast (e.g., according to MSFE) the
higher is the rank rm
• After all models are ranked form best to worst, the weights
are:
1
(
)
rT ,h ,m
wT ,h ,m M
1
(
)
m 1 rT , h , m
33
34.
Trimming• In forecast combination, it is often advantageous to discard
models with the worst and best performance (i.e., trimming)
• This is because simple averages are easily distorted by extreme
forecasts/forecast errors
• Trimming justifies the use of the median forecast
• Aiolfi and Favero (2003) recommend ranking the individual
models by R2 and discarding the bottom and top 10 percent.
34
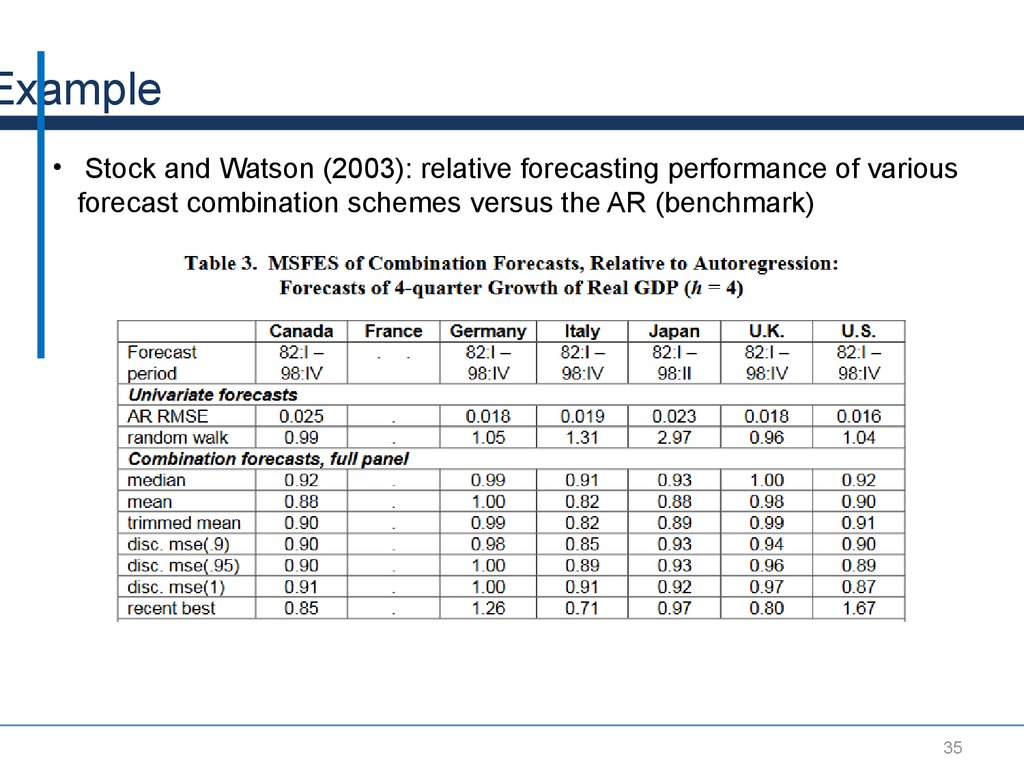
35.
Example• Stock and Watson (2003): relative forecasting performance of various
forecast combination schemes versus the AR (benchmark)
35
36.
Part V. Improving the Estimatesof the Theoretical Model
Performance: Knowing
the parameters in the
model
36
37.
Question• So far we assumed that we do not know models from which
forecasts originate
• Would our estimates of the weights improve if we knew
something about these models
• e.g., if we knew the number of parameters?
37
38.
Hansen (2007) approach• For a process yt there may be an infinite number of potential
explanatory variables (x1t,x2t,…)
• In reality we deal with only a finite subset (x1t,x2t,…,xNt)
• Consider a sequence of linear forecasting models where
model m uses the first kkmm variables (x1t,x2t,…,xkt):
yt h j x jt bt ,m t ,m
j 1
of model m:
• with bt,m the approximation error
bt ,m j x jt
j k m 1
• and the forecast given by k m
yˆ t h j x jt
j 1
38
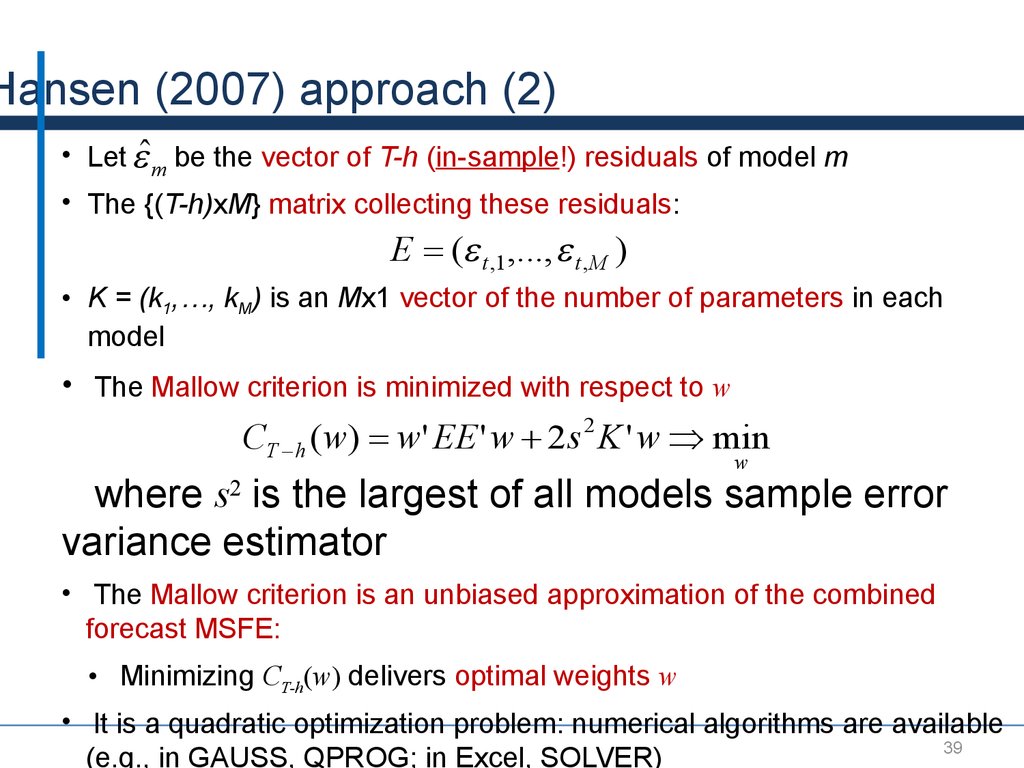
39.
Hansen (2007) approach (2)• Let ˆm be the vector of T-h (in-sample!) residuals of model m
• The {(T-h)xM} matrix collecting these residuals:
E ( t ,1 ,..., t , M )
• K = (k1,…, kM) is an Mx1 vector of the number of parameters in each
model
• The Mallow criterion is minimized with respect to w
CT h ( w) w' EE ' w 2 s 2 K ' w min
w
where s2 is the largest of all models sample error
variance estimator
• The Mallow criterion is an unbiased approximation of the combined
forecast MSFE:
• Minimizing CT-h(w) delivers optimal weights w
• It is a quadratic optimization problem: numerical algorithms are available
39
(e.g., in GAUSS, QPROG; in Excel, SOLVER)
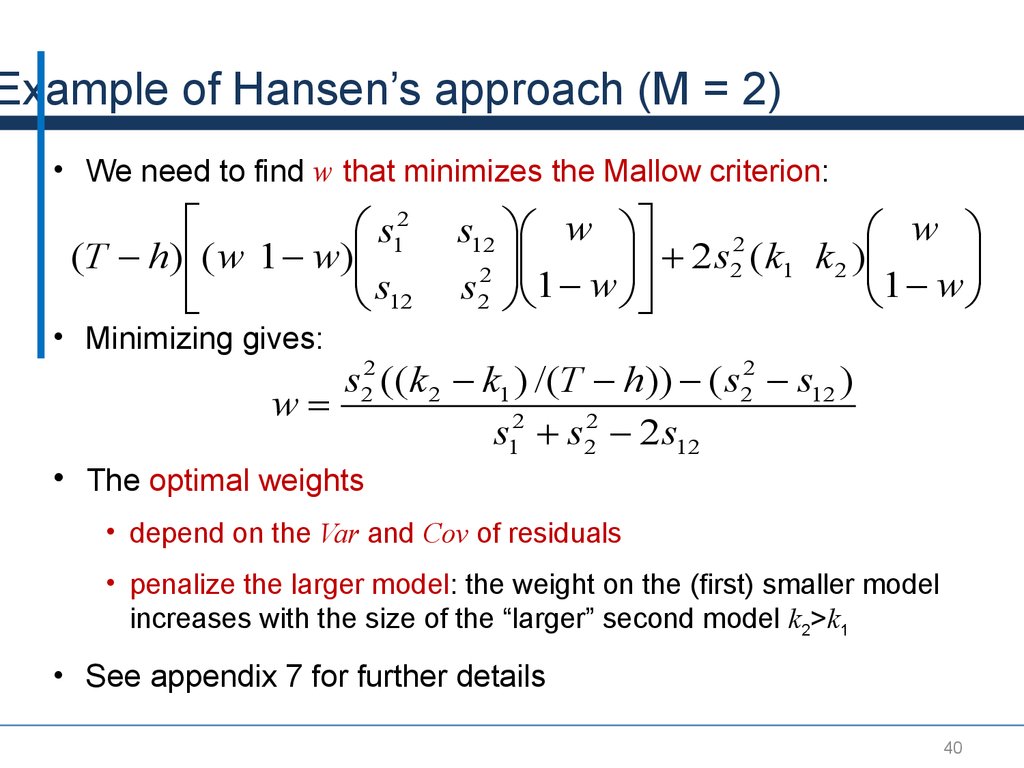
40.
Example of Hansen’s approach (M = 2)• We need to find w that minimizes the Mallow criterion:
é
æ s12
(T h) ê( w 1 w)çç
êë
è s12
• Minimizing gives:
s12 öæ w öù
æ w ö
2
֍
÷÷ú 2 s2 (k1 k 2 )çç
÷÷
2 ֍
s2 øè1 w øúû
è1 w ø
s22 ((k 2 k1 ) /(T h)) ( s22 s12 )
w
s12 s22 2 s12
• The optimal weights
• depend on the Var and Cov of residuals
• penalize the larger model: the weight on the (first) smaller model
increases with the size of the “larger” second model k2>k1
• See appendix 7 for further details
40
41.
Conclusions – Key Takeaways• Combined forecasts imply diversification of risk (provided not
all the models suffer from the same misspecification problem)
• Numerous schemes are available to formulate combined
forecasts
• For a standard MSFE loss, the payoff from using covariances
of errors to derive weights is small
• Simple combination schemes are difficult to beat
41
42.
Thank You!43. References
• Aiolfi, Capistran and Timmerman, 2010, “Forecast Combinations“, inForecast Handbook,
Oxford, Edited by Michael Clements and David Hendry.
• Clemen
, Robert, 1985, “Combining Forecasts: A Review and Annotated Bibliog
raphy,”
International Journal of Forecasting, Vol. 5, No. 4, pp. 559–583.
• Stock
, James H., and Mark W. Watson, 2004, “Combination Forecasts of Out
put Growth in a Seven-Country Data Set,”
Journal of Forecasting, Vol. 23, No. 6, pp. 405–430.
• Timmermann, Allan, 2006. "Forecast Combinations," Handbook of Econ
43
44.
Appendix44
45.
Appendix 1: generalization of problem 1Let w be the (M x 1) vector of weights, e the (M x 1) vector of
forecast errors, u an (M x 1) vector of 1s’, and the (M x M)
variance covariance matrix of the errors
Σ E [ ee']
It follows that
M
w
i 1
T , h ,i
u 'w
c
T h
e
M
wT ,h,i eT h ,i w'e
i 1
(e )
2
c
T h
w'ee'w
2
c
é
E ê( eT h ) ùú E [ w'ee'w ] w'E [ ee'] w w'Σw
ë
û
Problem 1: Choose w to minimize w’ w subject to
u’w = 1.
45
46.
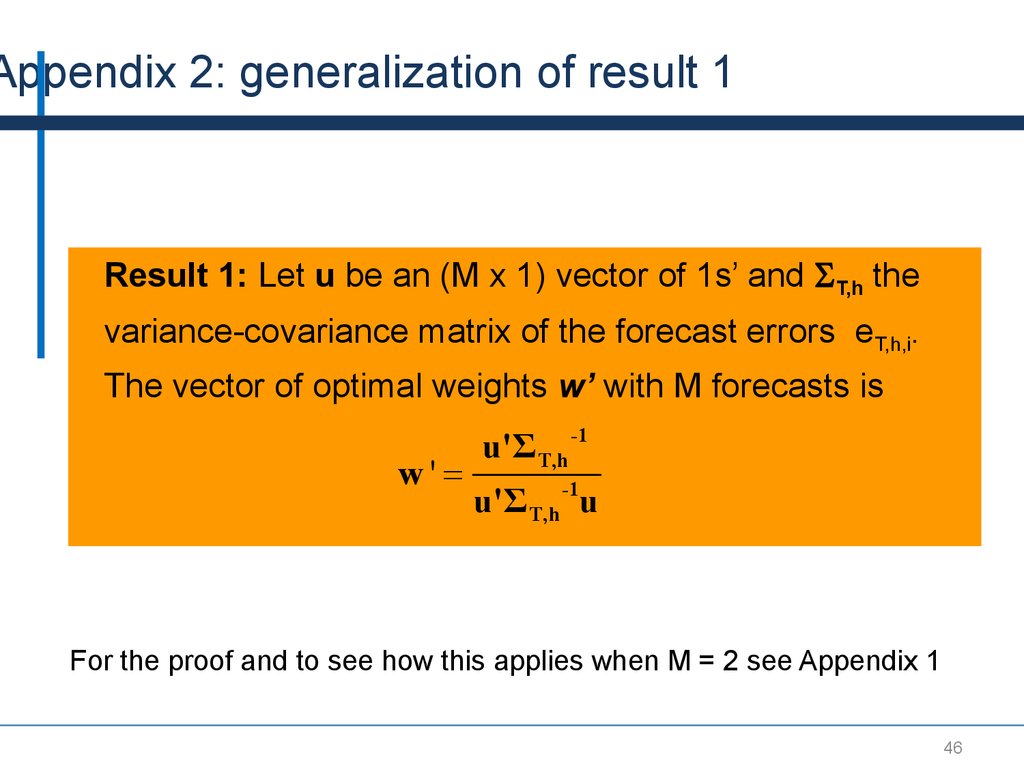
Appendix 2: generalization of result 1Result 1: Let u be an (M x 1) vector of 1s’ and T,h the
variance-covariance matrix of the forecast errors eT,h,i.
The vector of optimal weights w’ with M forecasts is
w'
u'Σ T,h -1
u'Σ T,h -1u
For the proof and to see how this applies when M = 2 see Appendix 1
46
47.
Appendix 2: generalization of result 1Let e be the (M x 1) vector of the forecast errors. Problem 1:
choose the vector w to minimize E[w’ee’w] subject to u’w = 1.
Notice that E[w’ee’w] = w’E[ee’]w = w’ w. The Lagrangean is
and the FOC is
L w'ee'w -λ[u'w - 1]
Σw - λu 0 w * = Σ -1uλ
Using u’w = 1 one can obtain
u'w = u'Σ uλ 1 = u'Σ uλ = éëu'Σ u ùû
*
-1
-1
-1
Substituting back one gives
w =Σ u éëu'Σ u ùû
*
-1
-1
1
1
47
48.
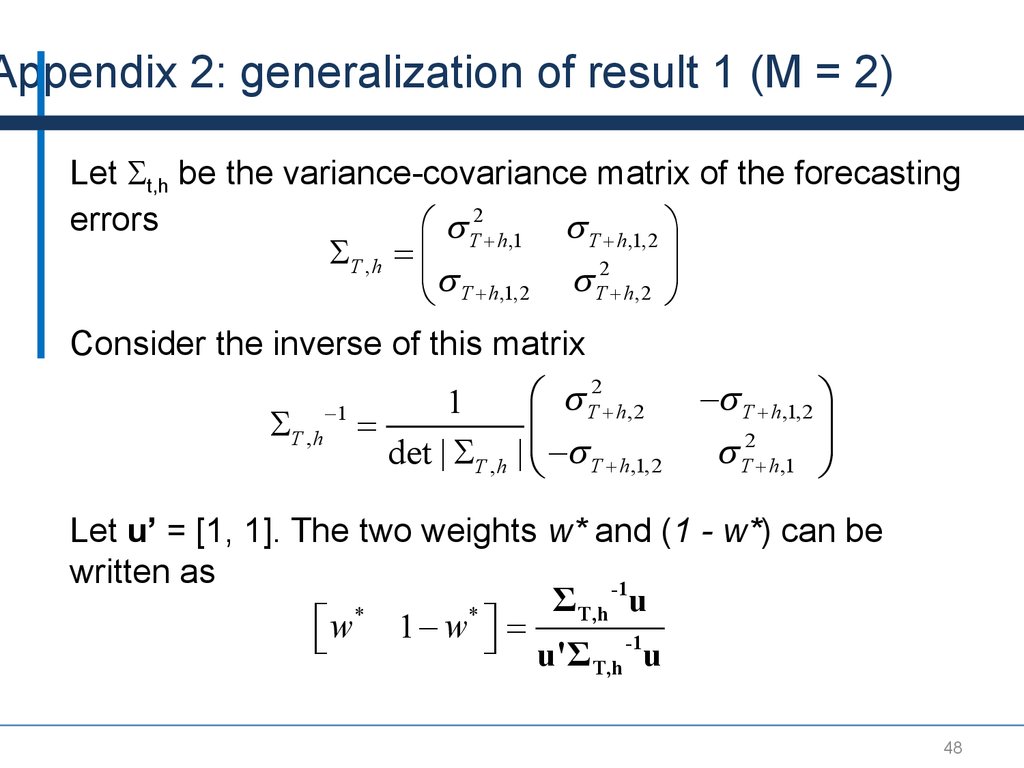
Appendix 2: generalization of result 1 (M = 2)Let t,h be the variance-covariance matrix of the forecasting
errors
æ T2 h ,1 T h ,1,2 ö
T ,h çç
÷÷
2
è T h ,1,2 T h ,2 ø
Consider the inverse of this matrix
2
æ
1
T h ,2
T , h 1
çç
det | T ,h | è T h ,1,2
T h ,1,2 ö
÷÷
2
T h ,1 ø
Let u’ = [1, 1]. The two weights w* and (1 - w*) can be
written as
-1
Σ
T,h u
*
*
éë w 1 w ùû
u'Σ -1u
T,h
48
49.
Optimal weights in population (M = 2)• Assume we have 2 unbiased forecasts (E(eT+h,m) = 0) and combine:
yˆTc h wyˆ1,T h (1 w) yˆ 2,T h
E{(eTc h ) 2 } E{( weT h ,1 (1 w)eT h , 2 ) 2 }
w 2 T2 h ,1 2 w(1 w) T h ,1, 2 (1 w) 2 T2 h , 2 min
w
Result 1: The solution to Problem 1 is
T2 h , 2 T h ,1, 2
w 2
T h ,1 T2 h , 2 2 T h ,1, 2
weight of
yˆ1,T h
T2 h ,1 T h ,1, 2
1 w 2
weight of yˆ 2 ,T h
2
T h ,1 T h , 2 2 T h ,1, 2
49
50.
Appendix 3Notice that
and that
T2 h ,1 T2 h ,2 2 T h ,1,2 E éë( eT h ,1 eT h ,2 )2 ùû ³ 0
T2 h ,1 (1 rT2 h ,12 ) ³ 0
Need to show that the following inequality holds
T2 h ,2 (1 rT2 h ,1,2 )
1
2
2
T h ,1 T h ,2 2 rT h ,1,2 T h ,1 T h ,2
Rearrange the above
T2 h ,2 (1 rT2 h ,1,2 ) T2 h ,1 T2 h,2 2rT h ,1,2 T h ,1 T h ,2
0 T2 h ,1 2 rT h ,1,2 T h ,1 T h ,2 T2 h ,2 rT2 h ,1,2
0 ( T h ,1 T h , 2 rT h ,12 ) 2
50
51.
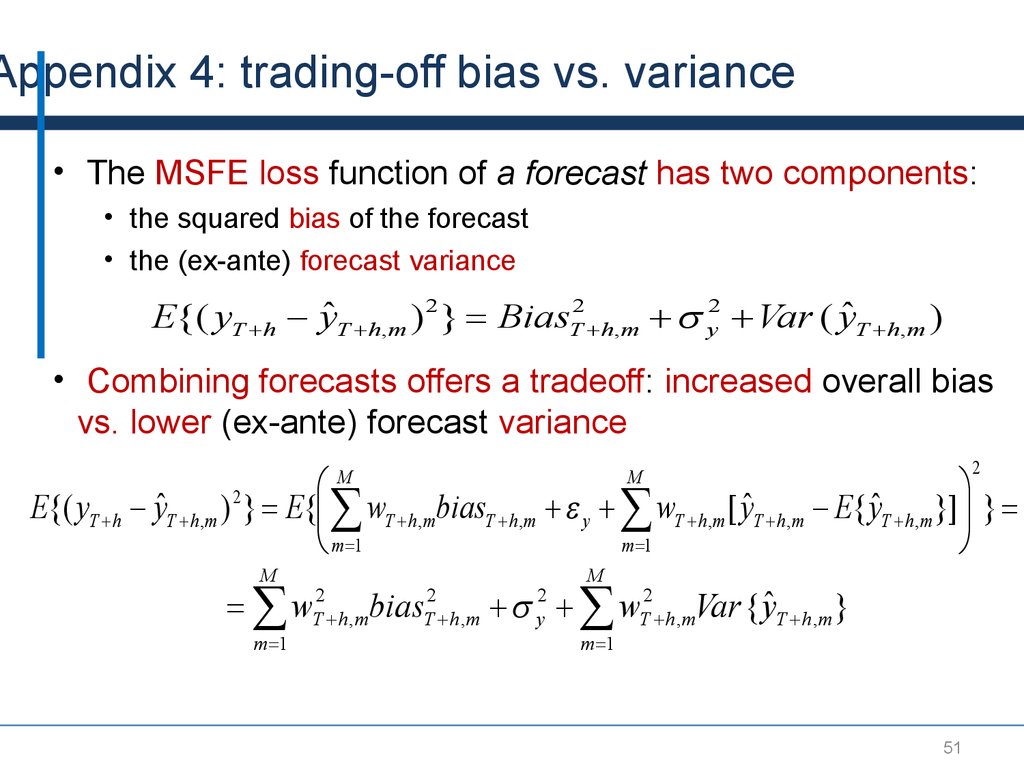
Appendix 4: trading-off bias vs. variance• The MSFE loss function of a forecast has two components:
• the squared bias of the forecast
• the (ex-ante) forecast variance
E{( yT h yˆ T h ,m ) 2 } BiasT2 h , m y2 Var ( yˆT h , m )
• Combining forecasts offers a tradeoff: increased overall bias
vs. lower (ex-ante) forecast variance
2
æ
ö
2
ˆ
ˆ
ˆ
E{( yT h yT h,m ) } E{ç wT h,mbiasT h,m y wT h,m [ yT h,m E{ yT h,m }] ÷ }
m 1
è m 1
ø
M
M
w
m 1
2
T h ,m
M
2
T h ,m
bias
M
wT2 h ,mVar { yˆT h ,m }
2
y
m 1
51
52.
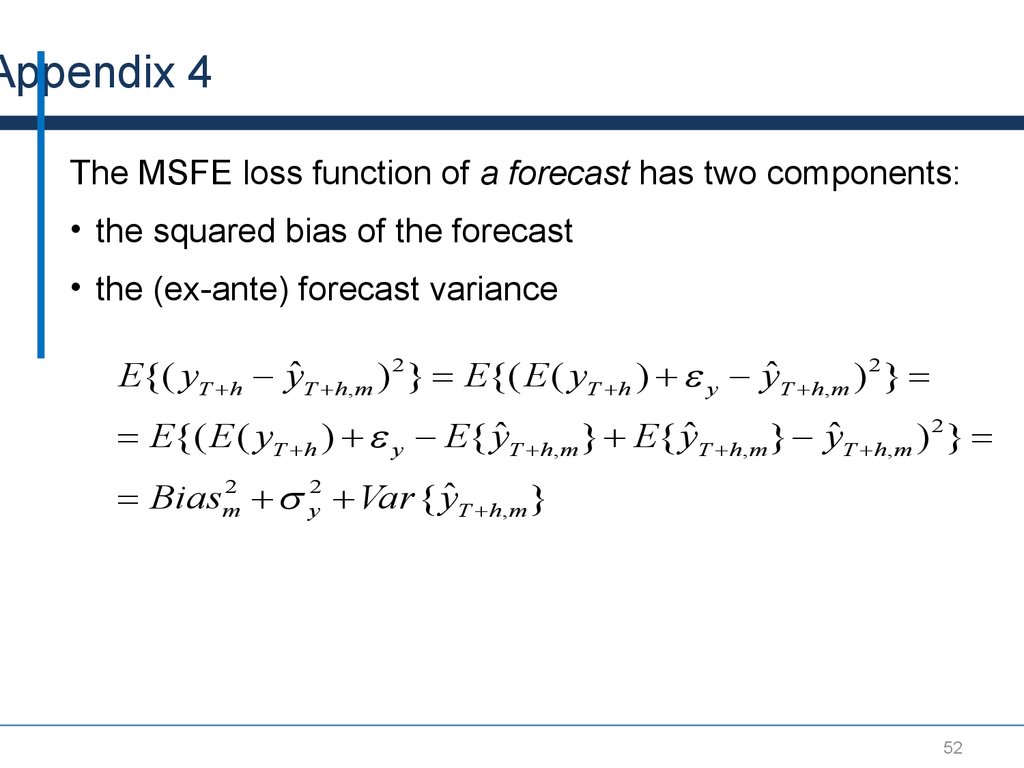
Appendix 4The MSFE loss function of a forecast has two components:
• the squared bias of the forecast
• the (ex-ante) forecast variance
E{( yT h yˆ T h , m ) 2 } E{( E ( yT h ) y yˆT h ,m ) 2 }
E{( E ( yT h ) y E{ yˆT h , m } E{ yˆ T h , m } yˆT h ,m ) 2 }
Biasm2 y2 Var { yˆT h , m }
52
53.
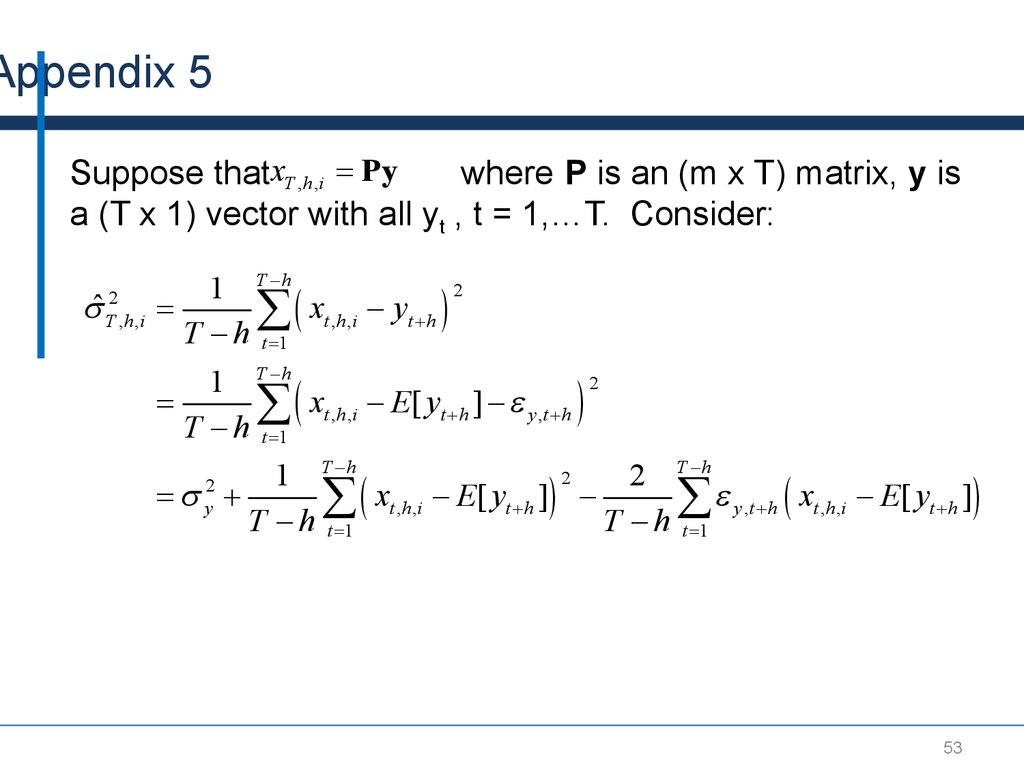
Appendix 5Suppose thatxT ,h ,i Py
where P is an (m x T) matrix, y is
a (T x 1) vector with all yt , t = 1,…T. Consider:
ˆ
2
T , h ,i
2
1 T h
x
y
(
t , h ,i
t h )
T h t 1
2
1 T h
xt , h ,i E[ yt h ] y ,t h )
(
T h t 1
2
1 T h
2 T h
2
y
xt ,h ,i E[ yt h ])
y ,t h ( xt ,h ,i E[ yt h ])
(
T h t 1
T h t 1
53
54.
Appendix 5Consider:
ˆ
2
T , h ,i
2
1 T h
2 T h
xt ,h ,i E[ yt h ])
y ,t h ( xt ,h ,i E[ yt h ])
(
T h t 1
T h t 1
2
...
ε'(Py - E[y])
T h
2
...
ε'(PE[y] + Pε - E[y])
T h
2
...
ε'Pε ε'(I - P)E[y]
T h
2
; MSPET
E [ ε'Pε ]
T h
2
y
54
55.
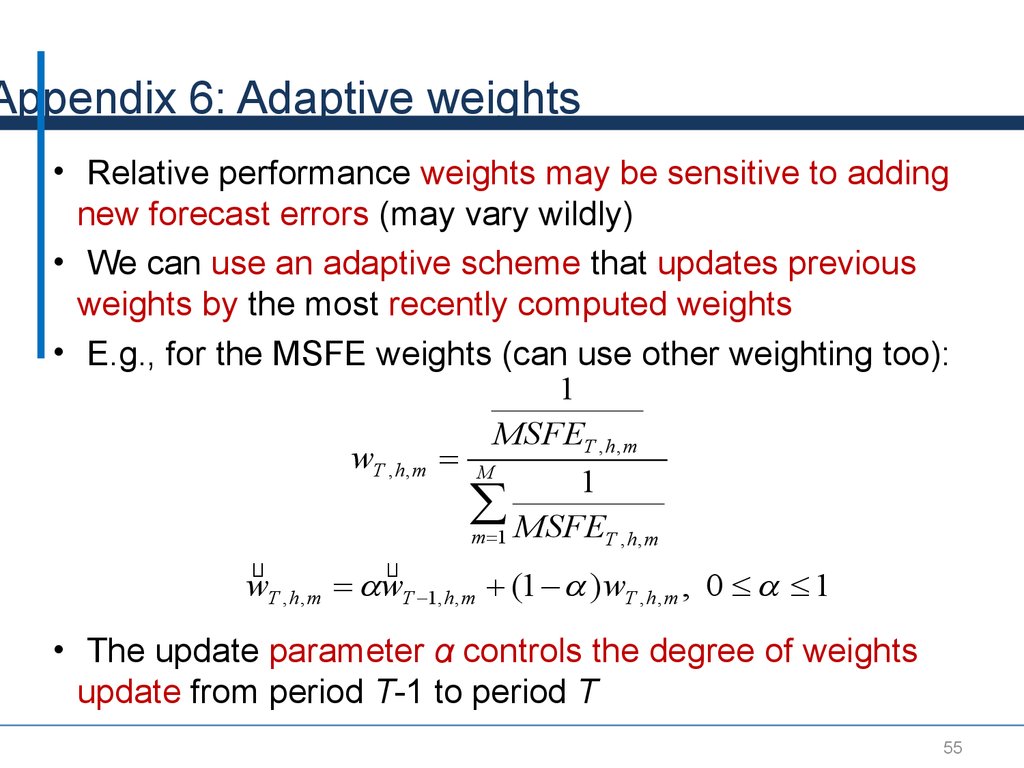
Appendix 6: Adaptive weights• Relative performance weights may be sensitive to adding
new forecast errors (may vary wildly)
• We can use an adaptive scheme that updates previous
weights by the most recently computed weights
• E.g., for the MSFE weights (can use other weighting too):
1
MSFET ,h ,m
wT ,h ,m M
1
m 1 MSFET , h , m
wT ,h ,m wT 1,h ,m (1 ) wT ,h ,m , 0 1
• The update parameter α controls the degree of weights
update from period T-1 to period T
55
56.
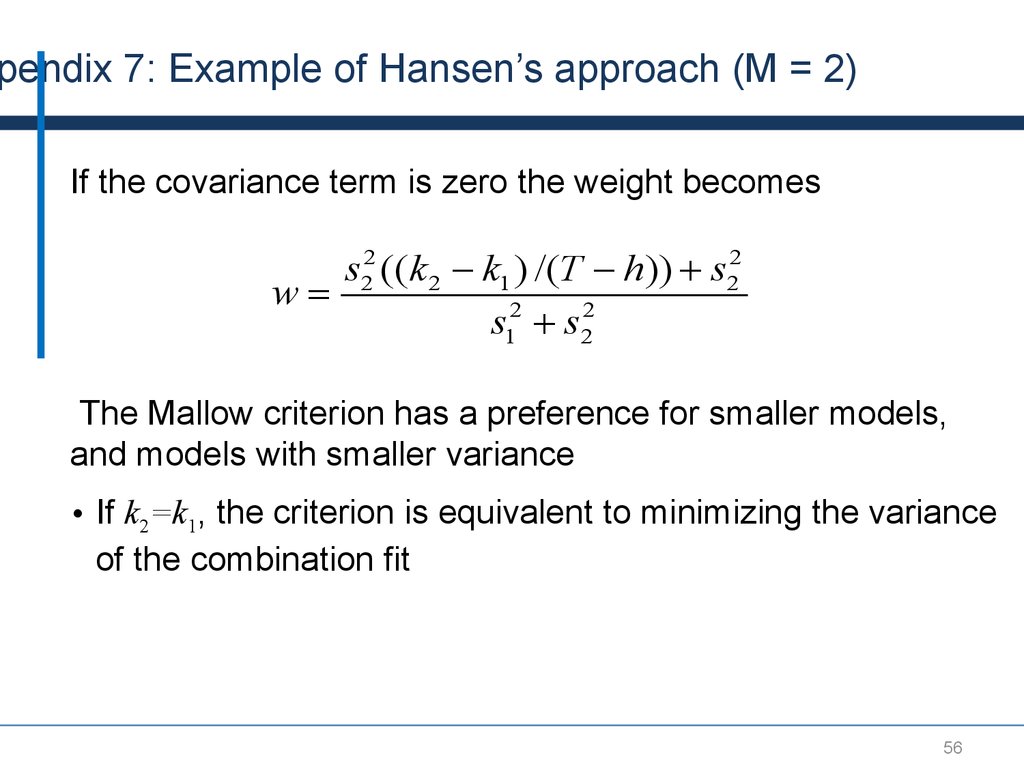
pendix 7: Example of Hansen’s approach (M = 2)If the covariance term is zero the weight becomes
s22 ((k 2 k1 ) /(T h)) s22
w
s12 s22
The Mallow criterion has a preference for smaller models,
and models with smaller variance
• If k2=k1, the criterion is equivalent to minimizing the variance
of the combination fit
56