


 1997-2009")


…")

, from August 1, 2007")


")


")


")

")
 - Continued")


")


 Экономика
Похожие презентации:


Modeling and forecasting. Volatility
1.
Modeling and Forecasting VolatilityJoint Vienna Institute / IMF ICD
Macro-econometric Forecasting and Analysis
JV16.12, L10, Vienna, Austria, May 24, 2016
Presenter
Charis Christofides
This training material is the property of the International Monetary Fund (IMF) and is intended for use
in IMF Institute courses. Any reuse requires the permission of the IMF Institute.
2. Outline
1. Introduction: Why ARCH?2. ARCH Models
3. Extensions: GARCH, T-GARCH, Q4.
5.
6.
7.
GARCH, GARCH-M, Box-Cox GARCH
Estimation
Multivariate GARCH Models: Diagonal
Vech, BEKK and CCC
Application: Value-at-Risk (VaR)
Appendix
3. 1. Introduction: Why ARCH?
4.
Why ARCH?• ARMA and VAR models are based on the conditional
mean of the distribution where conditioning is based
on lagged values of the dependent variable.
• The conditional variance of the distribution is
assumed to be time-invariant (i.e.
homoskedasticity).
• In addition, if the error term is assumed to be
normal, the conditional distribution (and hence the
marginal and joint distributions) is Gaussian.
• Are these properties supported by real data?
4
5. Some example series: UST10Y
6. Dow Jones
Homoskedastic?Symmetric Shocks?
7. U.S. Unemployment rate vs. stock market volatility, 1929-2010
U.S. Unemployment rate vs. stock market volatility, 192920108. U.S. Realized Volatility (kernel based) 1997-2009
9.
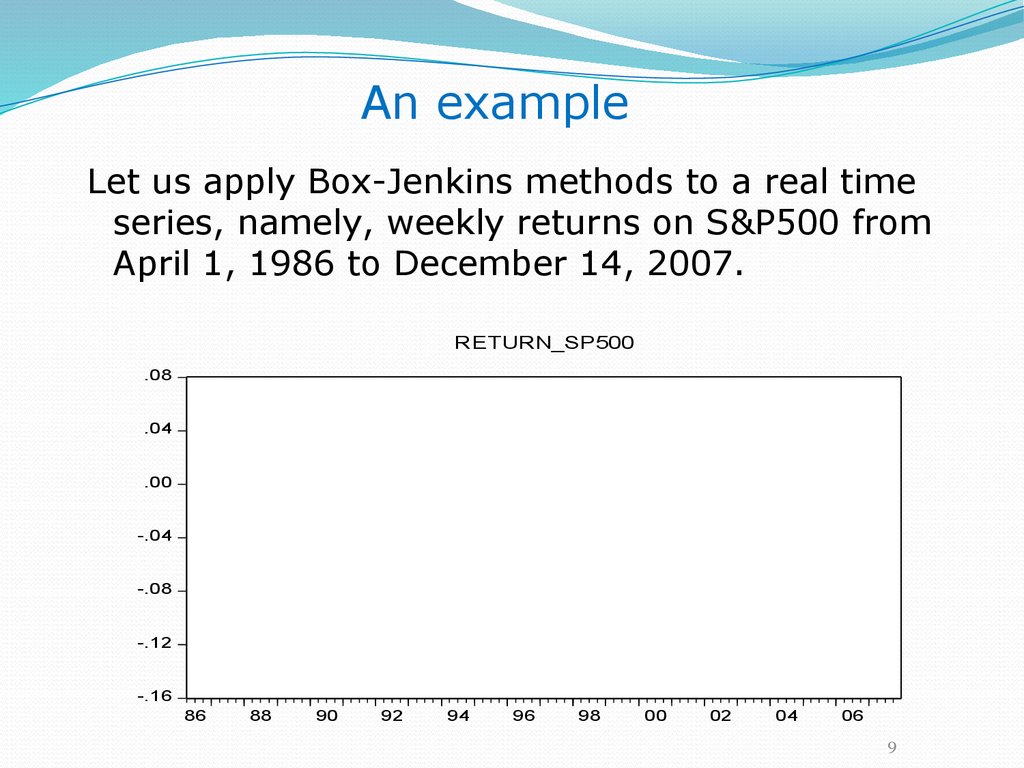
An exampleLet us apply Box-Jenkins methods to a real time
series, namely, weekly returns on S&P500 from
April 1, 1986 to December 14, 2007.
RETURN_SP500
.08
.04
.00
-.04
-.08
-.12
-.16
86
88
90
92
94
96
98
00
02
04
06
9
10.
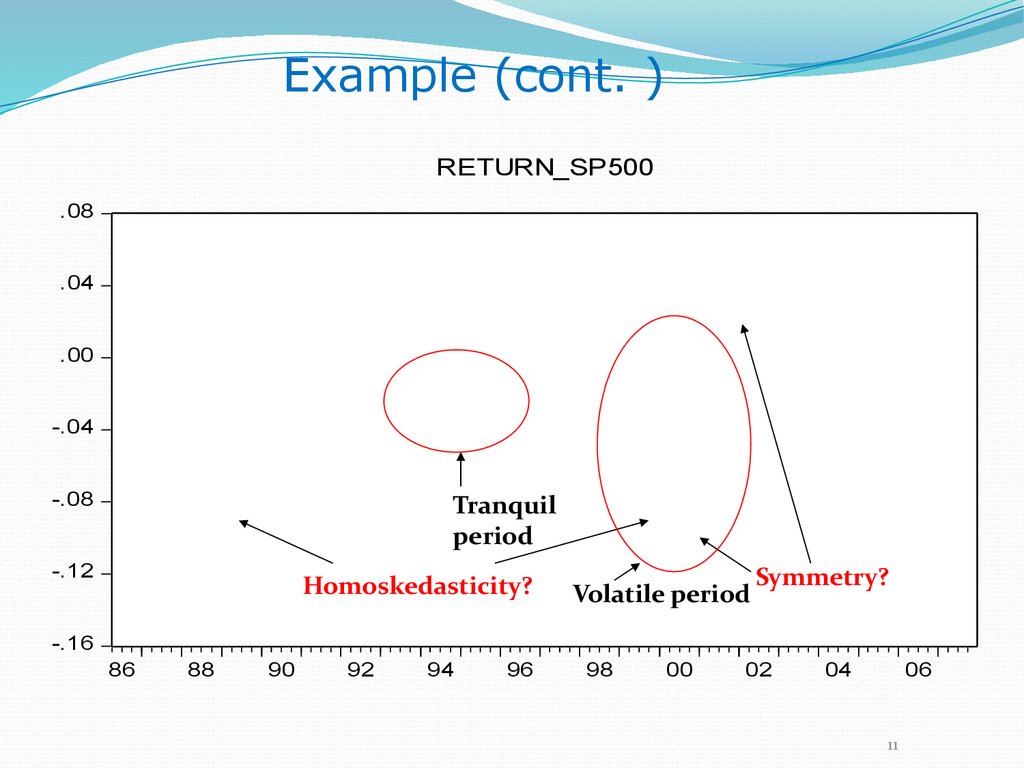
Example (cont.)Note:
RETURN_SP500
.08
.04
.00
-.04
Tranquil
period
-.08
Volatile period
-.12
-.16
86
88
90
92
94
96
98
00
02
04
06
10
11.
Example (cont. )RETURN_SP500
.08
.04
.00
-.04
-.08
Tranquil
period
-.12
Homoskedasticity?
Volatile period
Symmetry?
-.16
86
88
90
92
94
96
98
00
02
04
06
11
12.
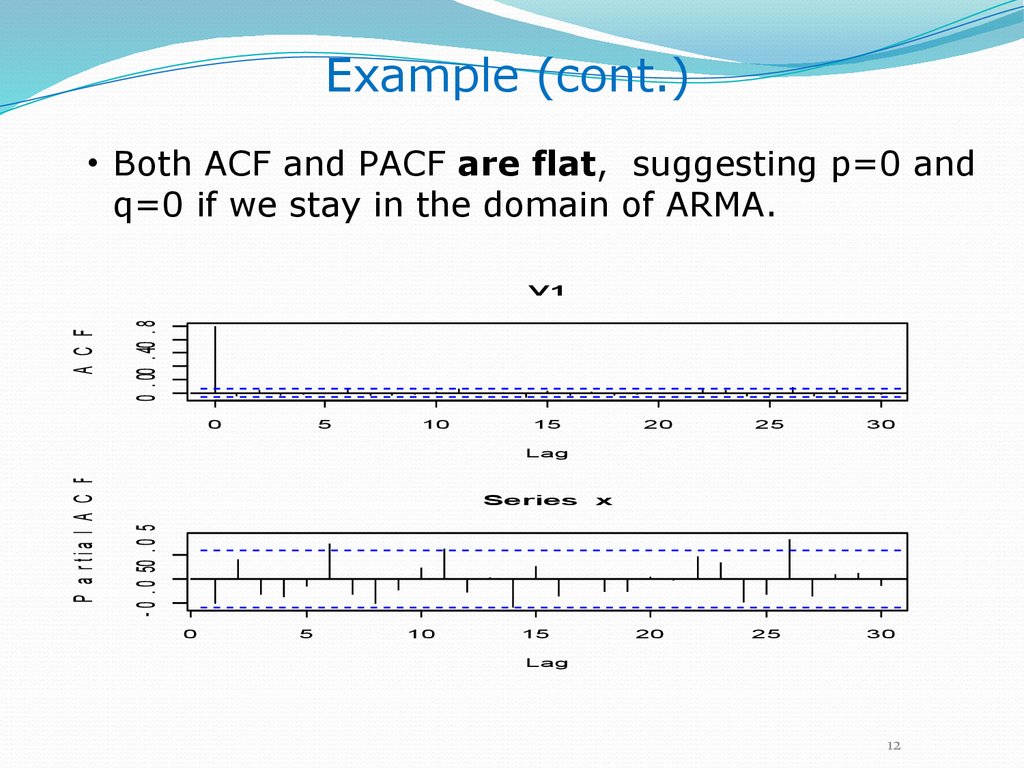
Example (cont.)• Both ACF and PACF are flat, suggesting p=0 and
q=0 if we stay in the domain of ARMA.
0 . 00 . 40 . 8
AC F
V1
0
5
10
15
20
25
30
25
30
Series
x
- 0 . 0 50 . 0 5
P a r tia l A C F
Lag
0
5
10
15
20
Lag
12
13.
Example (cont. )Look at the histogram and some summary statistics
of the data:
300
Series: RETURN_SP500
Sample 4/04/1986 12/21/2007
Observations 1133
250
200
150
100
50
Mean
Median
Maximum
Minimum
Std. Dev.
Skewness
Kurtosis
0.001647
0.003114
0.074923
-0.130071
0.021339
-0.713303
6.658444
Jarque-Bera
Probability
727.9250
0.000000
Asymmetry
Fat tails
0
-0.10
-0.05
0.00
0.05
Skewness= E[(y-m)3]/Var[y]3/2,
Kurtosis= E[(y-m)4]/Var[y]2
13
14. Skewness
• The shape of a uni-modal distribution can be symmetric orskewed to one side.
• If the bulk of the data is at the left and the right tail is longer, the
distribution is positively skewed; if the peak is toward the right and
the left tail is longer, the distribution is negatively skewed.
skewness = −0.5370
skewness = +0.5370
If skewness is less than −1 or greater than +1, the distribution is
highly skewed.
If skewness is between −1 and −½ or between +½ and +1, the
distribution is moderately skewed.
If skewness is between −½ and +½, the distribution is
approximately symmetric.
15. Kurtosis
• Kurtosis measures the height and sharpness of the peakrelative to the rest of the data .
• Higher values indicate a higher, sharper peak; lower values
indicate a lower, less distinct peak.
• Increasing kurtosis is associated with a movement of the
probability mass from the shoulders of a distribution into its
center and tails
Uniform(min=−√3,
max=√3)
kurtosis = 1.8,
excess = −1.2
Normal(μ=0, σ=1)
kurtosis = 3,
excess = 0
Logistic(α=0, β=0.55153)
kurtosis = 4.2,
excess = 1.2
16.
Remarks• Gaussian ARMA models are not able to generate
asymmetric or fat-tailed behavior.
• The previous time series plot shows that there are
turbulent periods where there is a sequence of
very large movements in returns and tranquil
periods where the magnitude of movements is
relatively small.
• This phenomenon is known as volatility
clustering, which highlights the property that the
volatility of financial returns is not constant over
time, but appears to come in bursts.
16
17.
Example• Variance of financial returns is often referred to as
volatility.
• To understand the dynamics of volatility, we can
examine the time series behavior of the squared
returns.
SQUARE_RET
.020
.016
.012
.008
.004
.000
86
88
90
92
94
96
98
00
02
04
06
17
18. EViews Example – Daily S&P 500 Returns
EViews Example – Daily S&P 500 Returns19. When we learn about GARCH(1,1)…
20. We’ll be able to make squared residuals white noise
21. Quality of TGARCH predictions: 1% quantiles, VaR(0.01), from August 1, 2007
22. 2. ARCH Models
23.
24.
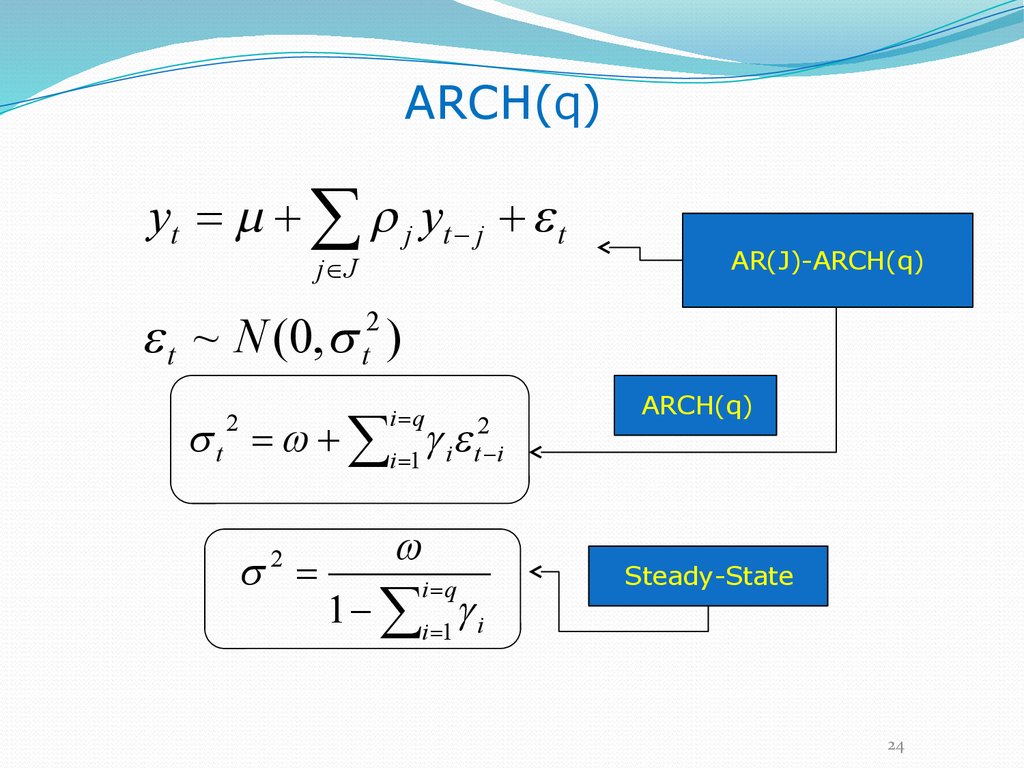
ARCH(q)yt m j yt j t
j J
AR(J)-ARCH(q)
t ~ N (0, t2 )
t i 1 i t2 i
i q
2
2
1 i 1 i
i q
ARCH(q)
Steady-State
24
25.
A special case: ARCH(1)yt t et ,
et ~ N (0,1)
t2 1 yt2 1
• Properties [It-1 = y1,..,yt-1]
E ( yt I t 1 ) 0
E ( yt2 I t 1 ) t2 1 yt2 1
yt2 ~ AR (1) with the AR coefficient γ1
• If 0 < 1 < 1, the ARCH(1) is covariance
stationary
2
2
• Kurtosis = 3(1 1 ) (1 3 1 ) > 3
E ( yt ys ) 0 for any t ¹ s but E ( yt2 yt2 1 ) ¹ 0
25
26.
Testing for the ARCH effects• Regress yt2 on yt2 1 ,..., yt2 q .
• Calculate T × R 2 , which is an LM statistic.
• Under the null hypothesis of no ARCH effect, its
asymptotical distribution is the chi-square with q
degrees of freedom.
• If there exist a value of q such that the LM statistic
is larger than the critical value of the chi-square with
q degrees of freedom, we reject the null hypothesis
of no ARCH effect.
• In practice, a large q may be needed.
26
27. 3. Extensions
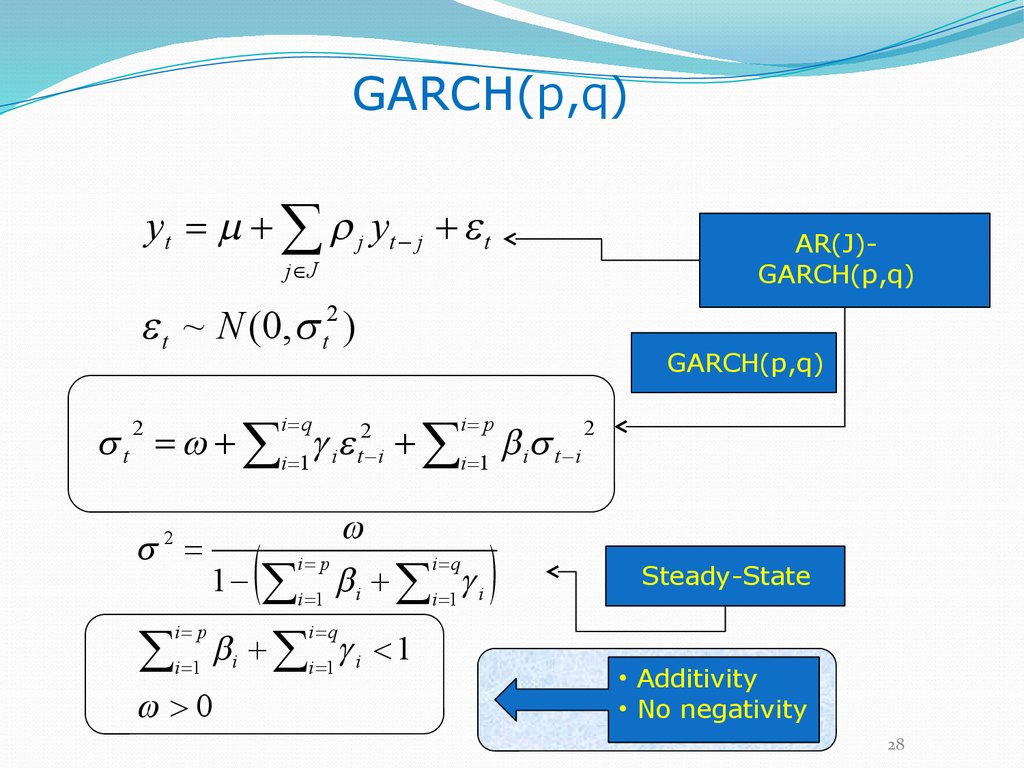
28.
GARCH(p,q)y t m j yt j t
AR(J)AR(J)-ARCH(q)
GARCH(p,q)
j J
t ~ N (0, t2 )
t i 1
i q
2
2
i p
i 1
1
2
i t i
GARCH(p,q)
i 1 i t i
i p
i 1
i i 1 i
i i 1 i < 1
>0
i p
i q
2
Steady-State
i q
• Additivity
• No negativity
28
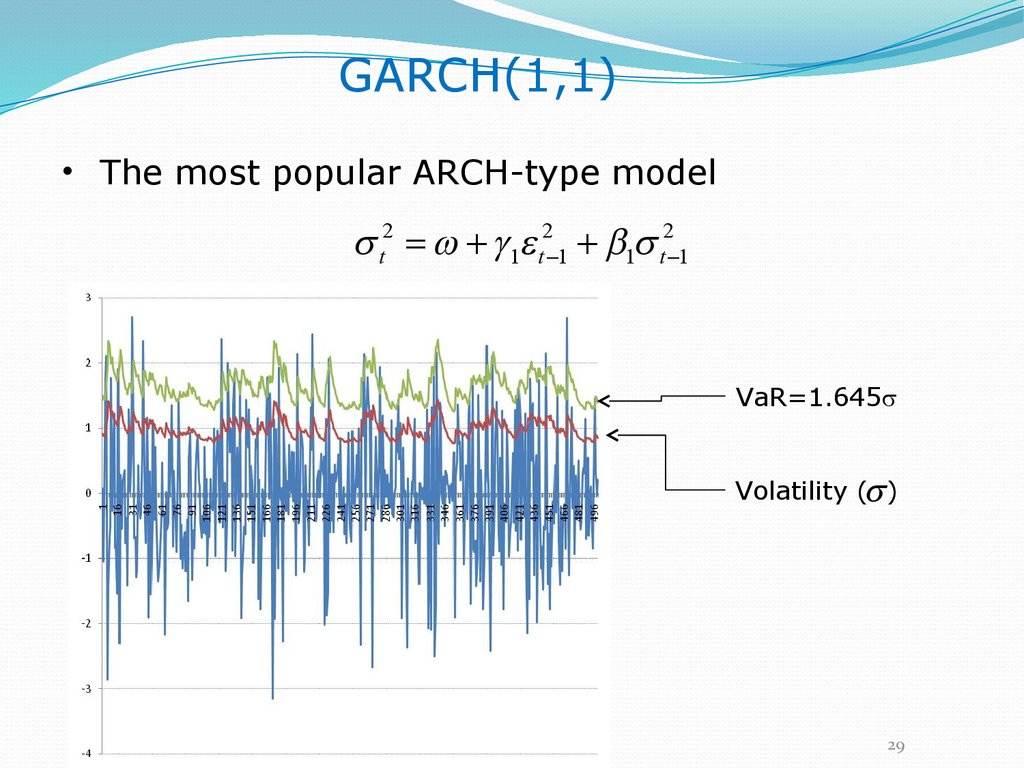
29.
GARCH(1,1)• The most popular ARCH-type model
t2 1 t2 1 1 t2 1
VaR=1.645
Volatility ( )
29
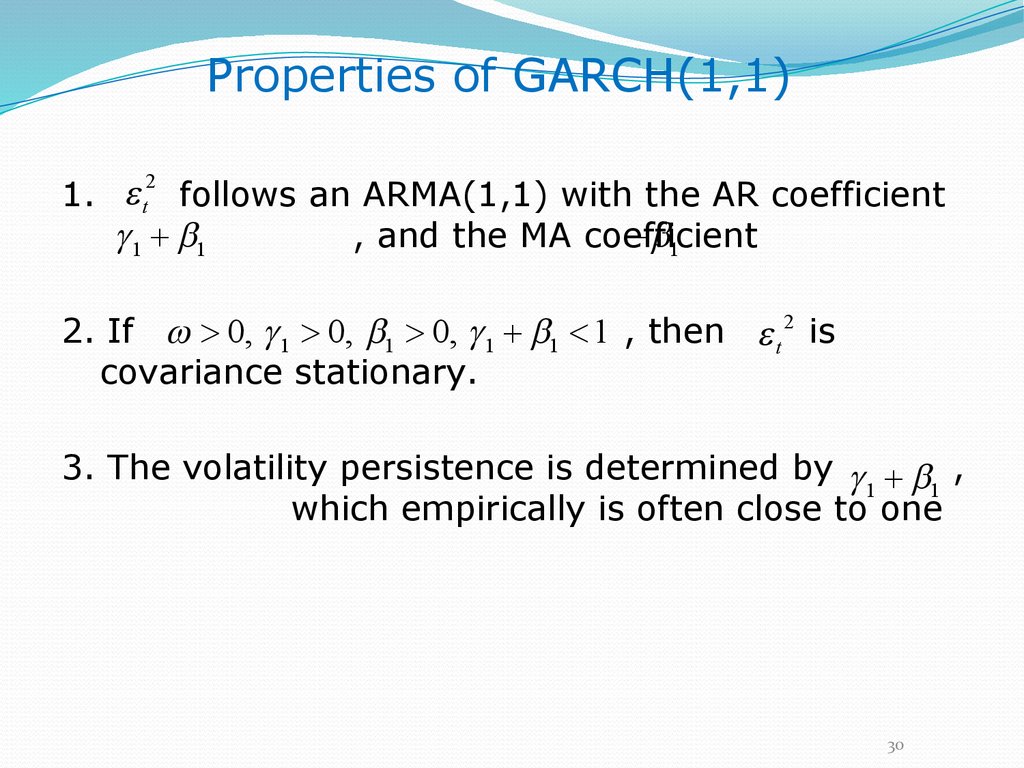
30.
Properties of GARCH(1,1)2
1. t follows an ARMA(1,1) with the AR coefficient
1 1
1
, and the MA coefficient
2. If > 0, 1 > 0, 1 > 0, 1 1 < 1 , then t 2 is
covariance stationary.
3. The volatility persistence is determined by ,
1
1
which empirically is often close to one
30
31. I-GARCH
If the coefficients of the GARCH model sum to1, then the model has “integrated” volatility.
This is similar to having a random walk, but in
volatility instead of the variable itself.
Model itself remains stationary (if constant
variance model is stationary)
Likelihood-based inference remains valid
(Lumsdaine, 1996 Econometrica)
i p
i 1
i i 1 i 1
i q
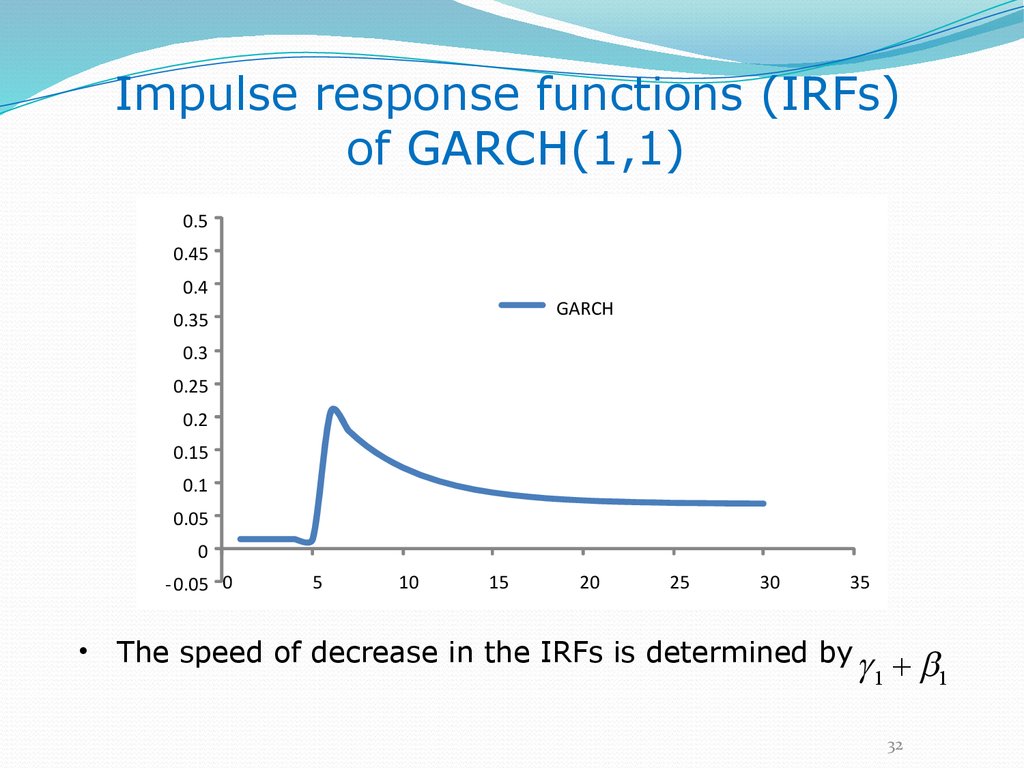
32.
Impulse response functions (IRFs)of GARCH(1,1)
0.5
0.45
0.4
GARCH
0.35
0.3
0.25
0.2
0.15
0.1
0.05
0
- 0.05 0
5
10
15
20
25
30
35
The speed of decrease in the IRFs is determined by
1
1
32
33.
News impact curve (NIC)• NIC: t2 as a function of t 1 holding
other variables constant.
The NIC of GARCH(1,1):
It is symmetric.
33
34.
Student t -- GARCH(1,1)• Student t -- GARCH(1,1)
yt t et
et ~ tv 0,1
t2 t2 1 yt2 1
1
1
where
et2 2
2
1
pdf et
1 / 2 / 2
x x 1 exp( )d
0
• Compared to the Gaussian GARCH, the
Student t-GARCH can generate fatter tails.
34
35.
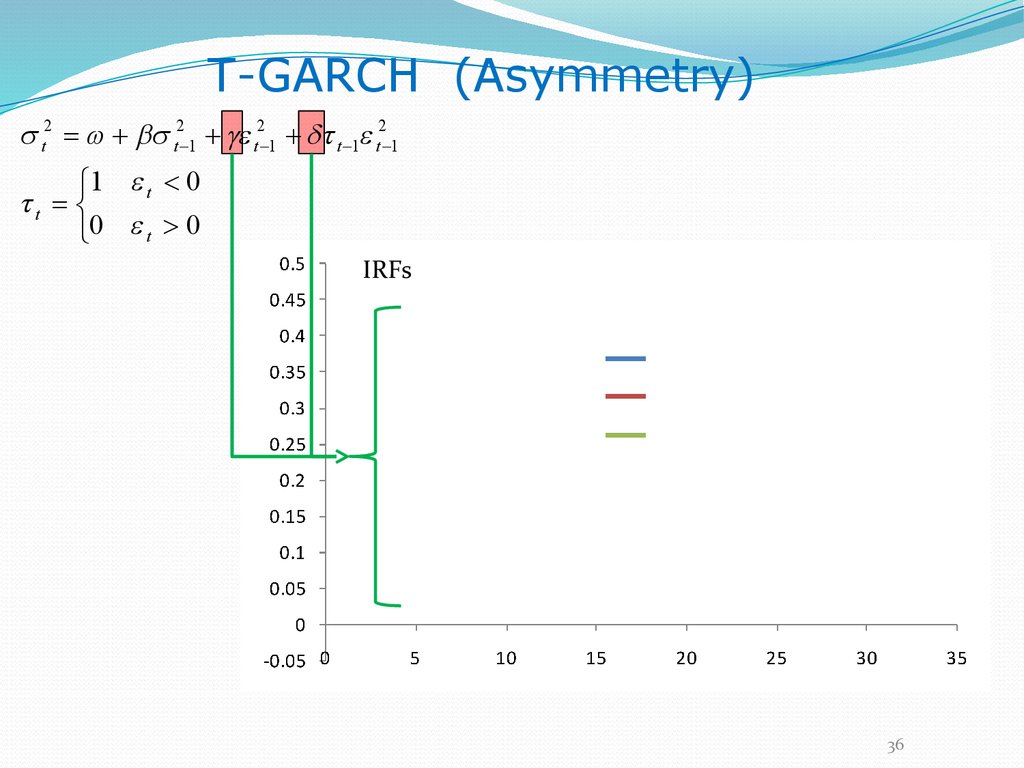
T-GARCH (Asymmetry)yt m j yt j t
j J
t ~ 0, t2
Threshold
t2 t2 1 t2 1 t 1 t2 1
1 t < 0
t
0 t > 0
Asymmetric
Volatility
• NIC is asymmetric.
• If
> 0 , bad news has a larger impact on the
future volatility then good news of the same
magnitude
• IRF depends on the type of news as well
35
36.
T-GARCH (Asymmetry)t2 t2 1 t2 1 t 1 t2 1
1 t < 0
t
0 t > 0
IRFs
36
37.
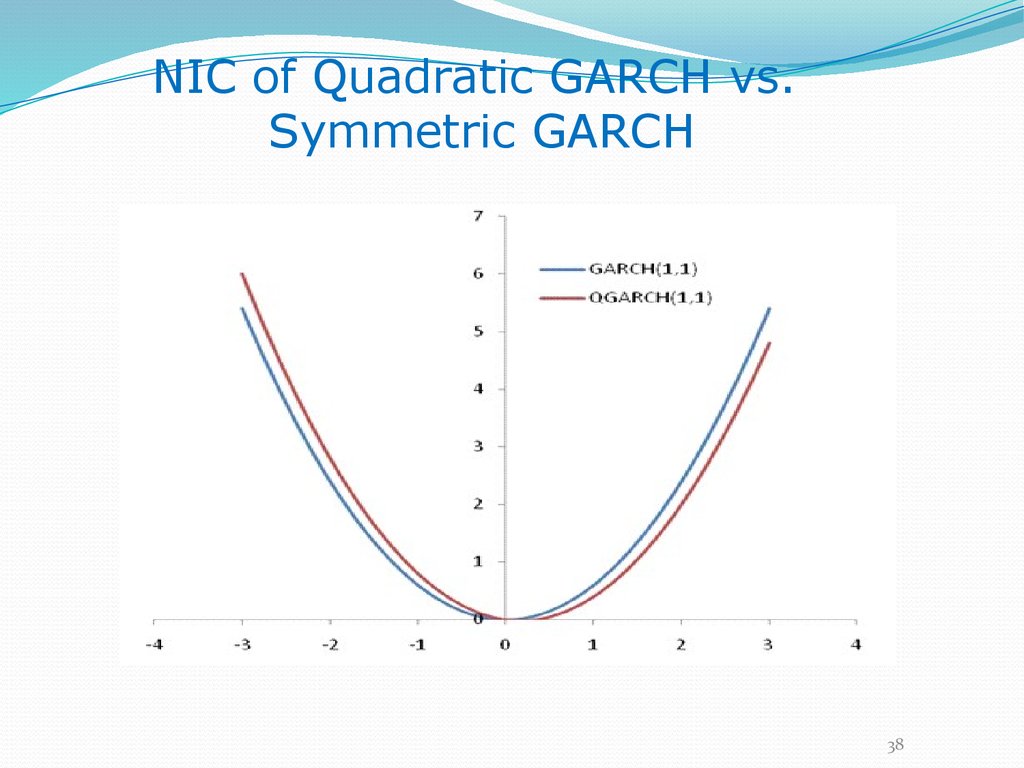
Q(uadratic)-GARCH (Asymmetry)y t m j yt j t
j J
t ~ 0, t2
t2 t2 1 t2 1 t 1
Asymmetric
Volatility
• NIC is asymmetric as long as
¹0
37
38.
NIC of Quadratic GARCH vs.Symmetric GARCH
38
39.
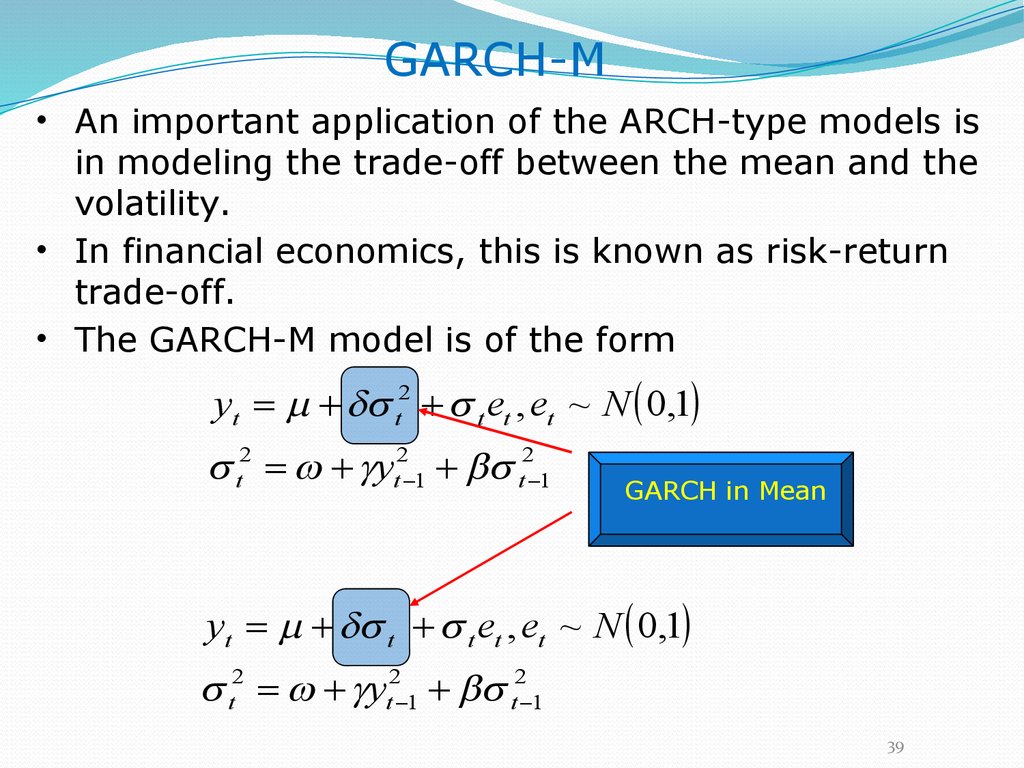
GARCH-M• An important application of the ARCH-type models is
in modeling the trade-off between the mean and the
volatility.
• In financial economics, this is known as risk-return
trade-off.
• The GARCH-M model is of the form
yt m t2 t et , et ~ N 0,1
t2 yt2 1 t2 1
GARCH in Mean
yt m t t et , et ~ N 0,1
t2 yt2 1 t2 1
39
40.
Box-Cox GARCH(1,1)yt t et
t 1
t 1 1
t 1 f et 1
f et 1 et 1 1et 1
• We model the power transformation of volatility.
• As long as ¹ 0 , NIC is asymmetric
• This is a non-linear model
40
41.
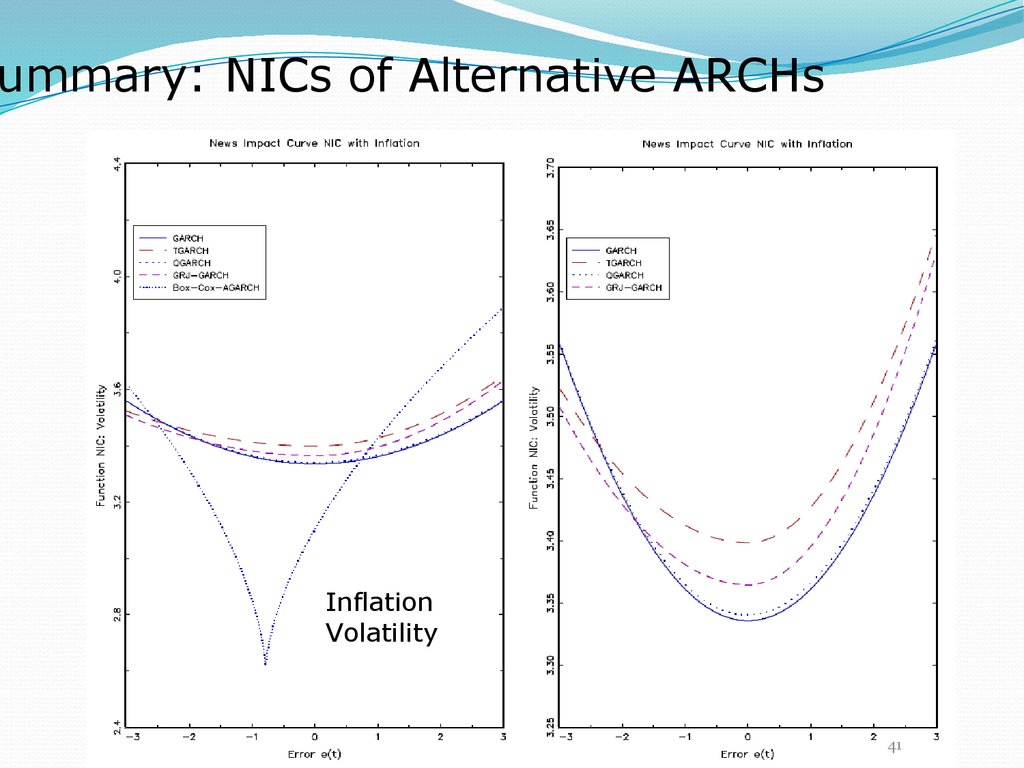
ummary: NICs of Alternative ARCHsInflation
Volatility
41
42. Summing up (see Appendix for an expanded list)
GARCH(1,1)T-GARCH(1,1)
Q-GARCH(1,1)
GARCH(1,1)-M (GJR)
Box-Cox GARCH(1,1)
t2 t2 1 t2 1
t2 t2 1 t2 1 t 1 t2 1
1 if t 1 0
t 1
0 if t 1 > 0
t2 t2 1 t2 1 t 1
t2 1 t 1 t2 1 t2 1 t 1 t2 1
0 if t 1 0
t 1
1 if t 1 > 0
t 1
t 1 1
t 1
t 1 f
t 1
f t 1 t 1 0 1 t 1 0
t 1 t 1
t 1
Asymmetric
Models
Non
linear
43. 3. Estimation
44. Maximum Likelihood
y f yl y , f y
t
t
t T
t
t
t 1
log l y t , L y t , t 1 log f y t
t T
L*
Maximize L(y, )
45. Maximum Likelihood (continued)
yt X t tht º var( t )
1
1
2
LogLikelihood log(ht ) ( yt X t ) / ht
2
2
The maximum likelihood decomposes in a
“mean” and a “variance” component. Estimation
has to be done numerically.
• Parameters for the mean can be estimated
consistently by OLS, but won’t be as efficient if
they don’t take account of heteroskedasticity.
• Note: we could have a non-normal error (e.g.,
Student-t or GED-density)
46. Optimization
Gradient and HillClimbing Techniques
Newton’s Method
Stochastic Newton Method
47. Multiple Solutions
Monte CarloGenetic Algorithms
48. 4. Multivariate models
49.
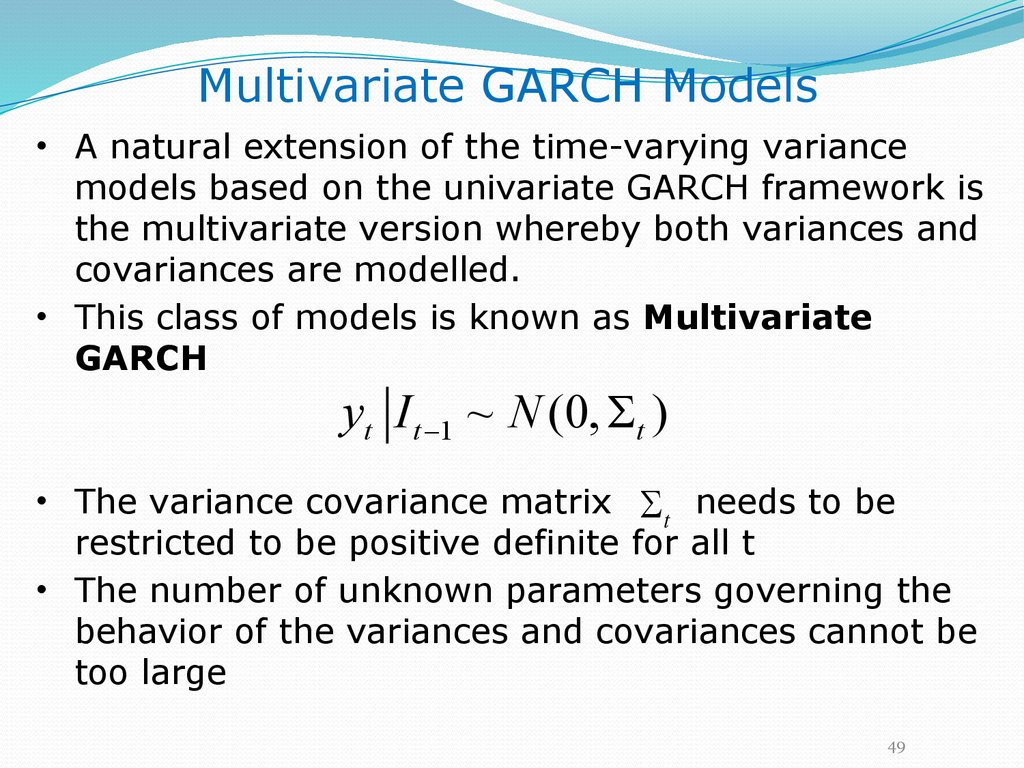
Multivariate GARCH Models• A natural extension of the time-varying variance
models based on the univariate GARCH framework is
the multivariate version whereby both variances and
covariances are modelled.
• This class of models is known as Multivariate
GARCH
yt I t 1 ~ N (0, St )
• The variance covariance matrix St needs to be
restricted to be positive definite for all t
• The number of unknown parameters governing the
behavior of the variances and covariances cannot be
too large
49
50.
Vech Model (2 variables)112 t 10 11 12t 1 12 1t 1 2t 1 13 22t 1 q11 112 t 1 q12 122 t 1 q13 222 t 1 ü
ï
2
2
2
2
2
2
12t 20 21 1t 1 22 1t 1 2t 1 23 2t 1 q 21 11t 1 q 22 12t 1 q 23 22t 1 ý
ï
222 t 30 31 12t 1 32 1t 1 2t 1 33 22t 1 q31 112 t 1 q32 122 t 1 q33 222 t 1 þ
• The conditional variance of each variable depends on
its own lagged value, on the lagged conditional
covariance, on the product of lagged squared errors
and errors.
• A large number of parameters (in this case, 21)
• Restrictions to ensure that S is positive definite are
t
complicated.
50
51.
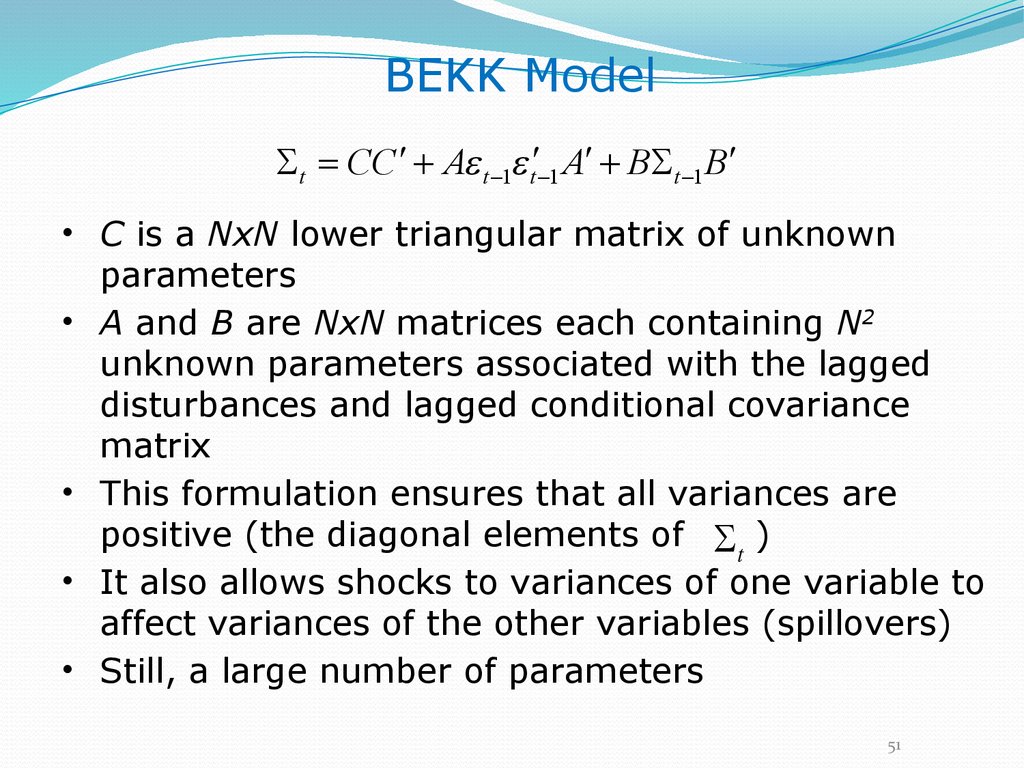
BEKK ModelSt CC ¢ A t 1 t¢ 1 A¢ BSt 1 B¢
• C is a NxN lower triangular matrix of unknown
parameters
• A and B are NxN matrices each containing N2
unknown parameters associated with the lagged
disturbances and lagged conditional covariance
matrix
• This formulation ensures that all variances are
positive (the diagonal elements of St )
• It also allows shocks to variances of one variable to
affect variances of the other variables (spillovers)
• Still, a large number of parameters
51
52.
Diagonal Vech Model (2 variables)ü
ï
2
2
12t 20 22 1t 1 2t 1 q 22 12t 1 ý
ï
222 t 30 33 22t 1 q33 222 t 1 þ
112 t 10 11 12t 1 q11 112 t 1
• Variances and covariances are GARCH(1,1)
• Parameters are now 9 instead of the 21 of the Vech
model.
• Restrictions imply that there are no interactions
among variances S
t
52
53.
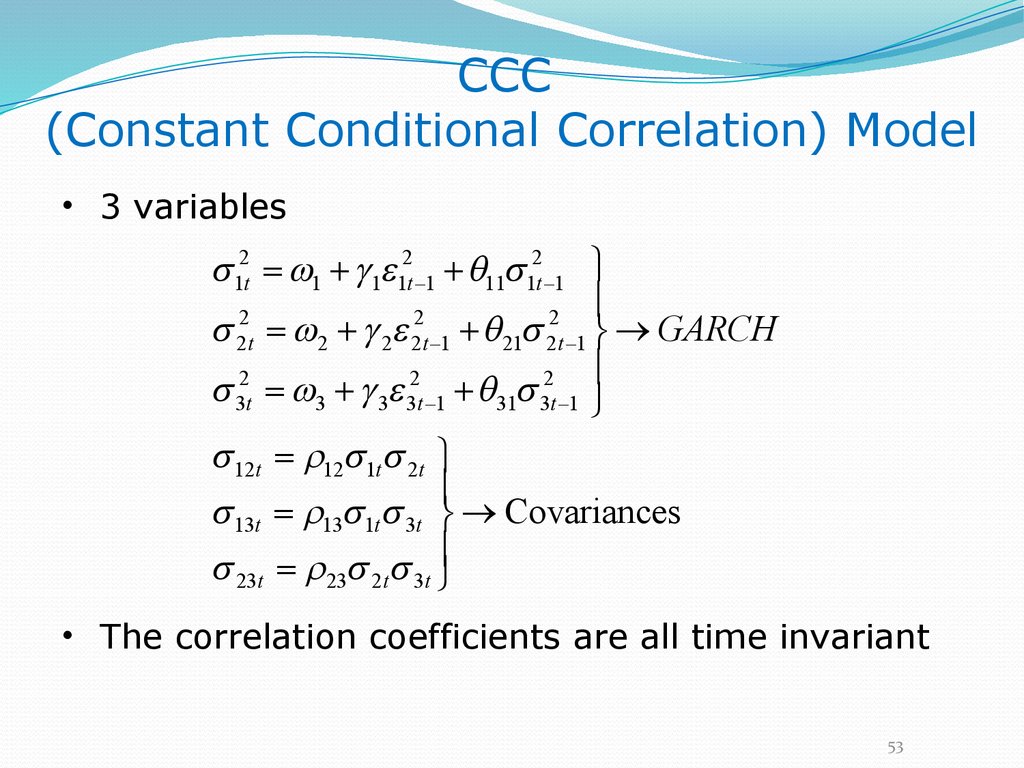
CCC(Constant Conditional Correlation) Model
• 3 variables
12t 1 1 12t 1 q11 12t 1 ü
ï
2
2
2
2t 2 2 2 t 1 q 21 2t 1 ý GARCH
ï
32t 3 3 32t 1 q31 32t 1 þ
12t 12 1t 2t ü
ï
13t 13 1t 3t ý Covariances
23t 23 2t 3t ïþ
• The correlation coefficients are all time invariant
53
54.
An extension: VAR + CCC• 3 variables
y1t 10 11 y1t 1 12 y2t 1 13 y3t 1 1t ü
ï
y2t 20 21 y1t 1 22 y2t 1 23 y3t 1 2t ý VAR
y3t 30 31 y1t 1 32 y2t 1 33 y3t 1 3t ïþ
12t 1 1 12t 1 q11 12t 1 ü
ï
2
2
2
2t 2 2 2t 1 q 21 2t 1 ý GARCH
ï
32t 3 3 32t 1 q31 32t 1 þ
12t 12 1t 2t ü
ï
13t 13 1t 3t ý Covariances
23t 23 2t 3t ïþ
54
55.
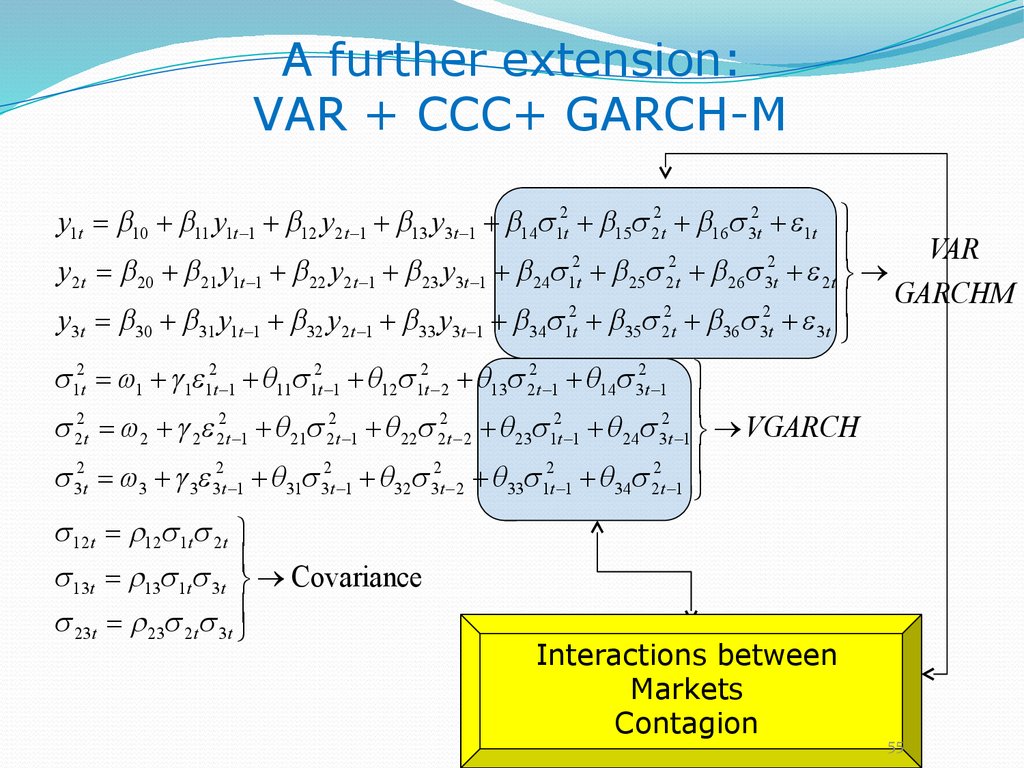
A further extension:VAR + CCC+ GARCH-M
y1t 10 11 y1t 1 12 y2t 1 13 y3t 1 14 12t 15 22t 16 32t 1t ü
ï
VAR
2
2
2
y2t 20 21 y1t 1 22 y2t 1 23 y3t 1 24 1t 25 2t 26 3t 2t ý
ï GARCHM
2
2
2
y3t 30 31 y1t 1 32 y2t 1 33 y3t 1 34 1t 35 2t 36 3t 3t þ
12t 1 1 12t 1 q11 12t 1 q12 12t 2 q13 22t 1 q14 32t 1 ü
ï
2
2
2
2
2
2
2t 2 2 2t 1 q 21 2t 1 q 22 2t 2 q 23 1t 1 q 24 3t 1 ý VGARCH
ï
32t 3 3 32t 1 q 31 32t 1 q 32 32t 2 q 33 12t 1 q 34 22t 1 þ
12t 12 1t 2t ü
ï
13t 13 1t 3t ý Covariance
23t 23 2t 3t ïþ
Interactions between
Markets
Contagion
55
56. An example of volatility “contagion’’
5657. 5. Application: Value-at-Risk (VaR)
58. VaR
What is the most I can lose on an investment?VaR tries to provide an answer.
It is used most often by commercial and
investment banks to capture the potential loss
in value of their traded portfolios from adverse
market movements over a specified period.
This potential loss can then be compared to
their available capital and cash reserves to
ensure that the losses can be covered without
putting the firms at risk.
VaR is applied widely in capital regulation
(Basel)
59. Value-at-Risk (VaR)
VaR summarizes the expected maximumloss over a time horizon within a given
confidence interval
The VaR approach tries to estimate the level
of losses that will be exceeded over a given
time period only with a certain (small)
probability
For example, the 95% VaR loss is the
amount of loss that will be exceeded only
5% of the time
59
60. Value-at-Risk (VaR) - Continued
The simplest assumption: daily gains/losses arenormally distributed and independent.
Calculate VaR from the standard deviation of the
portfolio change, σ, assuming the mean change in
the portfolio value is 0:
1-day VaR= N-1(X)σ, with X the confidence level.
The N-day VaR equals sqrt(N)
VaR.
times the 1-day
60
61. Measuring VaR with historical data
180180
69 occurrences out of 1380
160
160
140
140
120
120
100
100
5% Loss
Probability
80
80
60
60
40
40
20
20
0
0
-15
-12
-9
-6
-3
0
3
6
9
12
15
61
62. Assuming a Normal distribution
Assume that asset returns are normally distributedTheir behavior can be fully described in terms of mean and
standard deviation
Standard Deviation (σ)
0.45
0.40
0.35
Mean Return (μ)
0.30
0.25
0.20
0.15
0.10
0.05
0.00
-3.00
-2.50
-2.00
-1.50
-1.00
-0.50
0.00
0.50
1.00
1.50
2.00
2.50
3.00
62
63. VaR with Normally Distributed Returns
The probability of the return falling below acertain threshold depends on how many
standard deviations the threshold is below the
mean return
Threshold L* μ-1.0σ
μ-1.65σ
μ-2σ
μ-2.33σ
μ-3σ
Pr(loss>L*)
0.05
0.023
0.01
0.001
0.16
95% confidence
interval
99% confidence
interval
63
64. Portfolio VaR
When we have more than one asset in our portfolio wecan exploit the gains from diversification.
There are gains from diversification whenever the VaR for
the portfolio does not exceed the sum of the stand-alone
VaRs (i.e., the VaRs on the single assets).
The VaR for the portfolio equals the sum of the stand-
alone VaRs if and only if the securities’ returns are
uncorrelated.
64
65. An Example
Let us consider the following investmentUS$200 million invested in 5-year zero coupon US
Treasury
Examine VaR using a daily horizon
Assume that the mean daily return is 0.01%
Based on past several years of actual returns, the
standard deviation is = 0.295%.
65
66. An Example (cont.)
Suppose we want to compute the 95% VaR.The critical threshold is 1.65 standard deviations
below the mean, i.e.,
0.0001-1.65 • 0.00295=-0.00477
VaR = 0.00477 • 200m=0.95m
Expect to lose $0.95 million or more on 1 day in 20
66
67. An Example of Portfolio VaR
Two securities30-year zero-coupon U.S. Treasury bond
5-year zero-coupon U.S. Treasury bond
For simplicity assume that the expected return is zero
Invest US$100 million in the 30-year bond
Daily return volatility (std dev) 1 = 1.409%
Invest US$200 million in the 5-year bond
Daily return volatility (std dev) 2 = 0.295%
67
68. An Example of Portfolio VaR
– 95% confidence level– 30 year zero VaR
1.65 * 0.01409 * 100m = $2,325,000
– 5 year zero VaR
1.65 * 0.00295 * 200m = $974,000
• Sum of individual VaRs = US$ 3.299m
• But US$3.299 million is not the VaR for the
portfolio...why?
68
69. VaR of the Portfolio
Suppose the correlation between the two bonds is 12=0.88Remember that
2p w12 12 w22 22 2 w1w2 1, 2 1 2
Portfolio variance:
(100*0.01409)2 + (200*0.00295)2
+2(100*0.01409)(200*0.00295) * 0.88 = 3.797
• Portfolio standard deviation:
p $1.948m
• Portfolio VaR = 1.65 * 1.948m = $3.214m
• This is different from the sum of VaRs
69
70. The problem with Normality: Kurtosis
Extreme asset price changes occur more oftenthan the normal distribution predicts.
Excess kurtosis (fat tails)
0.45
0.40
0.35
0.30
0.25
0.20
0.15
0.10
0.05
0.00
-3.00
-2.50
-2.00
-1.50
-1.00
-0.50
0.00
0.50
1.00
1.50
2.00
2.50
3.00
70
71. Fat Tails and underestimation of VaR
If we assume that returns are normally distributedwhen they are not, we underestimate the VaR
VaR with
normal
returns
VaR with
actual return
distribution
0.45
0.40
0.35
0.30
0.25
0.20
0.15
0.10
0.05
0.00
-3.00
-2.50
-2.00
-1.50
-1.00
-0.50
0.00
0.50
1.00
1.50
2.00
2.50
3.00
71
72. Backtesting
Model backtesting involves systematic comparisonsof the calculated VaRs with the subsequent realized
profits and losses.
With a 95% VaR bound, expect 5% of losses
greater than the bound
Example: Approximately 12 days out of 250
trading days
If the actual number of exceptions is
“significantly” higher than the desired
confidence level, the model may be
inaccurate.
Therefore, in additional to the risk predicted by the
VaR, there is also “model risk”
72
73. Relevance: Basel VaR Guidelines
VaR computed daily, holding period is 10 days.The confidence interval is 99 percent
Banks are required to hold capital in proportion to the
losses that can be expected to occur more often than once
every 100 periods
At least 1 year of data to calculate parameters
Parameter estimates updated at least quarterly
Capital provision is the greater of
Previous day’s VAR
3 times the average of the daily VAR for the preceding 60
business days plus a factor based on backtesting results
73
74. Summing up
A host of research has examineda. how best to compute VaR with assumptions
other than the standardized normal
b. How to obtain more reliable variance and
covariance values to use in the VaR
calculations.
Here Multivariate GARCH models play an
important role in assessing both portfolio
risk and diversification benefits.
We will see this in the forthcoming workshop