


 Экономика
Похожие презентации:


Growth theory: the economy in the very long run
1. Growth Theory: The Economy in the Very Long Run
GROWTH THEORY:THE ECONOMY IN
THE VERY LONG
RUN
a
P
I
I
I
rt
2.
Dr.S.Sh.Sagandyko
va
Prepared by:
MACROECONOMICS
LECTURE
8
___
ECONOMIC GROWTH I:
CAPITAL ACCUMULATION
&
POPULATION GROWTH
3.
Outline8-1 The Accumulation of Capital
8-2 The Golden Rule Level of Capital
8-3 Population Growth
4.
OutlineAffect
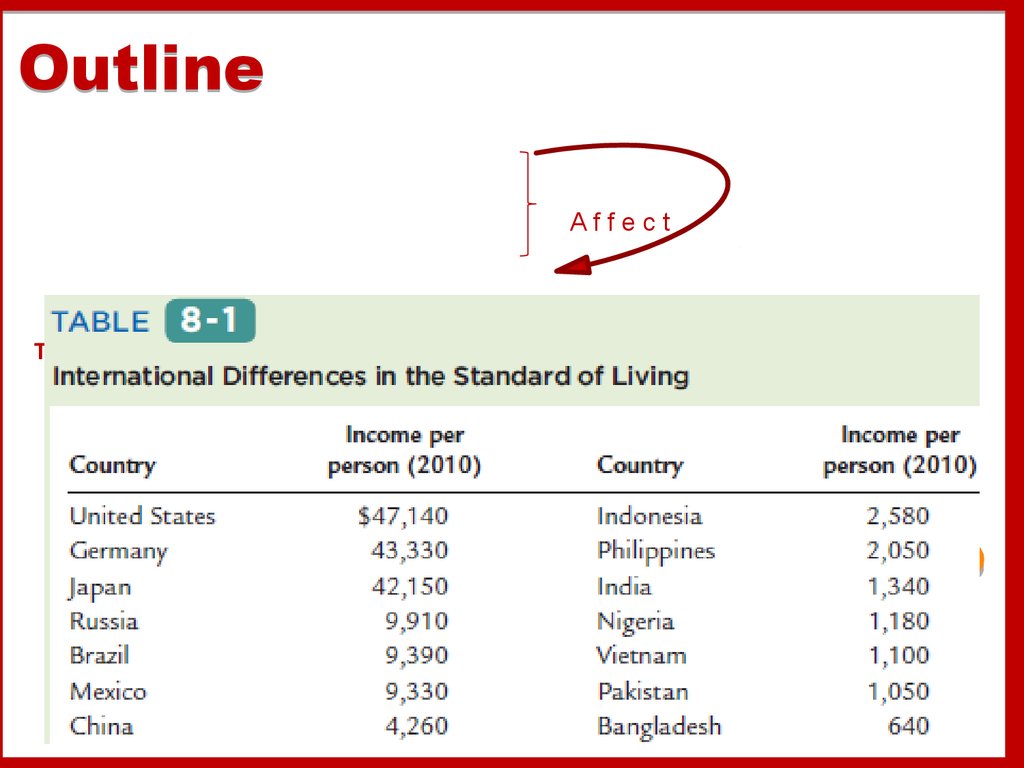
The Solow growth model shows how
1. saving,
2. population growth,
3. technological progress
•. Level & Growth of output
5. Income and poverty in the world selected countries, 2010
100Zambia
90
% of population living onNigeria
$2/day or less
80
Senegal
70
60
50
40
30
Indonesia
Kyrgyz
Republic
Georgia
Peru
Panama
Mexico
20
Poland
10
0
$0
Uruguay
$2,000
$4,000
$6,000
$8,000
$10,000
Income per capita in U.S. dollars
$12,000
$14,000
6. 8-1 The Accumulation of Capital
The Supply and Demand for GoodsGrowth in the Capital Stock and the Steady State
Approaching the Steady State: A Numerical Example
How Saving Afects Growth
8-1 The Accumulation of Capital
The Supply in the Solow model is based on
the PF:
Y = F(K, L).
Assumption:
• the PF has constant returns to scale:
zY = F(zK, zL), for any positive number z.
If z = 1/L →
Y/L = F(K/L, 1).
7. 8-1 The Accumulation of Capital
The Supply and Demand for GoodsGrowth in the Capital Stock and the Steady State
Approaching the Steady State: A Numerical Example
How Saving Afects Growth
8-1 The Accumulation of Capital
y = Y/L is output per worker
Y/L = F(K/L, 1)
k = K/L is capital per worker
f(k) = F(k, 1)
y = f(k)
MPK = f(k + 1) − f(k)
k is low →
the average worker has only a little capital →
an extra unit of capital is very useful and →
He produces a lot of additional output.
k is high →
the average worker has a lot of capital already, →
so an extra unit increases production only slightly.
8. The Production Function
The PFshows
how the
amount
of capital
per
worker k
determin
es the
amount
of output
per
worker y
= f (k).
9. 8-1 The Accumulation of Capital
The Supply and Demand for GoodsGrowth in the Capital Stock and the Steady State
Approaching the Steady State: A Numerical Example
How Saving Afects Growth
8-1 The Accumulation of Capital
Output per worker y is divided between consumption per
worker c and investment per worker i:
y = c + i.
G - we can ignore here and NX – we assumed a closed
economy.
The Solow model assumes that people
1. save a fraction s of their income
2. consume a fraction (1 − s).
•. We can express this idea with the following CF:
c = (1 − s)y,
0 < s (the saving rate) < 1
Gnt. policies can influence a nation’s s
What s is desirable ?
10. 8-1 The Accumulation of Capital
The Supply and Demand for GoodsGrowth in the Capital Stock and the Steady State
Approaching the Steady State: A Numerical Example
How Saving Afects Growth
8-1 The Accumulation of Capital
Assamption:
We take the saving rate s as given.
To see what this CF implies for I,
we substitute (1 − s)y for c
in the national income accounts identity:
y = (1 − s)y + i =>
i = sy
s is the fraction of y devoted to i.
11. 8-1 The Accumulation of Capital
The Supply and Demand for GoodsGrowth in the Capital Stock and the Steady State
Approaching the Steady State: A Numerical Example
How Saving Afects Growth
8-1 The Accumulation of Capital
The 2 main ingredients of the Solow model—
the PF and the CF.
For any given capital stock k,
• y = f(k)
determines how much Y the economy
produces, and
• s (i = sy)
determines the allocation of that Y between
C & I.
12. 8-1 The Accumulation of Capital
The Supply and Demand for GoodsGrowth in the Capital Stock and the Steady State
Approaching the Steady State: A Numerical Example
How Saving Afects Growth
8-1 The Accumulation of Capital
The capital stock (CS) is a key determinant of output,
its changes can lead to economic growth.
2 forces influence the CS.
Investment is expenditure on new plant and equipment,
and it causes the CS to rise.
Depreciation is the wearing out of old capital, and it
causes the CS to fall.
Investment per worker i = sy
We can express i as a function of the CS per worker:
i = sf(k).
This equation relates the existing CS k to the
accumulation of new capital i.
13. Output, Consumption, and Investment
The saving rate s determines the allocation of output between C & I.
For any level of capital k,
• output is f (k), investment is sf(k), and consumption is f (k) -sf(k).
14.
== thethe rate
rate of
of depreciation
depreciation
== the
the fraction
fraction of
of the
the capital
capital stock
stock that
that
wears
wears out
out each
each period
period
Depreciation is a constant fraction of the CS wears out every year.
Depreciation is therefore proportional to the capital stock.
15. Capital accumulation
The basic idea: Investment increases thecapital stock, depreciation reduces it.
Change in capital stock = investment – depreciation
k
=
i –
k
Since i = sf(k) , this becomes:
k = s f(k) – k
16. The equation of motion for k
k = s f(k) – kThe Solow model’s central equation
Determines behavior of capital over time…
…which, in turn, determines behavior of
all of the other endogenous variables
because they all depend on k.
E.g.,
income per person:
y = f(k)
consumption per person: c = (1–s) f(k)
17. The steady state
k = s f(k) – kIf investment is just enough to cover
depreciation
[sf(k) = k ],
then capital per worker will remain constant:
k = 0.
This occurs at one value of k, denoted k*,
called the steady state capital stock.
18. The steady state
Investmentand
depreciation
k
sf(k)
k*
Capital per
worker, k
19. Moving toward the steady state
Investmentand
depreciation
k = sf(k) k
k
sf(k)
k
investment
depreciation
k1
k*
Capital per
worker, k
20. Moving toward the steady state
Investmentand
depreciation
k = sf(k) k
k
sf(k)
k
k1 k2
k*
Capital per
worker, k
21. Moving toward the steady state
Investmentand
depreciation
k = sf(k) k
k
sf(k)
k
investment
depreciation
k2
k*
Capital per
worker, k
22. Moving toward the steady state
Investmentand
depreciation
k = sf(k) k
k
sf(k)
k
k2 k3 k*
Capital per
worker, k
23. Moving toward the steady state
Investmentand
depreciation
k = sf(k) k
k
sf(k)
Summary:
Summary:
As
As long
long as
as kk << kk**,,
investment
investment will
will exceed
exceed
depreciation,
depreciation,
and
and kk will
will continue
continue to
to
grow
grow toward
toward kk**..
k3 k*
Capital per
worker, k
24. Moving toward the steady state
Now you try:Draw the Solow model diagram,
labeling the steady state k*.
On the horizontal axis, pick a value greater
than k* for the economy’s initial capital stock.
Label it k1.
Show what happens to k over time.
Does k move toward the steady state or
away from it?
25. Moving toward the steady state
A numerical exampleProduction function (aggregate):
Y = F (K , L ) = K ´ L = K 1 / 2L1 / 2
To derive the per-worker production function,
divide through by L:
1/2
1/2 1/2
Y K L
æK ö
=
=ç ÷
L
L
èL ø
Then substitute y = Y/L and k = K/L to get
y = f (k ) = k 1 / 2
26. Now you try:
A numerical example, cont.Assume:
s = 0.3
= 0.1
initial value of k = 4.0
27. A numerical example
Approaching the steady state:A numerical example
Assumptions:
y = k;
s = 0.3; = 0.1; initial k = 4.0
Year
Year
11
22
33
kk yy cc ii kk kk
4.000
4.000 2.000
2.000 1.400
1.400 0.600
0.600 0.400
0.400 0.200
0.200
4.200
4.200 2.049
2.049 1.435
1.435 0.615
0.615 0.420
0.420 0.195
0.195
4.395
4.395 2.096
2.096 1.467
1.467 0.629
0.629 0.440
0.440 0.189
0.189
4
…
10
…
25
…
100
…
4.584 2.141 1.499 0.642 0.458 0.184
5.602 2.367 1.657 0.710 0.560 0.150
7.351 2.706 1.894 0.812 0.732 0.080
8.962 2.994 2.096 0.898 0.896 0.002
9.000 3.000 2.100 0.900 0.900 0.000
28. A numerical example, cont.
Exercise: Solve for the steadystate
Continue to assume
s = 0.3, = 0.1, and y = k 1/2
Use the equation of motion
k = s f(k) k
to solve for the steady-state values of k, y, and c.
29. Approaching the steady state: A numerical example
Solution to exercise:k = 0
s f (k *) = k *
0.3 k * = 0.1k *
def. of steady state
eq'n of motion with k = 0
using assumed values
k*
3=
= k*
k*
Solve to get: k * = 9
and y * = k * = 3
Finally, c * = (1 s )y * = 0.7 ´ 3 = 2.1
30. Exercise: Solve for the steady state
An increase in the saving rateAn increase in the saving rate raises investment…
…causing k to grow toward a new steady state:
Investment
and
depreciation
k
s2 f(k)
s1 f(k)
k 1*
k 2*
k
31. Solution to exercise:
Prediction:Higher s higher k*.
And since y = f(k) ,
higher k* higher y* .
Thus, the Solow model predicts that
countries with higher rates of saving and
investment
will have higher levels of capital and
income per worker in the long run.
32. An increase in the saving rate
International evidence on investment ratesand income per person
Income per 100,000
person in
2000
(log scale)
10,000
1,000
100
0
5
10
15
20
25
30
35
Investment as percentage of output
(average 1960-2000)
33. Prediction:
The Golden Rule: IntroductionDifferent values of s lead to different steady states.
How do we know which is the “best” steady state?
The “best” steady state has the highest possible
consumption per person: c* = (1–s) f(k*).
An increase in s
1. leads to higher k* and y*, which raises c*
2. reduces consumption’s share of income (1–s),
which lowers c*.
So, how do we find the s and k* that maximize c*?
34. International evidence on investment rates and income per person
The Golden Rule capital stock*
k gold
= the Golden Rule level of capital,
the steady state value of k
that maximizes consumption.
To find it, first express c* in terms of k*:
c*
=
i*
y*
= f (k*)
i*
= f (k )
k
*
*
In the steady state:
i* = k*
because k = 0.
35. The Golden Rule: Introduction
The Golden Rule capital stocksteady state
output and
depreciation
Then,
Then, graph
graph
f(k
f(k**)) and
and kk**,,
look
look for
for the
the
point
point where
where
the
the gap
gap between
between
them
them is
is biggest.
biggest.
*
*
y gold
= f (k gold
)
k*
f(k*)
*
c gold
*
*
i gold
= k gold
*
k gold
steady-state
capital per
worker, k*
36. The Golden Rule capital stock
cc** == f(k
f(k**)) k
k**
is
is biggest
biggest where
where
the
the slope
slope of
of the
the
production
production
function
function
equals
equals
the
the slope
slope of
of the
the
depreciation
depreciation line:
line:
k*
f(k*)
*
c gold
MPK =
*
k gold
steady-state
capital per
worker, k*
37. The Golden Rule capital stock
The transition to theGolden Rule steady state
The economy does NOT have a tendency to move
toward the Golden Rule steady state.
Achieving the Golden Rule requires that
policymakers adjust s.
This adjustment leads to a new steady state with
higher consumption.
But what happens to consumption
during the transition to the Golden Rule?
38. The Golden Rule capital stock
Starting with too much capital*
If k * > k gold
then
then increasing
increasing
cc** requires
requires aa
fall
fall in
in ss..
In
In the
the transition
transition
to
to the
the Golden
Golden
Rule,
Rule,
consumption
consumption is
is
higher
higher at
at all
all
points
points in
in time.
time.
y
c
i
t0
time
39. The transition to the Golden Rule steady state
Starting with too little capital*
If k * < k gold
then
then increasing
increasing
cc** requires
requires an
an
increase
increase in
in ss..
Future
Future
generations
generations
enjoy
enjoy higher
higher
consumption,
consumption,
but
but the
the current
current
one
one experiences
experiences
an
an initial
initial drop
drop
in
in consumption.
consumption.
y
c
i
t0
time
40. Starting with too much capital
Population growthAssume that the population (and labor force) grow at rate n.
exogenous.)
(n is
EX: Suppose L = 1,000 in year 1 and the population is growing at 2%
per year (n = 0.02).
Then L = n L = 0.02 ´ 1,000 = 20,
so L = 1,020 in year 2.
L
= n
L
41. Starting with too little capital
Break-even investment( + n)k = break-even investment,
the amount of investment necessary
to keep k constant.
Break-even investment includes:
k to replace capital as it wears out
n k to equip new workers with capital
(Otherwise, k would fall as the existing capital
stock would be spread more thinly over a larger
population of workers.)
42. Population growth
The equation of motion for kWith population growth,
the equation of motion for k is
k = s f(k) ( + n) k
actual
investment
break-even
investment
43. Break-even investment
The Solow model diagramInvestment,
break-even
investment
k = s f(k) ( +n)k
( + n ) k
sf(k)
k*
Capital per
worker, k
44. The equation of motion for k
The impact of population growthInvestment,
break-even
investment
( +n2) k
( +n1) k
An
An increase
increase in
in nn
causes
causes an
an
increase
increase in
in breakbreakeven
even investment,
investment,
leading to a lower
steady-state level
of k.
sf(k)
k2*
k1* Capital per
worker, k
45. The Solow model diagram
Prediction:Higher n lower k*.
And since y = f(k) ,
lower k* lower y*.
Thus, the Solow model predicts that countries with higher population
growth rates will have lower levels of capital and income per worker in
the long run.
46. The impact of population growth
International evidence on populationgrowth and income per person
Income 100,000
per Person
in 2000
(log scale)
10,000
1,000
100
0
1
2
3
4
5
Population Growth
(percent per year; average 1960-2000)
47. Prediction:
The Golden Rule with population growthTo find the Golden Rule capital stock,
express c* in terms of k*:
c* =
y*
= f (k* )
i*
( + n) k*
c* is maximized when
MPK = + n
or equivalently,
MPK = n
In
In the
the Golden
Golden
Rule
Rule steady
steady state,
state,
the
the marginal
marginal product
product
of
of capital
capital net
net of
of
depreciation
depreciation equals
equals
the
the population
population
growth
growth rate.
rate.
48. International evidence on population growth and income per person
Alternative perspectives onpopulation growth
The Malthusian Model (1798)
Predicts population growth will outstrip the Earth’s ability to produce food,
leading to the impoverishment of humanity.
Since Malthus, world population has increased sixfold, yet living standards are
higher than ever.
Malthus omitted the effects of technological progress.
49. The Golden Rule with population growth
Alternative perspectives onpopulation growth
The Kremerian Model (1993)
Posits that population growth contributes to economic growth.
More people = more geniuses, scientists & engineers, so faster
technological progress.
Evidence, from very long historical periods:
As world pop. growth rate increased, so did rate of growth in living
standards
Historically, regions with larger populations have enjoyed faster
growth.
50. Alternative perspectives on population growth
Chapter Summary1.
The Solow growth model shows that, in the long run, a country’s
standard of living depends
positively on its saving rate
negatively on its population growth rate
2.
An increase in the saving rate leads to
higher output in the long run
faster growth temporarily
but not faster steady state growth.
CHAPTER 7
Economic Growth I
slide 52
51. Alternative perspectives on population growth
Chapter Summary3.
If the economy has more capital than the Golden Rule level, then
reducing saving will increase consumption at all points in time,
making all generations better off.
If the economy has less capital than the Golden Rule level, then
increasing saving will increase consumption for future
generations, but reduce consumption for the present generation.
CHAPTER 7
Economic Growth I
slide 53