


 Английский язык
 Социология
Похожие презентации:


Technical writing
1.
Technicalwriting
2.
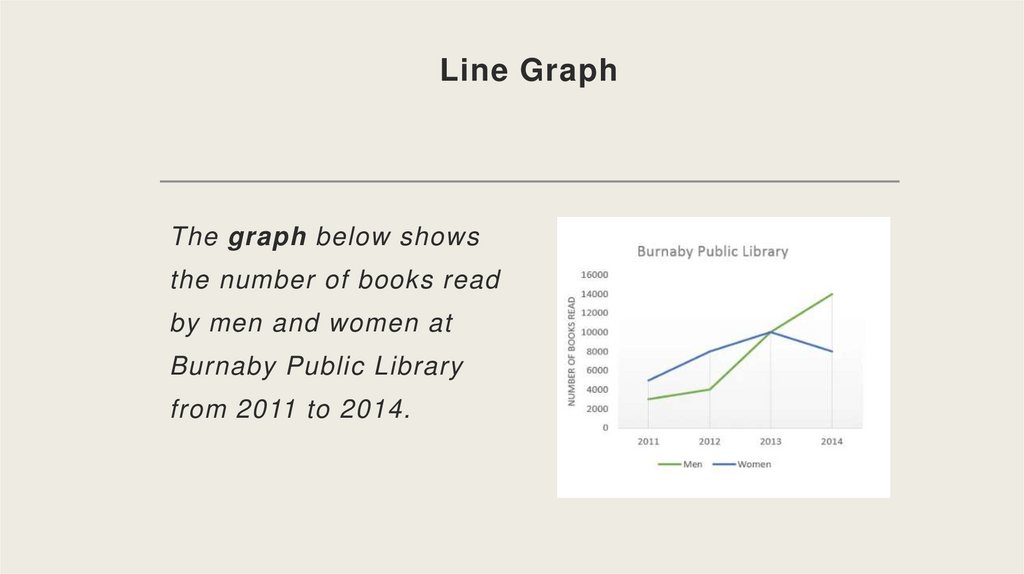
Line GraphThe graph below shows
the number of books read
by men and women at
Burnaby Public Library
from 2011 to 2014.
3.
Table chartThe table shows data
about underground railway
systems in six major cities
with date opened,
kilometres of route and
passenger numbers per
year in millions.
4.
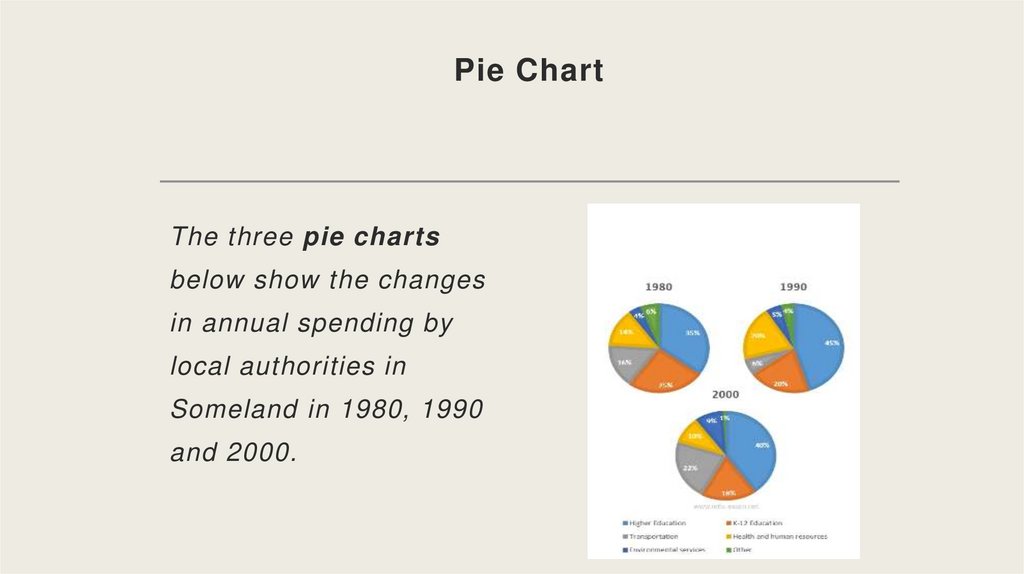
Pie ChartThe three pie charts
below show the changes
in annual spending by
local authorities in
Someland in 1980, 1990
and 2000.
5.
Bar ChartThe bar chart below
shows female
unemployment rates in
each country of the
United Kingdom in 2013
and 2014.
6.
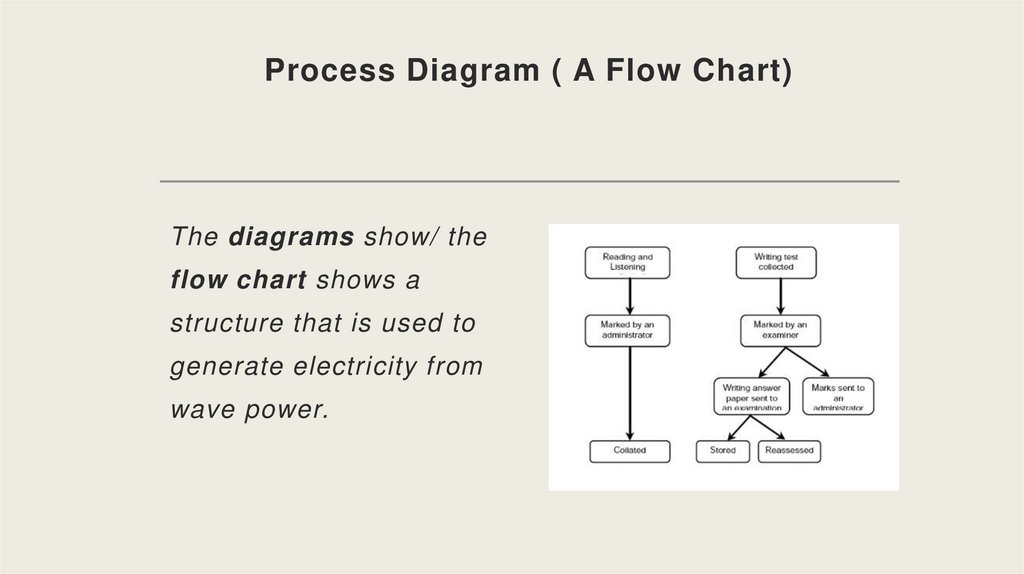
Process Diagram ( A Flow Chart)The diagrams show/ the
flow chart shows a
structure that is used to
generate electricity from
wave power.
7.
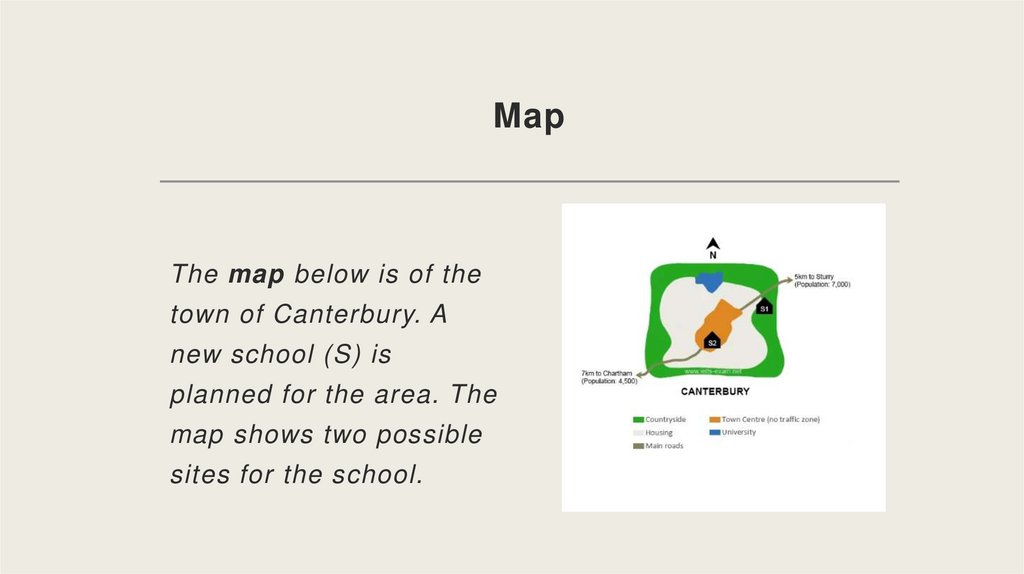
MapThe map below is of the
town of Canterbury. A
new school (S) is
planned for the area. The
map shows two possible
sites for the school.