


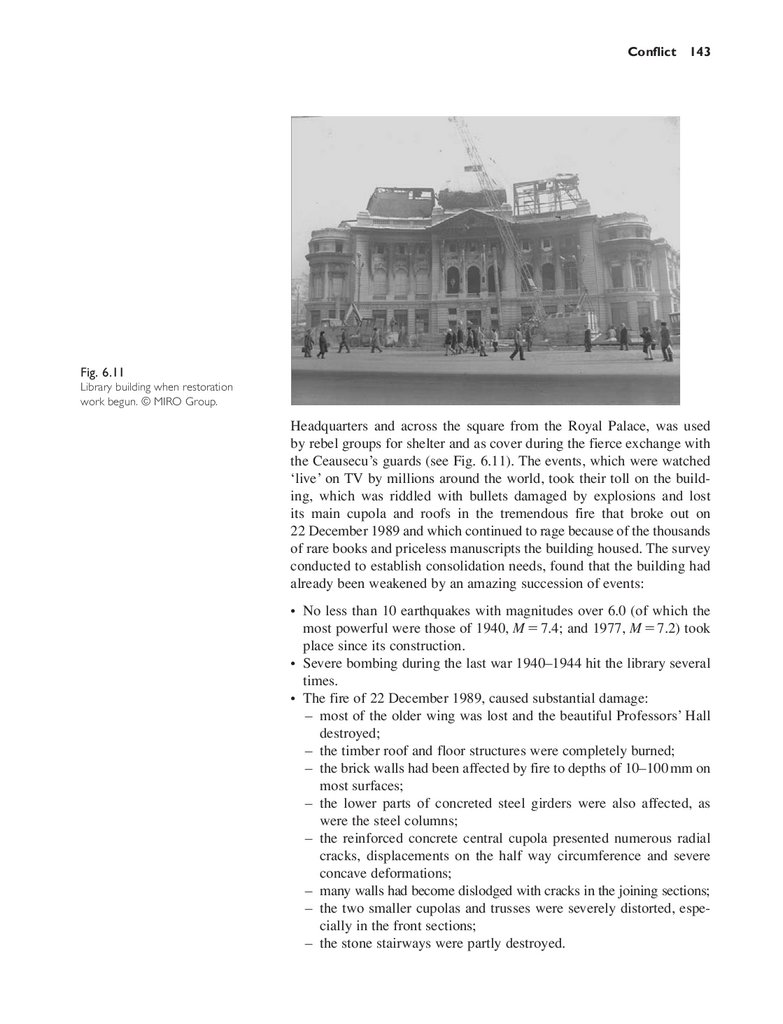
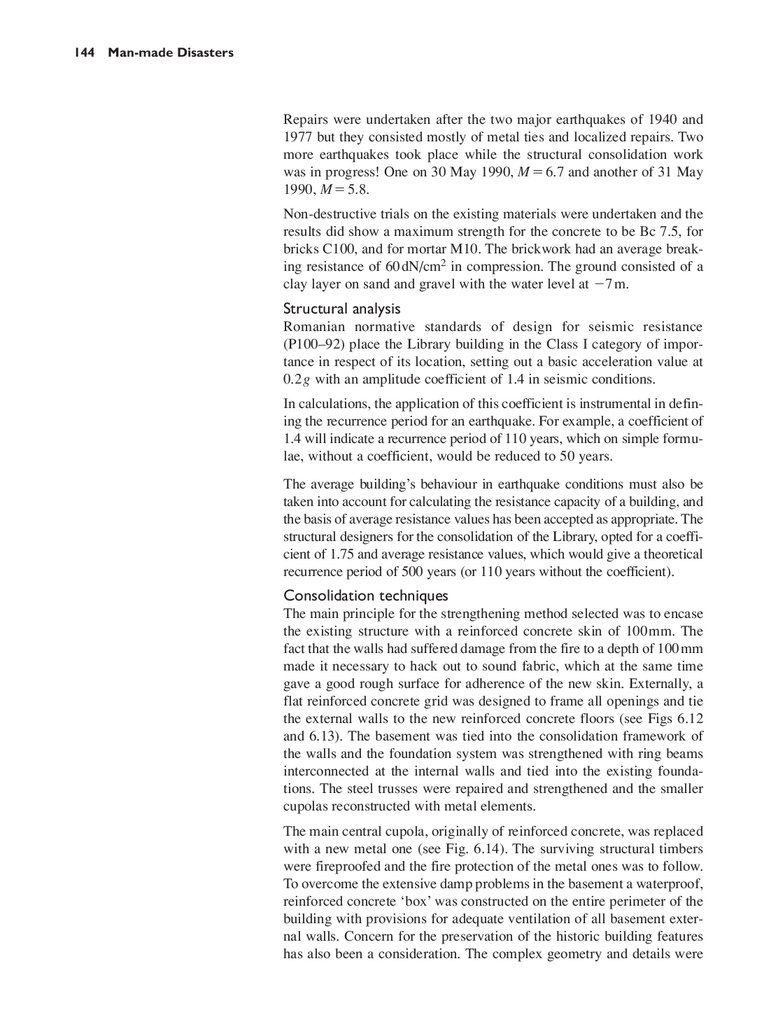

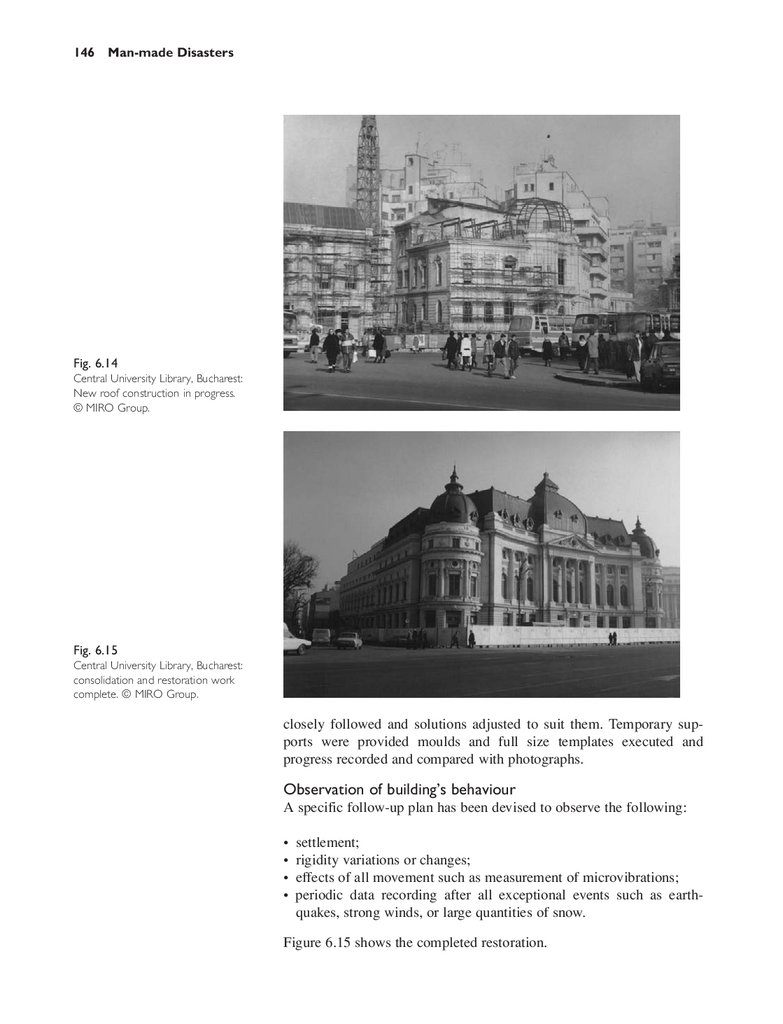


 БЖД
БЖДПохожие презентации:


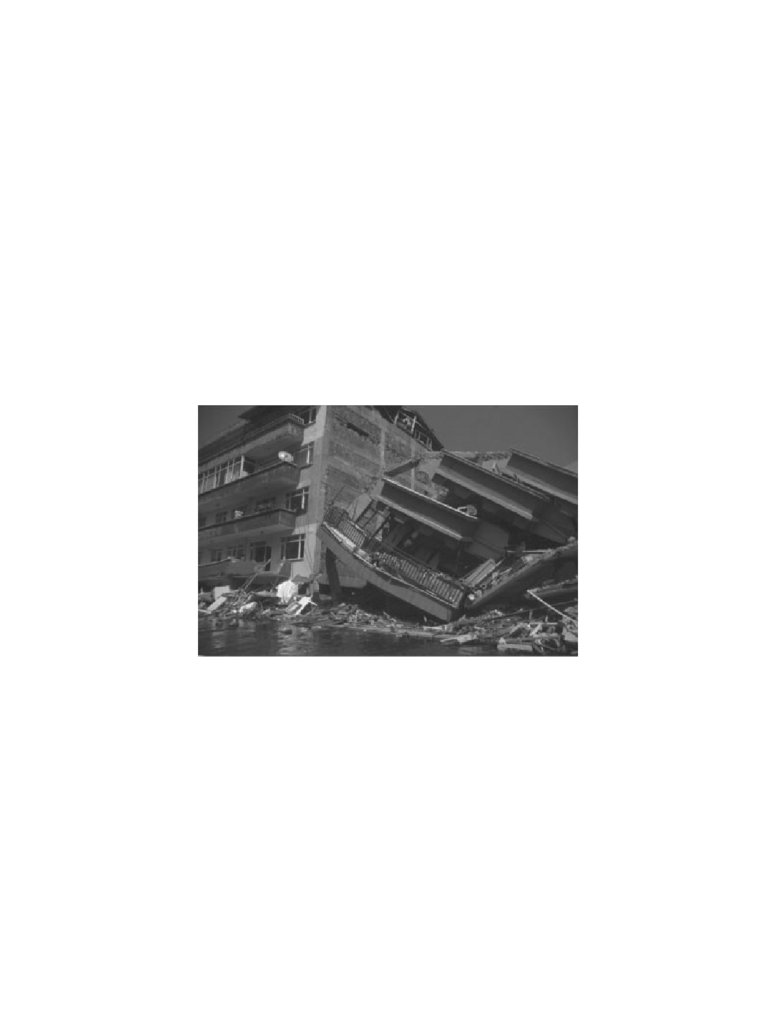
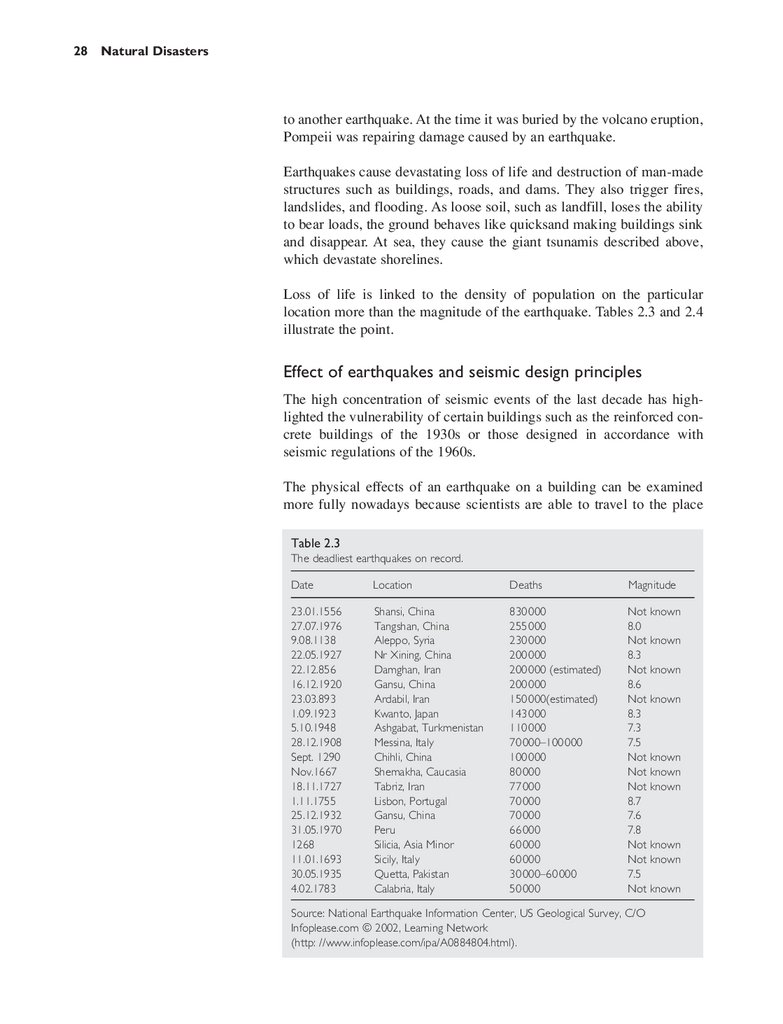
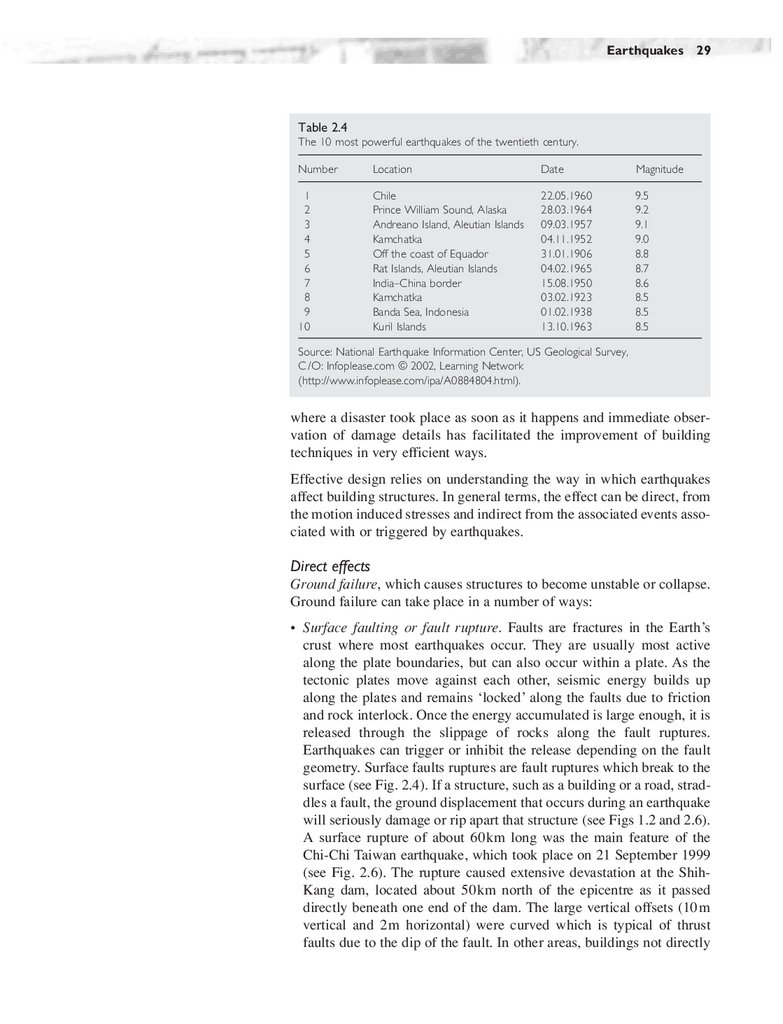
Introduction to Natural and Man-made Disasters and their Effects on Buildings
1.
2.
Introduction to Natural andMan-made Disasters and their
Effects on Buildings
3.
This Page Intentionally Left Blank4.
Introduction toNatural and Man-made
Disasters and their
Effects on Buildings
Roxanna McDonald
AMSTERDAM BOSTON HEIDELBERG LONDON
NEW YORK OXFORD PARIS SAN DIEGO
SAN FRANCISCO SINGAPORE SYDNEY TOKYO
5.
Architectural PressAn imprint of Elsevier
Linacre House, Jordan Hill, Oxford OX2 8DP
200 Wheeler Road, Burlington, MA 01803
First published 2003
Copyright © 2003, Roxanna McDonald. All rights reserved
The right of Roxanna McDonald to be identified as the author of this work
has been asserted in accordance with the Copyright, Designs and
Patents Act 1988
No part of this publication may be reproduced in any material form (including
photocopying or storing in any medium by electronic means and whether
or not transiently or incidentally to some other use of this publication) without
the written permission of the copyright holder except in accordance with the
provisions of the Copyright, Designs and Patents Act 1988 or under the terms of
a licence issued by the Copyright Licensing Agency Ltd, 90 Tottenham Court Road,
London, England W1T 4LP. Applications for the copyright holder's written
permission to reproduce any part of this publication should be addressed
to the publisher
Permissions may be sought directly from Elsevier’s Science and
Technology Rights Department in Oxford, UK: phone: (+44) (0) 1865 843830;
fax: (+44) (0) 1865 853333; e-mail: [email protected]. You may also
complete your request on-line via the Elsevier homepage
(http://www.elsevier.com), by selecting ‘Customer Support’ and then ‘Obtaining
Permissions’
British Library Cataloguing in Publication Data
A catalogue record for this book is available from the British Library
Library of Congress Cataloguing in Publication Data
A catalogue record for this book is available from the Library of Congress
ISBN 0 7506 56700
For information on all Architectural Press publications
visit our website at www.architecturalpress.com
Typeset by Newgen Imaging Systems (P) Ltd, Chennai, India
Printed and bound in Great Britain
6.
ContentsForeword
xi
Introduction
xiii
Acknowledgements
xv
1. Introduction
Definition
Disasters and buildings
What is a disaster?
Disaster impact
Disaster characteristics
Disaster response
Preparedness
Mitigation
Management
Loss assessment
Strategy trends
Human and infrastructure vulnerability
Environmental degradation
Growing poverty in developing countries
Part I Natural Disasters
2. Earthquakes
What happens during an earthquake
Tectonic plates
Earthquake characteristics
Earthquake measurement
Geographic and historic evolution: statistics
Earthquake prediction
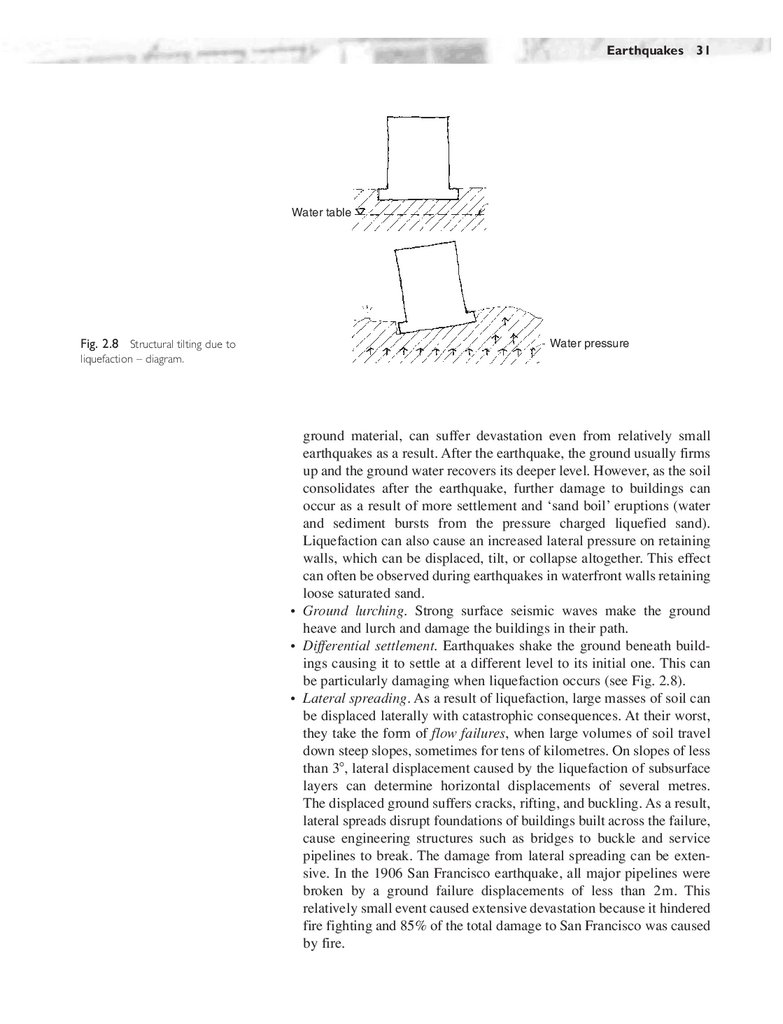
Effect of earthquakes
Effect of earthquakes and seismic design principles
Direct effects
Indirect or consequential effects
Seismic design principles
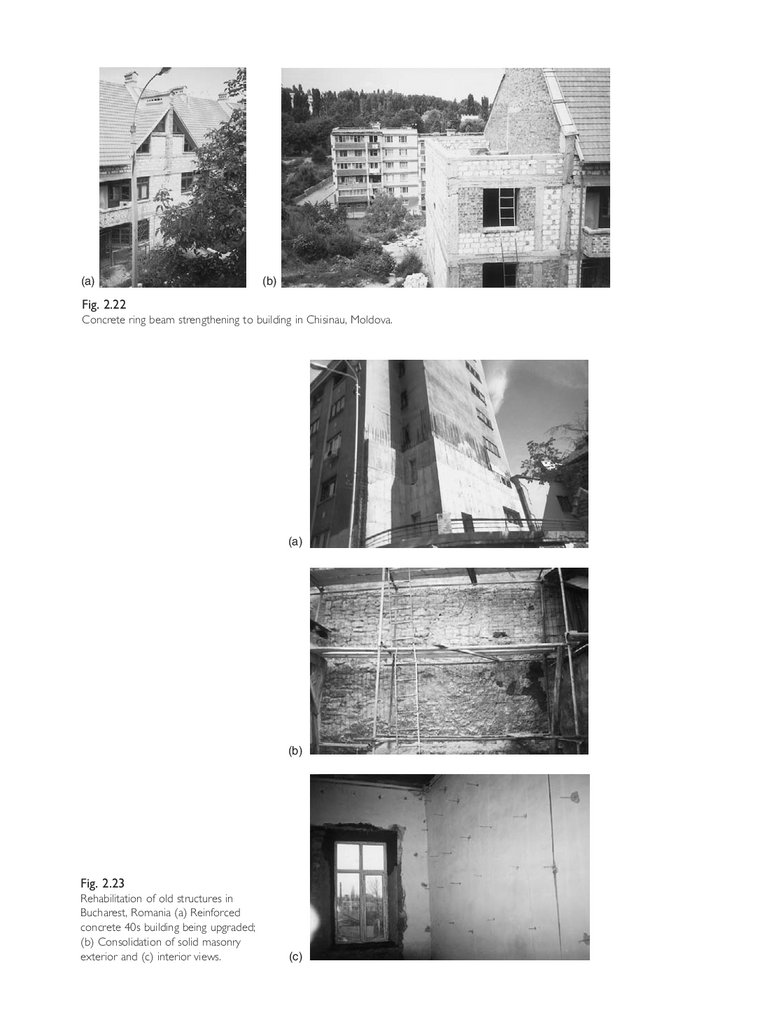
Rehabilitation of old structures
New ideas, research, and recent developments
for seismic-resistant construction
1
1
4
6
8
9
10
10
11
11
12
15
16
16
17
19
21
21
22
23
24
26
26
27
28
29
35
36
40
42
7.
vi ContentsCase study: Vrancea, Romania
General
The effect of 4 March 1977 earthquake
on structures
The effect of 4 March 1977 earthquake on
Romanian historic buildings
Romanian consolidation techniques, anti-seismic
design, and legislation
Disaster mitigation
44
44
47
52
53
58
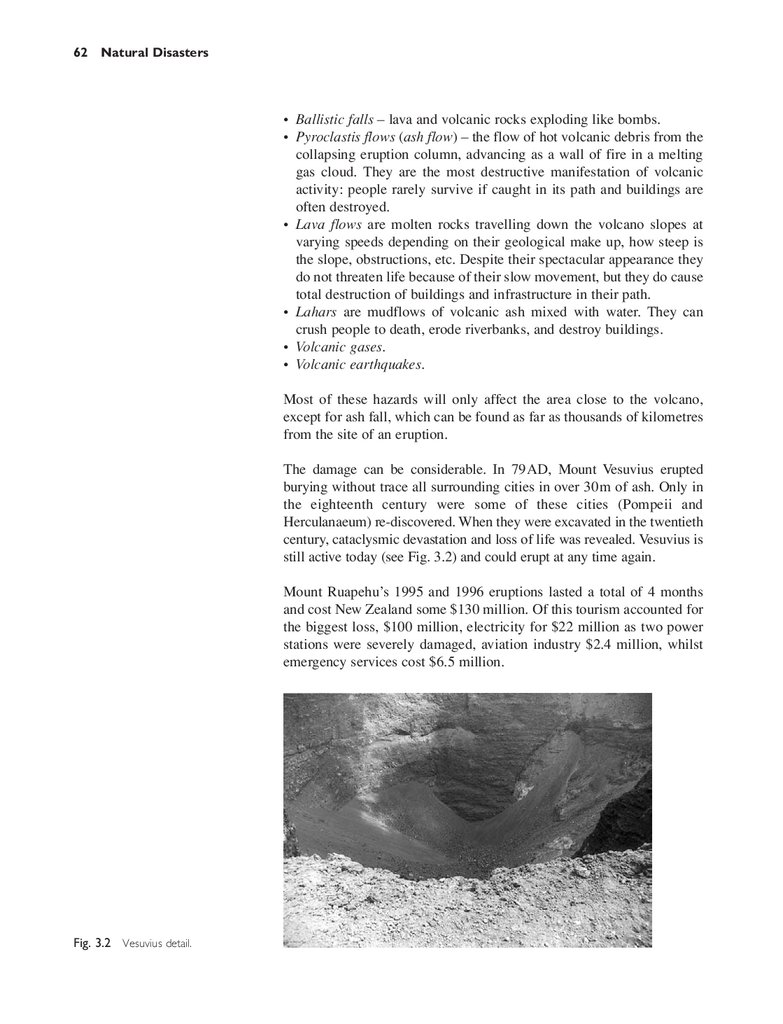
3. Volcanoes
What are volcanoes and how they erupt
Volcano types
Statistics
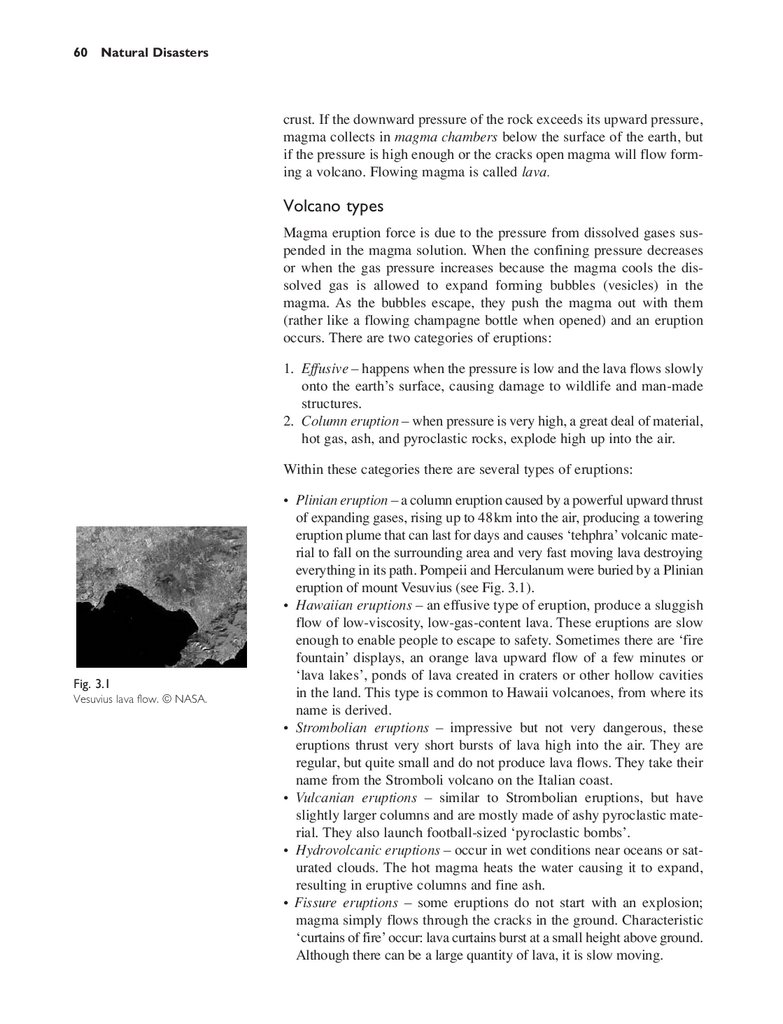
Effects of volcanic eruptions
59
59
60
61
61
4. Flooding
How does flooding occur
Causes and effects of flooding
Causes of flooding
Effects of floods
Elements of design
Individual properties
General approach
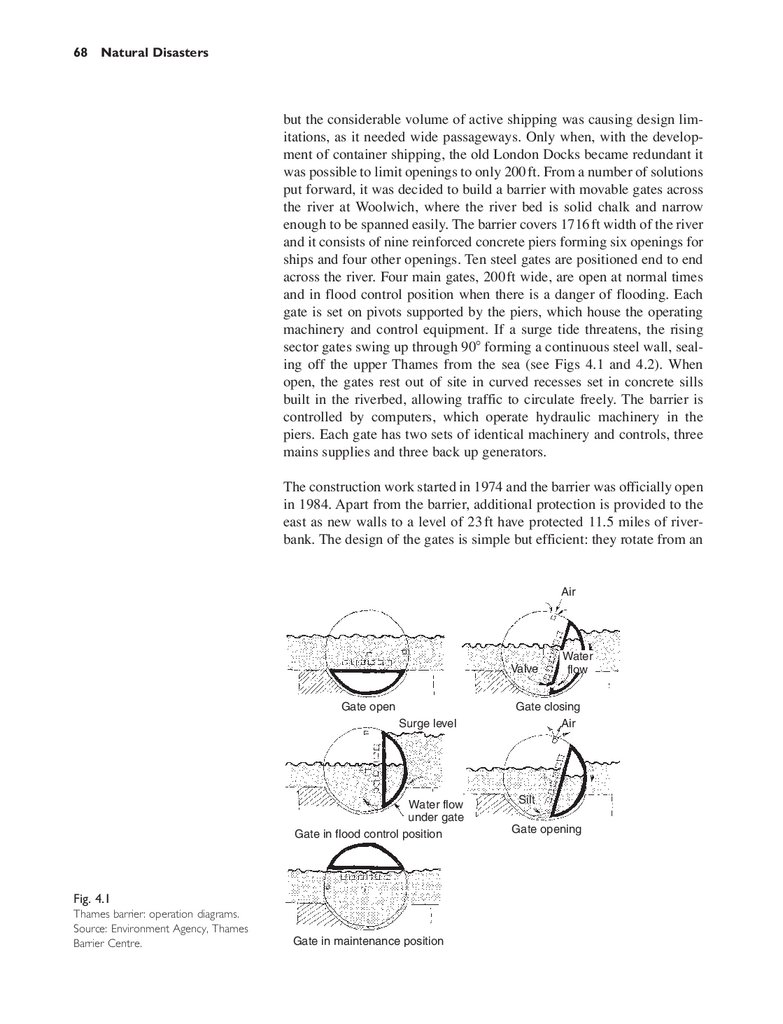
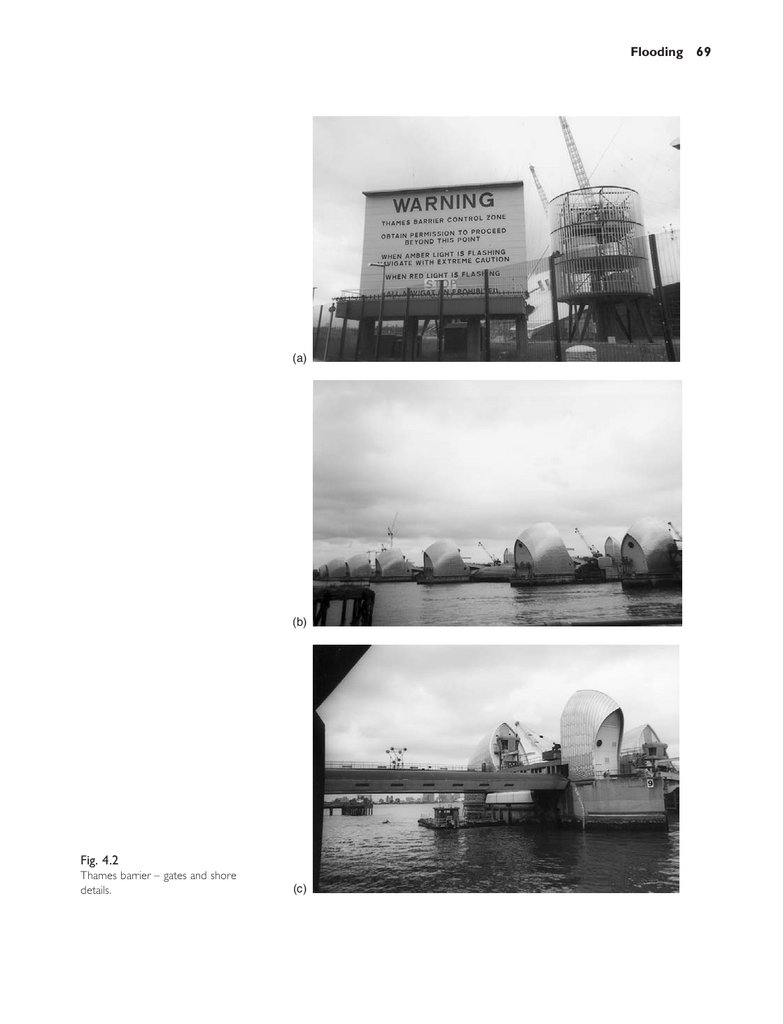
Case study – Thames barrier
Case study – The Loire river, France
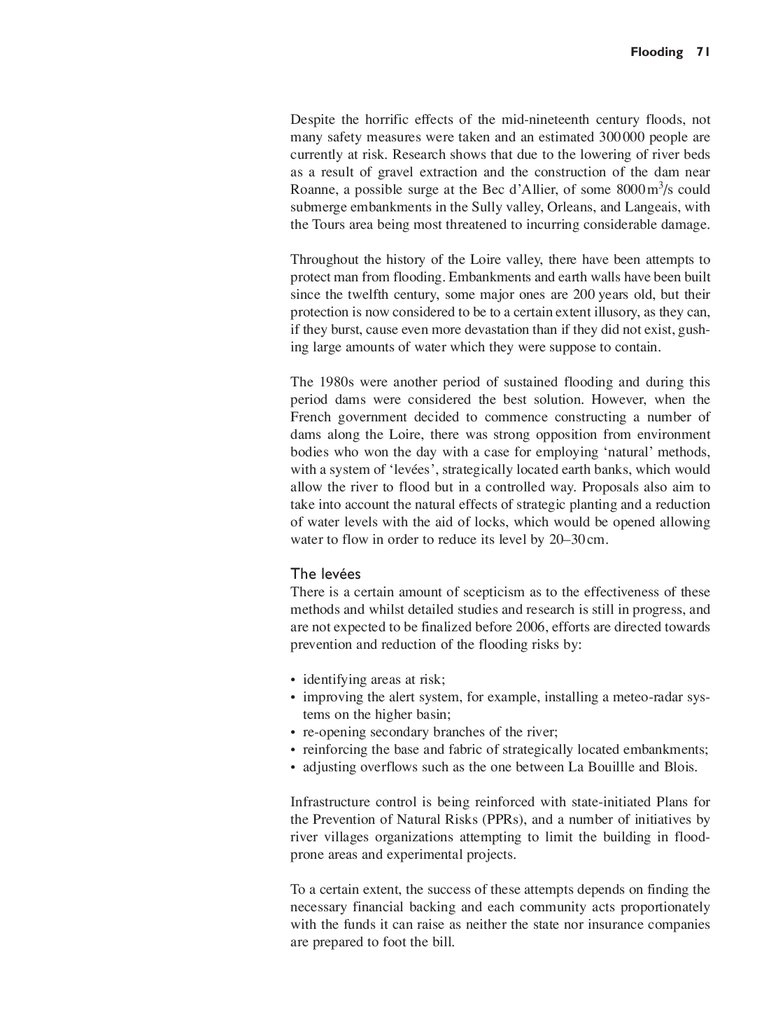
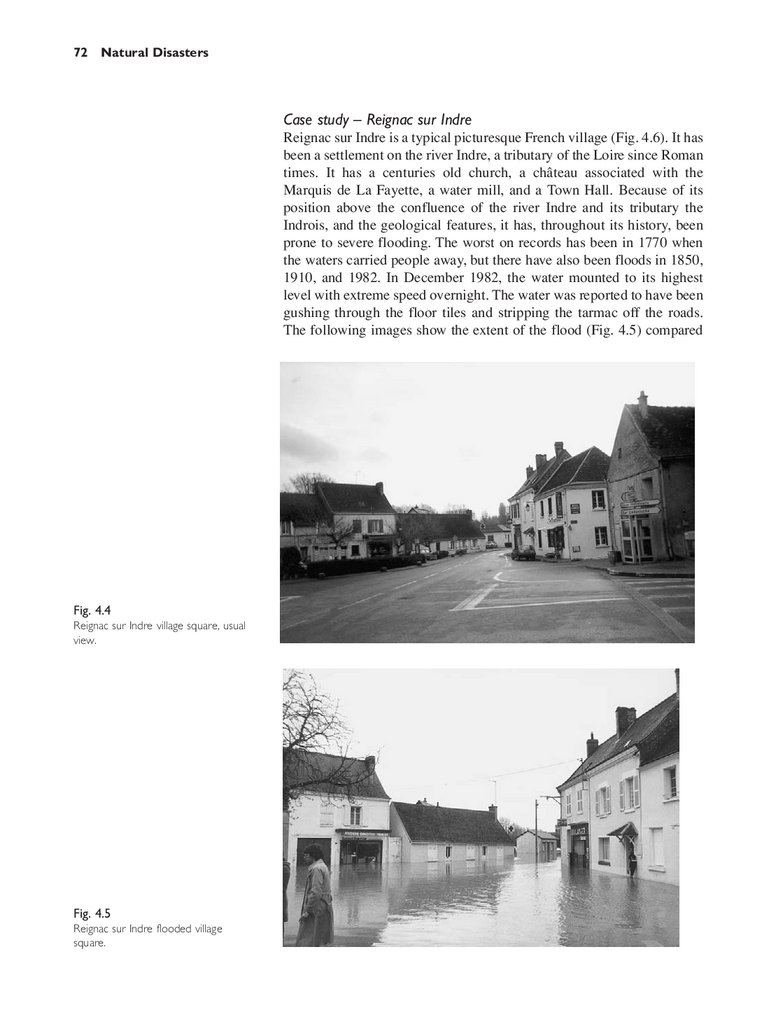
Case study – Reignac sur Indre
63
63
63
63
64
66
66
67
67
70
72
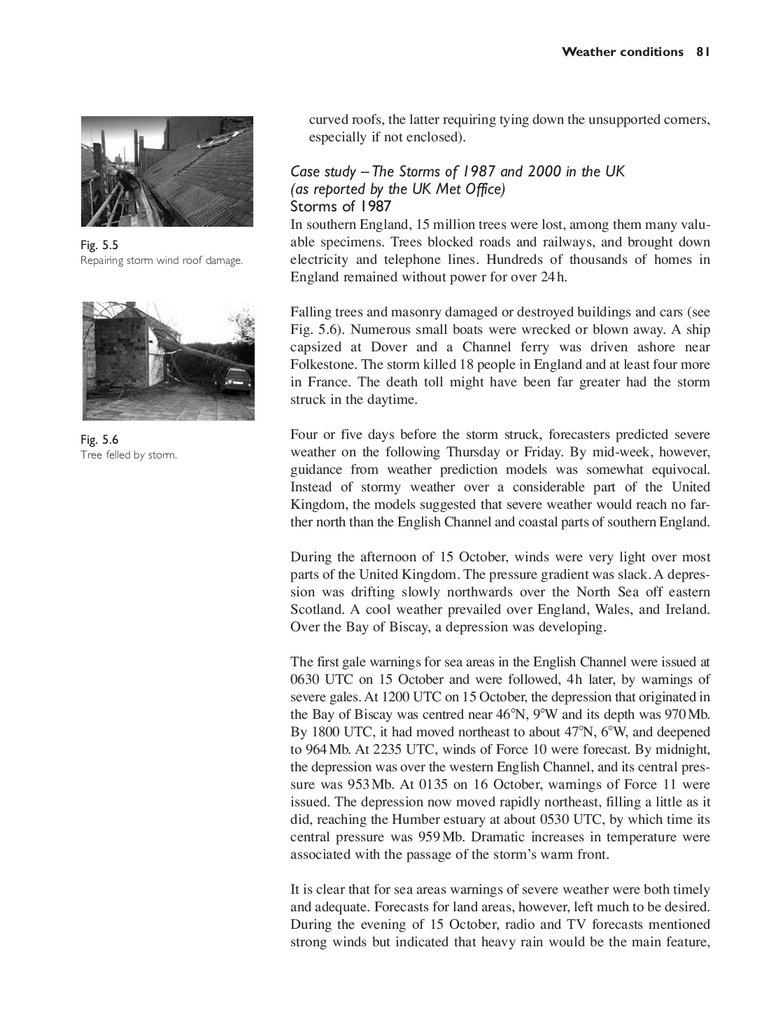
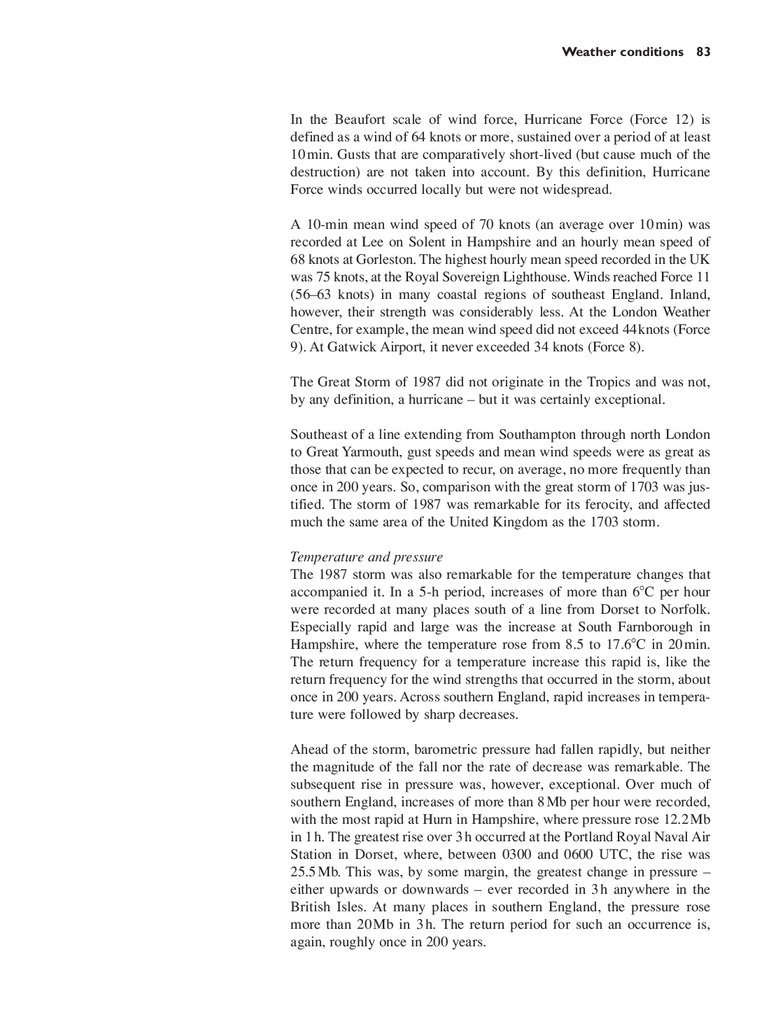
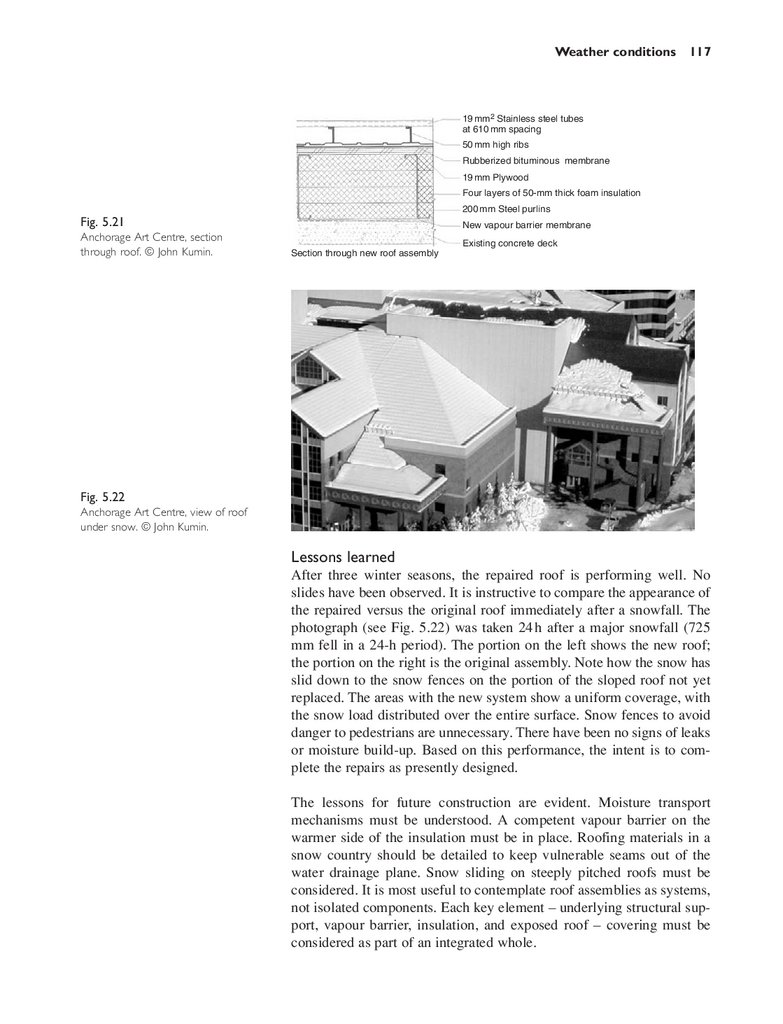
5. Weather conditions
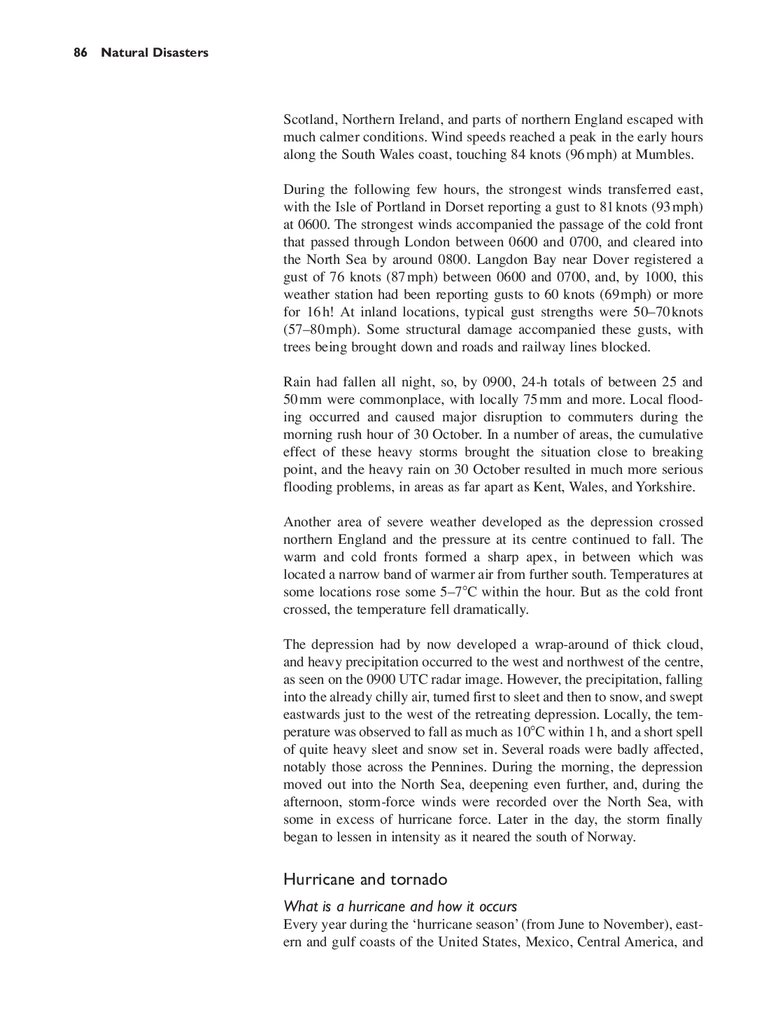
Storm
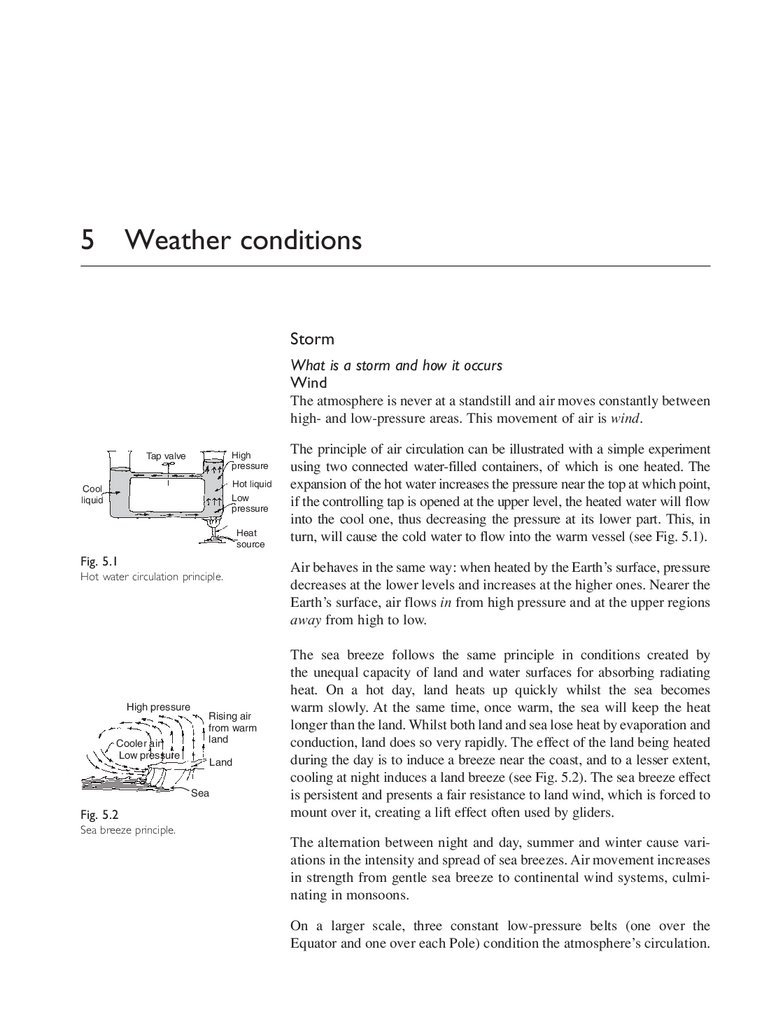
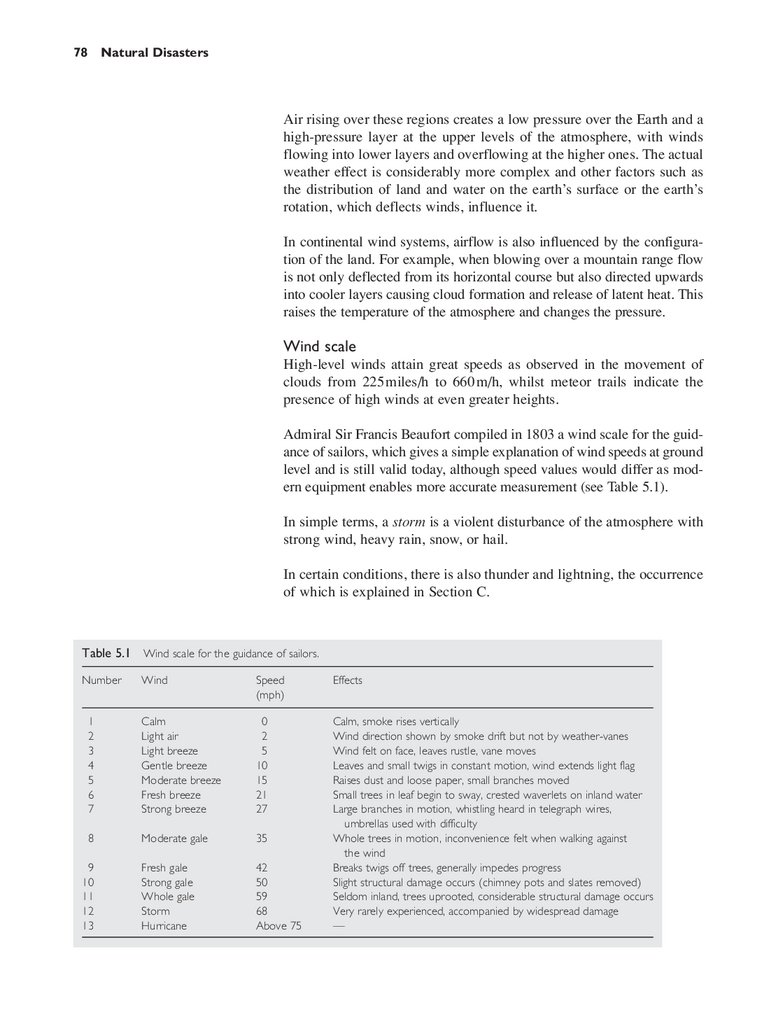
What is a storm and how it occurs
Wind effects on buildings
Case study – The Storms of 1987 and 2000
in the UK
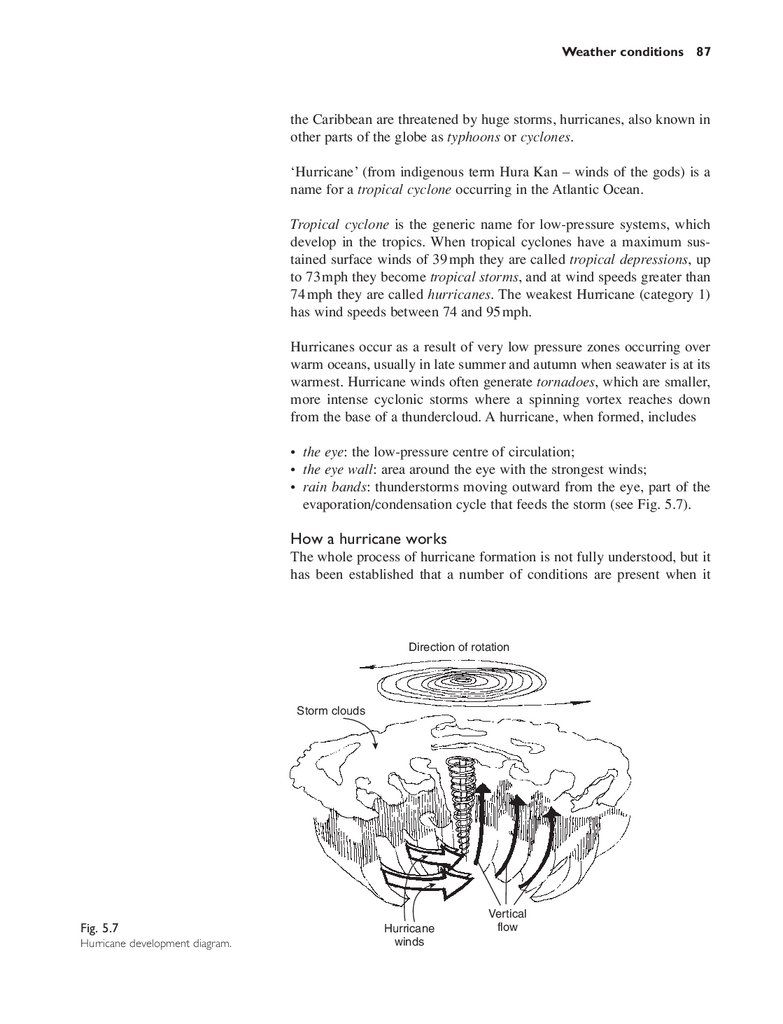
Hurricane and tornado
What is a hurricane and how it occurs
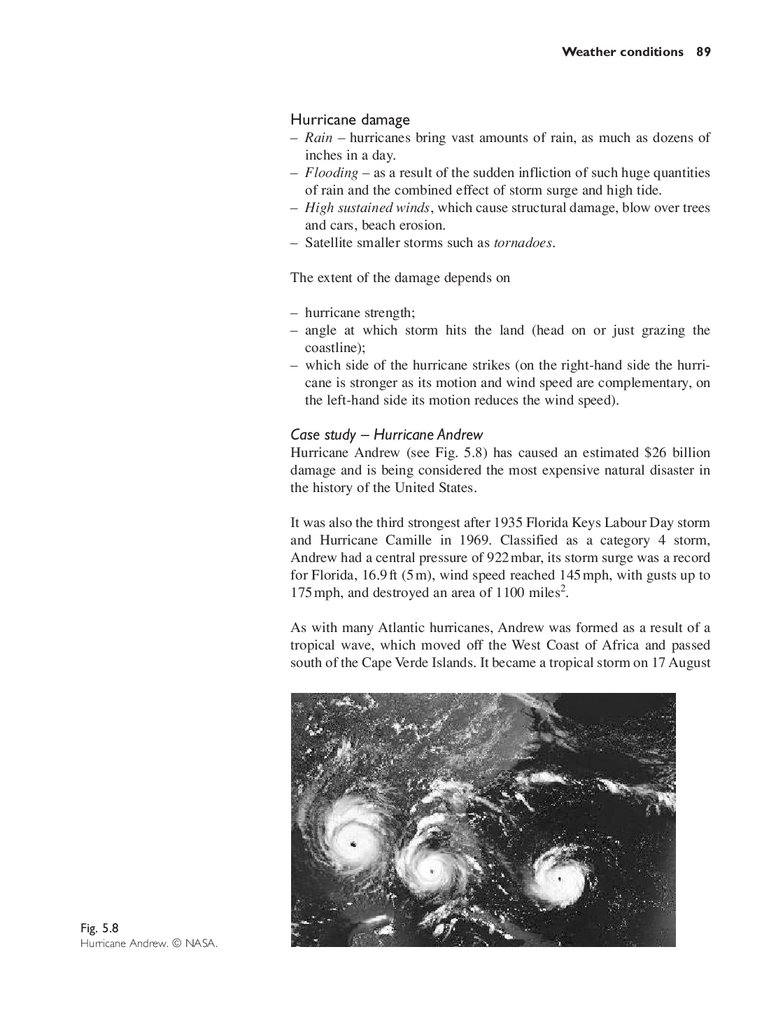
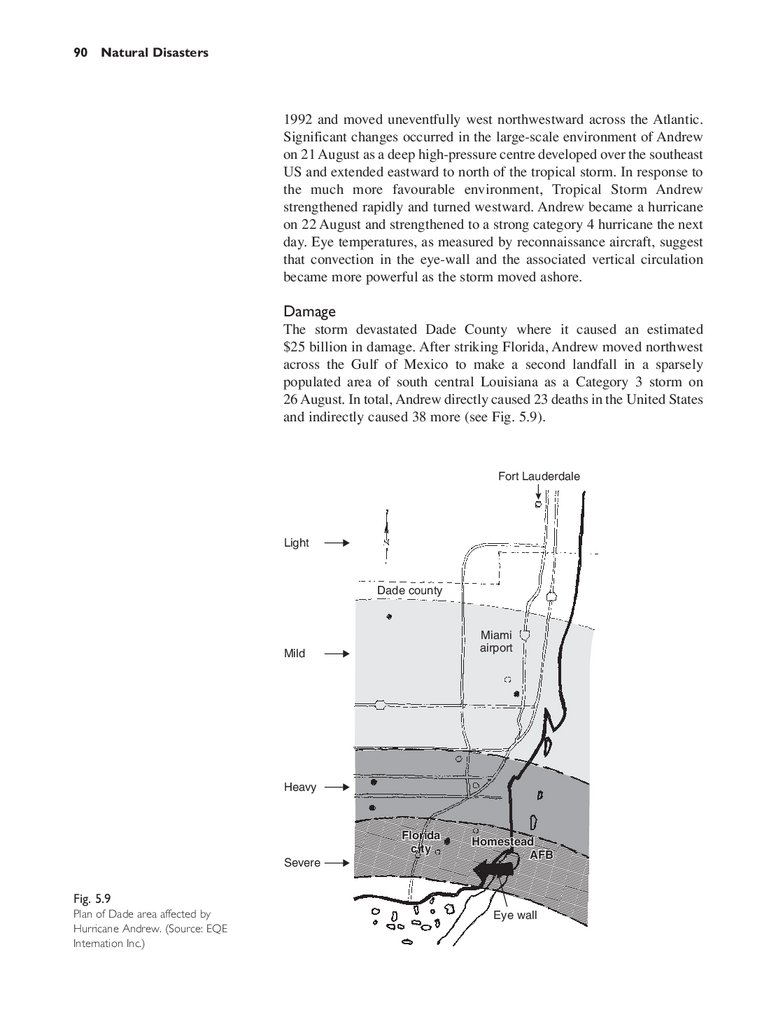
Case study – Hurricane Andrew
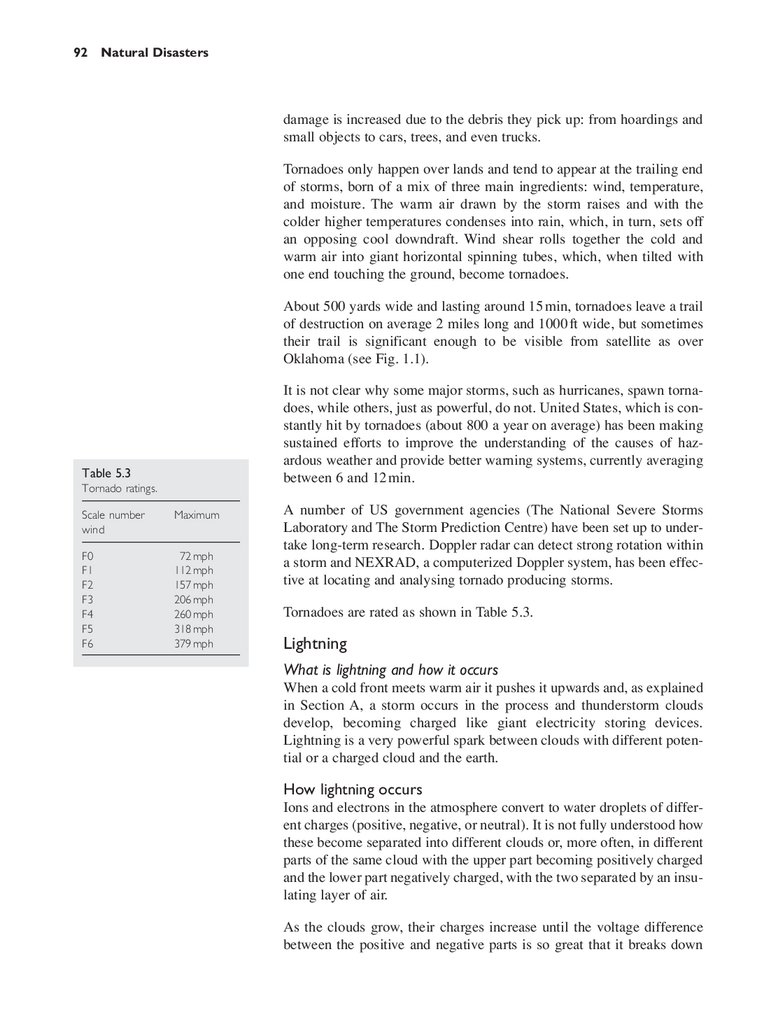
What is a tornado
Lightning
What is lightning and how it occurs
Effects of lightning on buildings
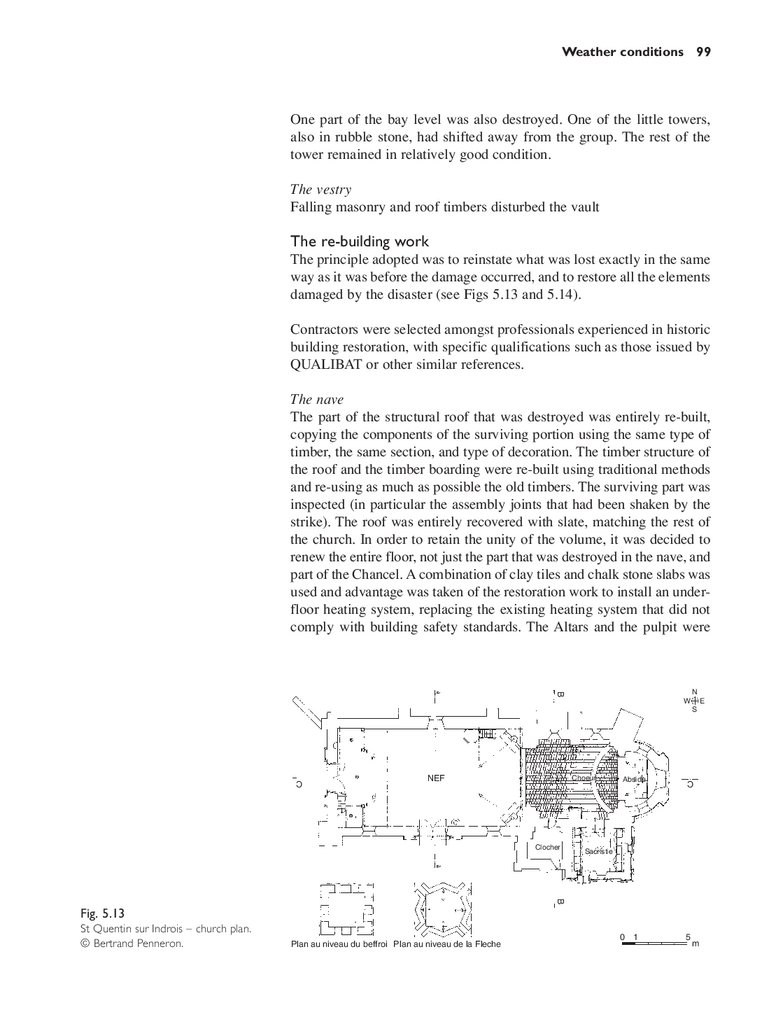
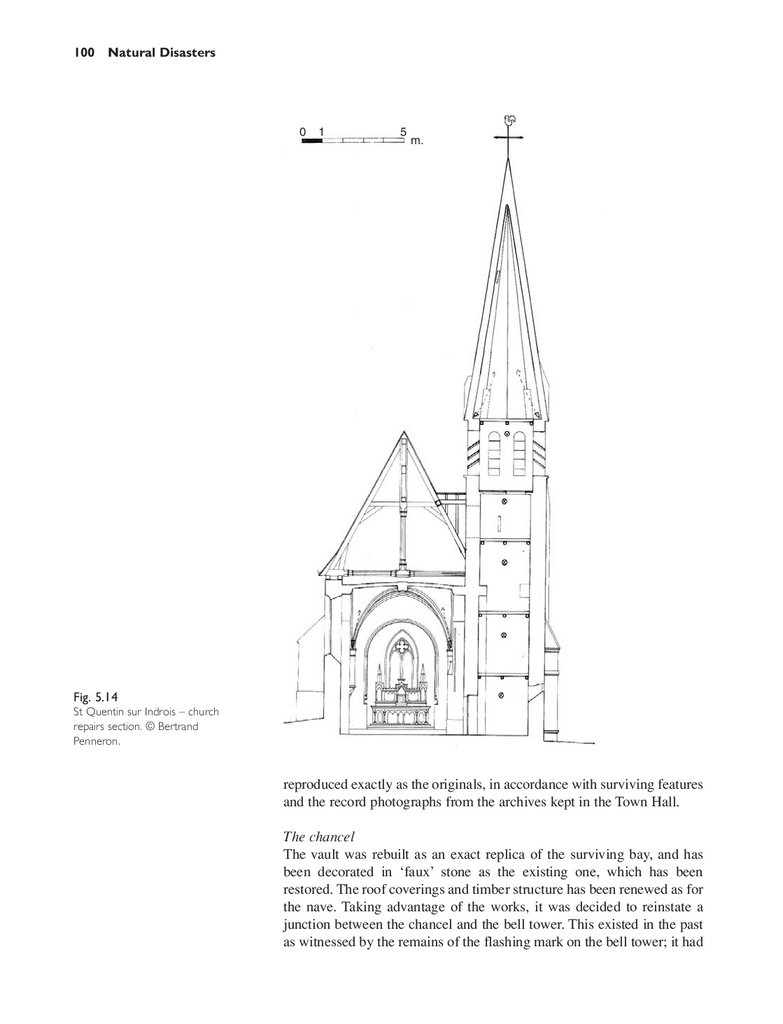
Case study – Reconstruction of church spire
St Quentin-sur-Indrois, France
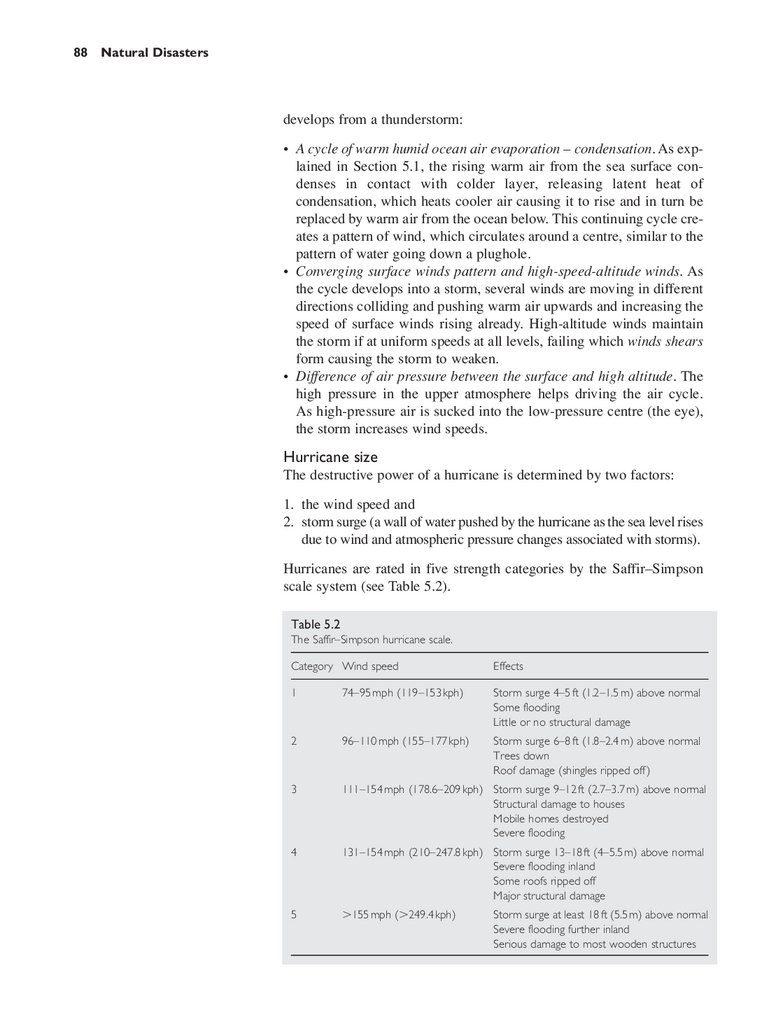
Extreme temperatures
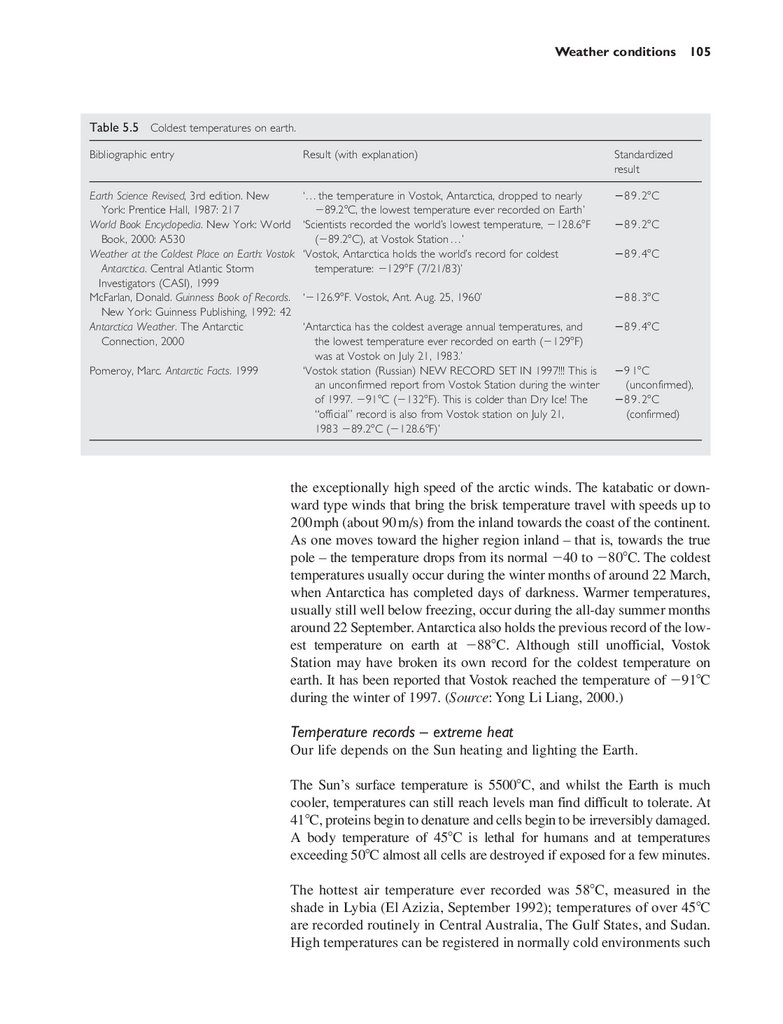
Temperature records – extreme cold
Temperature records – extreme heat
General design features
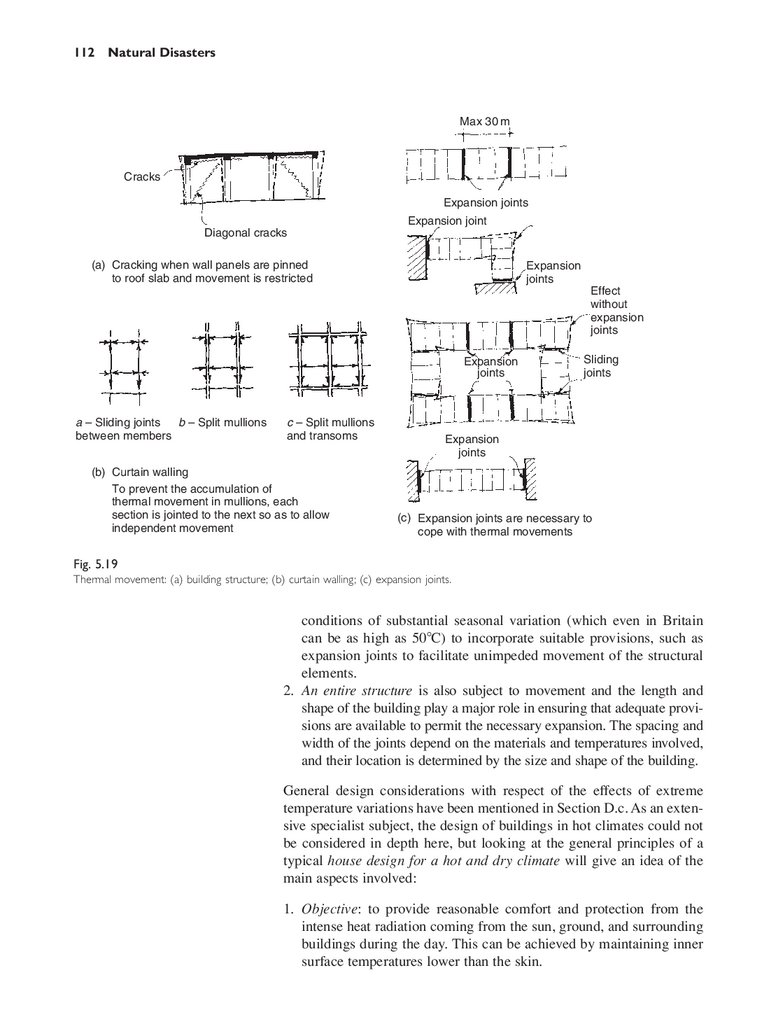
Effect of extreme temperatures on buildings
77
77
77
79
81
86
86
89
91
92
92
94
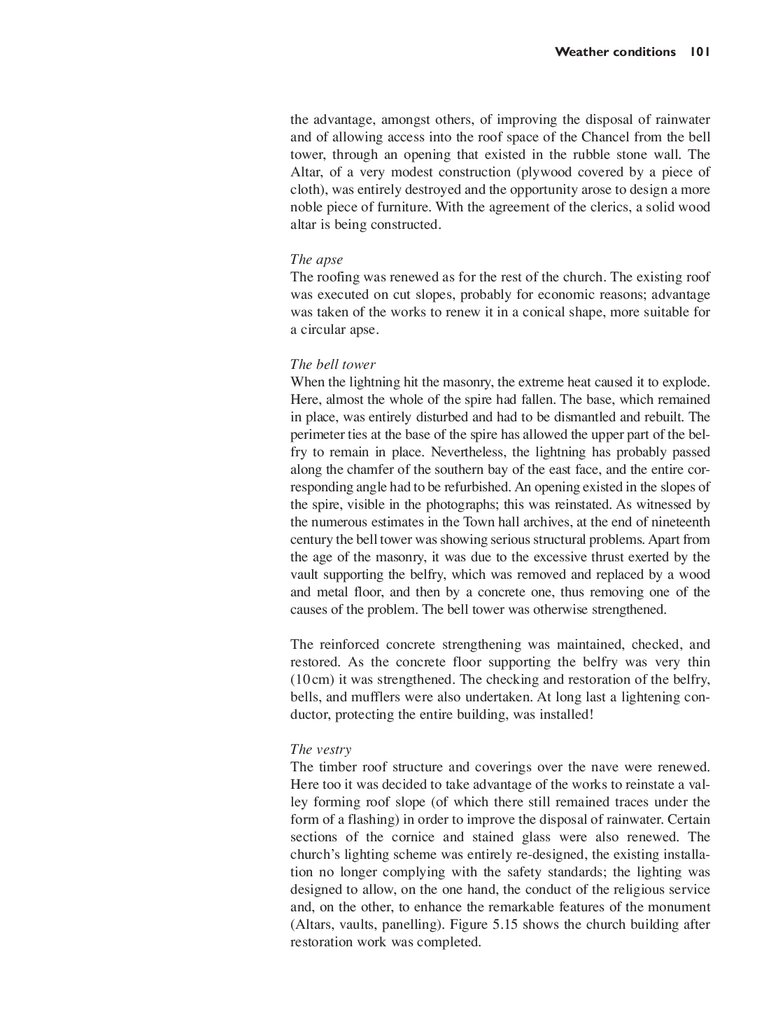
95
102
102
105
107
110
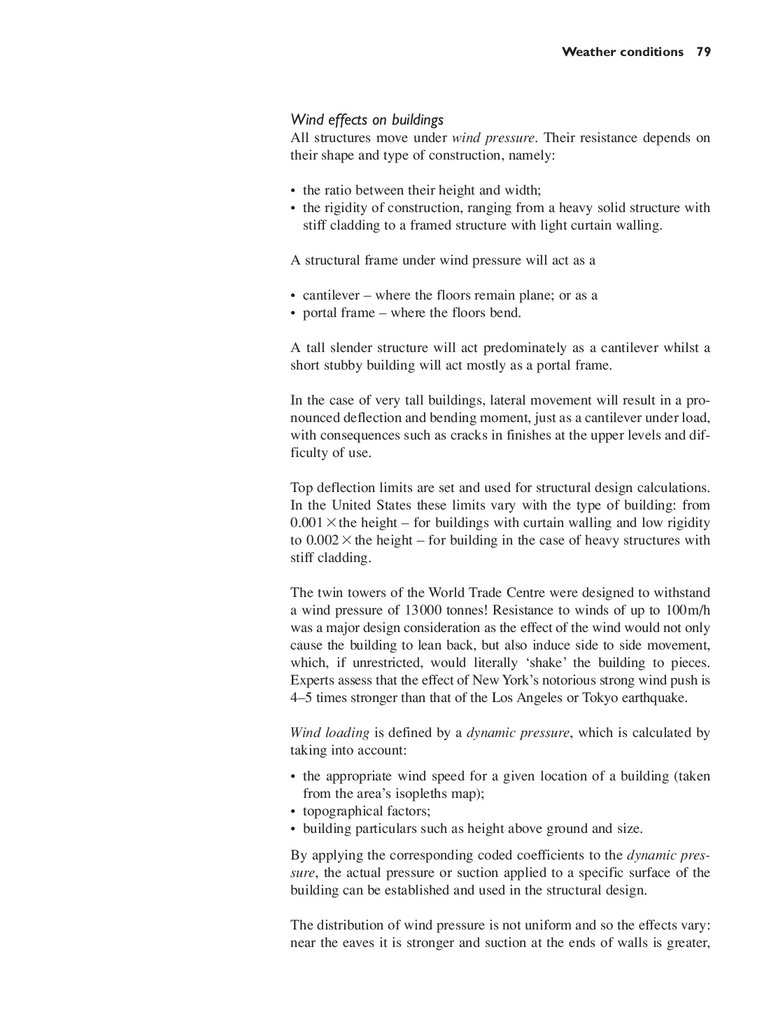
8.
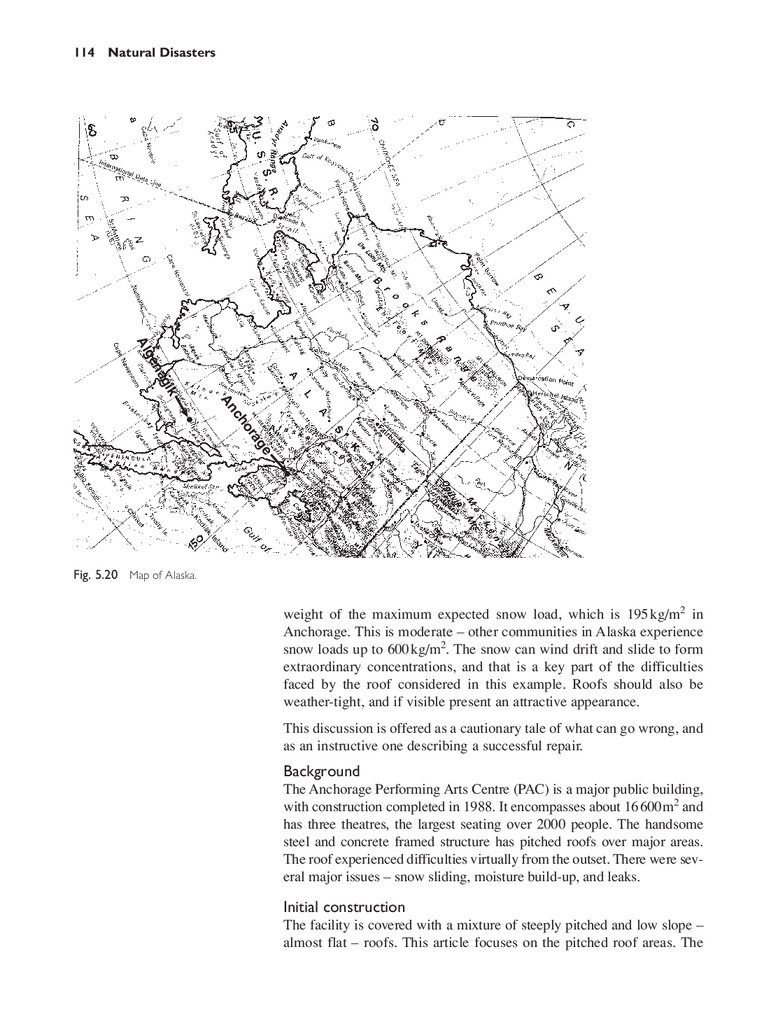
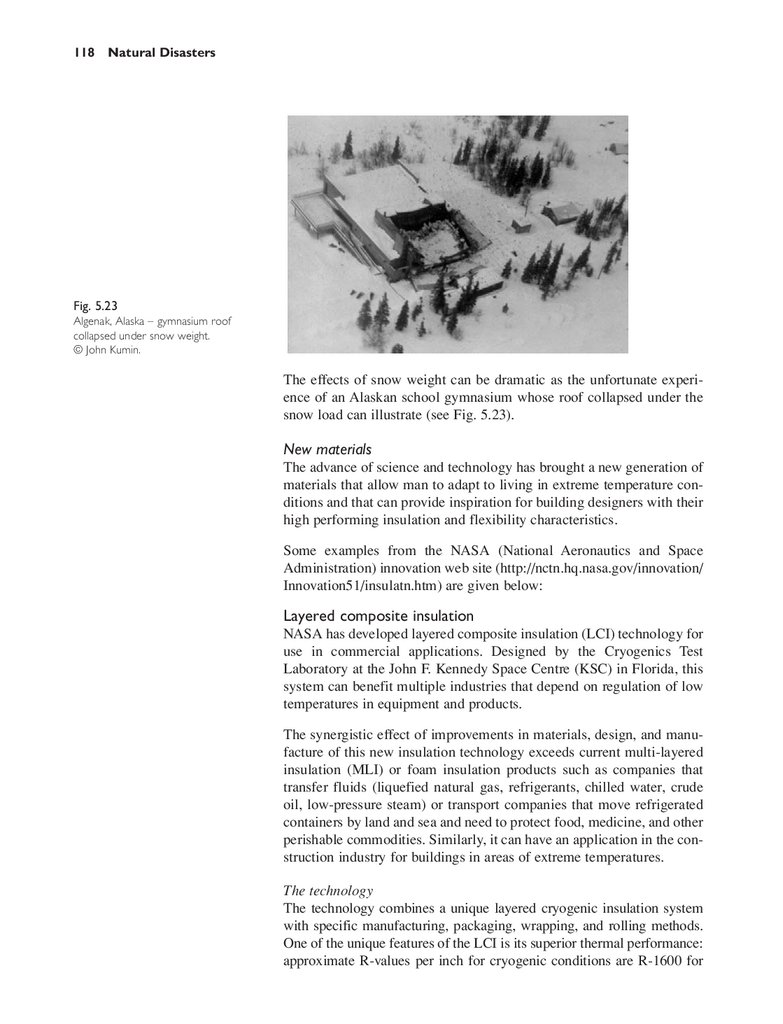
Contents viiCase study – Anchorage Performing Arts
Center roof repair
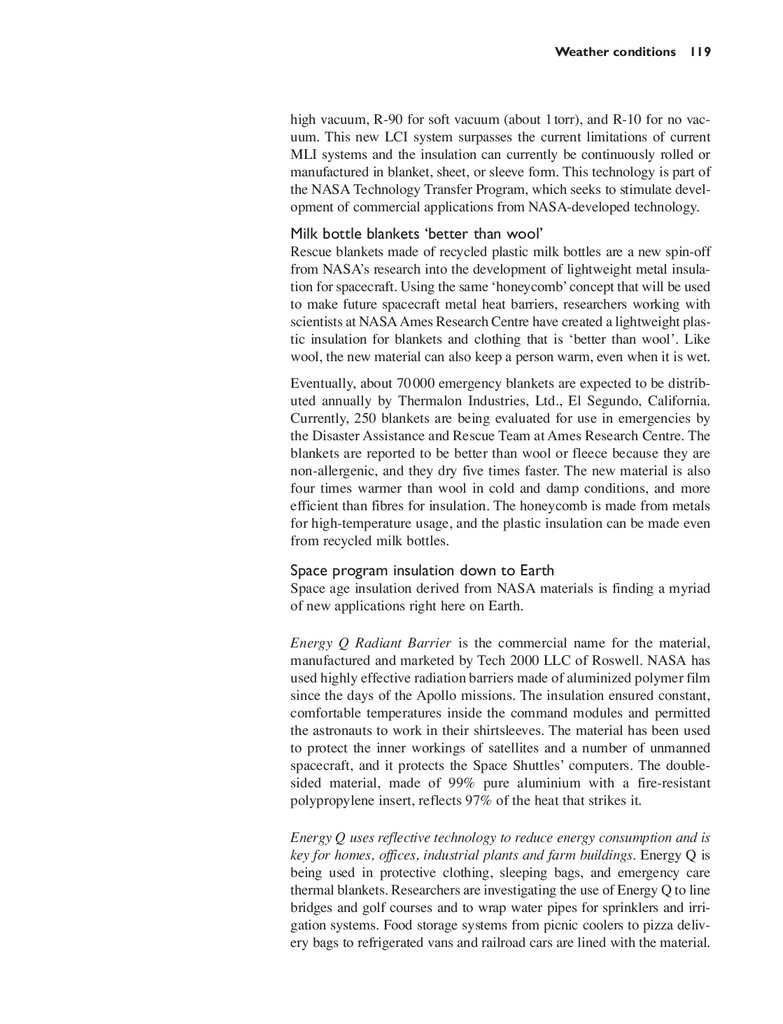
New materials
Mass movement
What is mass movement and how it occurs
Types of mass movement and slope failure
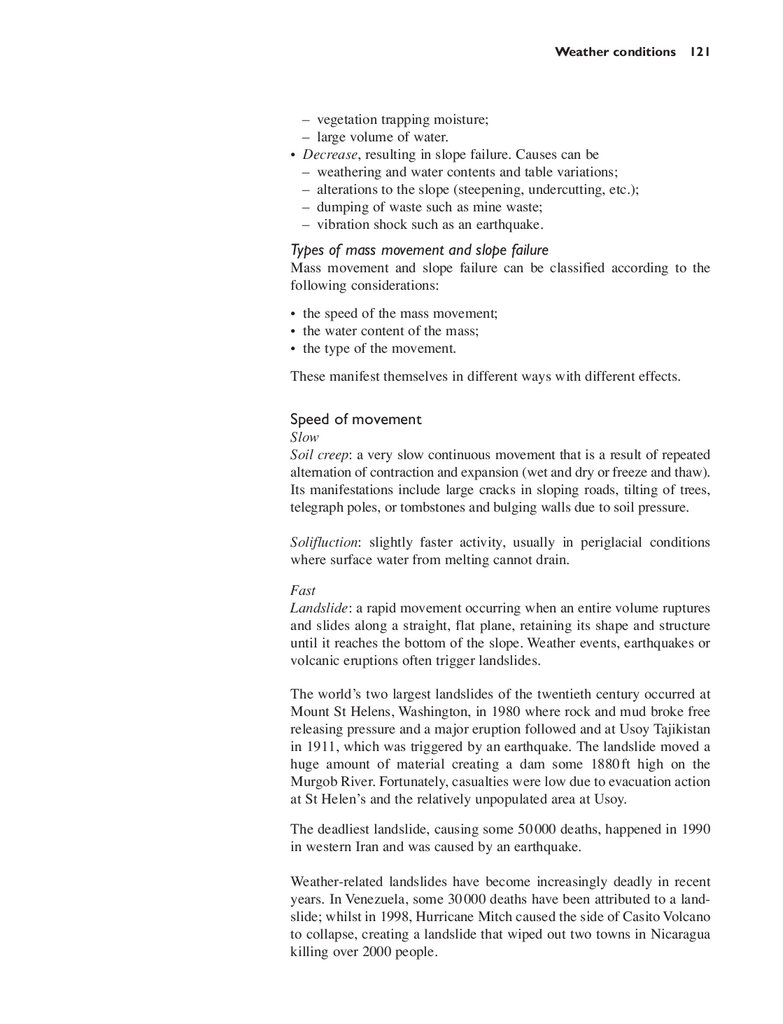
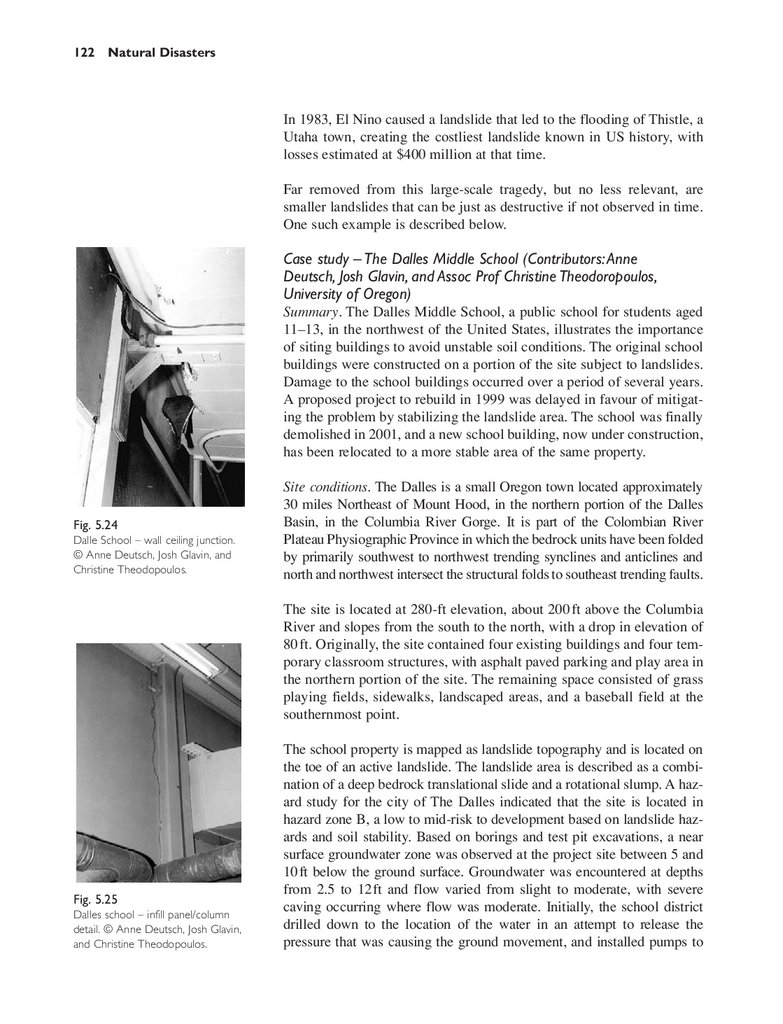
Case study – The Dalles Middle School
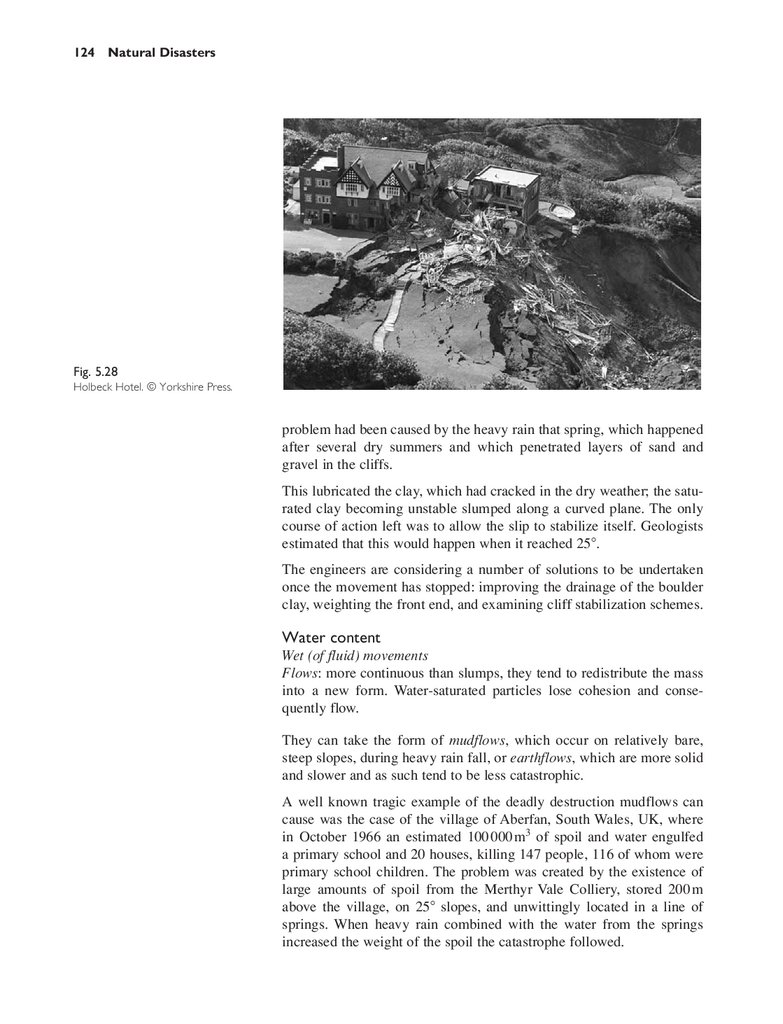
Case study – Holbeck Hotel
Part 2 Man-made Disasters
113
118
120
120
121
122
123
129
6. Conflict
Types of conflict
Conflict issues types
Methods of resolving conflict issues
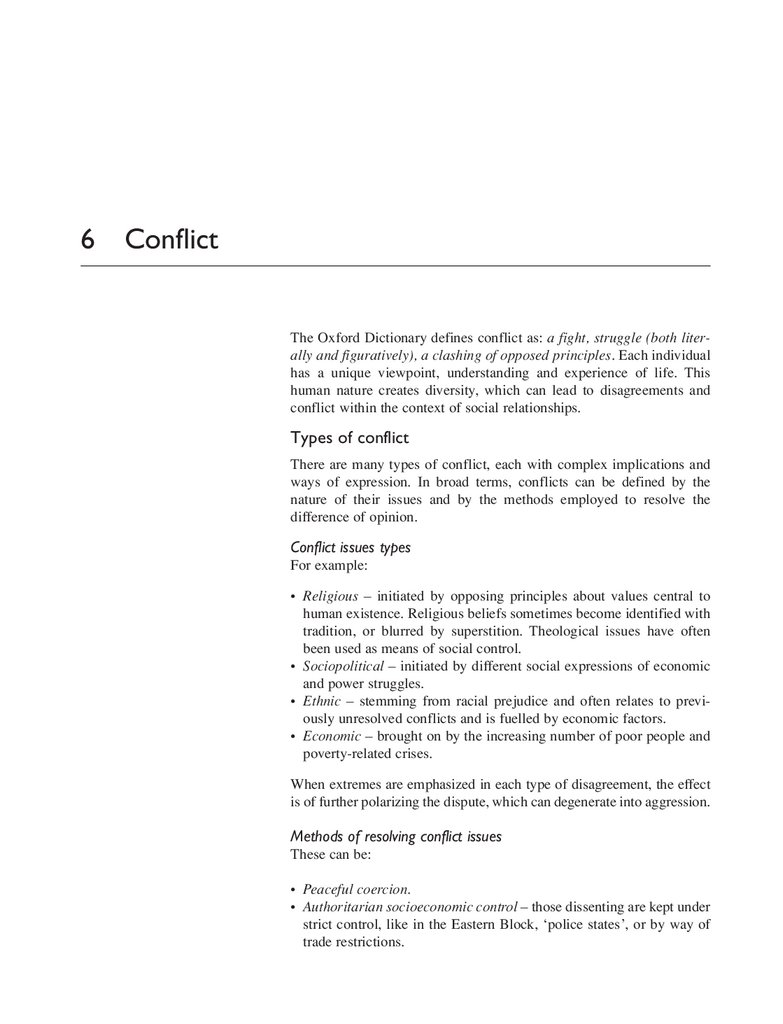
Effect of conflict and terrorist attack on buildings
Types of damage
Design considerations
Case studies
Northern Ireland
Central University Library, Bucharest, Romania
World Trade Centre collapse
131
131
131
131
134
134
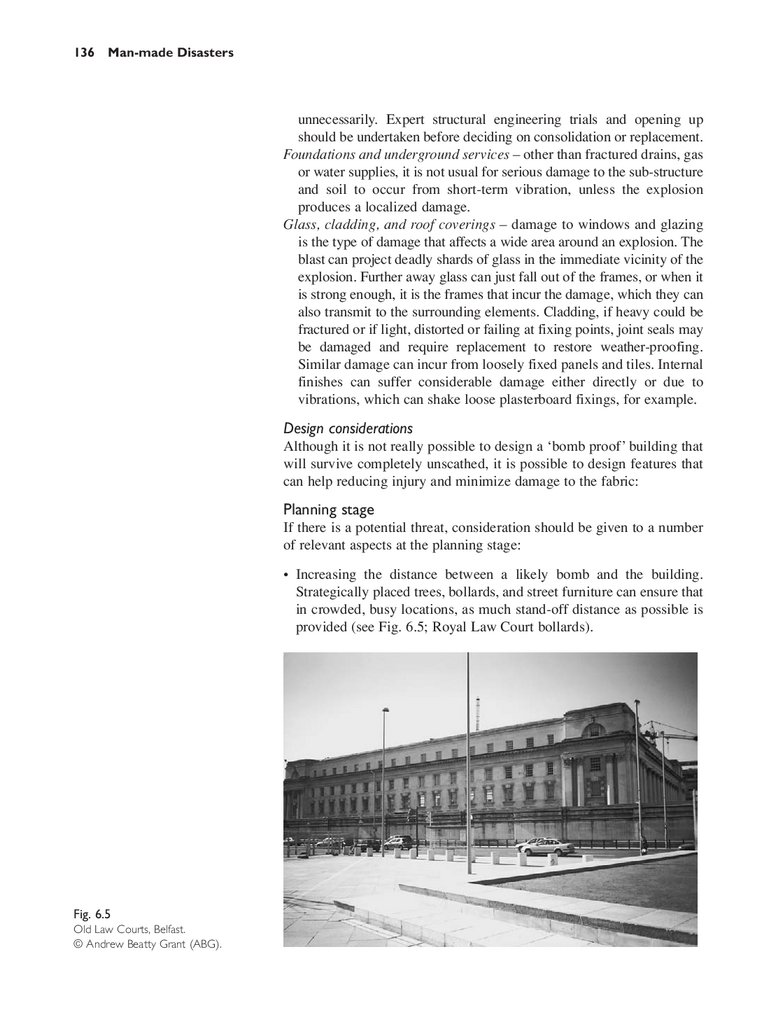
136
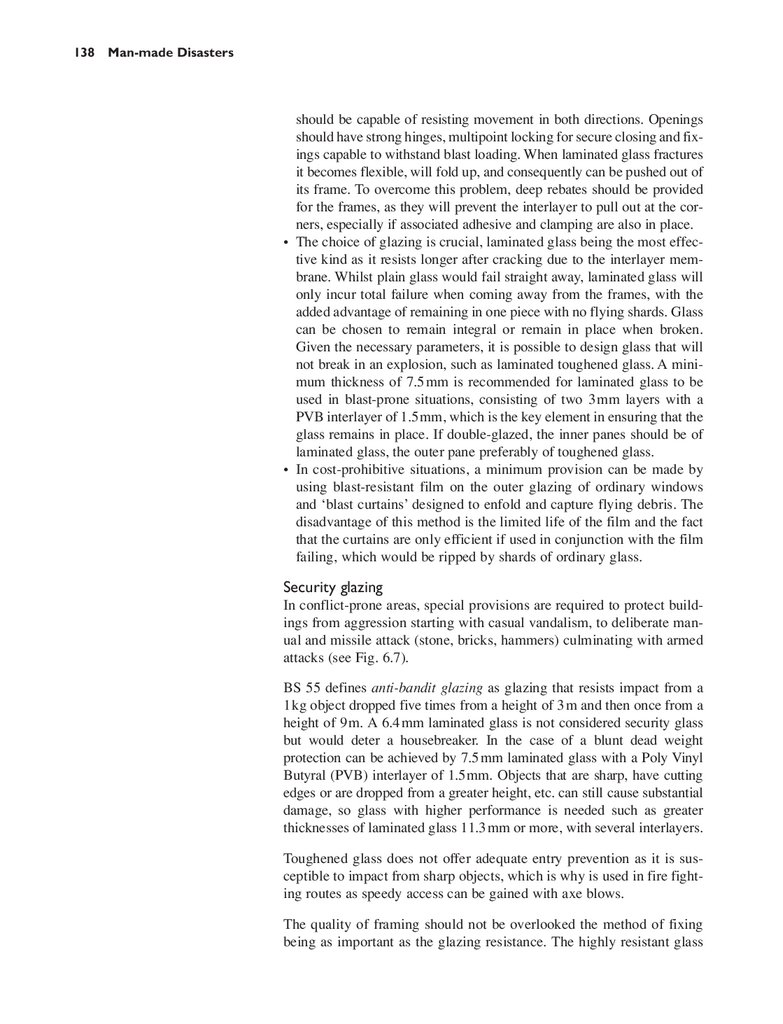
139
139
141
147
7. Fire
How does fire occur
Types fire
Fire disasters affecting wildland and forests
Fire disasters affecting humans
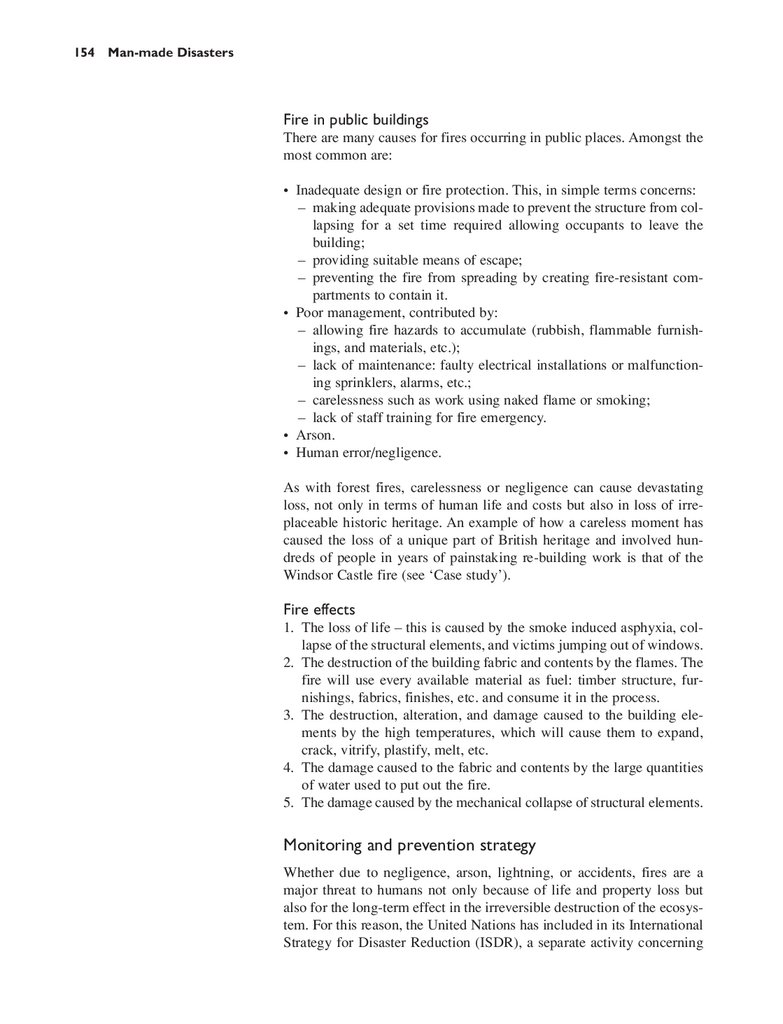
Monitoring and prevention strategy
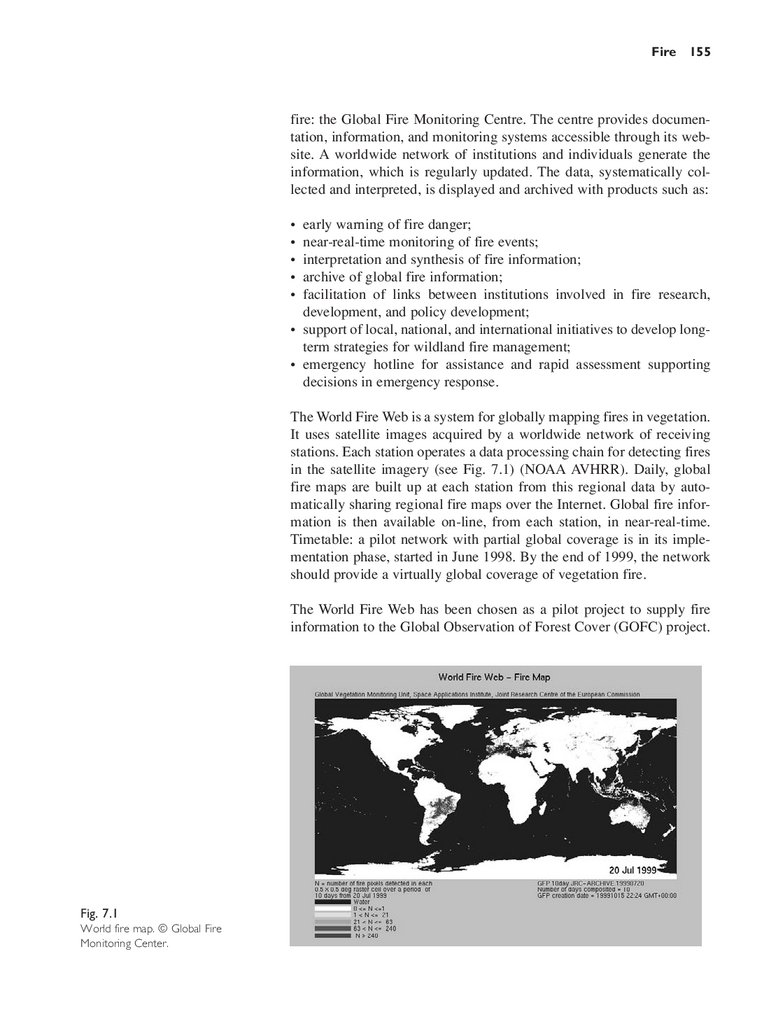
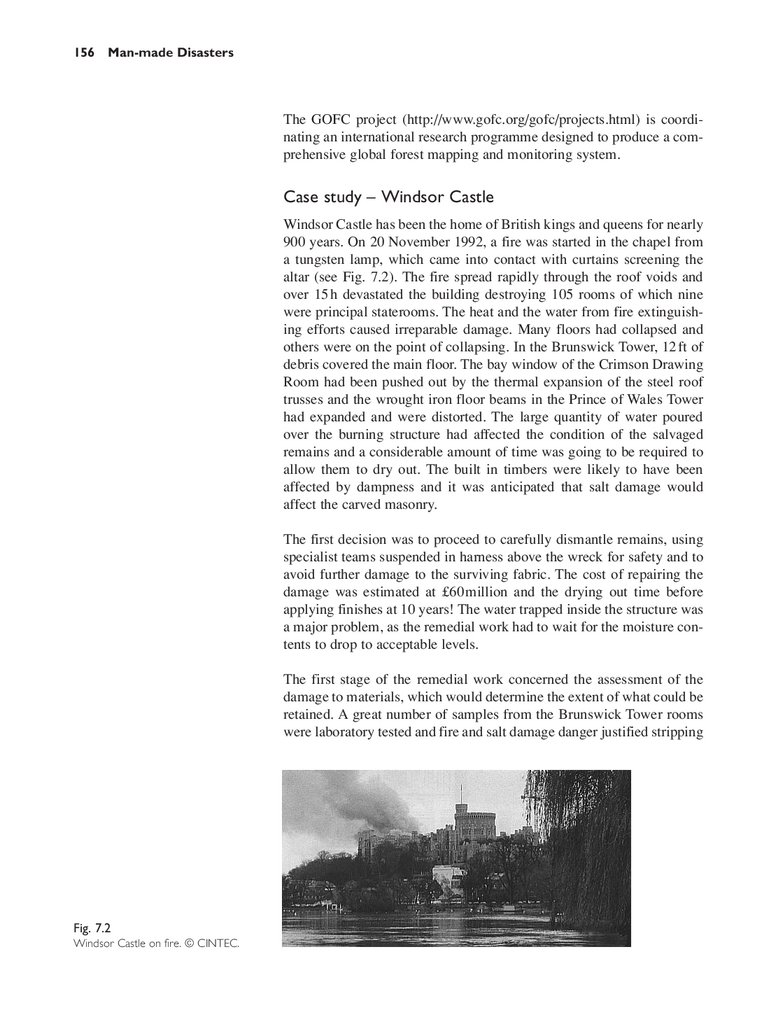
Case study – Windsor Castle
151
151
152
152
153
154
156
8. Disasters resulting from human activities
Classification and impact
Technological advances
Excessive exploitation of natural resources and
inappropriate land development and building
Contamination of the food chain and environment
Impact
Technological production
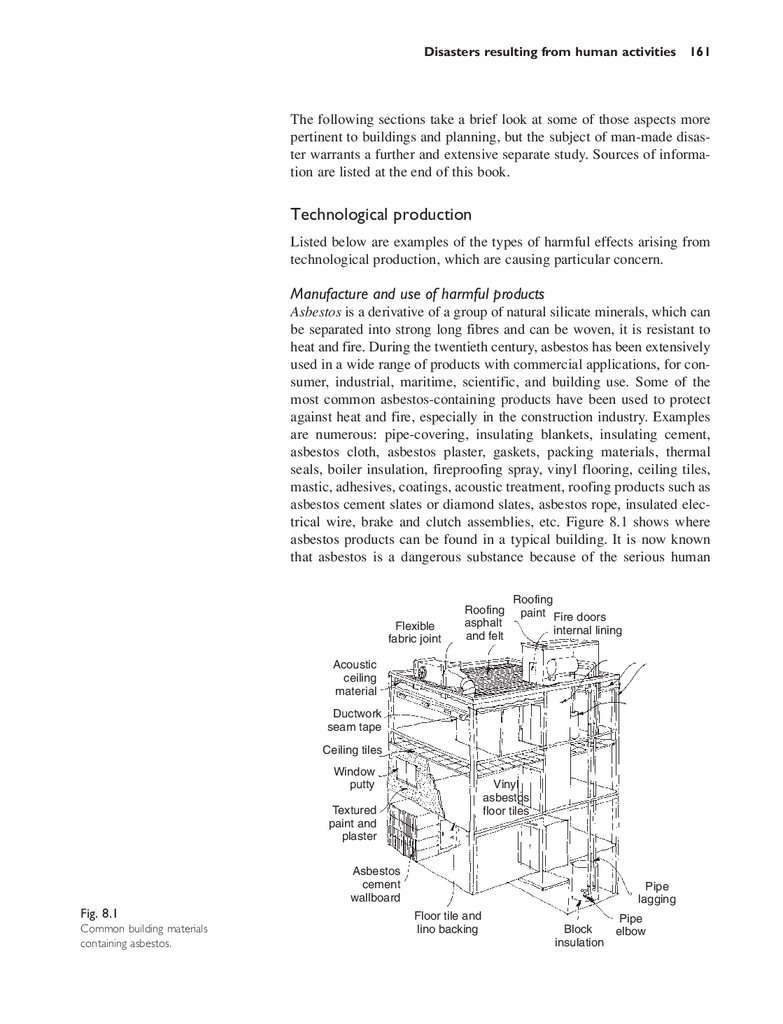
Manufacture and use of harmful products
Harmful by-products and/or processes
Case study – Chernobyl, Ukraine
Pollution
Excessive exploitation of natural resources and
inappropriate land development
Inappropriate land development and building
Contamination of the food chain and environment
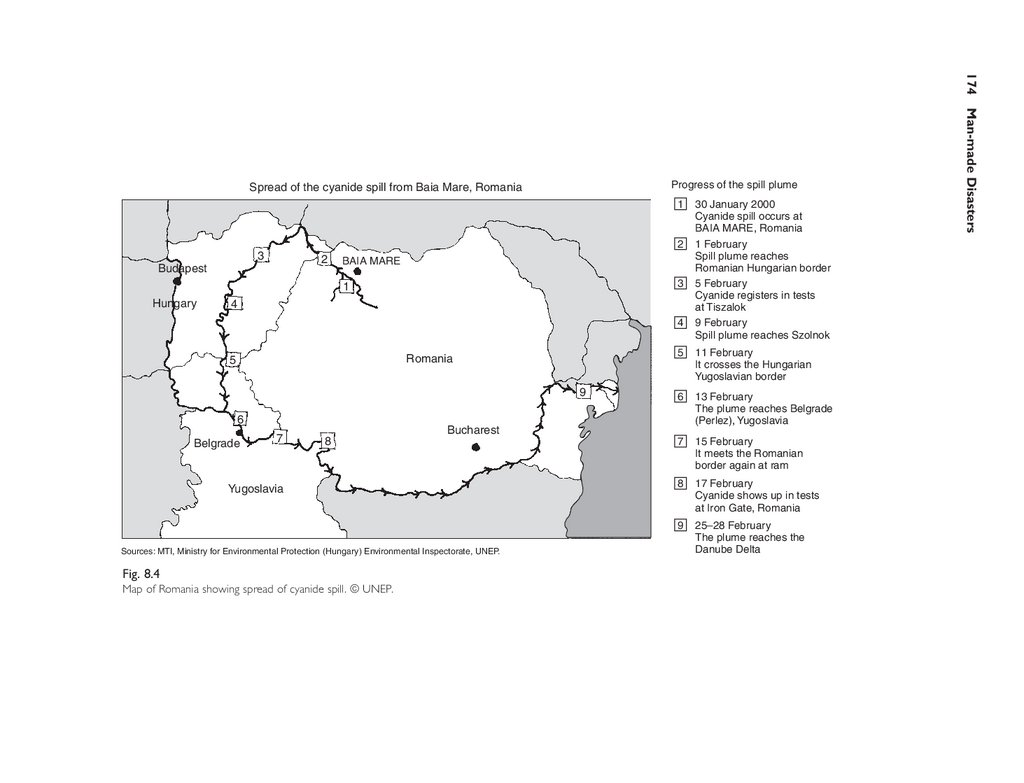
Case study – The cyanide spill at Baia Mare,
Romania
159
159
159
159
160
160
161
161
163
164
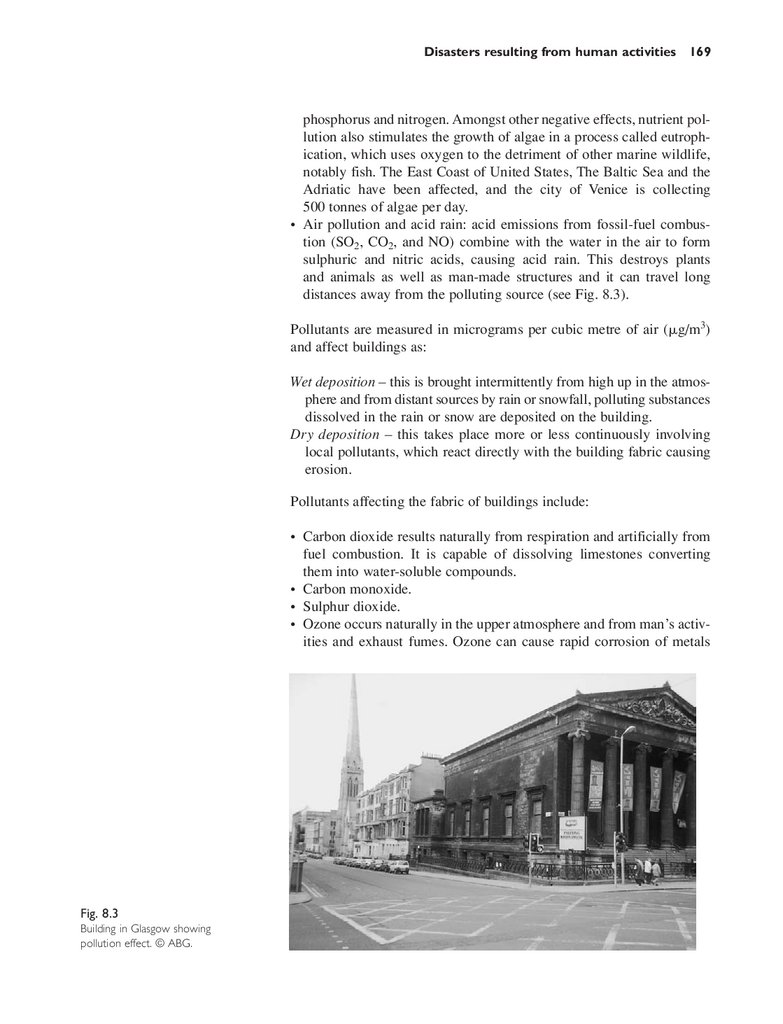
168
171
172
173
173
9.
viiiContents
9. Historic buildings destruction
General issues
Vulnerability
Specific type of damage
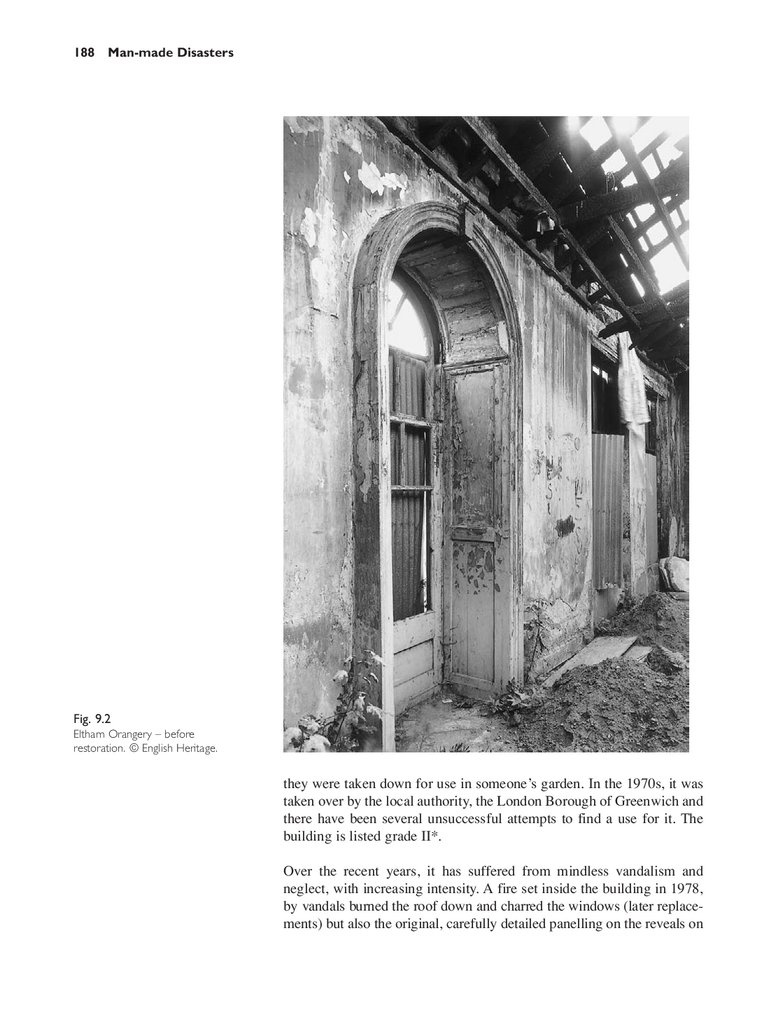
Vandalism and neglect
Case study – Eltham Orangery
Development demolition
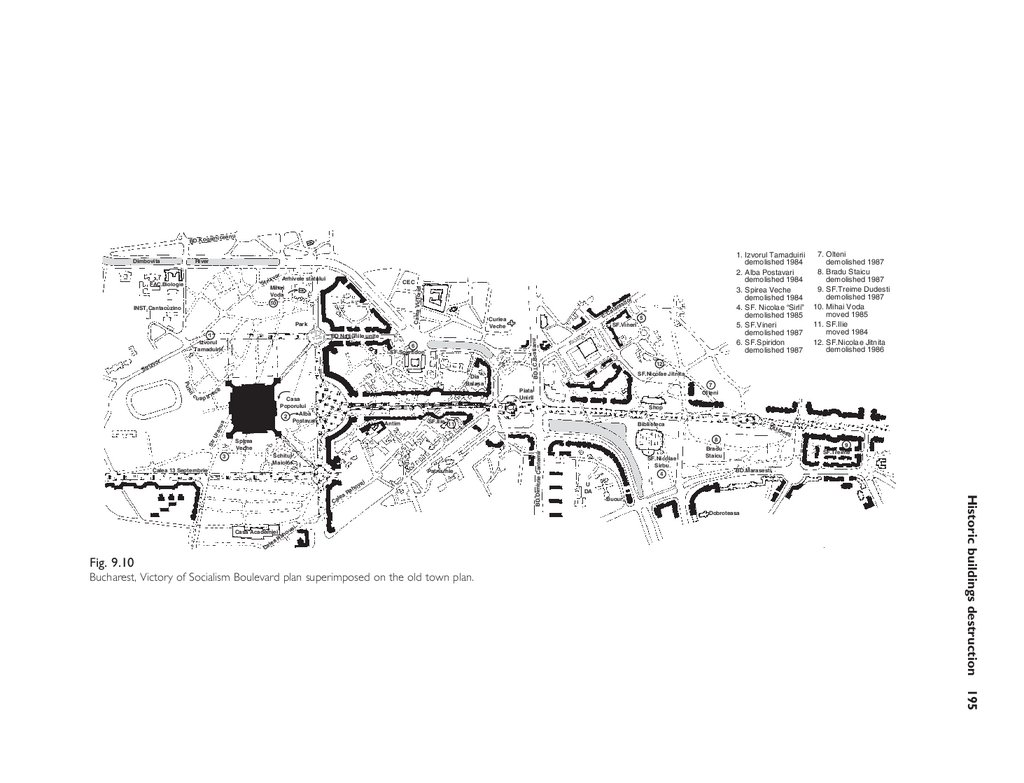
Case study – ‘THE HOUSE OF THE PEOPLE’,
Bucharest, Romania
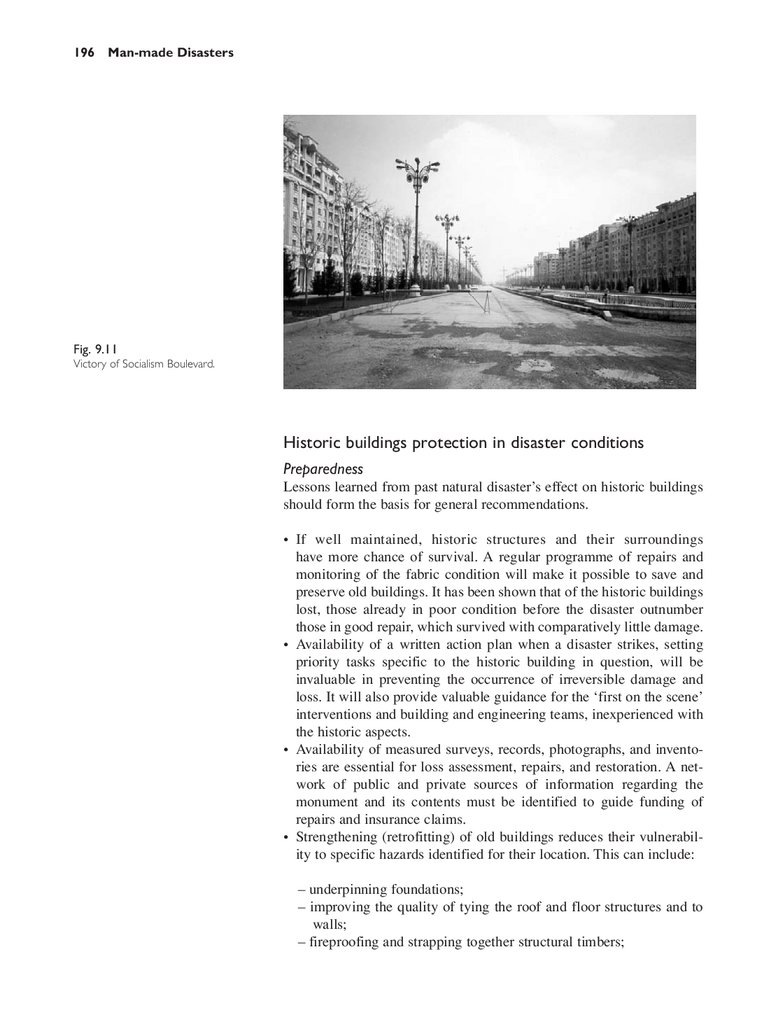
Historic buildings protection in disaster
conditions
Preparedness
Mitigation
Management
Appendices
Emergency action checklist and fact sheets
Earthquake emergency checklist
Flood emergency checklist
Before
During a flood watch
During a flood
During an evacuation
After
Inspecting utilities in a damaged home
Fact sheet: hurricanes and tornadoes
Before
During a hurricane watch
During a hurricane warning
After
During
After
Inspecting utilities in a damaged home
Mitigation
Fact sheet: extreme heat
Before
During
During a drought
Heat disorders
Fact sheet: landslides and mudflows
Before
During
After
Mitigation
Fact sheet: terrorism
Before
During
After
183
184
184
184
186
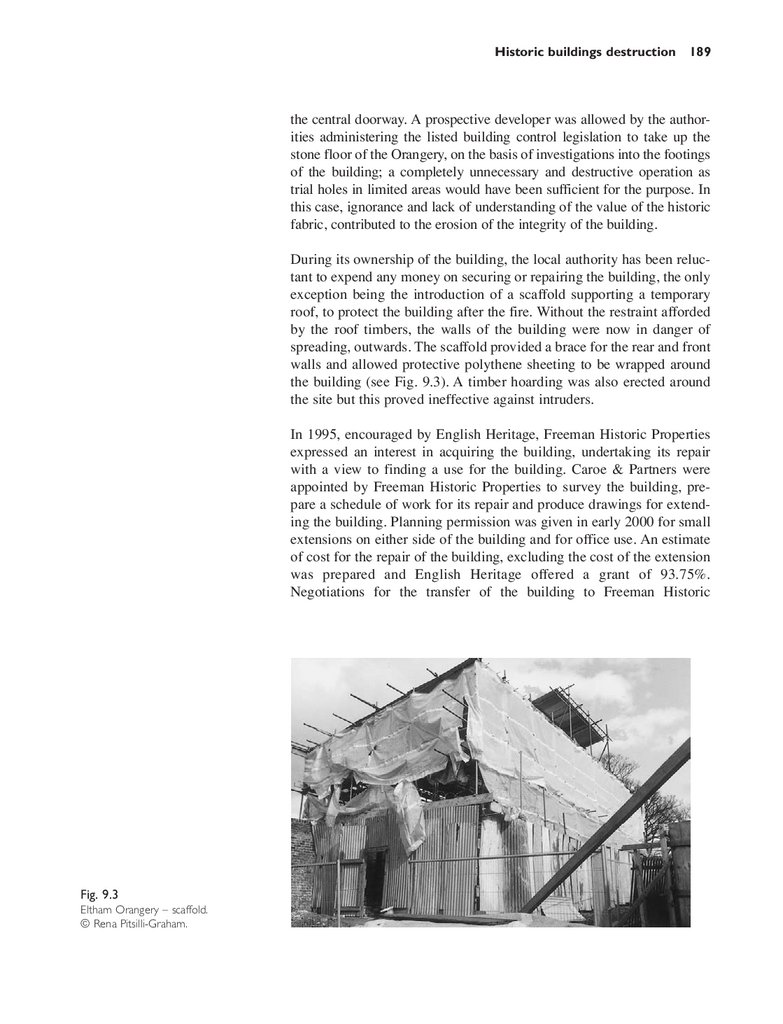
186
193
193
196
196
197
197
199
201
201
203
203
204
204
204
204
205
206
206
207
207
208
209
209
210
210
211
211
211
212
212
214
214
215
215
215
216
216
217
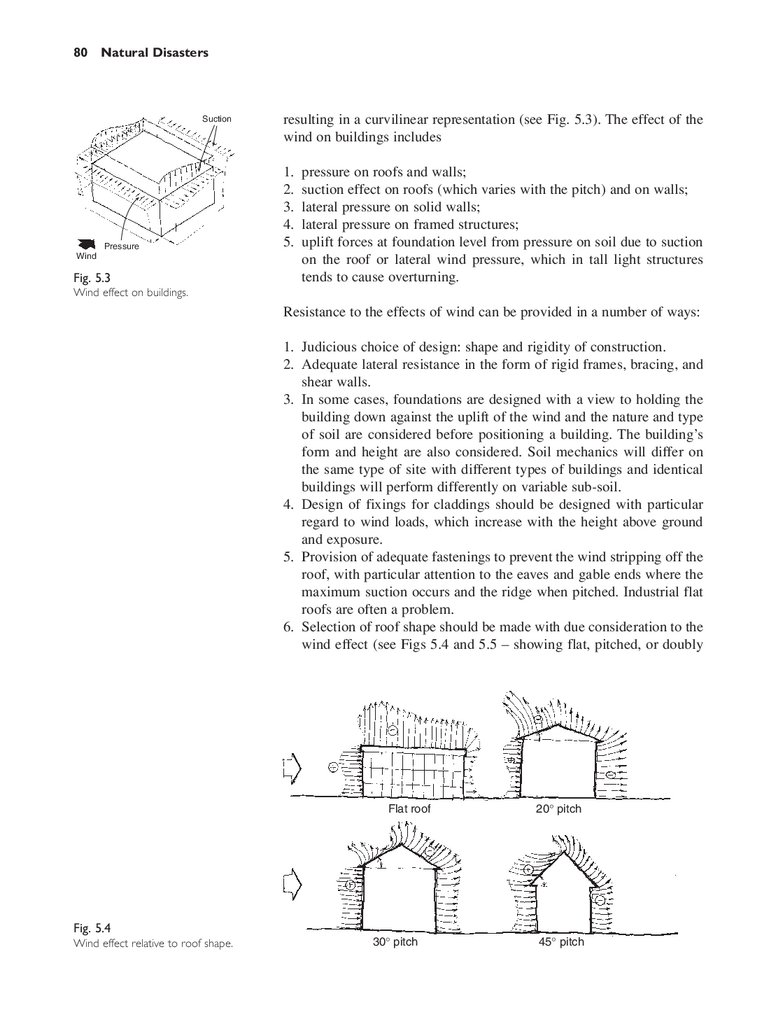
217
10.
Contents ixWildfire emergency checklist
Nuclear accident mitigation
219
221
Contributors
Prof. Ing. Alexandru Cismigiu
Bertrand Penneron
Miro Group
Jonathan P. Kumin, AIA
Christine Theodoropoulos, Anne Deutsch,
Josh Glavin, and Boora Architects, Inc.
Rena Pitsilli-Graham, Freeman Historic
Properties, Caroe & Partners
223
223
224
224
224
Information sources
Disaster websites
Earthquake websites and organizations
Weather information and organizations websites
Fire monitoring and information websites
227
227
229
229
229
Bibliography
Glossary
Index
225
226
231
233
237
11.
This Page Intentionally Left Blank12.
ForewordWhile it has become an accepted fact that the escalation of severe disaster events triggered by natural hazards and related technological and
environmental disasters is increasingly threatening communities worldwide, the journey towards integrated disaster reduction in light of these
threats is far from being achieved. The loss of human lives, livelihoods
and property – often due to human activities that lead to increasing
poverty, population growth and density, environmental degradation and
climate change – has forced the issue of disaster reduction and risk management higher on the policy agenda of affected governments as well as
multilateral and bilateral agencies and non-governmental organizations
(NGOs), and it is time to take action to incorporate disaster reduction at
all levels of society.
Losses from disasters caused by natural hazards will continue to
increase unless there is a shift towards proactive solutions, with due
recognition given to the reality that risk and vulnerability are indeed
cross-cutting concerns relating to the social, economic, environmental
and humanitarian sectors, with disaster reduction playing a fundamental
role in the agenda of sustainable development.
The increasing pressure of growing urban populations is a key
consideration in the planning and implementation of disaster reduction
initiatives. Protecting critical facilities and infrastructure is necessary for
the effective and sustainable functioning of any society in order to avoid
disruption or compromise in the event of a natural disaster. The planet
cannot afford the increasing costs and losses due to disasters, and while
we cannot always anticipate natural hazards, we can at least ensure that
we build our communities to be as resilient as possible by way of protecting urban infrastructure and implementing the appropriate codes,
policies and procedures to protect public safety.
Earthquakes in India, El Salvador and Turkey brought enormous loss
of life and widespread destruction across local affected communities,
largely attributable to the collapse of buildings. Contrary to the wider
perception that disasters only occur in developing countries suffering
from socio-economic constraints, the European floods in 2002 devastated historic landmarks and urban constructions, demonstrating that
even developed countries are not immune to the threat of natural
hazards.
13.
xiiForeword
The magnitude and destructive consequences of disaster have serious
implications for communities’ risk and vulnerability to disasters across
the planet. By learning more about disasters and their potential impacts,
we are able to put into practice our knowledge towards global disaster
reduction. Introduction to Natural and Man-Made Disasters and their
Effects on Buildings is one such example of the value of analysing natural hazards and learning from case studies and experiences appropriate
methodologies and best practices to enhance protection from hazard
impact so that societies can remain functional at the time of crisis or following a major disaster. We welcome the work of Roxana McDonald,
contributing to the advancement of disaster reduction efforts.
Sálvano Briceño
Director, UN/ISDR
United Nations Inter-Agency Secretariat for
the International Strategy for Disaster Reduction
14.
IntroductionIntroduction
We have all suffered from minor disasters, such as breaking a beautiful
vase – or possibly a major disaster such as a motor accident, but this
book deals with a wide variety of natural and man-made disasters. We
don’t like to think of disasters, hoping that they won’t happen in our lifetime. This book is, however, a useful reminder. It shows the incredibly
large range of possible disasters.
Curiously, floods are the most damaging, and with ‘greenhouse warming’, these are likely to increase. The most awful scenario that I can
imagine is if either the Aswan High Dam or the Yangtze Dam were to
break, and both are in seismic regions. If this disaster were to happen,
would it be ‘natural’ or ‘man-made’ – or both? The new 100-year flood
maps issued by the Environment Agency in the UK are not particularly
accurate, and cause insurance problems for householders. It is worth a
house purchaser’s while to assess the risk from flood, soil subsidence
and settlements.
Earthquakes immediately come to mind as the most lethal, because
their effect is almost instantaneous, whereas one should get some warning of flood. People living in seismic zones can do a great deal to mitigate the next earthquake, but are reluctant to do this, because they hope
it won’t happen in their lifetime. The trouble is that although earthquakes
may be probable, the exact timing of their arrival cannot yet be predicted. House owners can do a good deal to mitigate damage by good
maintenance of their property, and adding strength to possible weak
points. Studies after earthquake shows weaknesses in traditional construction, which should be rectified. A great deal can be done to protect
the infrastructure of services, and to plan ahead of a possible earthquake.
After earthquakes, delays in protecting buildings from the weather, and
repairing damaged buildings, increase the cost of repairs and cause
unnecessary hardship.
Unsurprisingly, Fire causes greatest loss of life in North America,
because of the use of softwood in domestic buildings. Fire is something
we must all guard against, and the causes are common. Unattended
cooking, cigarettes and arson are frequent causes of fire. Historic buildings are often subject to arson, and their security needs special care.
15.
xivIntroduction
Whereas most disasters are relatively local some, such as the Chernobyl
atomic meltdown or the release of cyanide into a tributary of the Danube
can affect many countries. Wild-fire can also extend over vast areas, and
severe storms can wreak widespread havoc to buildings, trees and communications.
This book ranges over the whole spectrum of disasters, ending with
Appendices giving emergency action checklists and fact sheets for earthquakes, floods, hurricanes and tornadoes, extreme heat, landslides and
mudflows, terrorism, wildfire emergencies, and nuclear accident mitigation. Wars are man-made disasters, made even worse by ethnic cleansing as in the former Yugoslavia, and collateral damage as in Afghanistan.
The author has had first hand experience with buildings affected by
natural and man made disasters. She stresses the effect of good design
and planning can have in limiting the impact of disasters on the built
environment. Legislation for good standards of construction reduces
vulnerability only if implemented.
National Governments, the United Nations Agencies and nongovernmental organisations face the urgent need to find solutions to the
escalating threat of macro disasters to mankind. Unfortunately, they
meet the reluctance of human nature to face potential disasters.
The author defines the purpose of her book – ‘to make a small step
towards providing a general understanding of the principal types of disaster, and in particular, how they can affect buildings. By understanding
how these natural and man-made events take place, how they evolve, and
how they affect us, we stand a better chance to build and live safely in
stronger communities resilient to disaster.’ I believe the author has
succeeded.
B. M. Feilden, May 2003
16.
AcknowledgementsMany people and organizations have been helpful in the process of
assembling information and writing this book. Amongst them, I am
especially grateful to the following, whose assistance and support have
made it possible for me to successfully complete what at times has been
daunting task:
First, I am indebted to my Contributors, for generously agreeing to share
their experiences and particular insight:
Professor Engineer Alexandru Cismigiu – Romania
Bertrand Penneron – architect – France
Miro Group – structural engineers – Romania and France
Jonathan P. Kumin – architect – Alaska
Christine Theodoropoulos – Associate Professor at the University of
Oregon, and students Anne Deutch and John Glavin
Rena Pitsilli-Graham – architect – UK
I am also grateful to:
Debbie and Rick Haller for introducing me to the American point
of view.
Linda Millard – architect – for the Alaskan connection.
Patrick Cherouette – Editor of Les Cahiers Techniques du Batiment, Group
Moniteur, France, for assisting with earthquake information and images.
Loic Babary – Mayor of Reignac sur Indre, for providing the village
archive flood images.
Andrew Beattie-Grant – for help with the research and the Irish connection.
Ing. Vlastar Apostolescu – for help with the finer points of earthquake
details.
Bogdan Goilav – structural engineer – Everest Engineering, France, for
the Romanian connection
I am especially grateful to Jane Fawcett for her generous encouragement
and advice.
17.
xvi AcknowledgementsOf the many organizations addressing the problems of coping with disasters, I am particularly grateful to the following, which have provided
indispensable information:
United Nations International Strategy for Disaster Reduction (ISDR)
United Nations Environment Programme (UNEP)
FEMA (US Federal Emergency Management Agency)
EERI (The Earthquake Engineering Research Institute)
A non-profit, technical society of engineers, geo-scientists, architects,
planners, public officials, and social scientists. EERI members include
researchers, practicing professionals, educators, government officials,
and building code regulators.
Grateful thanks to my editors:
Katherine MacInnes, for not giving up on the idea of this book, Alison
Yates for her supportive advice and Liz Whiting for helping it come into
being.
18.
1 IntroductionDefinition
The Oxford Dictionary defines disaster as a: Sudden or great misfortune,
calamity, great failure, ill starred event – (DIS ⫹ GK ASTRON star),
which gives an indication of how we perceive disaster: unpredictable,
outside our control, and overpowering; an event, controlled by the stars
and gods!
From antiquity to modern times, human existence has been marked by
the dramatic effects of nature’s hazardous power. Despite catastrophic
events, man did not give up, he tried to fight it, tried to coexist with it,
and tried to control it.
Most disaster sites have remained populated; sometimes through faith in
tradition and continuity, more often due to increased poverty and inability to travel to a better place. Archaeological excavations have revealed
that at the time the city of Pompeii was destroyed by the eruption of
Mount Vesuvius, many buildings had just been repaired following damage from an earthquake. All the same, the village of Pompeii and surrounding settlements continue to be populated to this day. The wine
from the vines planted on the warm mountain slopes is just as sought
after now as it was in Roman times, and tourists watch happily the
guides frying eggs on the hot bare ground near the volcano’s crater.
In building terms, man’s best efforts, like the seven wonders of the ancient
world, were time and time again defeated by nature. The Colossus of
Rhodes was destroyed by an earthquake in 224 BC, as was the Mausoleum
of Halicarnasus in 1402. The Alexandria Lighthouse survived a first earthquake in 500, as well as deliberate Arab attempts to demolish it in the
ninth century. Having escaped further earthquakes in 1182 and 1303, it
was finally destroyed, in 1375, by yet another earthquake.
With the advance of science and technology, man has significantly
improved his ability to cope with nature’s might, but at the same time,
he has also brought onto himself a new set of problems: global warming,
ecological disasters, mutating life forms.
19.
2 IntroductionWhen talking of disasters, most people tend to think of natural hazard
events, but this is no longer the case. There are natural disasters: such as
earthquakes, floods, tornadoes, hurricanes, droughts, volcanic eruptions
etc. man-made disasters such as war, terrorism, or industrial accidents,
and also disasters such as wild fires, which can be both, or man-made
disasters that can trigger natural ones and vice versa.
Whether we regard nature as a mysterious force to be feared and placated with offerings or as a generous ‘Mother Earth’ in need of our protection, Nature cannot be ignored and man is constantly learning how to
coexist with its unpredictable behaviour.
But when do Nature’s actions change from spectacular displays into disasters? When does man’s scientific and social progress become
calamity?
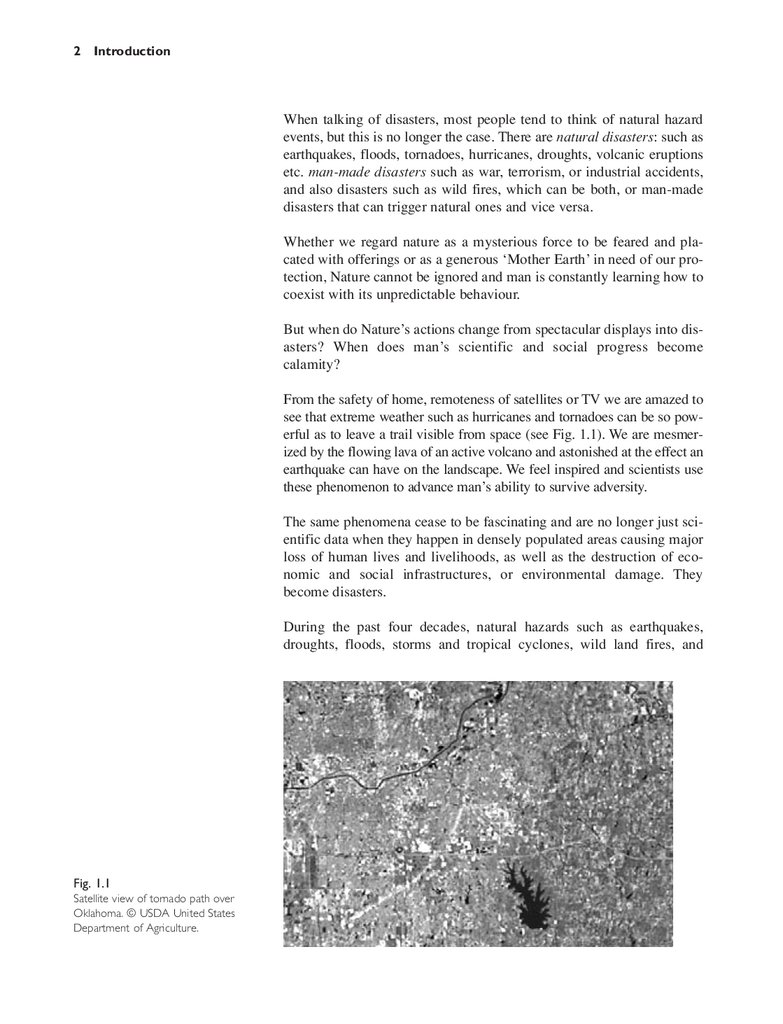
From the safety of home, remoteness of satellites or TV we are amazed to
see that extreme weather such as hurricanes and tornadoes can be so powerful as to leave a trail visible from space (see Fig. 1.1). We are mesmerized by the flowing lava of an active volcano and astonished at the effect an
earthquake can have on the landscape. We feel inspired and scientists use
these phenomenon to advance man’s ability to survive adversity.
The same phenomena cease to be fascinating and are no longer just scientific data when they happen in densely populated areas causing major
loss of human lives and livelihoods, as well as the destruction of economic and social infrastructures, or environmental damage. They
become disasters.
During the past four decades, natural hazards such as earthquakes,
droughts, floods, storms and tropical cyclones, wild land fires, and
Fig. 1.1
Satellite view of tornado path over
Oklahoma. © USDA United States
Department of Agriculture.
20.
Introduction 3volcanic eruptions have caused substantial devastation. Economic losses
have increased almost 10 times during this period.
Although recent natural disasters have not been the century’s worst, their
cost in human lives, homelessness, and economic disruption has escalated. The reasons for this are being put down to:
• An increase in frequency of natural phenomena. The explanations for
this vary and have been subject to considerable ongoing debate: global
warming, climate change, the destruction of the ecological balance
through unscrupulous depletion of natural resources by man, deforestation, planetary evolution influencing the Earth’s structure and behaviour.
• An increase in world’s population moving into areas vulnerable to
earthquakes, landslides, flooding, and other natural hazards. Poverty
and population increase mean that a growing number of people have
no other choice but to move to vulnerable or unsafe areas where housing is cheaper or easily available whilst the better off are able to move
to safer buildings and locations.
• Economic conditions in the developing world. Poverty and social economic pressure often make people more vulnerable as they often have
to move to unsafe land because there are no alternative at reasonable
cost close to employment opportunities. Also, economic factors create
an increasing infrastructure vulnerability either through lack of understanding by decision makers or by tendency by some builders to use
the cheapest design and materials for increased short-term returns on
their investments.
A United Nations evaluation assesses that in addition to the projected
estimation of 100 000 lives lost each year due to natural hazards alone,
the anticipated global cost of natural disasters will top US$ 300 billion
annually by the year 2050. (Source: United Nations background Paper
No. 5 for WSSD – World Summit on Sustainable Development.)
The compounded effects of natural and man-made catastrophes pose
escalating threats to humankind on a multitude of inter-related levels.
Governments, multilateral agencies, and non-governmental organizations
(NGOs) facing the urgent need to find solutions, are uniting their efforts
to find an international strategy for disaster reduction and risk management, but despite general good intentions it is proving a difficult task, as
economic and political priorities have continued to prevent conclusive
action.
At the 1992 Earth Summit in Rio, 172 governments took part at the conference, which examined the link between sustainable development and
the environment. The subsequent climate conference, leading to the
Kyoto agreement, created the framework to reduce global warming
through reducing carbon dioxide emissions, but the withdrawal of the
United States has been a serious setback.
21.
4 IntroductionIn September 2002, at the Johannesburg Summit, participants discussed
ways of creating a solid basis for implementing sustainable development
but progress on firm commitment has been disappointing. In the context
of a number of United Nations actions, a concerted effort is evolving
towards developing policies and measures to enable societies to: (a) be
more resilient to hazards; (b) undertake developments that do not
increase vulnerability to hazards.
While no country in the world is entirely safe, developing countries are
most exposed due to their inability to limit the impact of hazards. An
estimated 97% of natural disaster related deaths each year occur in
developing countries and the percentage of economic loss in relation to
the gross national product (GNP) far exceeds the one in developed
countries. (Source: UN International Strategy for Disaster Reduction –
background document to WSSD.)
The need to reverse trends in vulnerability is also highlighted by the fact
that the emphasis on disaster response and humanitarian assistance has
absorbed significant resources which would have been directed in development and risk reduction.
The subject of natural and man-made disasters is vast and the world is
becoming more and more concerned with analysing, reviewing, and
finding solutions.
The purpose of this book is to make a small step towards providing a
general understanding of the principal types of disaster and, in particular, of the way in which they can affect buildings. By understanding how
these natural and man-made events take place, how they evolve, and how
they affect us, we stand a better chance to build and live safely in
stronger communities resilient to disaster.
Disasters and buildings
In coping with disaster, man-made structures often constitute the weakest link. Buildings, roads, bridges, and dams – structures that normally
serve and protect us become the most dangerous places to be in when
disaster strikes (Figs 1.2 and 1.3).
Whilst it is not possible or desirable to turn buildings into bunkers and
war shelters, in the aftermath of recent disasters, a world traumatized by
the World Trade Centre collapse is seeking ways of enabling buildings
to better withstand such unforeseen threats.
The increased frequency of disasters and their cost in both human life
and recovery terms, can be partly accounted for by the fact that modern
society is more and more that of urban and suburban dwellers. When disasters hit unpopulated areas, they pass without much effect but when
22.
Introduction 5Fig. 1.2
Road after earthquake.
© National Geographic.
Fig. 1.3
Facades after earthquake.
© National Geographic.
they hit large concentrations of both people and property they create
urban disasters.
The greatest proportion of these losses is taken by the destruction of housing which also affects the ability of the survivors to recover physically and
financially. The impact of disasters such as earthquakes or storms on the
building stock in general has exposed the extent to which, in many countries, little or no provisions were made in respect of setting building
design standards to prevent, or at least minimize, hazard damage.
Whilst it would be impossible to anticipate random or freak events, it is
possible to ensure a basic resistance which would enable the occupants
of a building to escape to safety and that the building does not suffer
23.
6 Introductionmajor damage. The public may perceive these standards as guarantees of
a building’s safety but this cannot be the case.
The World Trade Centre in New York is a perfect example in this context:
designed to withstand 30000 tonnes of wind pressure as well as impact
from a jet aeroplane, (following a 1947 incident when the Empire State
Building was hit by one) it survived relatively unscathed a terrorist attack in
1994 (see Chapter C, c, page 148). However, when hit by not one but two
larger, fuel-loaded planes, events went beyond imaginable design parameters and as the fire protection was blown away by the immense impact force,
the heat generated by the burning fuel caused the structure to fail.
Nevertheless, the buildings stood long enough to allow thousands to escape.
Examining vulnerabilities of structures and exploring all available
avenues with the help of technology in order to identify possible changes
in design control mechanisms, improvements on building standards and
control standards has become a priority. Building designers must ask
themselves what are the greatest threats to the particular structure concerned and what can be done about it within available budgets. It is not
just new buildings that are concerned but existing ones as well.
Older cities have the difficult task of finding solutions for deteriorating
buildings and ageing bridges, constructed at a time when currently
accepted hazard threats were not envisaged and which together with
leaking tunnels, unreliable levees and pipelines may put them on the
brink of catastrophe.
This book aims at giving a general idea about the way disasters can affect
buildings. A better understanding of how buildings fail in these extreme
conditions can enable research and technology to make buildings and other
structures safer, more reliable and secure. Governments, architects, engineers, and other allied professions are joining efforts at all levels to examine vulnerabilities of structures, exploring all available avenues with the
help of technology in order to identify possible changes in design control
mechanisms, improvements on building standards and control standards.
What is a disaster?
A disaster can be defined as an event, either natural or man-made,
which has the ability to destroy life, natural landscape and man-made
infrastructure.
The same event, in different circumstances, could be a source of scientific data or a deadly catastrophe. It all depends on where it took place
and how it was perceived.
From the safe distance of a satellite, an earthquake in a deserted area will
provide a fascinating glimpse of earth’s activity as a living planet, but in
24.
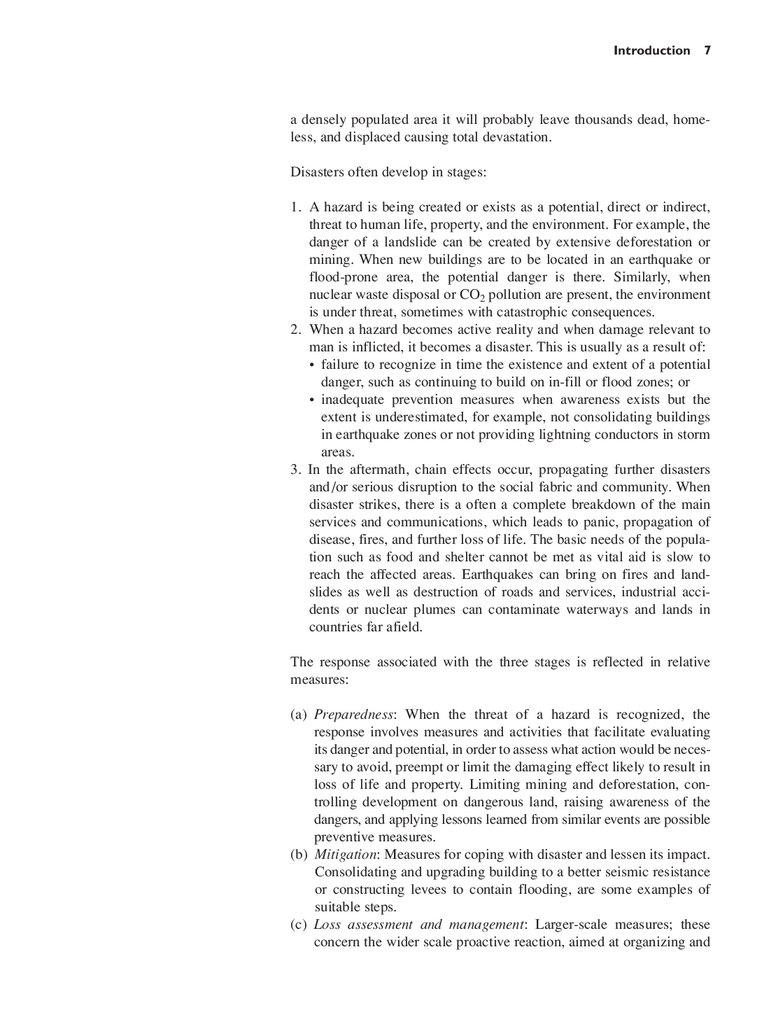
Introduction 7a densely populated area it will probably leave thousands dead, homeless, and displaced causing total devastation.
Disasters often develop in stages:
1. A hazard is being created or exists as a potential, direct or indirect,
threat to human life, property, and the environment. For example, the
danger of a landslide can be created by extensive deforestation or
mining. When new buildings are to be located in an earthquake or
flood-prone area, the potential danger is there. Similarly, when
nuclear waste disposal or CO2 pollution are present, the environment
is under threat, sometimes with catastrophic consequences.
2. When a hazard becomes active reality and when damage relevant to
man is inflicted, it becomes a disaster. This is usually as a result of:
• failure to recognize in time the existence and extent of a potential
danger, such as continuing to build on in-fill or flood zones; or
• inadequate prevention measures when awareness exists but the
extent is underestimated, for example, not consolidating buildings
in earthquake zones or not providing lightning conductors in storm
areas.
3. In the aftermath, chain effects occur, propagating further disasters
and/or serious disruption to the social fabric and community. When
disaster strikes, there is a often a complete breakdown of the main
services and communications, which leads to panic, propagation of
disease, fires, and further loss of life. The basic needs of the population such as food and shelter cannot be met as vital aid is slow to
reach the affected areas. Earthquakes can bring on fires and landslides as well as destruction of roads and services, industrial accidents or nuclear plumes can contaminate waterways and lands in
countries far afield.
The response associated with the three stages is reflected in relative
measures:
(a) Preparedness: When the threat of a hazard is recognized, the
response involves measures and activities that facilitate evaluating
its danger and potential, in order to assess what action would be necessary to avoid, preempt or limit the damaging effect likely to result in
loss of life and property. Limiting mining and deforestation, controlling development on dangerous land, raising awareness of the
dangers, and applying lessons learned from similar events are possible
preventive measures.
(b) Mitigation: Measures for coping with disaster and lessen its impact.
Consolidating and upgrading building to a better seismic resistance
or constructing levees to contain flooding, are some examples of
suitable steps.
(c) Loss assessment and management: Larger-scale measures; these
concern the wider scale proactive reaction, aimed at organizing and
25.
8 Introductionusing community resources for evaluating loss and preventing a serious disruption of its social and economic fabric taking place in the
event of an other disaster occurring.
Minimizing risks and improving chances of fighting the effects of a disaster as well as ensuring that the community is able to be self-contained
until the situation becomes more stable, are the main considerations of
this stage.
Disaster impact
Impact can vary depending on its type and the economic conditions in
the areas struck by a disaster.
(a) Relation between different types of disaster, death toll, and level of
damage (Table 1.1). Statistics show that 90% of high death toll
disasters (more than 100 deaths in a single event) tend to be
natural disasters of which, 40% floods, 20% tropical storms, and
15% earthquakes and drought.
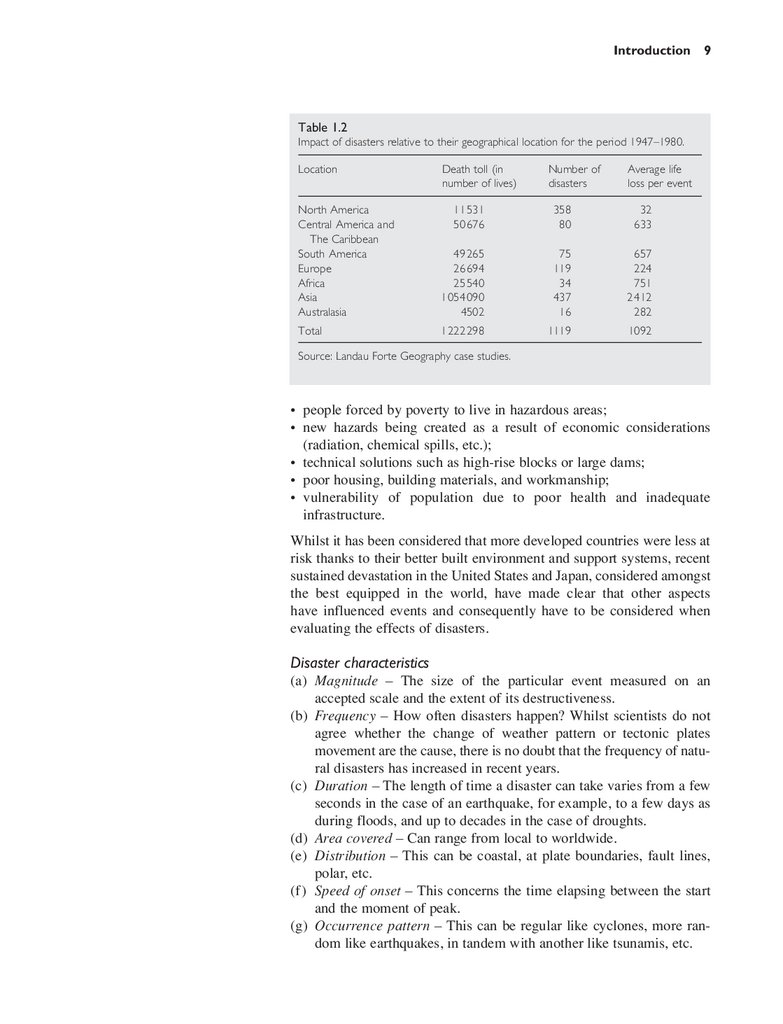
(b) Relation between the effect of disasters on developed and poorer countries. Analysis of the impact of disasters relative to their geographical
location (Table 1.2) show that poorer countries suffer more life loss
that more developed countries, where the impact is felt more in high
costs. Table 1.2 covers a sample period between 1947 and 1980.
This can be explained by a number of factors:
• population growth;
• use of marginal land for settlement for cost reasons and shortage of
suitable land due to environmental erosion;
Table 1.1
Types of disaster, death toll, and the level of damage.
Type of disaster
High death
toll (in number of
disasters)
Extensive
damage caused
(in number
of disasters)
Floods
Tropical storms
Epidemics
Earthquakes
Landslides
Storms
Droughts
Heat waves
Fires
Cold waves
Volcanoes
Tsunamis
Famine
Avalanches
202
153
133
102
54
46
21
20
15
14
12
9
4
2
76
73
Source: Landau Forte School case studies.
24
1
6
53
4
1
2
1
26.
Introduction 9Table 1.2
Impact of disasters relative to their geographical location for the period 1947–1980.
Location
Death toll (in
number of lives)
Number of
disasters
Average life
loss per event
North America
Central America and
The Caribbean
South America
Europe
Africa
Asia
Australasia
11 531
50 676
358
80
32
633
49 265
26 694
25 540
1 054 090
4502
75
119
34
437
16
657
224
751
2 412
282
Total
1 222 298
1119
1092
Source: Landau Forte Geography case studies.
• people forced by poverty to live in hazardous areas;
• new hazards being created as a result of economic considerations
(radiation, chemical spills, etc.);
• technical solutions such as high-rise blocks or large dams;
• poor housing, building materials, and workmanship;
• vulnerability of population due to poor health and inadequate
infrastructure.
Whilst it has been considered that more developed countries were less at
risk thanks to their better built environment and support systems, recent
sustained devastation in the United States and Japan, considered amongst
the best equipped in the world, have made clear that other aspects
have influenced events and consequently have to be considered when
evaluating the effects of disasters.
Disaster characteristics
(a) Magnitude – The size of the particular event measured on an
accepted scale and the extent of its destructiveness.
(b) Frequency – How often disasters happen? Whilst scientists do not
agree whether the change of weather pattern or tectonic plates
movement are the cause, there is no doubt that the frequency of natural disasters has increased in recent years.
(c) Duration – The length of time a disaster can take varies from a few
seconds in the case of an earthquake, for example, to a few days as
during floods, and up to decades in the case of droughts.
(d) Area covered – Can range from local to worldwide.
(e) Distribution – This can be coastal, at plate boundaries, fault lines,
polar, etc.
(f) Speed of onset – This concerns the time elapsing between the start
and the moment of peak.
(g) Occurrence pattern – This can be regular like cyclones, more random like earthquakes, in tandem with another like tsunamis, etc.
27.
10 IntroductionDisaster response
Whilst hazards will always exist, they do not have to become disasters.
Recent analysis of the more measurable hazards such as earthquakes,
storms, or floods shows that even in cases of historically lower intensity,
more hazards become disasters because they cause more loss of life and
socioeconomic disruption than ever before.
As shown earlier, the increase in world population, urbanization, and
poverty play a deciding role in the current situation, and international
action is being focused accordingly. Led by the United Nations
International Strategy for Disaster Reduction (ISDR) numerous initiatives are taken to address the problems at each disaster development
stage: preparedness, mitigation, and management.
Preparedness
Having survived devastation and loss, the obvious priority is to prevent
its recurrence, or if events are unavoidable, to be ready and able to use
available resources for relief and rehabilitation.
Achieving this is a matter for constant review and organization within a
number of main considerations:
• Obtaining reliable information about similar events and interfacing
with other communities – This means analysing what actually happened, both in terms of scientific data and loss valuation. At the time
of a crisis, when events are highly charged with emotion and human
tragedy, the media’s tendency to sensationalize and politicize events
can distort the facts. Data from humanitarian organizations can prove
invaluable in estimating the nature, quantities, and priorities of aid
required in any particular situation.
• Increasing public awareness of natural hazards and their causes –
Explaining to people what happened and what could happen again,
facilitating self-help as well as reducing the confusion that compounds
the disaster effects in the immediate aftermath.
• Reducing risk through minimizing the potential for damage – For
example, in an earthquake-prone area inspecting the remaining buildings and deciding on selective consolidations, setting design parameters for new buildings and restricting development in areas at risk
will help the community to survive in the long term.
• Recognizing the need to reverse trends in vulnerability to natural and
man-made disasters – Poverty, population growth, and social pressure
force people to live in dangerous locations and in low-cost unsafe
shelters because no other reasonable alternatives are available.
• Improving the ability to provide advance warning.
In the United States, the Federal Emergency Management Agency
(FEMA) has developed Project Impact as a national strategy programme
28.
Introduction 11to be implemented by 2010. It has two main objectives: (a) to increase
public awareness of natural hazard risks; and (b) to reduce the risk of
loss of life, injury, economic cost, and destruction of natural and cultural
resources. The five key elements of the programme are: (i) hazard identification and risk assessment; (ii) applied research and technology
transfer; (iii) public awareness training; (iv) incentives and resources;
and (v) leadership and coordination.
Many of the fact sheets provided in this book are based on, or adapted
from FEMA information. The availability and common sense approach
of this information makes raising the public self-awareness possible.
Mitigation
Mitigation includes any activity that prevents an emergency, reduces the
chance of an emergency happening, or lessens the damaging effects of
unavoidable emergencies. If disaster strikes, the immediate concern will
be how to cope with its effects. There will be an urgent need to search
for survivors and lead them to safety, provide relief and temporary shelter, stabilize the situation, and clear the debris.
Emergency services are usually first on the scene:
• fire-fighters;
• medical teams;
• engineering teams clearing dangerous areas.
Numerous governmental agencies and NGOs step in providing
emergency food and water supplies, medical assistance, transport, and
temporary shelter. Organizations such as FEMA in the United States,
have the responsibility to coordinate all state agencies involved, provide
assistance, temporary shelter, and general guidance.
Management
Once the crisis has passed, the main task is to plan ahead not only to prevent and be prepared should it happen again, but also to assimilate the
long-term implications of potential hazards and ensure that the community has the necessary mechanisms in place to continue functioning during and after the recurrence of an event.
The main concern is to put in place the necessary support for undertaking the principal tasks: prevention, preparedness, response, rehabilitation,
and recovery. Experts in post-disaster reconstruction issues such as
Prof. Mary C. Comerio of the University of California, increasingly
recognize the need for a type of disaster recovery that is capable of finetuning the input to differentiate the needs of public and private sectors,
housing and commercial buildings, offices and industrial concerns.
A key element to disaster management is capacity building and strengthening of institutional arrangements at all levels to address risk reduction
29.
12 Introductionin the long term. This involves:
1. Creating legislation related to disaster reduction, such as:
• land-use regulations to prevent the use of dangerous or flood-prone
land for building;
• building codes to ensure suitable standards for known hazards,
such as earthquake;
• environmental protection.
2. Facilitating cross-boundary harmonization in the management of natural hazards occurring in neighbouring countries.
3. Creating and implementing urban development strategies and landuse plans that identify suitable locations of facilities such as roads,
power plants in vulnerable areas.
4. Creating early warning systems and maintaining an information system capable of building people’s capacity to respond quickly at the
local level when crisis occurs.
Loss assessment
The extent to which community is able to survive disaster impact
depends a great deal on the ability to forecast losses, preparedness for
acting in emergency, and anticipation of likely characteristics of the
event. The increased frequency of disasters in the past decade has provided additional data, which is making it possible to re-evaluate past
decisions. An examination of lessons learned and a better understanding
of what happens when disaster strikes are essential in providing ways
and means for survival.
The sequence of events in the aftermath of disaster are:
(a) Emergency response. People are taken out of immediate danger,
fires put out, and victims taken to hospitals. Experts, volunteers, and
emergency services begin searching for survivors, making buildings
as safe as possible and assessing damage. Relief services direct people affected to temporary shelters, distribute humanitarian aid and
comfort the shocked population. At this stage, chaos and panic are
endemic and a clear and firm action is imperative if confusion is to
be avoided.
(b) Action to restore main services and provide temporary shelters.
(c) Fact-finding activities. Governments, technical experts, and insurers, etc. move in to evaluate the situation, establish what mediumand long-term aid is needed. Volunteers and officials work round the
clock to understand the implications, often under media pressure
highlighting personal tragedy and politicizing what is seen as a lack
of adequate support.
(d) Assessing the damage and loss. Escalating recovery costs have
become a major concern not only for their immediate drain of
resources but also for their likely medium- and long-term economic
effects and indirect losses that are not immediately perceived.
30.
Introduction 13Table 1.3 lists the 100 most expensive natural disasters of the twentieth,
but it is difficult to judge to what extent it reflects the real costs and longterm effect.
Table 1.3
The 100 most expensive natural disasters of the twentieth century.
1
2
3
4
5
6
7
8
9
10
11
12
13
14
15
16
17
18
19
20
21
22
23
24
25
26
27
28
29
30
31
32
33
34
35
36
37
38
39
40
41
42
43
44
45
46
Country
Year
Day
Month
Disaster
Region
Continent
Damage (US$)
Japan
Soviet Union
Soviet Union
China, P Rep
Italy
United States
United States
Indonesia
Korea, Dem P Rep
China, P Rep
United States
United States
Japan
Russia
United States
India
Japan
China, P Rep
China, P Rep
Iran, Islam Rep
China, P Rep
Australia
Italy
China, P Rep
Japan
United States
NA
Italy
Spain
China, P Rep
Poland
China, P Rep
Mexico
Spain
United States
NA
United States
NA
India
Algeria
China, P Rep
United States
Ecuador
United States
China, P Rep
Yugoslavia
1995
1991
1988
1998
1980
1992
1994
1997
1995
1996
1989
1993
1994
1994
1995
1990
1992
1991
1976
1990
1996
1982
1994
1994
1991
1992
1990
1997
1995
1995
1997
1994
1985
1983
1998
1989
1996
1990
1998
1980
1997
1995
1998
1977
1989
1979
20
27
7
6
23
24
17
16
18
1
4
12
8
11
8
1
9
8
7
10
7
10
8
5
11
1
5
7
6
8
Earthquake
Flood
Earthquake
Flood
Earthquake
Cycl., Hurr.,
Earthquake
Wild fire
Flood
Flood
Earthquake
Flood
Earthquake
Flood
Storm
Cycl., Hurr.,
Storm
Flood
Earthquake
Earthquake
Flood
Drought
Flood
Flood
Cycl., Hurr.,
Cycl., Hurr.,
Storm
Earthquake
Drought
Flood
Flood
Cycl., Hurr.,
Earthquake
Flood
Heat. wave
Cycl., Hurr.,
Cycl., Hurr.,
Storm
Cycl., Hurr.,
Earthquake
Cold. wave
Cycl., Hurr.,
Flood
Cold. wave
Flood
Earthquake
E. Asia
Russia. Fed.
Russia. Fed.
E. Asia
Euro. Union
N. America
N. America
SE. Asia
E. Asia
E. Asia
N. America
N. America
E. Asia
Russia. Fed.
N. America
S. Asia
E. Asia
E. Asia
E. Asia
S. Asia
E. Asia
Oceania
Euro. Union
E. Asia
E. Asia
N. America
Euro. Union
Euro. Union
Euro. Union
E. Asia
Rest. Europ
E. Asia
C. America
Euro. Union
N. America
Caribbean
N. America
Euro. Union
S. Asia
N. Africa
E. Asia
N. America
S. America
N. America
E. Asia
Rest. Europ
Asia
Europe
Europe
Asia
Europe
Americas
Americas
Asia
Asia
Asia
Americas
Americas
Asia
Europe
Americas
Asia
Asia
Asia
Asia
Asia
Asia
Oceania
Europe
Asia
Asia
Americas
Europe
Europe
Europe
Asia
Europe
Asia
Americas
Europe
Americas
Americas
Americas
Europe
Asia
Africa
Asia
Americas
Americas
Americas
Asia
Europe
131 500 000 000
60 000 000 000
20 500 000 000
20 000 000 000
20 000 000 000
20 000 000 000
20 000 000 000
17 000 000 000
15 000 000 000
12 600 000 000
12 000 000 000
12 000 000 000
11 700 000 000
11 200 000 000
10 000 000 000
8 000 000 000
7 800 000 000
7 500 000 000
7 000 000 000
7 000 000 000
6 314 500 000
6 000 000 000
6 000 000 000
5 460 000 000
5 200 000 000
5 000 000 000
4 600 000 000
4 524 900 000
4 500 000 000
4 450 000 000
4 300 000 000
4 000 000 000
4 000 000 000
3 900 000 000
3 700 000 000
3 579 000 000
3 400 000 000
3 200 000 000
3 010 000 000
3 000 000 000
3 000 000 000
3 000 000 000
2 869 300 000
2 800 000 000
2 789 000 000
2 700 000 000
17
19
4
8
16
10
31
18
27
20
5
27
11
25
26
11
6
9
9
1
9
4
28
10
19
25
16
17
5
25
9
10
8
6
7
6
6
9
8
7
9
9
2
6
10
1
10
2
14
15
7
4
Typh.
Typh.
Typh.
Typh.
Typh.
Typh.
Typh.
Typh.
Typh.
31.
14 IntroductionTable 1.3 Continued
47
48
49
50
51
52
53
54
55
56
57
58
59
60
61
62
63
64
65
66
67
68
69
70
71
72
73
74
75
76
77
78
79
80
81
82
83
84
85
86
87
88
89
90
91
92
93
94
95
96
97
98
99
100
Country
Year
Day
China, P Rep
Argentina
Zimbabwe
China, P Rep
Brazil
United States
India
Dominican Rep
Bangladesh
United States
Bangladesh
Canada
Honduras
Italy
Soviet Union
United States
United States
China, P Rep
NA
United States
Bangladesh
Netherlands
United States
United States
Mongolia
France
Georgia
Japan
Korea, Dem P Rep
United Kingdom
Mexico
United States
China, P Rep
Iran, Islam Rep
India
Chile
China, P Rep
China, P Rep
El Salvador
Spain
United States
United States
United States
United States
Virgin Is (US)
United States
China, P Rep
United States
Mexico
United States
France
Argentina
Germany, Fed Rep
India
1997
1998
1982
1993
1978
1979
1990
1998
1988
1972
1998
1992
1998
1966
1991
1995
1997
1994
1993
1983
1991
1995
1994
1986
1996
1987
1991
1990
1996
1987
1993
1983
1980
1986
1996
1985
1986
1996
1986
1981
1985
1991
1996
1997
1995
1965
1931
1969
1988
1995
1985
1985
1976
1990
19
Month
8
7
12
25
15
18
8
26
4
9
11
29
10
17
30
20
9
1
23
15
29
21
15
15
19
17
31
6
3
10
10
27
20
30
4
15
7
17
14
8
2
6
9
8
9
8
6
7
6
10
11
5
3
1
8
3
12
4
1
1
7
2
10
4
6
7
10
6
8
7
12
11
3
8
9
10
10
10
12
1
9
9
7
8
9
1
1
10
1
5
Disaster
Cycl., Hurr.,
Flood
Drought
Flood
Drought
Cycl., Hurr.,
Storm
Cycl., Hurr.,
Flood
Cycl., Hurr.,
Flood
Cold. wave
Cycl., Hurr.,
Flood
Flood
Storm
Flood
Flood
Storm
Storm
Cycl., Hurr.,
Flood
Cold. wave
Heat. wave
Wild fire
Storm
Earthquake
Flood
Flood
Storm
Storm
Cycl., Hurr.,
Flood
Flood
Cycl., Hurr.,
Earthquake
Flood
Cycl., Hurr.,
Earthquake
Drought
Cycl., Hurr.,
Wild fire
Storm
Flood
Cycl., Hurr.,
Cycl., Hurr.,
Flood
Cycl., Hurr.,
Cycl., Hurr.,
Flood
Storm
Flood
Storm
Storm
Typh.
Typh.
Typh.
Typh.
Typh.
Typh.
Typh.
Typh.
Typh.
Typh.
Typh.
Typh.
Typh.
Typh.
Region
Continent
Damage (US$)
E. Asia
S. America
E. Africa
E. Asia
S. America
N. America
S. Asia
Caribbean
S. Asia
N. America
S. Asia
N. America
C. America
Euro. Union
Russia. Fed.
N. America
N. America
E. Asia
NA
N. America
S. Asia
Euro. Union
N. America
N. America
E. Asia
Euro. Union
Russia. Fed.
E. Asia
E. Asia
Euro. Union
C. America
N. America
E. Asia
S. Asia
S. Asia
S. America
E. Asia
E. Asia
C. America
Euro. Union
N. America
N. America
N. America
N. America
Caribbean
N. America
E. Asia
N. America
C. America
N. America
Euro. Union
S. America
Euro. Union
S. Asia
Asia
Americas
Africa
Asia
Americas
Americas
Asia
Americas
Asia
Americas
Asia
Americas
Americas
Europe
Europe
Americas
Americas
Asia
Americas
Americas
Asia
Europe
Americas
Americas
Asia
Europe
Asia
Asia
Asia
Europe
Americas
Americas
Asia
Asia
Asia
Americas
Asia
Asia
Americas
Europe
Americas
Americas
Americas
Americas
Americas
Americas
Asia
Americas
Americas
Americas
Europe
Americas
Europe
Asia
2 675 000 000
2 500 000 000
2 500 000 000
2 450 000 000
2 300 000 000
2 300 000 000
2 200 000 000
2 193 400 000
2 137 000 000
2 100 000 000
2 000 000 000
2 000 000 000
2 000 000 000
2 000 000 000
2 000 000 000
2 000 000 000
2 000 000 000
1 810 000 000
1 800 000 000
1 800 000 000
1 780 000 000
1 760 000 000
1 755 000 000
1 750 000 000
1 712 800 000
1 700 000 000
1 700 000 000
1 700 000 000
1 700 000 000
1 700 000 000
1 670 000 000
1 650 000 000
1 600 000 000
1 560 000 000
1 500 300 000
1 500 000 000
1 500 000 000
1 500 000 000
1 500 000 000
1 500 000 000
1 500 000 000
1 500 000 000
1 500 000 000
1 500 000 000
1 500 000 000
1 420 000 000
1 400 000 000
1 420 000 000
1 350 000 000
1 340 000 000
1 320 000 000
1 300 000 000
1 300 000 000
1 300 000 000
Source: The Disaster Center, EM-DAT: The OFDA/CRED, International Disaster Database; www.md.ucl.ac.be/cred
32.
Introduction 15In the aftermath of a disaster, decisions are often made under pressure
and sometimes based on inaccurate information. Aid and resources
available are usually provisions made on the basis of the previous similar crisis, and, more often than not, it is found that circumstances have
altered, sometimes to a degree which renders provisions available totally
inappropriate or inadequate. A closer look at the factors involved may
help in avoiding the repetition of past mistakes and errors of judgement.
• Accuracy of assessment – This is subject to how reliable is the data
used. Damage evaluation is usually established on the basis of insurance claims and government aid or loans. This does not take into
account undeclared business losses and privately funded repairs. Also,
over-evaluation or inclusion of very minor damage in claims distorts
the true situation. When based on past relief costs, it is not always
sure that all the funds expended were necessary or appropriate to the
damage sustained and there is a risk for inadvertently compounding
management errors and bad decisions.
• Measure of loss – Primarily loss is measured in lives lost and value of
built infrastructure. This is neither straightforward nor immediately
available for logistic and technical reasons. Analysis of past events
often shows substantial discrepancies between estimated losses and
number of insurance and state aid claims. The US Board on Natural
Disasters of the National Research Council has appointed a new
Committee on Assessing the Costs of Natural Disasters. The losses
from natural disasters are far reaching, including direct damage to
buildings, infrastructure elements, inventory, and natural resources
and indirect costs from lost productivity and wages. To understand the
scope and magnitude of the costs before action can begin, a multidisciplinary group of experts will identify the cost components that will
be most useful for accurate characterization of disaster events. The
committees report will help FEMA in its efforts to develop successful
mitigation policies for natural disasters.
• Coordination between the emergency and relief activities and decisions about recovery aid – Most experts and analysts have concluded
that whilst financing the recovery of public infrastructure must be
immediate, the distribution of funds for general private recovery assistance should commence only when sufficient reliable information is
available to enable them to evaluate the true extent of the need.
• Careful evaluation of past claims – This must be part of the recovery
policy to ensure that adequate provisions are made.
Strategy trends
It is now widely accepted that more effective disaster prevention policies
would not only save millions of lives but would also release the
substantial funds currently spent in intervention and relief for use in
sustainable development initiatives which would reduce the risk of
disasters in the long term.
33.
16 IntroductionIn preparation for the Johannesburg World Summit on Sustainable
Development in September 2002, United Nations ISDR looked into
ways of understanding the link between development environment and
natural disasters. The current conclusion is that policies have to counteract a number of present global trends, which enable exposure to
natural hazards to turn into disasters.
Human and infrastructure vulnerability
Least developed countries have been subject to highest population
growth. Poverty, AIDS, and socioeconomic pressures such as unemployment cause migration and force people to live in dangerous locations, on unsafe land and in low-cost, sub-standard dwellings simply
because there is no other alternative available to them. People are made
further vulnerable by political instability and lack of personal security.
Exposure to disasters exacerbates their predicament into chronic poverty
and total inability to cope.
Deficiencies highlighted by recent disasters have also exposed the poor
understanding of decision makers of disaster risks, allowing the
construction of poorly designed buildings with cheap materials and inadequate protection against potential risks such as seismic or storm damage.
The ‘domino effect’ where natural hazards trigger technological ones,
which are followed by environmental and humanitarian disasters can
have global repercussions. In the context of a globalized society, both
urban and rural populations are dependent on services distribution at a
national and international level to such an extent that failure of one
sector can affect people in areas not directly hit, causing general chaos
and infrastructure failure.
Environmental degradation
Environmental degradation is often a factor in transforming a natural
hazard or climatic extreme into a disaster. For example, river and lake
flooding is aggravated and even caused by deforestation, which causes
erosion, clogging of rivers, and river bed mutation.
The catastrophic consequence of unchecked emissions of greenhouse
gases on climate changes has remained an unresolved issue, countries
and political opinions disputing the facts in pursuit of different socioeconomic agendas.
The overuse of natural resources causes pollution leading ultimately to
global changes in the environment. The human-induced climate change,
according to recent projections of the Intergovernmental Panel on
Climate Change, is likely to result in more water-related disasters with
changes in temperature and rainfall variations. These affect the environment through accelerated desertification and degradations damaging
agriculture, water resources, and human health.
34.
Introduction 17It follows that reversing the current trends of environmental degradation
must be a strategic priority in reducing disaster risks.
Growing poverty in developing countries
Poverty and hazard push people into exploiting environmental resources
for survival, which only compounds their exposure to disasters such as
drought, floods, or landslides. Whilst it has been established that in
developed countries, economic losses caused by natural disasters have
risen, their cost has not exceeded the national gross domestic product
(GDP) wealth. In developing countries, on the other hand, in the context
of receding economies, disaster losses are steadily overtaking GDP
growth.
The reversal of current trends of environmental degradation with sustainable management of natural resources such as reforestation, suitable
use of land and good management of rivers and coastal areas would
increase the resilience to disasters of vulnerable communities.
The UN strategy for development policies to reduce vulnerability to
disasters is currently promoting the following activities:
1. Motivating societies at risk to become engaged in the conscious management of risk and reduction of vulnerability by:
• obtaining the commitment of the public authorities;
• increasing public awareness;
• stimulating interdisciplinary and intersectional partnerships;
• Encouraging and facilitating the transfer of relevant data and
information.
2. Developing more effective methodologies for assessing the economic
impact of natural disasters to secure investment and trade continuity.
3. Harmonizing management of disasters that spread over several
countries at a time.
4. Developing comprehensive urban development strategies and
land-use plans.
5. Ensuring that environmental impact reviews systematically cover the
hazard proneness and consider reduction measures where appropriate.
6. Encouraging proactive solutions in disaster risk reduction development.
35.
36.
Part INatural Disasters
37.
38.
2 EarthquakesWhat happens during an earthquake
An earthquake is a wave-like vibration, which travels through the earth’s
crust. The Earth is a living planet and forces under the surface layer (the
lithosphere) are in constant turmoil affecting its surface.
Observation of a number of phenomena, such as the drift of continents,
grouping of volcanic eruptions, or ridges on the ocean floors, has led to
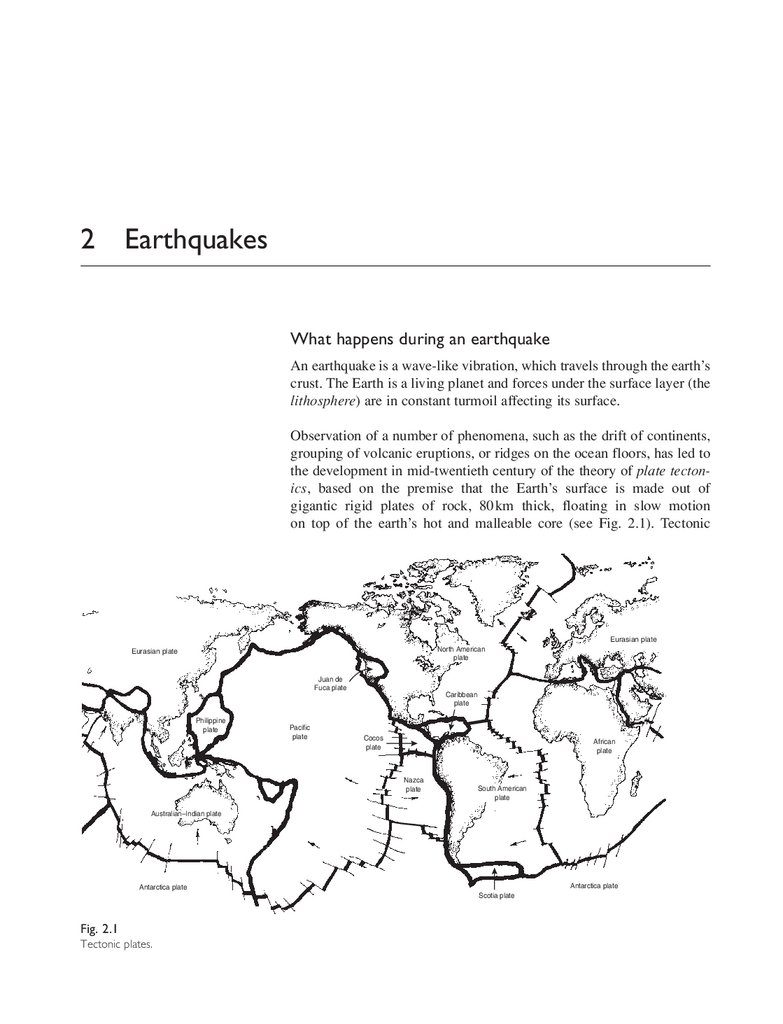
the development in mid-twentieth century of the theory of plate tectonics, based on the premise that the Earth’s surface is made out of
gigantic rigid plates of rock, 80 km thick, floating in slow motion
on top of the earth’s hot and malleable core (see Fig. 2.1). Tectonic
Eurasian plate
North American
plate
Eurasian plate
Juan de
Fuca plate
Caribbean
plate
Philippine
plate
Pacific
plate
Cocos
plate
African
plate
Nazca
plate
South American
plate
Australian–Indian plate
Antarctica plate
Antarctica plate
Scotia plate
Fig. 2.1
Tectonic plates.
39.
22 Natural Disastersearthquakes occur when accumulated strain is suddenly released. Rocks
break and brittle failure takes place.
Tectonic plates
There are seven major plates, sub-divided into smaller ones, and they
change size and position moving relative to one another at speeds
between 1 and 10 cm/year. As they move, intense geologic activity, such
as earthquakes, formation of mountain ranges, or volcanic eruptions
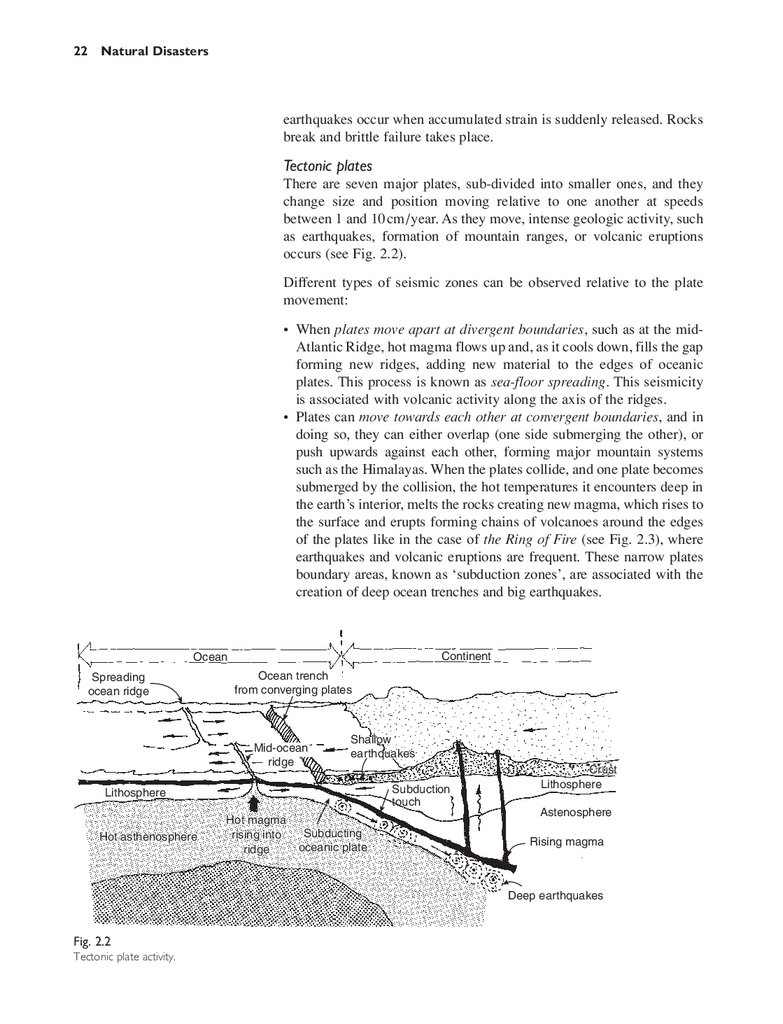
occurs (see Fig. 2.2).
Different types of seismic zones can be observed relative to the plate
movement:
• When plates move apart at divergent boundaries, such as at the midAtlantic Ridge, hot magma flows up and, as it cools down, fills the gap
forming new ridges, adding new material to the edges of oceanic
plates. This process is known as sea-floor spreading. This seismicity
is associated with volcanic activity along the axis of the ridges.
• Plates can move towards each other at convergent boundaries, and in
doing so, they can either overlap (one side submerging the other), or
push upwards against each other, forming major mountain systems
such as the Himalayas. When the plates collide, and one plate becomes
submerged by the collision, the hot temperatures it encounters deep in
the earth’s interior, melts the rocks creating new magma, which rises to
the surface and erupts forming chains of volcanoes around the edges
of the plates like in the case of the Ring of Fire (see Fig. 2.3), where
earthquakes and volcanic eruptions are frequent. These narrow plates
boundary areas, known as ‘subduction zones’, are associated with the
creation of deep ocean trenches and big earthquakes.
Continent
Ocean
Spreading
ocean ridge
Ocean trench
from converging plates
Mid-ocean
ridge
Shallow
earthquakes
Subduction
touch
Lithosphere
Hot asthenosphere
Hot magma
maoma
rising into
ridge
Subducting
oceanic plate
Crust
Lithosphere
Astenosphere
Rising magma
Deep earthquakes
Fig. 2.2
Tectonic plate activity.
40.
Earthquakes 233 1964
Anchorave
Alaska
Aleutian trench
Kurive
trench
Japan trench
Phillippine trench
8 1995
Kobe
Japan
1906 I
San Francisco
J
1982
Elchicon
Mexico
1991
7 Mt Pinotac
Phillipines
Middle American trench
2 1963
Mt Agung
Bali
Peru–Chile
trench
Java trench
Tonga trench
6
1991 e
Tudson
Curle
9 1996
Mount
Ruapehu
New Zealand
South Sandwich trench
Fig. 2.3
The ‘Ring of Fire’.
In the case of an earthquake under the sea, one side of the ocean floor
drops suddenly, sliding under the other plate and in doing so, creates a
vertical fault which generates a giant wave, a ‘tsunami’. The tsunami
travels at fantastic speeds, equalling that of commercial jetliners, but
they can hardly be seen on the surface of the water. It is only when
they reach the shore that they become destructive giants.
When oceanic plates collide with continental plates, the oceanic one
slides beneath the continental plate forming a deep ocean trench, such
as that which occurs at the boundary between the oceanic Nazca plate
and the continental South American plate.
• Plates can also slide past each other horizontally, at transform fault
boundaries. When the edges scrape each other tightly, they create tensions along the boundaries, which are associated with shallow-focus
seismic events, unaccompanied by volcanic activity. San-Andreas
Fault, or the Anatolian Fault in North Turkey are examples of this type
of events.
Earthquake characteristics
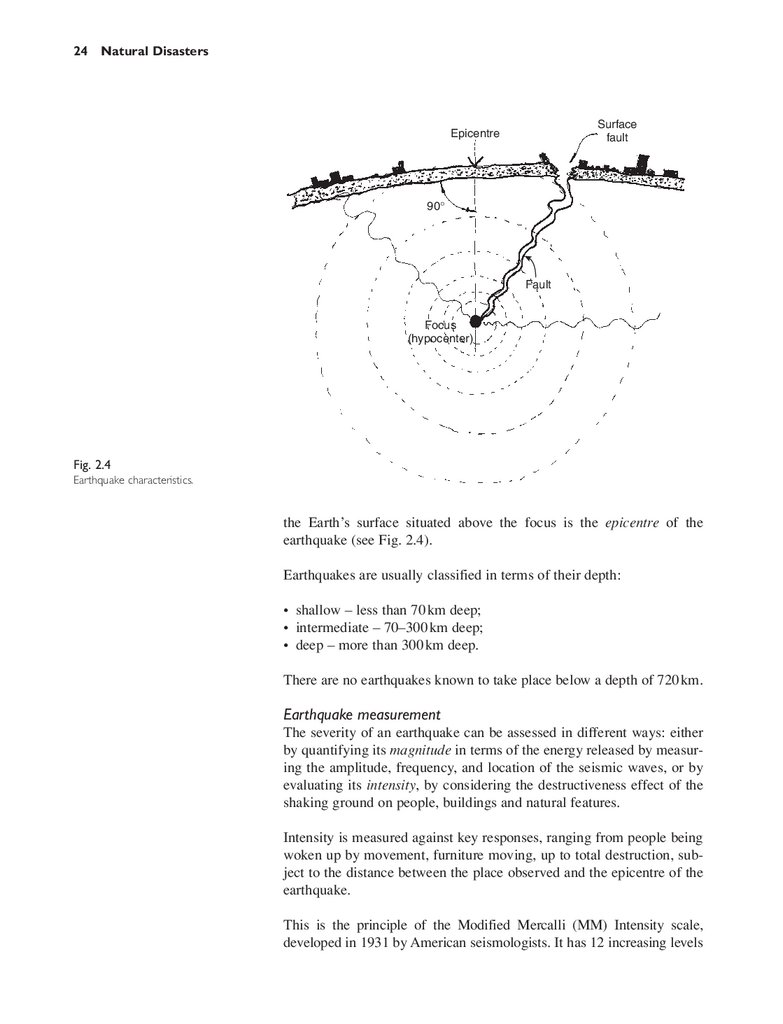
The area of fault where a sudden rupture takes place, usually within the
Earth, is called the focus or hypocentre of the earthquake. The point on
41.
24 Natural DisastersSurface
fault
Epicentre
90°
Fault
Focus
(hypocenter)
Fig. 2.4
Earthquake characteristics.
the Earth’s surface situated above the focus is the epicentre of the
earthquake (see Fig. 2.4).
Earthquakes are usually classified in terms of their depth:
• shallow – less than 70 km deep;
• intermediate – 70–300 km deep;
• deep – more than 300 km deep.
There are no earthquakes known to take place below a depth of 720 km.
Earthquake measurement
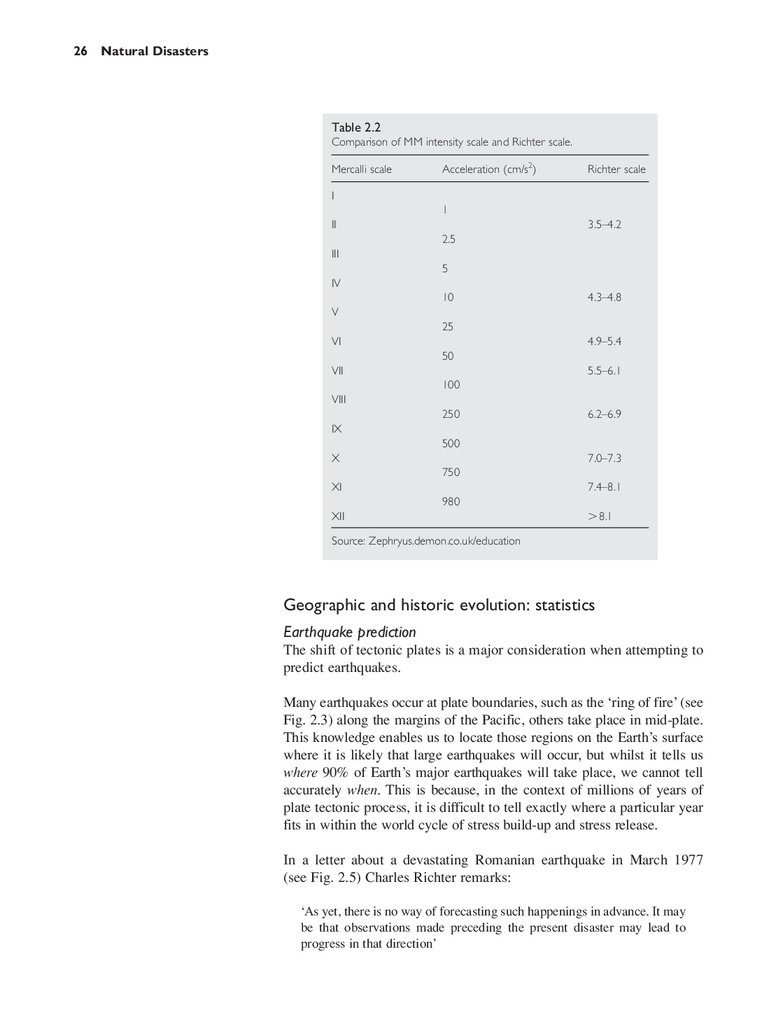
The severity of an earthquake can be assessed in different ways: either
by quantifying its magnitude in terms of the energy released by measuring the amplitude, frequency, and location of the seismic waves, or by
evaluating its intensity, by considering the destructiveness effect of the
shaking ground on people, buildings and natural features.
Intensity is measured against key responses, ranging from people being
woken up by movement, furniture moving, up to total destruction, subject to the distance between the place observed and the epicentre of the
earthquake.
This is the principle of the Modified Mercalli (MM) Intensity scale,
developed in 1931 by American seismologists. It has 12 increasing levels
42.
Earthquakes 25ranging from: I – hardly noticeable vibration, II – felt by most people at
rest, through to VII – difficult for a person to remain standing, X – most
structures destroyed, and XII – catastrophic devastation. It is not
scientifically arrived at and is based on arbitrary ranking based on
observation.
Magnitude quantifies the energy released at the hypocentre of an earthquake as expressed by the amplitude of the seismic wave measured by
instruments, and is represented by a single value.
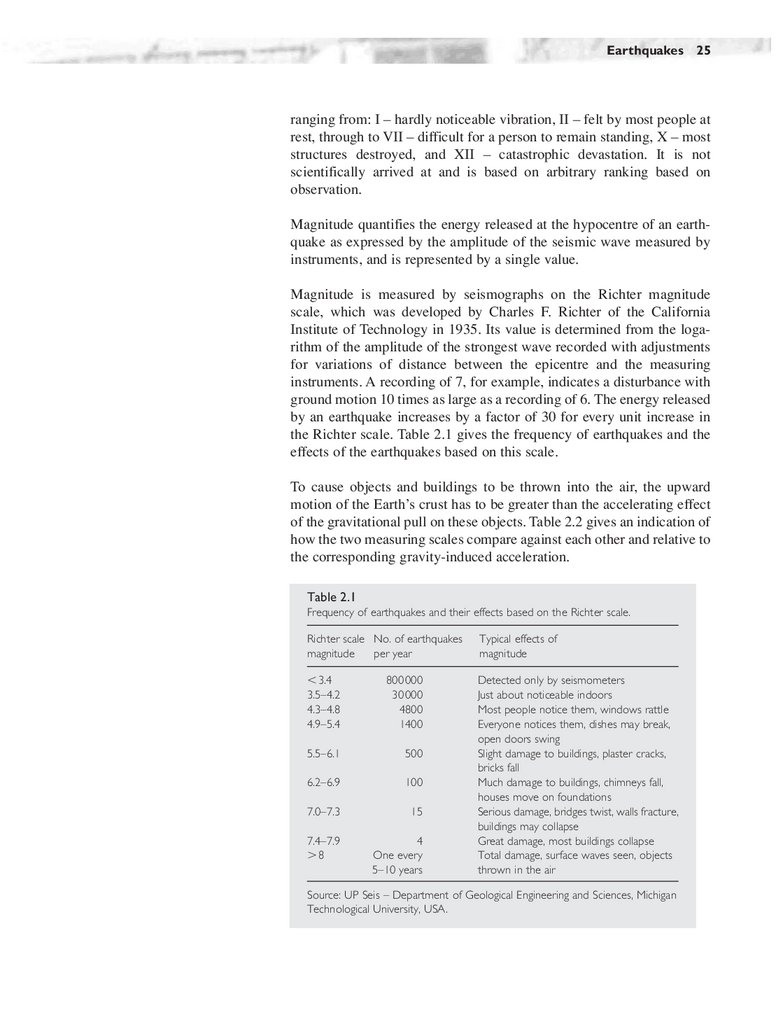
Magnitude is measured by seismographs on the Richter magnitude
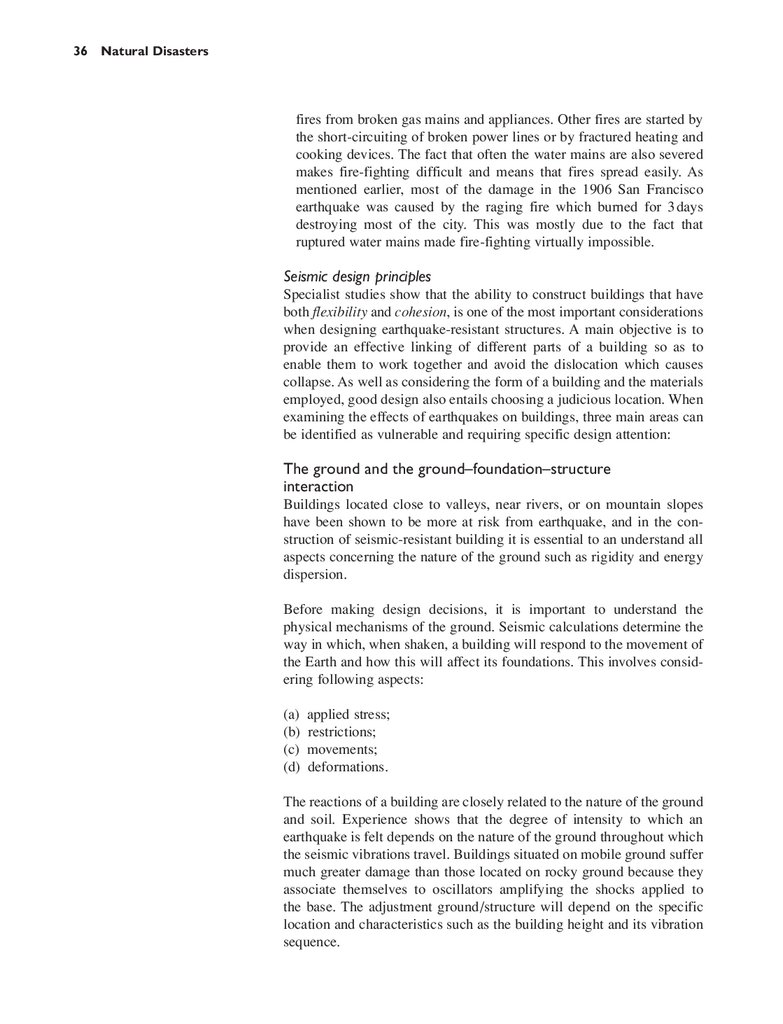
scale, which was developed by Charles F. Richter of the California
Institute of Technology in 1935. Its value is determined from the logarithm of the amplitude of the strongest wave recorded with adjustments
for variations of distance between the epicentre and the measuring
instruments. A recording of 7, for example, indicates a disturbance with
ground motion 10 times as large as a recording of 6. The energy released
by an earthquake increases by a factor of 30 for every unit increase in
the Richter scale. Table 2.1 gives the frequency of earthquakes and the
effects of the earthquakes based on this scale.
To cause objects and buildings to be thrown into the air, the upward
motion of the Earth’s crust has to be greater than the accelerating effect
of the gravitational pull on these objects. Table 2.2 gives an indication of
how the two measuring scales compare against each other and relative to
the corresponding gravity-induced acceleration.
Table 2.1
Frequency of earthquakes and their effects based on the Richter scale.
Richter scale No. of earthquakes
magnitude
per year
Typical effects of
magnitude
⬍ 3.4
3.5–4.2
4.3–4.8
4.9–5.4
800 000
30 000
4800
1400
5.5–6.1
500
6.2–6.9
100
7.0–7.3
15
7.4–7.9
⬎8
4
One every
5–10 years
Detected only by seismometers
Just about noticeable indoors
Most people notice them, windows rattle
Everyone notices them, dishes may break,
open doors swing
Slight damage to buildings, plaster cracks,
bricks fall
Much damage to buildings, chimneys fall,
houses move on foundations
Serious damage, bridges twist, walls fracture,
buildings may collapse
Great damage, most buildings collapse
Total damage, surface waves seen, objects
thrown in the air
Source: UP Seis – Department of Geological Engineering and Sciences, Michigan
Technological University, USA.
43.
26 Natural DisastersTable 2.2
Comparison of MM intensity scale and Richter scale.
Mercalli scale
Acceleration (cm/s2)
Richter scale
I
1
II
3.5–4.2
2.5
III
5
IV
10
4.3–4.8
V
25
VI
4.9–5.4
50
VII
5.5–6.1
100
VIII
250
6.2–6.9
IX
500
X
7.0–7.3
750
XI
7.4–8.1
980
XII
⬎ 8.1
Source: Zephryus.demon.co.uk/education
Geographic and historic evolution: statistics
Earthquake prediction
The shift of tectonic plates is a major consideration when attempting to
predict earthquakes.
Many earthquakes occur at plate boundaries, such as the ‘ring of fire’ (see
Fig. 2.3) along the margins of the Pacific, others take place in mid-plate.
This knowledge enables us to locate those regions on the Earth’s surface
where it is likely that large earthquakes will occur, but whilst it tells us
where 90% of Earth’s major earthquakes will take place, we cannot tell
accurately when. This is because, in the context of millions of years of
plate tectonic process, it is difficult to tell exactly where a particular year
fits in within the world cycle of stress build-up and stress release.
In a letter about a devastating Romanian earthquake in March 1977
(see Fig. 2.5) Charles Richter remarks:
‘As yet, there is no way of forecasting such happenings in advance. It may
be that observations made preceding the present disaster may lead to
progress in that direction’
44.
Earthquakes 27Fig. 2.5
Letter from Charles Richter.
Prediction efforts attempt to establish a stress increase prior to rock rupture by monitoring motions and possible effects of stress accumulation
such as changes in magnetization or temperatures, gas releases, animal
behaviour, etc. At best, they can assess increased probability of seismic
activity, but not predict an actual event.
Effect of earthquakes
Earthquakes have been part of our life throughout history, which has
recorded their effects from antiquity.
Even the Seven Wonders of the World have not been safe and some were
lost because of earthquakes: The Colossus of Rhodes was destroyed by
an earthquake in 224 BC, as was the Mausoleum of Halicarnasus in 1402.
The Alexandria Lighthouse resisted a first earthquake in AD 500, and
having survived deliberate Arab attempts to demolish it in the ninth century, and more earthquakes in 1182 and 1303, finally succumbed in 1375
45.
28 Natural Disastersto another earthquake. At the time it was buried by the volcano eruption,
Pompeii was repairing damage caused by an earthquake.
Earthquakes cause devastating loss of life and destruction of man-made
structures such as buildings, roads, and dams. They also trigger fires,
landslides, and flooding. As loose soil, such as landfill, loses the ability
to bear loads, the ground behaves like quicksand making buildings sink
and disappear. At sea, they cause the giant tsunamis described above,
which devastate shorelines.
Loss of life is linked to the density of population on the particular
location more than the magnitude of the earthquake. Tables 2.3 and 2.4
illustrate the point.
Effect of earthquakes and seismic design principles
The high concentration of seismic events of the last decade has highlighted the vulnerability of certain buildings such as the reinforced concrete buildings of the 1930s or those designed in accordance with
seismic regulations of the 1960s.
The physical effects of an earthquake on a building can be examined
more fully nowadays because scientists are able to travel to the place
Table 2.3
The deadliest earthquakes on record.
Date
Location
Deaths
Magnitude
23.01.1556
27.07.1976
9.08.1138
22.05.1927
22.12.856
16.12.1920
23.03.893
1.09.1923
5.10.1948
28.12.1908
Sept. 1290
Nov.1667
18.11.1727
1.11.1755
25.12.1932
31.05.1970
1268
11.01.1693
30.05.1935
4.02.1783
Shansi, China
Tangshan, China
Aleppo, Syria
Nr Xining, China
Damghan, Iran
Gansu, China
Ardabil, Iran
Kwanto, Japan
Ashgabat, Turkmenistan
Messina, Italy
Chihli, China
Shemakha, Caucasia
Tabriz, Iran
Lisbon, Portugal
Gansu, China
Peru
Silicia, Asia Minor
Sicily, Italy
Quetta, Pakistan
Calabria, Italy
830 000
255 000
230 000
200 000
200 000 (estimated)
200 000
150 000(estimated)
143 000
110 000
70 000–100 000
100 000
80 000
77 000
70 000
70 000
66 000
60 000
60 000
30 000–60 000
50 000
Not
8.0
Not
8.3
Not
8.6
Not
8.3
7.3
7.5
Not
Not
Not
8.7
7.6
7.8
Not
Not
7.5
Not
Source: National Earthquake Information Center, US Geological Survey, C/O
Infoplease.com © 2002, Learning Network
(http: //www.infoplease.com/ipa/A0884804.html).
known
known
known
known
known
known
known
known
known
known
46.
Earthquakes 29Table 2.4
The 10 most powerful earthquakes of the twentieth century.
Number
Location
Date
Magnitude
1
2
3
4
5
6
7
8
9
10
Chile
Prince William Sound, Alaska
Andreano Island, Aleutian Islands
Kamchatka
Off the coast of Equador
Rat Islands, Aleutian Islands
India–China border
Kamchatka
Banda Sea, Indonesia
Kuril Islands
22.05.1960
28.03.1964
09.03.1957
04.11.1952
31.01.1906
04.02.1965
15.08.1950
03.02.1923
01.02.1938
13.10.1963
9.5
9.2
9.1
9.0
8.8
8.7
8.6
8.5
8.5
8.5
Source: National Earthquake Information Center, US Geological Survey,
C /O: Infoplease.com © 2002, Learning Network
(http://www.infoplease.com/ipa/A0884804.html).
where a disaster took place as soon as it happens and immediate observation of damage details has facilitated the improvement of building
techniques in very efficient ways.
Effective design relies on understanding the way in which earthquakes
affect building structures. In general terms, the effect can be direct, from
the motion induced stresses and indirect from the associated events associated with or triggered by earthquakes.
Direct effects
Ground failure, which causes structures to become unstable or collapse.
Ground failure can take place in a number of ways:
• Surface faulting or fault rupture. Faults are fractures in the Earth’s
crust where most earthquakes occur. They are usually most active
along the plate boundaries, but can also occur within a plate. As the
tectonic plates move against each other, seismic energy builds up
along the plates and remains ‘locked’ along the faults due to friction
and rock interlock. Once the energy accumulated is large enough, it is
released through the slippage of rocks along the fault ruptures.
Earthquakes can trigger or inhibit the release depending on the fault
geometry. Surface faults ruptures are fault ruptures which break to the
surface (see Fig. 2.4). If a structure, such as a building or a road, straddles a fault, the ground displacement that occurs during an earthquake
will seriously damage or rip apart that structure (see Figs 1.2 and 2.6).
A surface rupture of about 60 km long was the main feature of the
Chi-Chi Taiwan earthquake, which took place on 21 September 1999
(see Fig. 2.6). The rupture caused extensive devastation at the ShihKang dam, located about 50 km north of the epicentre as it passed
directly beneath one end of the dam. The large vertical offsets (10 m
vertical and 2 m horizontal) were curved which is typical of thrust
faults due to the dip of the fault. In other areas, buildings not directly
47.
30 Natural DisastersFig. 2.6
Dam rupture in Taiwan Earthquake.
© EERI / J.P. Bardet.
Fig. 2.7
Liquefaction example, Izmit, Turkey.
© EERI.
within the rupture zone showed no apparent damage compared to
those located within the 15–20 m wide rupture zone, which suggests
that the motions associated with permanent fault offset take place
slower than dynamic shaking.
• Soil vibration. This can either literally shake a building off its foundations, modify its support or cause foundations to disintegrate.
• Liquefaction. In liquefaction conditions, buildings can start to lean, tip
over, or sink into the ground. Liquefaction occurs when sediments
below the water table lose strength temporarily and behave as viscous
liquids rather than solids (Fig. 2.7). Liquefaction occurs predominantly in recently deposited sands and silts with high ground water
levels. When saturated, soils such as loose sands, lose their bearing
capacity during severe ground shaking, and become fluid due to a sudden reduction in shear resistance caused by the temporary increase of
the pore fluid pressure (Fig. 2.8). High-density areas, built on loose
48.
Earthquakes 31Water table
Fig. 2.8 Structural tilting due to
liquefaction – diagram.
Water pressure
ground material, can suffer devastation even from relatively small
earthquakes as a result. After the earthquake, the ground usually firms
up and the ground water recovers its deeper level. However, as the soil
consolidates after the earthquake, further damage to buildings can
occur as a result of more settlement and ‘sand boil’ eruptions (water
and sediment bursts from the pressure charged liquefied sand).
Liquefaction can also cause an increased lateral pressure on retaining
walls, which can be displaced, tilt, or collapse altogether. This effect
can often be observed during earthquakes in waterfront walls retaining
loose saturated sand.
• Ground lurching. Strong surface seismic waves make the ground
heave and lurch and damage the buildings in their path.
• Differential settlement. Earthquakes shake the ground beneath buildings causing it to settle at a different level to its initial one. This can
be particularly damaging when liquefaction occurs (see Fig. 2.8).
• Lateral spreading. As a result of liquefaction, large masses of soil can
be displaced laterally with catastrophic consequences. At their worst,
they take the form of flow failures, when large volumes of soil travel
down steep slopes, sometimes for tens of kilometres. On slopes of less
than 3⬚, lateral displacement caused by the liquefaction of subsurface
layers can determine horizontal displacements of several metres.
The displaced ground suffers cracks, rifting, and buckling. As a result,
lateral spreads disrupt foundations of buildings built across the failure,
cause engineering structures such as bridges to buckle and service
pipelines to break. The damage from lateral spreading can be extensive. In the 1906 San Francisco earthquake, all major pipelines were
broken by a ground failure displacements of less than 2 m. This
relatively small event caused extensive devastation because it hindered
fire fighting and 85% of the total damage to San Francisco was caused
by fire.
49.
32 Natural Disasters• Landslides and mudslides. The shaking of the ground can cause landslides, mudslides, and avalanches, which can damage buildings and
cause loss of life. Amongst the many landslides that took place during
the 1999 Taiwan earthquake, some were enormous like the one at
Tsaoling, located 30 km from the epicentre. Its debris travelled nearly
3 km carrying with it buildings, cars, and roads, destroying everything
in its path and killing 34 people.
Vibrations transmitted from the ground to the structures: The shaking of
the ground is transmitted to buildings in different ways, subject to the
type of Earth’s motion. The way the buildings will be affected will
depend on their shape, construction, and characteristics.
Earth motion types
Seismic waves are of two main types: deep and surface waves. Deep
waves travel from the Earth to the surface and can be primary or P wave,
a back and forward motion felt like a sharp jolt; and secondary or shear
or S wave, a rolling motion.
Surface waves travel along the Earth’s surface, and can be Love wave, a
horizontal type of surface wave, with no vertical motion; and Rayleigh
wave, a retrograde surface wave, travelling along a free interface with an
elliptical motion.
Start
Finish
Fig. 2.9
Scratch left on floor by kitchen range
in the 1933 Long Beach, California
earthquake © EERI.
At any given point, a combination of these types of waves results in a
complex random motion, often is predominantly horizontal, but with
considerable vertical motion as well. Figure 2.9 showing the trace
scratch made on the floor by a kitchen range during the 1933 Long
Beach, California earthquake, illustrates the random nature of the
ground movement. From a design point of view, structures must assume
that earthquake waves may come from any direction.
Fundamental period
Tall buildings undergo several types of vibration, of which the fundamental or first mode is the most significant. Whilst a stiff object, such as
a bulky piece of furniture, will only vibrate in the first mode, a flexible
object such as a tall building, will vibrate in a number of modes, which
change direction at node points (see Fig. 2.10).
Fig. 2.10
Vibration modes diagram.
First mode
Second mode
Third mode
50.
Earthquakes 33The initial ground motion is often amplified, depending on the nature of
the soils and rocks of a given site. Soft soil can amplify the motion several times, as much as six times, and consequently earthquake damage
tends to be more severe in areas of soft ground.
Every object has a fundamental period at which it vibrates if set in
motion. The ground also has a fundamental period of its own. If an
object is set in motion by an external force such as the ground shaking,
which would be at the fundamental period of the object, the result will
be dissonance and the motion of the object will tend to increase.
In building structures, the main determinant of the vibration period is
height and proportions. A tall slender building will have a long vibration
period and will swing back and forth quite slowly. A 40-storey building
will sway every 7 s while a single storey for every 0.1 s, and a filing
cabinet only every 0.05 s (see Fig. 2.11).
A child’s swing will behave like a pendulum and continue to swing for
a few minutes without assistance, but buildings and other objects will
not do the same because their vibration is reduced or damped by their
construction, thereby stopping their vibration after a few seconds. The
extent of damping depends on the materials of construction, their connections, and architectural elements such as partitions, ceilings,
cladding, etc. Ductility is an other important characteristic of building
structures because ductile structures can absorb much more force than a
rigid ones. Non-ductile structures such as non-reinforced masonry or
inadequately reinforced concrete can be at risk because of the possibility of brittle failure.
Pancaking
When subjected to lateral forces, vertical members, such as columns or
walls, fail by buckling when the building mass exerts its gravity force on
Height
40 storeys
10–20
storeys
Filing
cabinet
4 storeys
1 storey
Fig. 2.11
Fundamental period diagram.
Seconds
0.05
0.1
0.5
1.0–2.0
7.0
51.
34 Natural DisastersBuildings
E
Overturning
P
Fig. 2.12
Filing cabinet
Ground
motion
Pancaking.
Drift
Drift
Fig. 2.13
Soft storey principle.
Normal
Over-stress
Soft storey
a member distorted or put out of plumb by lateral forces. This is known
as the P–e or P delta effect, where P is the gravity load and e or delta
are, respectively, the eccentricity or extent to which the forces are offset.
Fig. 2.14
Building collapse due to soft
storey – earthquake in Greece.
© EERI.
Buildings seldom overturn in this situation (as would a piece of equipment or a filing cabinet), they fall apart or ‘pancake’ (see Fig. 2.12). This
is due to the fact that they are composed of many elements connected
together and when the earthquake forces pull these components apart
buildings collapse vertically rather than fall over. Overturned buildings,
usually, are structures with strong shear walls which retain their integrity
when upset by a soft storey action (see Figs 2.13 and 2.14) foundation
failure, or a combination of these.
Stiffness
Lateral forces are distributed in proportion to the stiffness of resisting
members. In turn, stiffness is related to shape and is measured by deflection. Horizontal storey to storey deflection is known as drift and it relates
to storey height (see Fig. 2.15). A very important aspect of stiffness in
lateral force design is that earthquake force distribution tends to be proportionate to the stiffness of the resisting elements. The forces are
attracted to the stiff elements and this is an important consideration for
relative column stiffness, which varies approximately as a cube of its
length (see Fig. 2.16).
52.
Earthquakes 35450 lb
Short
column
400 lb
Height L
Take
8 times the load
of the column
twice its height
Fig. 2.15
50 lb
Height
2L
Drift principle diagram.
Δ drift % of building height
Height
The drift ratio
The horizontal deflection
related to the storey height
Fig. 2.16
The ‘short column’ principle diagram.
Fig. 2.17
Earthquake provoked innundation in
Golcuk, Turkey. © EERI/Ascheim.
Indirect or consequential effects
• Tsunamis. These are series of ocean waves induced by earthquakes.
They usually take place along the subduction zones and are very common in the Pacific Ocean. Earthquakes cause ripple motions in water,
barely noticeable in the open ocean, despite their speed which can
reach 750 km/h, but as they travel thousands of miles when they reach
shallow water they can reach heights of 30 m causing severe damage
to coastline cities.
• Seiches. Seiches are similar to small tsunamis and occur as a result of
the sloshing of enclosed water in reservoirs, lakes, and harbours
shaken by earthquake waves or intense storms. Only a few feet high,
they can nevertheless flood or knock down houses, and topple trees.
• Landslides.
• Floods. Earthquakes can rupture dams, water pipes, or levees (raised
river embankments). The water from reservoirs and rivers then flood
the area damaging buildings, sometimes even sweeping them away
with considerable loss of life (Fig. 2.17).
• Fires. Fires are one of the main hazards when an earthquake takes
place. During the first moments after an earthquake, there is often
darkness and dust. People try to get light striking a match and start
53.
36 Natural Disastersfires from broken gas mains and appliances. Other fires are started by
the short-circuiting of broken power lines or by fractured heating and
cooking devices. The fact that often the water mains are also severed
makes fire-fighting difficult and means that fires spread easily. As
mentioned earlier, most of the damage in the 1906 San Francisco
earthquake was caused by the raging fire which burned for 3 days
destroying most of the city. This was mostly due to the fact that
ruptured water mains made fire-fighting virtually impossible.
Seismic design principles
Specialist studies show that the ability to construct buildings that have
both flexibility and cohesion, is one of the most important considerations
when designing earthquake-resistant structures. A main objective is to
provide an effective linking of different parts of a building so as to
enable them to work together and avoid the dislocation which causes
collapse. As well as considering the form of a building and the materials
employed, good design also entails choosing a judicious location. When
examining the effects of earthquakes on buildings, three main areas can
be identified as vulnerable and requiring specific design attention:
The ground and the ground–foundation–structure
interaction
Buildings located close to valleys, near rivers, or on mountain slopes
have been shown to be more at risk from earthquake, and in the construction of seismic-resistant building it is essential to an understand all
aspects concerning the nature of the ground such as rigidity and energy
dispersion.
Before making design decisions, it is important to understand the
physical mechanisms of the ground. Seismic calculations determine the
way in which, when shaken, a building will respond to the movement of
the Earth and how this will affect its foundations. This involves considering following aspects:
(a)
(b)
(c)
(d)
applied stress;
restrictions;
movements;
deformations.
The reactions of a building are closely related to the nature of the ground
and soil. Experience shows that the degree of intensity to which an
earthquake is felt depends on the nature of the ground throughout which
the seismic vibrations travel. Buildings situated on mobile ground suffer
much greater damage than those located on rocky ground because they
associate themselves to oscillators amplifying the shocks applied to
the base. The adjustment ground/structure will depend on the specific
location and characteristics such as the building height and its vibration
sequence.
54.
Earthquakes 37Fig. 2.18
Nikaia Hall, Nice, France. © W. Jalil.
Modern buildings in seismic conditions are often built of reinforced concrete material considered to satisfy the necessary ductility criteria. The
association between concrete and reinforcement is complementary providing resistance in both compression and tension. The adherence
between these two components is of prime importance in transmitting
stress loads. A good transmission will be provided through the existence
of sufficient friction between them, which can be achieved if the reinforcement bars are ridged. Considerably more reinforcement is necessary in seismic zones to cope with the increased stress (see Fig. 2.18).
To ensure the rigidity of a structure, it must be anchored and tied to form
a ‘cage’ like unit. This is particularly important in smaller buildings, as
it ensures a good redistribution of forces between the different bracing
elements. The load-bearing walls and their connection to the foundations
and slabs should be reinforced to counteract the shearing effect that
stress the vertical elements. The foundations must have additional steel
provision to allow the fixing of vertical anchor ties which should be provided at each angle and opening being tied to reinforced lintels. Each
level should have horizontal ties linked to the vertical elements.
The geometry of the load-bearing structure
To absorb the wave vibrations transmitted by the Earth’s movements; it is
recommended that expansion joints and a homogenous distribution of the
structural volumes complement the ductility of reinforced concrete. The
role of the expansion joints is to separate the building in several independent blocks, able to move freely when an earthquake shakes the building.
(In France, standards require joints of up to 60mm in areas most at risk)
(PS92) The joints should be continuous and linear both in plan and elevation and continued in basements if the soil is not of homogenous type.
In earthquake areas, buildings with discontinuous, stiff, or asymmetrical
volumes are not suitable as each asymmetrical element introduces a
55.
38 Natural Disasters(a) Regular
(b) Irregular
Stress concentration
Torsion
Fig. 2.19
Effect of building shape in seismic
conditions.
(c) ‘L’ shaped
Ground motion
weakness encouraging a multilayered type of collapse. Regular configurations are essentially symmetrical in plan and elevation and have no setbacks or complicated layouts in plan (Fig. 2.19a). Irregular buildings have
geometrical complexities of plan or elevation. In this example (Fig. 2.19b)
the building is regular in elevation, but has re-entrant corners in plan and
is symmetrical along one axis only. In an L-shaped building, the movement of the wings will result in a concentration of stress at the junction
point whilst the asymmetry will result in torsion, which can cause the
building to literally tear itself apart at the notch point (see Fig. 2.19c).
Torsion occurs when the centre of the mass and the centre of resistance
do not coincide, or there is a difference of stiffness in materials or as a
result of the way the resisting elements are arranged. Lightweight architectural components such as partitions or asymmetrical facade panels
can create an unbalanced resistance and subject the building to torsion
forces (see Fig. 2.20).
The resistance of the structure to earthquake forces
The structure design must provide adequate resistance to the earthquake
forces to which a building is likely to be subjected. For lateral resistance,
braced frames will provide the necessary resistance through triangulated
56.
Earthquakes 39Centre of resistance
Center of mass
Wall
(b) Unbalanced resistance
(a) Balanced resistance
Fig. 2.20
Torsion effect in seismic conditions.
Mass and resistance
centres coincide
Torsion
Eccentricity
geometry. Connections must be strong and elements must be able to
resist buckling and tension. Most braced frames are concentric, but
eccentric brace frames are increasingly used with link beams replacing
the connection points, making it possible to reduce failure to localised
points, leaving the structure intact.
Other solutions consist of the provision of shear walls (which provide
resistance along the plane of their length) or moment resisting frames
(which rely on the joints to provide lateral resistance). The latter are usually constructed of steel so as to make use of the material’s inherent ductility, but they can also be of reinforced concrete.
Architects designing buildings in earthquake prone-areas must take into
account the effects of stress concentration and avoid:
• volumes which are excessively projecting or set back;
• ‘transparent’ stories susceptible to shearing;
• clear, unbraced, or discontinuous ground floor elevations.
Potential earthquake damage often involves vertical irregularity; one
storey, usually the first, has taller, fewer columns which makes it significantly weaker or more flexible than the storeys above (see Fig. 2.21).
Whilst a regular building would distribute its drift equally to each floor, in
soft-storey buildings, although the overall drift is the same, the second
floor connections will be subject to almost all the drift and fail. Stress
concentrations means that an undue proportion of the overall forces is
concentrated at one or a few points of a building. Isolated elements such as
a particular set of beams, a wall or several columns may be stressed beyond
their design capacity and fail, and in doing so they may bring the whole
building down in a chain reaction. Also, as forces tend to be attracted by
57.
40 Natural DisastersStress concentrations
The most serious condition of vertical irregularity
is the soft or weak storey, in which one storey, usually
the first with taller, fewer columns, is significantly
weaker or more flexible than the storeies above.
Fig. 2.21
Flexible first floor
Examples of ‘soft storey’ design.
Discontinuity
Heavy superstructure
stiffer elements these too will tend to be stress concentration points. Just
as demolition techniques seek to weaken a few key columns and connections, in earthquake conditions these ‘weak’ points will be the cause of
final collapse while the upper floors, which have been subjected to
little or no drift, remain almost undamaged.
Examples of serious danger of dislocation and collapse can be found in:
heterogeneous masonry;
buildings where the centre of gravity is too high;
building with too heavy roofs;
verandas;
projecting features;
chimneys.
Once a structure type is chosen, attention must concentrate to making
the building as balanced as possible, if necessary by decomposing it into
geometrically simple elements. For example, an L-shaped building can
become two rectangular blocks.
Rehabilitation of old structures
When considering the rehabilitation of an old structure, it is important
not to assume that it would be sufficient just to revise the structural
dimensions. Each building must be considered on its individual merits,
as many buildings were not designed with earthquakes in mind.
Apart from improving the structural size of main components, ties and
anchoring are useful methods. External ties consisting of reinforced concrete ring beams (see Fig. 2.22) or metallic ties and crosses would counteract the horizontal thrust linking columns and beams.
For masonry buildings, a basic technique involves bonding a layer of
reinforced grout shell to the outside of the walls. The shell is made to
function integrally with the wall through a grid of studs hooked and
welded to mesh reinforcement on the outside, tightened with nuts and
bearing plates on the inside (see Fig. 2.23). Another method, known as
58.
(a)(b)
Fig. 2.22
Concrete ring beam strengthening to building in Chisinau, Moldova.
(a)
(b)
Fig. 2.23
Rehabilitation of old structures in
Bucharest, Romania (a) Reinforced
concrete 40s building being upgraded;
(b) Consolidation of solid masonry
exterior and (c) interior views.
(c)
59.
42 Natural Disastersthe composite reinforced masonry, aims to achieve a ductilization of the
brick masonry through the insertion of a reinforced grout web.
In the case of historic buildings, in addition to structural consolidation
there is the added problem of maintaining the historic appearance and
proportions. Chapter 9 looks at some of the methods used to achieve
this. Subject to what materials existing structures are made of, consolidation aims at either adding rigidity to a flexible steel structure or reducing the brittle element of a concrete one by adding steel.
New ideas, research, and recent developments for
seismic-resistant construction
Although we understand earthquakes better now, than say 50 years ago,
predicting them remains mainly guesswork. Scientists try to determine
where and when earthquakes occur by observing the movement of the
tectonic plates and by looking at the history in a particular region and
detecting the pressure and fault lines. However, predictions remain
vague and only aftershocks can be said to be easier to anticipate. What
can be done? Efforts are best directed into raising preparedness and
designing buildings to specific standards. The 1973 Uniform Building
Code sets out an international standard for construction and structural
strengthening.
General guidelines recommend:
• strengthening of support material;
• designing buildings so that they are flexible enough to absorb vibrations without falling or deteriorating.
A Eurocode 8 is currently being prepared aiming at harmonizing
European standards. For example, the British and French principles of
design differ and adjustments will be required. In France, the protection
of the building’s occupier takes precedent over the preservation of the
building in earthquake conditions, and this is reflected by a reduced use
of reinforcement in high-rise blocks. This is not acceptable in countries
which have statutory requirements seeking to limit the effects of the
earthquake on buildings to an absolute minimum, and who tend to
impose high reinforcement provisions of about 10–50 kg/m3.
Established systems seek to reduce the failure of structural steel or
increase the ductility of concrete An example is the composite structural
steel-reinforced concrete system which was developed in Japan in order
to overcome the reduction in the ductility of structural steel by local
buckling in framed structures requiring a significant energy dissipation
capacity and the associated problems posed by the confined reinforced
concrete. A light steel frame with castellated beams is built with solid
continuous shapes at the joints providing the necessary anchorage which
60.
Earthquakes 43will then be covered with confined reinforced concrete to avoid buckling
This type of composite structural is commonly used in Japan for midand high-rise building material.
New systems tend to seek to:
• modify the seismic forces transmitted from the ground to the building; or
• modify the response of the building.
Amongst systems developed in the past decade are:
Base isolation – This system works through lengthening the period of
the building superstructure to about 2s and it is particularly useful in the
case of buildings where the disturbance of the interior and contents
should be kept to a minimum, such as historic buildings, laboratories,
museums, and hospitals. It involves the insertion of special bearings
under the structure.
Passive energy dissipation – This system reduces building drift slowing
down the building motion through the insertion of devices that dissipate the earthquake energy by friction or deformation of specially
located materials. One such material is the magnetorheological (MR)
fluid (fluid, fluid that changes to near solid when exposed to a magnetic force and back to liquid when the force is removed) used inside
large dampers to stabilize buildings during earthquake. The fluid was
developed in North Carolina’s Lord Corporation Laboratory, used in
dampers in buildings and bridges in research seeking to create ‘smart
structures’ that are able to automatically react to seismic activity.
Scale model testing – Experimental research has been conducted in the
Structural laboratories of the University of California at Berkley and as
part of a comprehensive US – Japan research programme testing scale
models with earthquake simulators at the Science City of Japan,
Tsukuka. They aimed at finding ways to improve seismic-resistant
design and construction of buildings, and have highlighted the importance of three-dimensional interacting behaviour of walls and surrounding frames. Results of tests have also indicated the need for
considering the contribution of slab reinforcement to the negative
moment capacity of the girders cast monolithically with the floor slabs.
New technologies and methodologies are being used to provide the necessary information for the prevention and mitigation of earthquake impact.
• Global positioning system (GPS) a space-based technology is being
used to provide real-time measurements of the way the ground is
being deformed in seismic risk areas.
• Synthetic aperture radar remote sensing is being developed to provide
continuous images of crustal deformation.
• High-performance seismometer stations, recording broadband high
dynamic range ground motion, are being systematically installed
61.
44 Natural Disastersworldwide to provide emergency response and record strong earthquake data for building design parameters.
Paleoseismic methods enable the identification of prehistoric earthquakes aimed at improving the estimation of earthquake recurrence
intervals.
Advanced modelling and simulation of the response of constructed
facilities such as the Tsukuka model (Fig. 2.23) discussed above.
High-performance composites for strengthening existing structures:
High-performance materials such as high-strength, highly ductile, and
weldable steel and alloys or super strong and durable cement-based
materials are becoming common in seismic zones infrastructure
construction.
New generation of data collection methods:
– Non-destructive evaluation methods such as ultrasonic, acoustic
emissions, infrared thermography are employed to detect structural
weaknesses that would make a building susceptible to earthquake
damage.
– Fiberoptic sensors embedment are being successfully used in sensing the dynamic response of structures in seismic conditions.
– Neutral networks and fuzzy logic techniques can be effectively
used in identifying the reaction and damage potential of complex
structures.
Case study: Vrancea, Romania
Vrancea zone in Romania illustrates the complex interaction of factors
that must be considered when assessing the effects of earthquakes: the
tectonic processes, the soil composition, the magnitude and intensity of
the event and the man made structures.
General
The tectonic plates
A moderate to high seismic area, Romania is located at the intersection
of three tectonic plates (Peceneaga-Camena, Intra-moesian and Moesian).
At the point where the three fault lines converge, an area called Vrancea,
has been the scene of intense seismic activity for centuries as a result of
the subduction movement of the Moesian plate, which has caused about
95% of this country’s seismic events (see Figs 2.24 and 2.25).
Research in recent years has made progress in understanding better the geodynamic evolution of the Carpathian region where a subduction towards the
Southwest, coupled with a notheastward retreat of the subduction zone,
forced the intra-Carpathians to move into the same northeasterly direction.
Whilst a collision between the northern block and the European foreland
was followed by a break-off in the north, with the detached slab segments
sinking into the mantle, the southeastern zone beneath the Carpathians bend
(the Vrancea Region) appears to be a slab segment still detaching, and this
is thought to be responsible for the seismicity of the region.
62.
Earthquakes 45Ukraine
Hungary
W
E
Moldavia
East European plate
Peceneaga Camena
Vranoea
Intramoesian
plate
Bucharest
Serbia
Black sea
microplate
Moesian
Fig. 2.24
Plate
Map of Romania showing location of
Vrancea focus. © Alexandru Cismigiu.
Bulgaria
Focsani
15 km
Qaternary
deposits
NW
SE
Su
zo bdu
ne ct
ion
(b
en
iof
f)
C
M
Kl
0
10
20
30
40
50
Fig. 2.25
Vrancea subduction focus.
© Alexandru Cismigiu.
Intermediate
foci
The Vrancea zone is characterized by the occurrence of intermediate
depth earthquakes in a narrow epicentral and hypocentral region. The
epicentral area is within a zone of 30 km ⫻ 70 km and earthquakes occur
at between 70 and 200 km depth within an almost vertical column.
Shallow events (focal depth of maximum 60 km) and very deep (subcrustal depth of over 200 km) have also been recorded but with smaller
magnitudes. The Vrancea events tend to be strong (Richter scale magnitude M ⫽ 7.8–8.0), and persistent (systematic strong events occurring
three to four times per century, the average recurrence rates making
another strong event within the next two decades highly probable).
63.
46 Natural DisastersThe focal depth of some Vrancea seismic events means that they are felt
and cause considerable damage over large areas, unlike shallow earthquakes, which are only of local influence.
The soil structure
As was discussed earlier, the effect of an earthquake is strongly influenced by the soil structure, especially 50–60 m near the surface, as it
affects the way in which the seismic waves are transmitted. The softer
the soil, the slower the waves’ travel and the greater the damage
incurred.
Vrancea is largely made of soft material and Bucharest is located on soft
sedimentary type sub-soil. The thickness of the unconsolidated layer is
in the range of 100–200 m. The city centre sits on a bed of clay with
shallow layers of sand and loess, while the northern and the eastern parts
are on silt, clay, fine sand, and gravel. These different types of sub-soil,
observed during the construction of the underground, account for the
seismic risk zoning of Bucharest, the largest risk areas being associated
with the softer soil profiles.
Measuring the impact
Table 2.5 gives an indication of the frequency of major earthquakes (M⬎6.8)
in the last 200 years and their measurement on the Richter and Mercalli
scales.
While magnitude is expressed by measuring the amplitude of a seismic
wave against an open-ended scale, intensity expresses the surface impact
on a scale of I–XII, from imperceptible to major damage being caused
and the destruction of ‘life lines’ such as roads, water and power liner,
and total collapse of buildings taking place. In Romania, intensity charts
used to assess risks, relate to return periods and place Vrancea and
Bucharest in the high-intensity zone of VIII.
In recent times, the earthquake on 4 March 1997 has been the most devastating. Although it lasted only 60 s, it caused the death of 1580 people
Table 2.5
The magnitude, intensity, and focal depth of major earthquakes in the last 200 years in Romania.
Year
Focal depth
H (km)
Magnitude
M (Richter)
Intensity Imax
(MKS)
1802
1829
1838
1894
–
–
–
–
7.7
7.0
7.3
6.8
X
VIII 1/2
IX
VIII
Year
Focal depth
H (km)
Magnitude
M (Richter)
Intensity
Imax (MSK)
1908
1940
1977
1986
1990
125
135
94
145
99
6.8
7.4
7.2
7.0
6.8
VIII
IX
IX
VIII1/2
VIII
Source: ‘The Seismic Pathology of Religion-related Buildings in Romania’, A.I. Cismigiu and M.A Cismigiu.
64.
Earthquakes 47injuring a further 11 000. Thirty-three thousand dwellings were destroyed
and 20 high-rise blocks collapsed. Most of the devastation occurred in
the capital city of Bucharest. The loss has been assessed to have been in
the region of US$ 2 billion.
Charles Richter, the well-known seismologist, remarked about the effects
of Vrancea earthquakes (see Fig. 2.5):
Nowhere else in the world is a populated centre so exposed to earthquakes
originating repeatedly from the same source. The only similar occurrences are the repeated earthquakes under the Hindu Kush region
The building types
During the 4 March 1977 earthquake, Bucharest suffered substantial
damage, much more than during the 1940 earthquake. This was partly as
a result of the different dynamics of the rupture causing a different damage pattern and partly due to the design and construction of some of the
buildings. Countless nineteenth century buildings were destroyed and,
more unexpectedly, many ‘modern’ multistoried buildings too, with devastating loss of life, and economic consequences.
The city’s buildings can be divided in two general categories:
• Constructed before the Second World War – they range from solid
masonry one-storey buildings, typical of the nineteenth century, to
reinforced concrete frame buildings with brick partitions, most of
which were not designed to withstand seismic stress, only to compensate vertical loading. Twenty-eight reinforced concrete frame buildings, 8–13 storeys high, collapsed partially or entirely. These buildings
were part of a group of 100–150 blocks of flats built between the two
World Wars, and which were constructed without particular concern to
anti-seismic provisions, their lateral strength being strictly random.
Furthermore, some were of poor quality, others had sustained damage
in the 1940 earthquake, which was not repaired, and others had been
modified for functional reasons with little regard to the structural
implications. There are still some 400 such buildings in Bucharest and
despite official efforts to highlight the risks and list the dangerous
structures, very little change has occurred to date.
• Constructed during the communist era of monolithic reinforced
concrete – 2–16 storeys, of uneven workmanship, many are in need of
upgrading and a large number remain unconsolidated after the last
three earthquakes. Lack of resources has meant that no repair and renovation were undertaken to counteract the effects of poor construction
and lack of maintenance over many years.
The effect of 4 March 1977 earthquake on structures
The earthquake impact on the existing buildings took a number of
forms.
65.
48 Natural DisastersDegradation/disintegration of the fabric due to alternating
over-stress
The destruction of the fabric can be either brittle or ductile, depending
on the type of material the structures were made of. Brittle materials
such as concrete, masonry, or mortars have a tendency to revert to their
original granular form, becoming friable, an irreversible change. Ductile
materials such as construction steel or plastic, having a polycrystalline
internal structure, tend to incur a rearrangement of the crystals resulting
in pronounced deformation or plastic fatigue or deflection.
In structures constructed of mixed materials such as reinforced masonry
or reinforced concrete, the brittle component tends to revert to its initial
constituents (sand, gravel, and dust). A solid block, whose stability is
ensured by dry friction between particles, changes into a granular
mass, its usual shape being a rubble heap with the natural slope of the
material.
In Bucharest, as a result of the predominant type of construction, the brittle destruction was the more devastating. Its manifestation ranged from
‘micro-cracking’ not easily distinguishable in large masses, to ‘visible
cracks’ along preferential lines, culminating in ‘explosive dis-locations’,
the result of massive dismantling of intermolecular connections and total
collapse. This behaviour could be localized at the level of a structural
component or, at the limit stage involve the structure as a whole. During
the 1977 earthquake in Bucharest, several multistorey blocks of
flats, such as Scala or Continental, collapsed in heaps of rubble with
natural slope.
Failure of the vertical elements
Characteristic of seismic damage in structures not designed for seismic
conditions, the weakest parts were shown to have been the columns, and
more generally, the vertical components. Typical column failure occured
due to:
(a) Weakness to shear and a lack of adequate transverse reinforcement
were in evidence. When reinforcement is insufficient, it bends under
the seimic shear stress and typical failure occurs at 45⬚ such as can
be seen in Figs 2.26 and 2.27. The inadequate and suitable reinforcement are apparent in Fig. 2.27 where the bent three vertical bars
can be seen clearly distorted. If we compare the reinforcement
diagram of this case (Fig. 2.28a) with a typical reinforcement for a
seismic resistant column (Fig. 2.28b) the way in which the shear is
counteracted becomes obvious.
(b) Excessive axial loading and insufficient transverse reinforcement
This induces the crushing of concrete and the buckling of longitudinal reinforcement (Fig. 2.29). The principle is illustrated by the
66.
Fig. 2.26Columns, Bucharest earthquake of
4 March 1977, showing typical shear
failure due to insufficient transverse
reinforcement (stirrups). © Alexandru
Cismigiu.
~45°
Fig. 2.27
Typical shear failure of column detail.
© Alexandru Cismigiu.
Typical shear failure due to lack
of adequate reinforcement
67.
Seismic sheara ≤ 10 –15 am
1
1 2
2
12 –14 mm
(a)
Seismic shear
(b)
Fig. 2.28
Diagramatic representation of typical
shear failure and corrective
reinforcement.
Fig. 2.29
Column failure due to excessive
axial loading and insufficient stirrups
resulting in concrete crushing with
buckling of longitudinal reinforcement.
(c) Section 1–1
(d)
Section 2–2
68.
Earthquakes 51diagram in Fig. 2.30, which shows the effect of a vertical force on a
simple concrete cube in different friction conditions.
(c) Weak column – strong beams design. This caused a failure of the
column below the frame joint (see Fig. 2.31) because of lack of
transverse reinforcement.
Vertical force
Vertical force
Friction
preventing
agent
such as
grease
Fig. 2.30
Diagram of brittle failure principle
(a) failure of concrete cube without
friction prevention; (b) Concrete
cube resisting vertical force with
friction prevention agent.
Fig. 2.31
Shear failure of column below frame
joint due to lack of reinforcement
and disregard to the ‘weak beams –
strong columns principle’.
Vertical force
Failure of
concrete cube
Vertical force
Concrete cube
resisting vertical
force
69.
52 Natural DisastersThe effect of 4 March 1977 earthquake on
Romanian historic buildings
Romanian historic monuments such as churches, monasteries, or palaces
were traditionally built with solid stone or brick masonry, which being
brittle materials, did not resist well to dynamic action, especially at the
points of discontinuity or openings, thus being susceptible to the brittle
explosion damage described earlier. Traditionally built churches, examined after being subjected to seismic action, tended to present the following types of damage (see Fig. 2.32):
• A longitudinal dislocation, almost always extending from the altar to the
porch, tending to cut the church nave in two halves. It is accompanied
Longitudinal/Transverse
fragmentation of the church
body in distinct blocks
Damage mechanism of the
altar zone including the
triumphal arch
Axial window of
altar
Triumphal arch
Tronconic fractures
TRD
TRD TRD
LGD
LGD
TRD TRD
(a)
TRD
Fractures in areas
weakened by openings
Damage mechanism
of lateral apses
The apse window
The apse arch
Fig. 2.32
Typical distribution of earthquake
damage to church. © Alexandru
Cismigiu.
(c)
The apse window
(b)
(d)
70.
Earthquakes 53by cracks and dislocation in the altar vault and fractures in all the
arches, etc.
• Transverse dislocations and fractures along the axis lines of the Naos,
Vortex, and Porch, systematically occurring at the weaker points of the
nave walls such as the vertical narrow window openings.
The two types of associated dislocations/fractures tend to transform the
main body of the building into an assembly of almost independent
blocks, each acting separately. Projecting features such as bells, drums,
bell towers, are always vulnerable during an earthquake. Built of brittle
materials with low tensile and shear strengths, these elements are
exposed to high overturning moments and shear forces at the base.
When consolidating existing buildings, Romanian engineers favour the
insertion of a compatible and closely associated three-dimensional new
structure into the existing structure. In the case of a traditional church
building, this consists of two macro-structures: roof and foundations,
linked by horizontal and vertical lamellar components (floors/beams,
walls/columns) thus creating a new composite system (Fig. 2.33).
The link between the old and the new structures is achieved by bonding
and mechanical enclenching. Bonding is obtained by using cementitious
materials at specific ratio mixes of coarse and fine grout, and mechanical enclenching is achieved with the help of steel insertions buried in
non-active cement. The enrobed mixed matter, or ‘bulbs’, achieves the
ductility of composite materials: ‘steel–grout masonry’ and in time,
the permanence in time of stone masonry. Fig. 2.34a–c illustrates such
consolidation work stages at a traditional church building.
Romanian consolidation techniques,
anti-seismic design, and legislation
In recent years, solutions have been sought to make possible the transition
from gravitational capability to seismic strength. Encasing the brittle
material (i.e. the concrete) or inserting a three-dimensional longitudinal
and transverse reinforcement system are methods currently adopted (see
Fig. 2.35a–c). The techniques employed are generally based on the
mixed structure of composite materials (MSCM) concept, as illustrated
by consolidation work in progress in Bucharest (Fig. 2.36). The
consolidation of public buildings has been a priority; some examples are
given below.
The Intercontinental Hotel Bucharest (Fig. 2.37a and b) (Bucharest
International Project; Structural Engineers: Gabriela Pop, Stefan
Mihailescu, Lucian Dogariu; Consultant: Alexandru Cismigiu). The existing
central columns of the 22-storey high building required consolidation as
they showed signs of stress after the 1977 earthquake. Constructed of
reinforced concrete, 1 m ⫻ 1 m, they were designed for a high axial force
(N ⫽ 1444 tonnes). The solution opted for consolidation was transversely
71.
M.C. = Major casing ofthe square base
G.P. = Generale plate
Attic
macrostructure
Transverse
tie beams
Vertical
elements
VM 4VM 3
P.S.
VM 2
VM 1
G.P.
P.S.
P.S.
MC
G.P.
P.S.
Horizontal
element
Vertical element
Cramp
~φ12
Perimentral Longitudinal
spandrel P.S. tie beams
Supplementary
infrastructure
Vertical members
VM 4 VM 3 VM 3 VM 2
VM 2 VM 1
Bed
1/2 Brick
Incision Stirrups
Horizontal element
Cramp
Bed
Filling with
low–slump
mortar
Coarse gront
VM 4 VM 3 VM 3 VM 2
V M 2 VM 1
Inside intervention to
the infrastructure in the case of
lessoid or sliding foundation soils
1/2 Brick
~φ12
Incision
General plate
General
plate
Fig. 2.33
Traditional church consolidation
concept. © Alexandru Cismigiu.
(a)
Trusses
General
plate
Perimetral
connectors
Tie beams
Cramps or
incision
(b)
(c)
Fig. 2.34
Mirauti Church, Romania, repairs in progress and completed. © Alexandru Cismigiu. (a) Reinforcement being inserted; (b) Masonry
cover in progress; (c) Consolidation work completed.
72.
Earthquakes 55(a)
(b)
Steel reinforced
concrete (SRC)
column section
Concrete-filled
steel tube (CST and TSRC)
column section
Brick
Masonry
Reinforced
grout web
Fig. 2.35
Structural consolidation techniques
diagrams (parts a, b, and c).
Fig. 2.36
Consolidation work in Bucharest.
(c)
73.
56 Natural DisastersA
A
A
A
A
A
A
A
A
A
A – Columns requiring
seismic consolidation
A A
1000 mm
1160
1200 mm
20
80 mm
(a)
1000
80
(b)
20
80
Intercontinental Hotel, Bucharest:
(a) plan; (b) detail. © Alexandru
Cismigiu.
80 mm
80
Fig. 2.37
1200
super reinforced concrete (TSRC) where a steel skin, 20 mm thick and 80 mm
expanding grout were installed to encase the existing columns.
The Parliament House, Bucharest (Fig. 2.38) (Coordinating engineers:
Alexandru Cismigiu, Traian Popp, Mircea Mironescu; Architect: Anca
Petrescu). The largest structural complex ever built in the MSCM concept,
using SRC as building material. It consists of shear walls, either alone or
grouped in tubular zones, associated with frames and framed shear walls; torsional effects very well taken care of. The design brief was that the building
should be viable for a minimum of 500 years! Architecturally, more than controversial, from an engineering point of view it constitutes a unique and outstanding example of the MSCM–SRC technique.
The Telephone Exchange building Bucharest (Fig. 2.39) (Design Institute of
the City of Bucharest; Structural engineers: Dragos Badea, Dan Popescu,
74.
Earthquakes 57Fig. 2.38
‘Casa Poporului’, Bucharest.
Fig. 2.39
Telephone exchange building
consolidation in Bucharest.
© Alexandru Cismigiu.
Ilie Canciovici; Consultant: Alexandru Cismigiu; Architect: Popescu
Greaca). Built in 1936 as pure steel frame, the building suffered important
plastic displacements in the 1977 earthquake. The MSCM
concept was applied here with the construction of a full peripheral SRC skin
40–50 cm thick, connected to the existing steel skeleton, from
the outside, as access into the building for construction work was not
permitted in order not to iterrupt its functionality. Peripheral masonry panels
were strengthened in the CRM system.
75.
58 Natural DisastersLegislation and building control
Following the devastation from the 1977 earthquake, Romania has
adopted a building code, currently P100-92, which lays down regulations for the construction of earthquake-resistant buildings. The main
consideration is to limit and prevent earthquake damage such as:
loss of human life and material damage;
disruption of the socioeconomic life;
destruction of the cultural assets;
damage from hazardous substances.
The code sets safety levels related to specific parameters such as:
the seismic grading of the area (maximum ground acceleration);
geological conditions;
the importance of the building;
time spent in the building;
type of forces acting on the building.
The code also sets out guidelines and restrictions in respect of a building’s configuration, materials used, existing buildings, structural alterations, etc. At the time of writing, work was in progress to align the code
with European prescriptives.
Disaster mitigation
A number of new techniques are being pursued to aid populated centres
such as Bucharest in the case of a new powerful Vrancea earthquakes:
1. The use of carbon fibre reinforced plastics (CFRP) sheets to facilitate
a quick and cheap intervention after an event, as they can be attached
to walls from the outside to secure unstable buildings.
2. Airborne laser scanning of urban areas: after a strong earthquake, this
method enables the detection of changes in man-made structures
through comparison with pre-event data and classification of damage
detected.
3. Seismic instrumentation of Bucharest combined with geological
micro-zoning for fast post-event maps locating the ground motion
and consequential damage distribution.
4. Development of an early warning system designed on the basis of
travel time between S and P waves from the Vrancea epicentre to
Bucharest. The difference of travel time should give a 25 s warning.
76.
3 VolcanoesWhat are volcanoes and how they erupt
A volcano is a mountain or hill containing openings and channels, which
connect to the earth’s crust and through which lava, ashes, and gases are
expelled continuously or at certain intervals.
The Earth consists of three main layers: the core, the mantle, and the outer
crust. We live on the outer crust, which is about 5–10-km thick under
oceans and 30–70-km thick under the earth. This, in relation to the rest of
the planet, is quite thin, comparable to an orange skin. The mantle, which
is the largest layer of the earth, is extremely hot and mostly solid because
of the high pressure it is subjected to. In certain conditions it melts forming
‘magma’, fluid molten rock, which penetrates the outer crust (see Fig. 2.2).
The most common cause for magma production is the movement of the
earth’s crust, which as we have seen earlier is divided into seven large
plates (see Fig. 2.1). The movement, known as plate tectonics, can determine different forms of volcanoes and volcanic activity:
• Spreading centre volcanism is a type of movement where the plates
move away from each other forming a ridge. As the two plates separate, the pressure on the mantle rock reduces, allowing it to melt and
magma is formed; as it flows out it cools, thus hardening and filling
the space created by the diverging plates.
• Subduction zone volcanism occurs when the moving plates collide and
one plate is pushed under the other, sinking into the mantle. This
forms a trench, usually in the ocean floor. The pressure created by this
type of movement increases the water content of the mantle, lowering
its temperature, which causes it to melt into magma.
• Hot spot occurs less often and is the result of a unusually hot lower mantle pushing into the upper mantle and creating a plume-shaped mantle
material forming magma just under the earth’s crust. If the continental
plates move over the hot spot (which is stationary), the magma will create a string of volcanoes, such as the Hawaii volcanoes.
As magma forms as a result of one the processes described above, being
less dense than the surrounding solid rock it pushes upwards through the
77.
60 Natural Disasterscrust. If the downward pressure of the rock exceeds its upward pressure,
magma collects in magma chambers below the surface of the earth, but
if the pressure is high enough or the cracks open magma will flow forming a volcano. Flowing magma is called lava.
Volcano types
Magma eruption force is due to the pressure from dissolved gases suspended in the magma solution. When the confining pressure decreases
or when the gas pressure increases because the magma cools the dissolved gas is allowed to expand forming bubbles (vesicles) in the
magma. As the bubbles escape, they push the magma out with them
(rather like a flowing champagne bottle when opened) and an eruption
occurs. There are two categories of eruptions:
1. Effusive – happens when the pressure is low and the lava flows slowly
onto the earth’s surface, causing damage to wildlife and man-made
structures.
2. Column eruption – when pressure is very high, a great deal of material,
hot gas, ash, and pyroclastic rocks, explode high up into the air.
Within these categories there are several types of eruptions:
Fig. 3.1
Vesuvius lava flow. © NASA.
• Plinian eruption – a column eruption caused by a powerful upward thrust
of expanding gases, rising up to 48km into the air, producing a towering
eruption plume that can last for days and causes ‘tehphra’ volcanic material to fall on the surrounding area and very fast moving lava destroying
everything in its path. Pompeii and Herculanum were buried by a Plinian
eruption of mount Vesuvius (see Fig. 3.1).
• Hawaiian eruptions – an effusive type of eruption, produce a sluggish
flow of low-viscosity, low-gas-content lava. These eruptions are slow
enough to enable people to escape to safety. Sometimes there are ‘fire
fountain’ displays, an orange lava upward flow of a few minutes or
‘lava lakes’, ponds of lava created in craters or other hollow cavities
in the land. This type is common to Hawaii volcanoes, from where its
name is derived.
• Strombolian eruptions – impressive but not very dangerous, these
eruptions thrust very short bursts of lava high into the air. They are
regular, but quite small and do not produce lava flows. They take their
name from the Stromboli volcano on the Italian coast.
• Vulcanian eruptions – similar to Strombolian eruptions, but have
slightly larger columns and are mostly made of ashy pyroclastic material. They also launch football-sized ‘pyroclastic bombs’.
• Hydrovolcanic eruptions – occur in wet conditions near oceans or saturated clouds. The hot magma heats the water causing it to expand,
resulting in eruptive columns and fine ash.
• Fissure eruptions – some eruptions do not start with an explosion;
magma simply flows through the cracks in the ground. Characteristic
‘curtains of fire’ occur: lava curtains burst at a small height above ground.
Although there can be a large quantity of lava, it is slow moving.
78.
Volcanoes 61Statistics (Source: Volcano World)
It is widely accepted that there are more than 500 ‘active’ volcanoes in
the world (volcanoes recorded to have erupted within historic times),
about the same number of ‘dormant’ volcanoes (those that erupted
before historic times but less than 10 000 years ago) and many ‘extinct’
volcanoes (those that erupted more than 10 000 years ago). Of the 500
active volcanoes, 10 erupt on any given day.
The largest eruption in the world this century took place in June 1912 at
Novarupta Alaska. An estimated 9 miles3 of magma erupted for 60 h,
over twice the 1991 Pinatubo eruption and 30 times the 1980 St Helens
eruption. The deadliest eruption of the century occurred at Mont Pelée
Martinique in 1902 when 30 000 inhabitants were killed. In 1985, 23 000
people died when mudflows inundated the city of Armero following a
small eruption of the Nevado del Ruiz volcano in Columbia, which
melted the ice cover causing the mudflow.
Effects of volcanic eruptions
Volcanic eruptions have devastating effects through a number of manifestations that can take place all at the same time or in various combinations depending on the type of eruption and its location. The potential
hazards include the following:
• Ash fall ( pyroclastic falls) – fine material (millimetre sized) resulting
from the eruption can get carried by currents in the eruption column
and travel vast distances downwind. Ash falls can cause substantial
damage, depending on the thickness of the layer deposited: For
example,
At less than 1 mm ash will act as irritant to lungs and eyes, force closure of airports due to potential damage to aircraft, and contaminate
roof-fed water tank supplies.
At 1–5 mm ash will cause minor damage to buildings, blocking air filters and soiling interiors. May also cause electricity cuts due to conductivity of wet ash, short-circuiting transformers, etc.
At 5–100 mm ash will destroy crops and pasture, cause lightweight
buildings to collapse under the ash weight over 100 mm, and affect rail
transport through signal failure. Major ash removal operations will be
required in urban areas.
At 100–300 mm roofs of buildings risk collapse under the weight of
wet ash if not cleared.
Over 300 mm livestock and wildlife are killed or very distressed, major
collapse of roofs, roads unusable, power and telephone lines broken.
Ash clouds can also generate powerful electric fields causing frequent
lightning, damaging electrical installations and starting fires in buildings and installations.
79.
62 Natural Disasters• Ballistic falls – lava and volcanic rocks exploding like bombs.
• Pyroclastis flows (ash flow) – the flow of hot volcanic debris from the
collapsing eruption column, advancing as a wall of fire in a melting
gas cloud. They are the most destructive manifestation of volcanic
activity: people rarely survive if caught in its path and buildings are
often destroyed.
• Lava flows are molten rocks travelling down the volcano slopes at
varying speeds depending on their geological make up, how steep is
the slope, obstructions, etc. Despite their spectacular appearance they
do not threaten life because of their slow movement, but they do cause
total destruction of buildings and infrastructure in their path.
• Lahars are mudflows of volcanic ash mixed with water. They can
crush people to death, erode riverbanks, and destroy buildings.
• Volcanic gases.
• Volcanic earthquakes.
Most of these hazards will only affect the area close to the volcano,
except for ash fall, which can be found as far as thousands of kilometres
from the site of an eruption.
The damage can be considerable. In 79AD, Mount Vesuvius erupted
burying without trace all surrounding cities in over 30m of ash. Only in
the eighteenth century were some of these cities (Pompeii and
Herculanaeum) re-discovered. When they were excavated in the twentieth
century, cataclysmic devastation and loss of life was revealed. Vesuvius is
still active today (see Fig. 3.2) and could erupt at any time again.
Mount Ruapehu’s 1995 and 1996 eruptions lasted a total of 4 months
and cost New Zealand some $130 million. Of this tourism accounted for
the biggest loss, $100 million, electricity for $22 million as two power
stations were severely damaged, aviation industry $2.4 million, whilst
emergency services cost $6.5 million.
Fig. 3.2 Vesuvius detail.
80.
4Flooding
How does flooding occur
If the total amount of water on Earth has remained fairly constant for millions of years, this is not, the case for its distribution. Although a small
amount of water is lost everyday high in the atmosphere, by the breaking
of water molecules by ultraviolet rays, an equal amount of new water is
emitted from the inner parts of the earth through volcanic activity.
Water takes a number of forms:
• liquid in seas, rivers, etc.;
• solid in glaciers of North and South Poles;
• gaseous as vapours in the air.
And it changes from one form to another as it is moved around the planet
by winds.
When the sun heats certain zones more than others, a heat discrepancy
is created and cycles of air movement are initiated by the hot air rising
and cool air sinking. These cycles determine consequential water cycles:
The heat causes water to evaporate, the heated air rises and when meeting colder layers condenses into droplets, which form clouds. As the
clouds become saturated with droplets they begin to fall through the air
forming precipitation: rain, snow, sleet, hail, etc. The water so created
forms rivers and streams and some accumulates underground.
At certain times, these cycles are affected by an unusual interaction of certain factors, like the development of a hurricane, resulting in an uncharacteristically large amount of water being produced. When this sudden,
greater than normal, volume of water appears it causes the normal waterways to overflow and water engulfs the surrounding land. Flood is an
unusually large accumulation of water in an area of land.
Causes and effects of flooding
Causes of flooding
• The most common cause of flooding is the succession of storms
bringing massive amounts of water through rain. This often tends to be
81.
64 Natural Disastersseasonal due to the different amounts of time the sea and land take to
heat up or cool. In winter, the air above the sea is warmer than that
above the land and the wind flows away from the sea, but in summer
the process is reversed and more water is carried.
Wind currents creating a monsoon effect.
Melting snow.
Unusual tidal activity, such as tsunamis (giant waves triggered by
earthquakes).
Dam breaks. This can happen either as a result of a dramatic ground
shift due to earthquakes or land slides, or due to design parameters not
anticipating the extent of the amounts of water occurring.
Flooding and its severity is subject to a number of factors:
• The amount of water which accumulates as explained above.
• The absorbency of the land: land, which is saturated with water and
cannot absorb any more will cause the surplus to overflow as runoff.
Farm areas will be less absorbent than rock and concrete, asphalt and
man-made cover even less as they reduce the Earth’s natural
absorbency.
• Flood relief systems, which conduct rainwater through culverted flood
relief channels into other areas.
• Levees – raised embankments along rivers built to keep them from
overflowing and which whilst protecting the local area from being
flooded, may cause worse problems further down the line. They can
also break in which case, like dams, can cause even more dangerous
flooding.
• Excessive water along coastlines.
Effects of floods
Of all natural hazards, floods account for the highest death toll and most
significant damage (see Disaster impact statistics page)
• Damage caused by the force of the flowing water. The worst damage
is caused by the enormous force of the flowing water, at 6 in. (15 cm)
being able to knock a person down. Pressure exerted by flash floods,
which occur as a result of sudden intense accumulation of water is the
worst especially if this happens on mountains. The water flowing
down gathers tremendous speeds devastating anything in its way.
• Damage from dampness and the mud brought with the water. When
the flood is over and water level drops, things are back to normal but
mud and debris picked by the water stick as a general slime.
• Spread of disease. Flood water seeps in everywhere causing sewers to
overflow into the drinking water system, washing away chemicals and
all sorts of waste products. Rats and other wildlife may take shelter in
human settlements.
• Indirectly, through damming and artificial draining to avoid damage to
humans, floods can be responsible for dramatic changes in the natural
82.
Flooding 65ecosystems such as in the case of the Grand Canyon, where an artificial flood had to be created to re-establish the natural balance.
Flood damage
Damage to property is only part of the ‘human cost’ of a flood. The upset
caused by loss of personal belongings, some, of sentimental value and
irreplaceable, the stress of living in temporary accommodation, the
trauma of cleaning up, the smell, the loss of employment as business
fails, the loss of pets, reduction in property value, the fear it may happen
again, all these have a traumatic effect. Damage to property is related to
the level reached by the floodwater. Table 4.1 indicates typical damage
to a residential property. Flood can damage property outside the buildings such as outhouses, cars, fences, and gardening equipment.
The length of time the floodwater remains in contact with buildings is a
key factor in the level of damage caused. It can be anything from a few
hours to several weeks or even months. In March 2001, over a hundred
homes were damaged in the village of Gowdall, United Kingdom. The
water stayed for 2 weeks in most areas and some for 2 months.
Table 4.1
Damage to residential property.
Depth of flood
water
Damage to building
Damage to services
and fittings
Damage to personal
possesions
Below ground floor
level
Minimal damage to the main
building
Floodwater may enter basements,
cellars and under floor voids
Possible erosion beneath
foundations
Damage to electrical sockets and
other services in basements
and cellars
Carpets in basement and cellars
may need replacing
Possessions and furniture in
cellars and basements damaged
Up to 0.5 m above
ground floor level
Damage to internal finishes such
as wall coverings and plaster
linings
Wall coverings and plaster
linings may need to be
stripped to allow walls to dry
Floors and walls will become
saturated and will require
cleaning and drying out
Damp problems such as mould
may result
Chipboard type flooring likely to
require replacement
Damage to internal and external
doors and skirting boards
Damage to downstairs electricity Damage to sofas, other furniture
meter and consumer unit
and electrical goods
(fuse box)
Damage to small personal
Damage to gas meters and
possessions such as books,
low-level boilers and telephone
audiocassettes, video and photos
services
Food in lower kitchen cupboards
Carpets and floor coverings may
may be contaminated
need to be replaced
Chipboard kitchen units are
likely to require replacement
Washing machines, free-standing
cookers, fridges, and freezers
may need to be replaced
More than 0.5 m above Increased damage to walls
ground floor level
Possible structural damage
Damage to higher units,
electrical services and
appliances
Source: DTLR (Department for Transport Local government and the Regions).
Damage to possessions on higher
shelves
83.
66 Natural DisastersInhabitants were told in February that it will be a year before they
could return to their homes and people lived in caravans while repairs
took place.
Preparing for floods
1. Assessing the risks
• Obtain information on the likelihood of flooding occurring by
establishing whether the property is near the sea, a river, stream,
ditch; in a location where water could collect such as a hollow or
at the foot of a hill; it is protected by river or coastal flood defences.
• Obtain information about the history of flooding in the area (local
library, The Environmental Agency, local records). The Local
Authority’s Building Control and Highway Departments may have
information on more localized floods and water and sewerage companies may also provide information about sewers.
2. Deciding what level of flood to defend against
• Information obtained from consulting records would establish the
maximum levels reached in the past and how often it occurs.
• Assess the likely cost of damage and choose the appropriate option
for the specific property. After identifying the likely points where
flood water could enter the property, look into ways of reducing the
risks. For example: if air-bricks are present, an alternative way of
ventilating the void can be found.
• If records show flood duration can be significant, look at effects
such as water seeping through external and party walls, or the
ground and consider measures to increase resistance.
3. Measures to reduce effects of flooding:
• Dry proofing measures – prevent water ingress with flood barriers
at doorways, covers for air bricks and other vents (always ensuring
alternative means for ventilation).
• Wet proofing measures – by raising electrical sockets above flood
level, improving the resistance of internal walls, floors and fittings to
withstand the effects of flooding. The cost will provide long-term
financial savings reducing costs of repairs, temporary accommodation, reduced business, etc.
• Flood barriers erected away from the buildings with proprietary
temporary and demountable defences.
Elements of design
Individual properties
When a property is located in a flood risk area, there are a number of
simple steps, which can be taken to prevent or reduce flood damage:
(a) Identifying the likely points where flood water could be entering the
property:
• around closed doorways;
• through air-bricks, air vents in walls, and the ground floor;
84.
Flooding 67• backflowing through surcharged drains and discharging inside
through toilets and sinks located below the flood line;
• seepage through cracks and joints in walls and gaps around service cables and pipes.
(b) Improving the flood resistance of the property.
There are two main categories of measures: dry-proofing – aimed at keeping water out of the property; and wet proofing – improving the building’s
ability to withstand the effects once the water has entered the building.
Dry-proofing measures can be:
• Provision of movable flood barriers for doorways and low sill windows. These may not entirely prevent the ingress of water; they could
provide valuable time to move personal possessions out or to a higher
level. Barriers have to be strong enough to withstand the pressure of
water and should be put in place as soon as there is a flood warning.
Barriers for external doors windows or garages usually are plastic or
aluminium flood boards which can slide into a frame attached to the
doorframe in a manner creating a watertight seal.
• Installing air-brick and vent covers – they take the form of a plastic
cover, available in do-it-yourself stores, which can be clipped on to a
frame fixed around the brick or vent opening. It is important that all
covers are removed after the danger passes.
• Installation of non-return valves on sewers to prevent back flow.
• Sandbags can be effective as a barrier.
• Flexible skirting systems – they can enclose the lower parts of buildings to a height of 600–900 mm and although costly, can be justified
in cases of regular flooding.
Wet-proofing measures can include:
• Improving the resistance of internal walls, floors, and fittings to
enable them to withstand internal flooding. When undertaking repairs
after flood damage, the opportunity should be used to replace damaged elements and finishes such as plaster, flooring, or kitchen units
with materials that are more flood resistant.
• Raise electrical sockets above the established flood level.
General approach
Case study – Thames barrier
The water level at London Bridge has been rising by about 2.5ft each century. Probably the main cause for London flooding are the surge tides, originating in the North Atlantic. Normally, they just pass by the British Isles,
but when Northern winds force them into the North Sea, millions of additional tons of water are sent up the Thames, putting 1250000 people at risk.
A barrier across the Thames was considered the best way to protect
London from a flooding disaster after a serious flood occurred in 1953,
85.
68 Natural Disastersbut the considerable volume of active shipping was causing design limitations, as it needed wide passageways. Only when, with the development of container shipping, the old London Docks became redundant it
was possible to limit openings to only 200 ft. From a number of solutions
put forward, it was decided to build a barrier with movable gates across
the river at Woolwich, where the river bed is solid chalk and narrow
enough to be spanned easily. The barrier covers 1716 ft width of the river
and it consists of nine reinforced concrete piers forming six openings for
ships and four other openings. Ten steel gates are positioned end to end
across the river. Four main gates, 200 ft wide, are open at normal times
and in flood control position when there is a danger of flooding. Each
gate is set on pivots supported by the piers, which house the operating
machinery and control equipment. If a surge tide threatens, the rising
sector gates swing up through 90⬚ forming a continuous steel wall, sealing off the upper Thames from the sea (see Figs 4.1 and 4.2). When
open, the gates rest out of site in curved recesses set in concrete sills
built in the riverbed, allowing traffic to circulate freely. The barrier is
controlled by computers, which operate hydraulic machinery in the
piers. Each gate has two sets of identical machinery and controls, three
mains supplies and three back up generators.
The construction work started in 1974 and the barrier was officially open
in 1984. Apart from the barrier, additional protection is provided to the
east as new walls to a level of 23 ft have protected 11.5 miles of riverbank. The design of the gates is simple but efficient: they rotate from an
Air
Valve
Gate open
Surge level
Water flow
under gate
Gate in flood control position
Fig. 4.1
Thames barrier: operation diagrams.
Source: Environment Agency, Thames
Barrier Centre.
Gate in maintenance position
Water
flow
Gate closing
Air
Silt
Gate opening
86.
Flooding 69(a)
(b)
Fig. 4.2
Thames barrier – gates and shore
details.
(c)
87.
70 Natural Disastersopen position to flood control position or to an underspill position to
allow flow near the river bed and to eliminate the possibility of a reflective wave being brought by the initial closure. To allow for maintenance,
there is a further position where the gates can be raised horizontally,
completely clear of the high water level, which gives access to both
faces.
The Thames barrier represents one type of solution, best suited for protecting a densely populated centre of a primarily industrial country which
has traditionally used the river for trade and transport. In the case of a predominantly agricultural country like France, the approach is different as
the flooding of a river has been traditionally regarded as beneficial by
those living off the land.
Case study – The Loire river, France
The Loire (Fig. 4.3) is the longest river in France. It flows for 634 miles
starting in the Cevennes and ending in the Bay of Biscay in the Atlantic
Ocean. Along its course, it descends cutting gorges which account for
some of the most beautiful scenery in France. Although usually tranquil
and majestic, it has had furious moments with terrible effects. One of the
worst periods of flooding in the Loire’s history stretches from 1846 to
1866. June 1846 stands out as the most violent and devastating: the
water level rose by an incredible 7.70 m and only areas placed on high
ground were spared. A debit of 7000 m3/s was suddenly produced,
frightening when compared with the more usual 11 m3/s!
The flooding was caused by the compounded effect of rain from the
Cevennes, in turn caused by violent storms in Puy-en-Velay and precipitation from the Atlantic in the mid-Loire region. Other rivers in the area
were affected: The Cher, The Indre, the Vienne and The Maine and
though they did not flood on the same scale, the floods lasted longer.
Fig. 4.3
Loire River view.
88.
Flooding 71Despite the horrific effects of the mid-nineteenth century floods, not
many safety measures were taken and an estimated 300 000 people are
currently at risk. Research shows that due to the lowering of river beds
as a result of gravel extraction and the construction of the dam near
Roanne, a possible surge at the Bec d’Allier, of some 8000 m3/s could
submerge embankments in the Sully valley, Orleans, and Langeais, with
the Tours area being most threatened to incurring considerable damage.
Throughout the history of the Loire valley, there have been attempts to
protect man from flooding. Embankments and earth walls have been built
since the twelfth century, some major ones are 200 years old, but their
protection is now considered to be to a certain extent illusory, as they can,
if they burst, cause even more devastation than if they did not exist, gushing large amounts of water which they were suppose to contain.
The 1980s were another period of sustained flooding and during this
period dams were considered the best solution. However, when the
French government decided to commence constructing a number of
dams along the Loire, there was strong opposition from environment
bodies who won the day with a case for employing ‘natural’ methods,
with a system of ‘levées’, strategically located earth banks, which would
allow the river to flood but in a controlled way. Proposals also aim to
take into account the natural effects of strategic planting and a reduction
of water levels with the aid of locks, which would be opened allowing
water to flow in order to reduce its level by 20–30 cm.
The levées
There is a certain amount of scepticism as to the effectiveness of these
methods and whilst detailed studies and research is still in progress, and
are not expected to be finalized before 2006, efforts are directed towards
prevention and reduction of the flooding risks by:
• identifying areas at risk;
• improving the alert system, for example, installing a meteo-radar systems on the higher basin;
• re-opening secondary branches of the river;
• reinforcing the base and fabric of strategically located embankments;
• adjusting overflows such as the one between La Bouillle and Blois.
Infrastructure control is being reinforced with state-initiated Plans for
the Prevention of Natural Risks (PPRs), and a number of initiatives by
river villages organizations attempting to limit the building in floodprone areas and experimental projects.
To a certain extent, the success of these attempts depends on finding the
necessary financial backing and each community acts proportionately
with the funds it can raise as neither the state nor insurance companies
are prepared to foot the bill.
89.
72 Natural DisastersCase study – Reignac sur Indre
Reignac sur Indre is a typical picturesque French village (Fig. 4.6). It has
been a settlement on the river Indre, a tributary of the Loire since Roman
times. It has a centuries old church, a château associated with the
Marquis de La Fayette, a water mill, and a Town Hall. Because of its
position above the confluence of the river Indre and its tributary the
Indrois, and the geological features, it has, throughout its history, been
prone to severe flooding. The worst on records has been in 1770 when
the waters carried people away, but there have also been floods in 1850,
1910, and 1982. In December 1982, the water mounted to its highest
level with extreme speed overnight. The water was reported to have been
gushing through the floor tiles and stripping the tarmac off the roads.
The following images show the extent of the flood (Fig. 4.5) compared
Fig. 4.4
Reignac sur Indre village square, usual
view.
Fig. 4.5
Reignac sur Indre flooded village
square.
90.
Flooding 73with the same view of village in normal time (Fig. 4.4). Figure 4.7 shows
the level it reached inside the houses.
The stress and devastation caused by the flood decided the community
to take steps in preventing it happening again. As the plan in Fig. 4.8
shows, a series of earth embankments (levées) have been created to
contain future floodwater. The earth mounds have been successfully
landscaped to blend into the existing surroundings (Fig. 4.9).
Fig. 4.6
Reignac sur Indre aerial view.
Fig. 4.7
Reignac sur Indre – interior view of
flooded house.
91.
BC
RE (R
BLE
E
F
G
H
il
Ma
Dam
du
'58)
.D. n
re
e
Ru
diè
ar
lgn
Gu
al
rur
Tille
xBo
ieu
du V
7)
. n'1
(R.D
e
des
qu
Rue
uls
e
Ru
Di
1
D
g
ur
Ru
e
Place
du
Blcentancine
C
N
Ru
de
Dique
de
Ba
ulip
es T
e d
2
s
en
rb
de
in
MOULIN DE REIGNAC
es
e
Ru
des
L' Indra
u
ea
R
des
s
uis
e
e
Ru
Ru
rural
tes
Gly
in
cin
G
uè
es
Ro
s
du
Cha
min
Rural
e
l
Vo
eau
Rue
Myo
iss
b
Sa
s
soti
de
Ru
Ci
e
e
qu
C
rs
otie
Ru
in
Lilas
Rue
let
Vio
ma
3
m
he
lis
quil
Jon
Dam
in
m
he
m
Co
s
de
le
Sables
a
un
m
n'
des
16
A JACQUELINIERE
licots
MOULIN DE LA FOSSE
Rue
s
de
du
ue
Ceq
du
4
des
Rue
Rue
o
gr
ry
des
LE BATTEREAU
18
re19
Reignac sur Indre – plan of flood defence earthworks. © Bertrand Penneron.
hbea
e
ag
Im
Rue
de
Fig. 4.8
nc
de
e
s
Vigne
b
ovem
Rue du 11 N
Jo
Landscaped
earth works
Ru
5
to
)
7
. n'1
(R.D
74 Natural Disasters
A
92.
Flooding 75Fig. 4.9
Reignac sur Indre – view of
landscaped earthworks.
93.
This Page Intentionally Left Blank94.
5 Weather conditionsStorm
What is a storm and how it occurs
Wind
The atmosphere is never at a standstill and air moves constantly between
high- and low-pressure areas. This movement of air is wind.
High
pressure
Tap valve
Hot liquid
Low
pressure
Cool
liquid
Heat
source
Fig. 5.1
Hot water circulation principle.
High pressure
Cooler air
Low pressure
Rising air
from warm
land
Land
Sea
Fig. 5.2
The principle of air circulation can be illustrated with a simple experiment
using two connected water-filled containers, of which is one heated. The
expansion of the hot water increases the pressure near the top at which point,
if the controlling tap is opened at the upper level, the heated water will flow
into the cool one, thus decreasing the pressure at its lower part. This, in
turn, will cause the cold water to flow into the warm vessel (see Fig. 5.1).
Air behaves in the same way: when heated by the Earth’s surface, pressure
decreases at the lower levels and increases at the higher ones. Nearer the
Earth’s surface, air flows in from high pressure and at the upper regions
away from high to low.
The sea breeze follows the same principle in conditions created by
the unequal capacity of land and water surfaces for absorbing radiating
heat. On a hot day, land heats up quickly whilst the sea becomes
warm slowly. At the same time, once warm, the sea will keep the heat
longer than the land. Whilst both land and sea lose heat by evaporation and
conduction, land does so very rapidly. The effect of the land being heated
during the day is to induce a breeze near the coast, and to a lesser extent,
cooling at night induces a land breeze (see Fig. 5.2). The sea breeze effect
is persistent and presents a fair resistance to land wind, which is forced to
mount over it, creating a lift effect often used by gliders.
Sea breeze principle.
The alternation between night and day, summer and winter cause variations in the intensity and spread of sea breezes. Air movement increases
in strength from gentle sea breeze to continental wind systems, culminating in monsoons.
On a larger scale, three constant low-pressure belts (one over the
Equator and one over each Pole) condition the atmosphere’s circulation.
95.
78 Natural DisastersAir rising over these regions creates a low pressure over the Earth and a
high-pressure layer at the upper levels of the atmosphere, with winds
flowing into lower layers and overflowing at the higher ones. The actual
weather effect is considerably more complex and other factors such as
the distribution of land and water on the earth’s surface or the earth’s
rotation, which deflects winds, influence it.
In continental wind systems, airflow is also influenced by the configuration of the land. For example, when blowing over a mountain range flow
is not only deflected from its horizontal course but also directed upwards
into cooler layers causing cloud formation and release of latent heat. This
raises the temperature of the atmosphere and changes the pressure.
Wind scale
High-level winds attain great speeds as observed in the movement of
clouds from 225 miles/h to 660 m/h, whilst meteor trails indicate the
presence of high winds at even greater heights.
Admiral Sir Francis Beaufort compiled in 1803 a wind scale for the guidance of sailors, which gives a simple explanation of wind speeds at ground
level and is still valid today, although speed values would differ as modern equipment enables more accurate measurement (see Table 5.1).
In simple terms, a storm is a violent disturbance of the atmosphere with
strong wind, heavy rain, snow, or hail.
In certain conditions, there is also thunder and lightning, the occurrence
of which is explained in Section C.
Table 5.1 Wind scale for the guidance of sailors.
Number
Wind
Speed
(mph)
Effects
1
2
3
4
5
6
7
Calm
Light air
Light breeze
Gentle breeze
Moderate breeze
Fresh breeze
Strong breeze
0
2
5
10
15
21
27
8
Moderate gale
35
Fresh gale
Strong gale
Whole gale
Storm
Hurricane
42
50
59
68
Above 75
Calm, smoke rises vertically
Wind direction shown by smoke drift but not by weather-vanes
Wind felt on face, leaves rustle, vane moves
Leaves and small twigs in constant motion, wind extends light flag
Raises dust and loose paper, small branches moved
Small trees in leaf begin to sway, crested waverlets on inland water
Large branches in motion, whistling heard in telegraph wires,
umbrellas used with difficulty
Whole trees in motion, inconvenience felt when walking against
the wind
Breaks twigs off trees, generally impedes progress
Slight structural damage occurs (chimney pots and slates removed)
Seldom inland, trees uprooted, considerable structural damage occurs
Very rarely experienced, accompanied by widespread damage
—
9
10
11
12
13
96.
Weather conditions 79Wind effects on buildings
All structures move under wind pressure. Their resistance depends on
their shape and type of construction, namely:
• the ratio between their height and width;
• the rigidity of construction, ranging from a heavy solid structure with
stiff cladding to a framed structure with light curtain walling.
A structural frame under wind pressure will act as a
• cantilever – where the floors remain plane; or as a
• portal frame – where the floors bend.
A tall slender structure will act predominately as a cantilever whilst a
short stubby building will act mostly as a portal frame.
In the case of very tall buildings, lateral movement will result in a pronounced deflection and bending moment, just as a cantilever under load,
with consequences such as cracks in finishes at the upper levels and difficulty of use.
Top deflection limits are set and used for structural design calculations.
In the United States these limits vary with the type of building: from
0.001 ⫻ the height – for buildings with curtain walling and low rigidity
to 0.002 ⫻ the height – for building in the case of heavy structures with
stiff cladding.
The twin towers of the World Trade Centre were designed to withstand
a wind pressure of 13000 tonnes! Resistance to winds of up to 100m/h
was a major design consideration as the effect of the wind would not only
cause the building to lean back, but also induce side to side movement,
which, if unrestricted, would literally ‘shake’ the building to pieces.
Experts assess that the effect of New York’s notorious strong wind push is
4–5 times stronger than that of the Los Angeles or Tokyo earthquake.
Wind loading is defined by a dynamic pressure, which is calculated by
taking into account:
• the appropriate wind speed for a given location of a building (taken
from the area’s isopleths map);
• topographical factors;
• building particulars such as height above ground and size.
By applying the corresponding coded coefficients to the dynamic pressure, the actual pressure or suction applied to a specific surface of the
building can be established and used in the structural design.
The distribution of wind pressure is not uniform and so the effects vary:
near the eaves it is stronger and suction at the ends of walls is greater,
97.
80 Natural DisastersSuction
Pressure
Wind
Fig. 5.3
resulting in a curvilinear representation (see Fig. 5.3). The effect of the
wind on buildings includes
1.
2.
3.
4.
5.
pressure on roofs and walls;
suction effect on roofs (which varies with the pitch) and on walls;
lateral pressure on solid walls;
lateral pressure on framed structures;
uplift forces at foundation level from pressure on soil due to suction
on the roof or lateral wind pressure, which in tall light structures
tends to cause overturning.
Wind effect on buildings.
Resistance to the effects of wind can be provided in a number of ways:
1. Judicious choice of design: shape and rigidity of construction.
2. Adequate lateral resistance in the form of rigid frames, bracing, and
shear walls.
3. In some cases, foundations are designed with a view to holding the
building down against the uplift of the wind and the nature and type
of soil are considered before positioning a building. The building’s
form and height are also considered. Soil mechanics will differ on
the same type of site with different types of buildings and identical
buildings will perform differently on variable sub-soil.
4. Design of fixings for claddings should be designed with particular
regard to wind loads, which increase with the height above ground
and exposure.
5. Provision of adequate fastenings to prevent the wind stripping off the
roof, with particular attention to the eaves and gable ends where the
maximum suction occurs and the ridge when pitched. Industrial flat
roofs are often a problem.
6. Selection of roof shape should be made with due consideration to the
wind effect (see Figs 5.4 and 5.5 – showing flat, pitched, or doubly
Flat roof
20° pitch
Fig. 5.4
Wind effect relative to roof shape.
30° pitch
45° pitch
98.
Weather conditions 81curved roofs, the latter requiring tying down the unsupported corners,
especially if not enclosed).
Case study – The Storms of 1987 and 2000 in the UK
(as reported by the UK Met Office)
Storms of 1987
Fig. 5.5
Repairing storm wind roof damage.
In southern England, 15 million trees were lost, among them many valuable specimens. Trees blocked roads and railways, and brought down
electricity and telephone lines. Hundreds of thousands of homes in
England remained without power for over 24 h.
Falling trees and masonry damaged or destroyed buildings and cars (see
Fig. 5.6). Numerous small boats were wrecked or blown away. A ship
capsized at Dover and a Channel ferry was driven ashore near
Folkestone. The storm killed 18 people in England and at least four more
in France. The death toll might have been far greater had the storm
struck in the daytime.
Fig. 5.6
Tree felled by storm.
Four or five days before the storm struck, forecasters predicted severe
weather on the following Thursday or Friday. By mid-week, however,
guidance from weather prediction models was somewhat equivocal.
Instead of stormy weather over a considerable part of the United
Kingdom, the models suggested that severe weather would reach no farther north than the English Channel and coastal parts of southern England.
During the afternoon of 15 October, winds were very light over most
parts of the United Kingdom. The pressure gradient was slack. A depression was drifting slowly northwards over the North Sea off eastern
Scotland. A cool weather prevailed over England, Wales, and Ireland.
Over the Bay of Biscay, a depression was developing.
The first gale warnings for sea areas in the English Channel were issued at
0630 UTC on 15 October and were followed, 4h later, by warnings of
severe gales. At 1200 UTC on 15 October, the depression that originated in
the Bay of Biscay was centred near 46⬚N, 9⬚W and its depth was 970Mb.
By 1800 UTC, it had moved northeast to about 47⬚N, 6⬚W, and deepened
to 964Mb. At 2235 UTC, winds of Force 10 were forecast. By midnight,
the depression was over the western English Channel, and its central pressure was 953 Mb. At 0135 on 16 October, warnings of Force 11 were
issued. The depression now moved rapidly northeast, filling a little as it
did, reaching the Humber estuary at about 0530 UTC, by which time its
central pressure was 959 Mb. Dramatic increases in temperature were
associated with the passage of the storm’s warm front.
It is clear that for sea areas warnings of severe weather were both timely
and adequate. Forecasts for land areas, however, left much to be desired.
During the evening of 15 October, radio and TV forecasts mentioned
strong winds but indicated that heavy rain would be the main feature,
99.
82 Natural Disastersrather than strong wind. By the time most people went to bed, exceptionally strong winds had not been mentioned in national radio and TV
weather broadcasts.
Warnings of severe weather had been issued, however, to various agencies and emergency authorities, including the London Fire Brigade.
Perhaps the Met Office issued the most important warning to the
Ministry of Defence at 0135 UTC, 16 October. It warned that the anticipated consequences of the storm were such that civil authorities might
need to call on assistance from the military.
In southeast England, where the greatest damage occurred, gusts of
70 knots or more were recorded continually for 3 or 4 consecutive hours.
During this time, the wind veered from southerly to southwesterly.
To the northwest of this region, there were two maxims in gust speeds,
separated by a period of lower wind speeds. During the first period, the
wind direction was southerly. During the second, it was southwesterly.
Damage patterns in southeast England suggested that whirlwinds
accompanied the storm. Local variations in the nature and extent of
destruction were considerable.
Comparisons of the October 1987 storm with previous severe storms
were inevitable. Even the oldest residents of the worst affected areas
could not recall winds so strong, or destruction on such a massive scale:
• the highest wind speed reported was an estimated 119 knots (61 m/s)
in a gust soon after midnight at Quimper coastguard station on the
coast of Brittany (48⬚02⬘ N, 4⬚44⬘ W);
• the highest measured wind speed was a gust of 117 knots (60 m/s)
at 0030 UTC at Pointe du Roc (48⬚51⬘ N, 1⬚37⬘ W) near Granville,
Normandy;
• the strongest gust over the UK was 106 knots at 0424 UTC at
Gorleston, Norfolk;
• a gust of almost 100 knots occurred at Shoreham on the Sussex coast
at 0310 UTC, and gusts of more than 90 knots were recorded at several other coastal locations;
• even well inland, gusts exceeded 80 knots: 82 knots was recorded at
London Weather Centre at 0250 UTC and 86 knots at Gatwick Airport
at 0430 UTC (the authorities closed the airport).
TV weather presenter Michael Fish will long be remembered for telling
viewers, the evening before the storm struck, that there would be no hurricane. But he was unfortunate. Fish was referring to a tropical cyclone
over the western part of the North Atlantic Ocean that day. This storm,
he said, would not reach the British Isles – and it did not.
It is worthwhile to consider whether or not the storm was, in any sense,
a hurricane – the description applied to it by so many people.
100.
Weather conditions 83In the Beaufort scale of wind force, Hurricane Force (Force 12) is
defined as a wind of 64 knots or more, sustained over a period of at least
10 min. Gusts that are comparatively short-lived (but cause much of the
destruction) are not taken into account. By this definition, Hurricane
Force winds occurred locally but were not widespread.
A 10-min mean wind speed of 70 knots (an average over 10 min) was
recorded at Lee on Solent in Hampshire and an hourly mean speed of
68 knots at Gorleston. The highest hourly mean speed recorded in the UK
was 75 knots, at the Royal Sovereign Lighthouse. Winds reached Force 11
(56–63 knots) in many coastal regions of southeast England. Inland,
however, their strength was considerably less. At the London Weather
Centre, for example, the mean wind speed did not exceed 44 knots (Force
9). At Gatwick Airport, it never exceeded 34 knots (Force 8).
The Great Storm of 1987 did not originate in the Tropics and was not,
by any definition, a hurricane – but it was certainly exceptional.
Southeast of a line extending from Southampton through north London
to Great Yarmouth, gust speeds and mean wind speeds were as great as
those that can be expected to recur, on average, no more frequently than
once in 200 years. So, comparison with the great storm of 1703 was justified. The storm of 1987 was remarkable for its ferocity, and affected
much the same area of the United Kingdom as the 1703 storm.
Temperature and pressure
The 1987 storm was also remarkable for the temperature changes that
accompanied it. In a 5-h period, increases of more than 6⬚C per hour
were recorded at many places south of a line from Dorset to Norfolk.
Especially rapid and large was the increase at South Farnborough in
Hampshire, where the temperature rose from 8.5 to 17.6⬚C in 20 min.
The return frequency for a temperature increase this rapid is, like the
return frequency for the wind strengths that occurred in the storm, about
once in 200 years. Across southern England, rapid increases in temperature were followed by sharp decreases.
Ahead of the storm, barometric pressure had fallen rapidly, but neither
the magnitude of the fall nor the rate of decrease was remarkable. The
subsequent rise in pressure was, however, exceptional. Over much of
southern England, increases of more than 8 Mb per hour were recorded,
with the most rapid at Hurn in Hampshire, where pressure rose 12.2 Mb
in 1 h. The greatest rise over 3 h occurred at the Portland Royal Naval Air
Station in Dorset, where, between 0300 and 0600 UTC, the rise was
25.5 Mb. This was, by some margin, the greatest change in pressure –
either upwards or downwards – ever recorded in 3 h anywhere in the
British Isles. At many places in southern England, the pressure rose
more than 20 Mb in 3 h. The return period for such an occurrence is,
again, roughly once in 200 years.
101.
84 Natural DisastersThe storms of 2000
Introduction
The autumn of 2000 was the wettest since records began in 1766. In all,
503 mm of rain fell during this exceptionally wet and unsettled
period. In October, 188mm of rain was recorded in England and Wales,
followed by 182mm in November. In all, the total for 2000 was 251mm
above the average for this season. Not surprisingly, many parts of the
United Kingdom experienced flooding, and there was major disruption to
travel and sporting events as frontal system after frontal system swept
across the country. The problems began during the period between 9 and
12 October, when a complex low-pressure cell built up over Northern
Ireland and Scotland, bringing heavy rain and wind. Then, between
11 and 12 October, a slow-moving area of heavy rain affected the southern parts of the country. In Kent and Sussex, torrential downpours
occurred, with between 4 and 6in. (100–150mm) of rain falling overnight.
Further frontal systems passed over the United Kingdom during the next
fortnight or so, as a low-pressure cell gradually established itself to the
Northwest of the country. This drove belts of rain and heavy showers
across the country and, in some parts of the country, quite significant
amounts of rain fell on every day of the month. By the final week of
October, many rivers in the country were either swollen with floodwater
or had burst their banks.
News bulletins were full of flood warnings and stories of areas being
evacuated as the Environment Agency issued flood alerts. It was then
that meteorological events took a further turn for the worse.
The storms of 28–30 October
A major cyclogenesis (i.e. formation of a depression) took place on
26 October in the northwestern part of the Atlantic Ocean – the result
was a deep low pressure, anchored between Greenland and Iceland, and,
over the next 2 days, an extensive cold front built up, stretching its way
well towards the southwest. This became the ‘birthplace’ for the first
in a series of highly potent wave depressions that tracked across the
United Kingdom between 28 and 30 October.
The ‘parent’ low and its trailing cold front are clearly seen on the
Atlantic infrared satellite image for 0600 UTC on 27 October. Over
the following few days, three ‘daughter’ depressions swept across the
United Kingdom, bringing heavy rain, strong winds, and further flooding in addition to extreme weather events such as tornadoes.
The first storm – 28 October: The first of the daughter depressions deepened quickly as it crossed the country during 28 October. It brought a
milder ‘tropical maritime’ air mass, so, for a while, the passage of the
warm front was accompanied by a period of heavy rain in many places,
with up to 8 mm being reported in an hour across parts of the Home
Counties. This rainfall can be seen on the radar image for 0700 UTC.
102.
Weather conditions 85During the afternoon, the cold front swept eastwards across Wales and
England, accompanied by gale force winds as the depression continued
to deepen. A tornado was reported in Bognor Regis shortly before 1700,
resulting in local severe damage.
Later in the day, the centre of the depression turned towards northern
Scotland and brought a spell of gale force winds to much of the north
during the following 12–24 h. The cold front had, by now, swept into the
North Sea, so, clearer, chilly conditions prevailed across most of the
United Kingdom overnight and into the early part of 29 October.
The second storm – 29 October: Many people in Britain woke up on
29 October to find sunshine and blue skies. A few showers spread inland
during the morning and it was cold enough for a little snow to be mixed
in over parts of northern Britain. However, out to the southwest, a duo
of wave depressions hurtled in from the Atlantic.
The visible satellite image for 1200 UTC shows most of the country still
in reasonably fair weather, although the dappled pattern of clouds indicates showers over some northern areas. Towards the southwest, a large
bank of cloud can be seen, with the second depression forming over Eire
and the third depression forming near 52⬚N, 30⬚W.
The veil of upper cloud ahead of the second storm spread very quickly
northeast across Wales and all but the far north of England by midafternoon on 29 October. Rain set in soon afterwards, becoming steadily
heavier and more persistent as dusk approached. By 1700, heavy rain
had spread across much of the southern part of the country, accompanied
by strong winds. Some of the strongest gusts were experienced across
Wales and southwest England, for example, 76 knots (87 mph) at North
Hessary or on Dartmoor.
The centre of the depression crossed Wales and the Midlands before
heading into the southern part of the North Sea, still deepening quickly.
But worse was to follow, as, after a temporary lull during the evening,
the next wave depression became centred off southwest Ireland, and all
the signs suggested that this would be the most damaging of the three
depressions.
The third storm – 30 October: Rain continued to fall across southern
areas during the early hours of 30 October and, during the second half
of the night, the new and rapidly deepening depression crossed Ireland,
the Irish Sea, Wales, and then on into the southern parts of northern
England. The steep pressure gradient resulted in strong winds and widespread gusts of between 70 and 90 mph.
As is most often the case, the strongest winds were experienced to the
south of the centre of the depression, while, to the north, most of
103.
86 Natural DisastersScotland, Northern Ireland, and parts of northern England escaped with
much calmer conditions. Wind speeds reached a peak in the early hours
along the South Wales coast, touching 84 knots (96 mph) at Mumbles.
During the following few hours, the strongest winds transferred east,
with the Isle of Portland in Dorset reporting a gust to 81 knots (93 mph)
at 0600. The strongest winds accompanied the passage of the cold front
that passed through London between 0600 and 0700, and cleared into
the North Sea by around 0800. Langdon Bay near Dover registered a
gust of 76 knots (87 mph) between 0600 and 0700, and, by 1000, this
weather station had been reporting gusts to 60 knots (69 mph) or more
for 16 h! At inland locations, typical gust strengths were 50–70 knots
(57–80 mph). Some structural damage accompanied these gusts, with
trees being brought down and roads and railway lines blocked.
Rain had fallen all night, so, by 0900, 24-h totals of between 25 and
50 mm were commonplace, with locally 75 mm and more. Local flooding occurred and caused major disruption to commuters during the
morning rush hour of 30 October. In a number of areas, the cumulative
effect of these heavy storms brought the situation close to breaking
point, and the heavy rain on 30 October resulted in much more serious
flooding problems, in areas as far apart as Kent, Wales, and Yorkshire.
Another area of severe weather developed as the depression crossed
northern England and the pressure at its centre continued to fall. The
warm and cold fronts formed a sharp apex, in between which was
located a narrow band of warmer air from further south. Temperatures at
some locations rose some 5–7⬚C within the hour. But as the cold front
crossed, the temperature fell dramatically.
The depression had by now developed a wrap-around of thick cloud,
and heavy precipitation occurred to the west and northwest of the centre,
as seen on the 0900 UTC radar image. However, the precipitation, falling
into the already chilly air, turned first to sleet and then to snow, and swept
eastwards just to the west of the retreating depression. Locally, the temperature was observed to fall as much as 10⬚C within 1 h, and a short spell
of quite heavy sleet and snow set in. Several roads were badly affected,
notably those across the Pennines. During the morning, the depression
moved out into the North Sea, deepening even further, and, during the
afternoon, storm-force winds were recorded over the North Sea, with
some in excess of hurricane force. Later in the day, the storm finally
began to lessen in intensity as it neared the south of Norway.
Hurricane and tornado
What is a hurricane and how it occurs
Every year during the ‘hurricane season’ (from June to November), eastern and gulf coasts of the United States, Mexico, Central America, and
104.
Weather conditions 87the Caribbean are threatened by huge storms, hurricanes, also known in
other parts of the globe as typhoons or cyclones.
‘Hurricane’ (from indigenous term Hura Kan – winds of the gods) is a
name for a tropical cyclone occurring in the Atlantic Ocean.
Tropical cyclone is the generic name for low-pressure systems, which
develop in the tropics. When tropical cyclones have a maximum sustained surface winds of 39 mph they are called tropical depressions, up
to 73 mph they become tropical storms, and at wind speeds greater than
74 mph they are called hurricanes. The weakest Hurricane (category 1)
has wind speeds between 74 and 95 mph.
Hurricanes occur as a result of very low pressure zones occurring over
warm oceans, usually in late summer and autumn when seawater is at its
warmest. Hurricane winds often generate tornadoes, which are smaller,
more intense cyclonic storms where a spinning vortex reaches down
from the base of a thundercloud. A hurricane, when formed, includes
• the eye: the low-pressure centre of circulation;
• the eye wall: area around the eye with the strongest winds;
• rain bands: thunderstorms moving outward from the eye, part of the
evaporation/condensation cycle that feeds the storm (see Fig. 5.7).
How a hurricane works
The whole process of hurricane formation is not fully understood, but it
has been established that a number of conditions are present when it
Direction of rotation
Storm clouds
Fig. 5.7
Hurricane development diagram.
Hurricane
winds
Vertical
flow
105.
88 Natural Disastersdevelops from a thunderstorm:
• A cycle of warm humid ocean air evaporation – condensation. As explained in Section 5.1, the rising warm air from the sea surface condenses in contact with colder layer, releasing latent heat of
condensation, which heats cooler air causing it to rise and in turn be
replaced by warm air from the ocean below. This continuing cycle creates a pattern of wind, which circulates around a centre, similar to the
pattern of water going down a plughole.
• Converging surface winds pattern and high-speed-altitude winds. As
the cycle develops into a storm, several winds are moving in different
directions colliding and pushing warm air upwards and increasing the
speed of surface winds rising already. High-altitude winds maintain
the storm if at uniform speeds at all levels, failing which winds shears
form causing the storm to weaken.
• Difference of air pressure between the surface and high altitude. The
high pressure in the upper atmosphere helps driving the air cycle.
As high-pressure air is sucked into the low-pressure centre (the eye),
the storm increases wind speeds.
Hurricane size
The destructive power of a hurricane is determined by two factors:
1. the wind speed and
2. storm surge (a wall of water pushed by the hurricane as the sea level rises
due to wind and atmospheric pressure changes associated with storms).
Hurricanes are rated in five strength categories by the Saffir–Simpson
scale system (see Table 5.2).
Table 5.2
The Saffir–Simpson hurricane scale.
Category Wind speed
Effects
1
74–95 mph (119–153 kph)
Storm surge 4–5 ft (1.2–1.5 m) above normal
Some flooding
Little or no structural damage
2
96–110 mph (155–177 kph)
Storm surge 6–8 ft (1.8–2.4 m) above normal
Trees down
Roof damage (shingles ripped off )
3
111–154 mph (178.6–209 kph) Storm surge 9–12 ft (2.7–3.7 m) above normal
Structural damage to houses
Mobile homes destroyed
Severe flooding
4
131–154 mph (210–247.8 kph) Storm surge 13–18 ft (4–5.5 m) above normal
Severe flooding inland
Some roofs ripped off
Major structural damage
5
⬎155 mph (⬎249.4 kph)
Storm surge at least 18 ft (5.5 m) above normal
Severe flooding further inland
Serious damage to most wooden structures
106.
Weather conditions 89Hurricane damage
– Rain – hurricanes bring vast amounts of rain, as much as dozens of
inches in a day.
– Flooding – as a result of the sudden infliction of such huge quantities
of rain and the combined effect of storm surge and high tide.
– High sustained winds, which cause structural damage, blow over trees
and cars, beach erosion.
– Satellite smaller storms such as tornadoes.
The extent of the damage depends on
– hurricane strength;
– angle at which storm hits the land (head on or just grazing the
coastline);
– which side of the hurricane strikes (on the right-hand side the hurricane is stronger as its motion and wind speed are complementary, on
the left-hand side its motion reduces the wind speed).
Case study – Hurricane Andrew
Hurricane Andrew (see Fig. 5.8) has caused an estimated $26 billion
damage and is being considered the most expensive natural disaster in
the history of the United States.
It was also the third strongest after 1935 Florida Keys Labour Day storm
and Hurricane Camille in 1969. Classified as a category 4 storm,
Andrew had a central pressure of 922 mbar, its storm surge was a record
for Florida, 16.9 ft (5 m), wind speed reached 145 mph, with gusts up to
175 mph, and destroyed an area of 1100 miles2.
As with many Atlantic hurricanes, Andrew was formed as a result of a
tropical wave, which moved off the West Coast of Africa and passed
south of the Cape Verde Islands. It became a tropical storm on 17 August
Fig. 5.8
Hurricane Andrew. © NASA.
107.
90 Natural Disasters1992 and moved uneventfully west northwestward across the Atlantic.
Significant changes occurred in the large-scale environment of Andrew
on 21 August as a deep high-pressure centre developed over the southeast
US and extended eastward to north of the tropical storm. In response to
the much more favourable environment, Tropical Storm Andrew
strengthened rapidly and turned westward. Andrew became a hurricane
on 22 August and strengthened to a strong category 4 hurricane the next
day. Eye temperatures, as measured by reconnaissance aircraft, suggest
that convection in the eye-wall and the associated vertical circulation
became more powerful as the storm moved ashore.
Damage
The storm devastated Dade County where it caused an estimated
$25 billion in damage. After striking Florida, Andrew moved northwest
across the Gulf of Mexico to make a second landfall in a sparsely
populated area of south central Louisiana as a Category 3 storm on
26 August. In total, Andrew directly caused 23 deaths in the United States
and indirectly caused 38 more (see Fig. 5.9).
Fort Lauderdale
Light
Dade county
Miami
airport
Mild
Heavy
Florida
city
Severe
Homestead
AFB
Fig. 5.9
Plan of Dade area affected by
Hurricane Andrew. (Source: EQE
Internation Inc.)
Eye wall
108.
Weather conditions 91Businesses were damaged, an airforce base levelled, acres of tropical
fruit trees were uprooted, and tourist industry was given a long-term
blow, not only because of the actual damage to hotels, etc., but also by
association with being a dangerous place to go to.
Impact on buildings
The worst hit were the residential buildings: 25 524 homes were
destroyed and a further 101 241 were damaged, accounting for about
70% of the losses. The type of homes destroyed were:
– 63% single family homes;
– 29% apartments in condominiums;
– 8% mobile homes. (Source: project CHART – the Co-ordinated
Hurricane Andrew Recovery Team, 1994.)
The actual damage was due to:
• water damage – apart from the rain the destruction of the roofs and
windows enabled water to flow in freely;
• roof failure through inadequate fixings of sheathing, especially in
gable-roof houses;
• flying debris breaking windows and damaging roofs.
It was found that the statutory design parameters such as wind speed
were greatly exceeded. Also, a combination of poor materials, inadequate roof systems, unprotected openings facilitated the high degree of
roof and water damage. The widespread destruction resulted in housing
shortage and housing assistance was made available by public and private sources. Insurance covered three-fourths of the losses, FEMA provided 3600 mobile homes and travel trailers; rental vouchers were
provided for disaster victims by HUD, who also assisted in repair and
provided low-cost units in the region affected.
Project CHART has estimated that 75% of the housing lost was restored
to 90% of its value within 2 years.
What is a tornado
Tornadoes are violent spiralling storms, which occur when a mass of
cold air clashes with an opposing mass of warm, moist air. With a characteristic rotating motion, they are accompanied by funnel-shaped cloud
and are seasonal.
In West Africa, they are in evidence at the beginning and the end of the
rainy season and in the United States, which is one of the most tornadoprone countries in the world, from April to July, with variations for the
north and the south. Tornadoes also tend to be afternoon or evening events.
Rated from 0 to 5, they can reach 260–318 mph, and are capable of lifting frame houses off their foundations or stripping the bark off trees. The
109.
92 Natural Disastersdamage is increased due to the debris they pick up: from hoardings and
small objects to cars, trees, and even trucks.
Tornadoes only happen over lands and tend to appear at the trailing end
of storms, born of a mix of three main ingredients: wind, temperature,
and moisture. The warm air drawn by the storm raises and with the
colder higher temperatures condenses into rain, which, in turn, sets off
an opposing cool downdraft. Wind shear rolls together the cold and
warm air into giant horizontal spinning tubes, which, when tilted with
one end touching the ground, become tornadoes.
About 500 yards wide and lasting around 15 min, tornadoes leave a trail
of destruction on average 2 miles long and 1000 ft wide, but sometimes
their trail is significant enough to be visible from satellite as over
Oklahoma (see Fig. 1.1).
It is not clear why some major storms, such as hurricanes, spawn tornadoes, while others, just as powerful, do not. United States, which is constantly hit by tornadoes (about 800 a year on average) has been making
sustained efforts to improve the understanding of the causes of hazardous weather and provide better warning systems, currently averaging
between 6 and 12 min.
Table 5.3
Tornado ratings.
Scale number
wind
Maximum
F0
F1
F2
F3
F4
F5
F6
72 mph
112 mph
157 mph
206 mph
260 mph
318 mph
379 mph
A number of US government agencies (The National Severe Storms
Laboratory and The Storm Prediction Centre) have been set up to undertake long-term research. Doppler radar can detect strong rotation within
a storm and NEXRAD, a computerized Doppler system, has been effective at locating and analysing tornado producing storms.
Tornadoes are rated as shown in Table 5.3.
Lightning
What is lightning and how it occurs
When a cold front meets warm air it pushes it upwards and, as explained
in Section A, a storm occurs in the process and thunderstorm clouds
develop, becoming charged like giant electricity storing devices.
Lightning is a very powerful spark between clouds with different potential or a charged cloud and the earth.
How lightning occurs
Ions and electrons in the atmosphere convert to water droplets of different charges (positive, negative, or neutral). It is not fully understood how
these become separated into different clouds or, more often, in different
parts of the same cloud with the upper part becoming positively charged
and the lower part negatively charged, with the two separated by an insulating layer of air.
As the clouds grow, their charges increase until the voltage difference
between the positive and negative parts is so great that it breaks down
110.
Weather conditions 93the resistance of the insulating layer and an electrical discharge occurs.
The discharge starts with a negatively charged downward feeler (step
feeler) seeking an easy path to a positively charged part that is sending
upward seeking positive streamers. When these meet, the potential difference is equalized, causing a bright flash or a return stroke.
The charged cloud, or part of a cloud, will discharge towards another
charged body as soon as the potential difference is high enough to overcome the resistance between them. Discharge between different portions
of the same cloud happens more often than between two clouds or a
cloud and the earth because of the way the air inside the cloud becomes
ionized by the drawn out water droplets that create a path for the ‘step
leaders’, also known as ‘potential gradients’.
The lightning flash is the visible effect of the passage of the discharge,
usually several miles long. When a discharge happens, ionization takes
place and, almost simultaneously, ions and electrons recombine.
Light is emitted in the process accompanied by sudden expansion and a
violent reaction of the heated air, causing the vibration that constitutes
thunder. Thunder is the explosion that occurs at the same time with the
flash, but due to the relatively slow speed of sound travel arrives much
later.
A charged cloud will transmit a charge to the earth below by attracting
opposite particles. This concentrates on any upstanding point such as a
tree, chimneystack, or church steeple. These protruding objects begin to
respond to the strong electric field by producing ‘positive streamers’ and
a discharge takes place as soon as the surrounding air becomes sufficiently ionized.
When the potential gradient is extremely steep the objects need not be
very high above the ground: a tent pole, tree, or human being, for example, will be sufficient to act as a conductor. A lightning conductor does
not ‘attract’ lightning. A lightning conductor protects by providing the
current with the easiest route to conduct it safely to earth, thus reducing
the potential for discharge (potential gradient). The reduction of the
potential gradient is why thunderstorms are correctly said to be less dangerous when accompanied by rain. Each raindrop carries a small amount
of electric charge to the ground, thus reducing the difference between
charges.
The average quantity of electricity carried by a lightning strike is about
20 C and the value of the current of the order of 20 000 A, at peak releasing 100 MW/m.
The power of current carried by discharges has been recorded to be as
high as 250 000 A.
111.
94 Natural DisastersTypes of lightning
• Normal lightning as described above.
• Sheet lightning: normal lightning reflected in the clouds.
• Heat lightning: normal lightning near the horizon, reflected by high
clouds.
• Ball lightning: lightning forms a slow moving ball that can burn
objects in its path before exploding or burning out.
• Red sprite: a red burst reported to occur above storm clouds reaching
a few miles in length towards the stratosphere.
Effects of lightning on buildings
As lightning strikes it heats air to about 30 000⬚C, which expands explosively damaging the part of the building where it strikes. The extent of
the damage will depend on the power released as well as the discharge’s
direction and ‘striking distance’ (length of the last step of the downward
feeler of the discharge). British Standard 6651-1992 represents this distance as a sphere of 60 m diameter and when superimposed on the plan
and elevations helps establish the protection required. The projecting
parts of a building that are nearest to the downward feelers, such as
chimney stacks, pinnacles, crosses, steeples, will be the most vulnerable.
The main causes for damage to the fabric of a building are:
the consequences of the explosive air expansion;
the effect of the mechanical force of the strike;
the effects of the high temperatures involved;
flying debris;
weakening and/or dismantling of parts of the structure;
dislocation along masonry joints;
fire from igniting dust;
the effects of the magnetic field created by the discharge causing damage to electrical circuits and electronic equipment.
Surge protectors deal only with surges in supply. To protect electronic
items like TV, VCR, etc., a ‘lightning arrester’ is needed. It uses a gas
filled gap that acts as an open circuit to low potentials, but becomes ionized and conducts at very high potentials.
Protecting buildings from lightning
• As a rule of thumb, lightning has been considered to affect an area
contained within a 45⬚ line drawn from the highest point of a building;
thus, protection has been provided accordingly with a conductor
placed at the highest point to cover this required zone of protection.
Detailed advice and specification for protection and installation can be
found in British Standard 6651: 1992 – Protection of Structures
against Lightning.
• Lightning has also been observed to strike at the sides of buildings,
seeping in through joints, dislocating whole blocks away, and splitting
112.
Weather conditions 95masonry. The phenomenon is still being researched, but buildings
need to be protected from this side flash type of hit too. Current recommendations suggest that protection can be achieved with a series of
down conductors protecting the entire building; towers and spires
requiring two down conductors diametrically opposite to each other
and horizontal conductors (coronas) at 20 m centres. A 20 m ⫻ 10 m
grid would protect the rest of the building projecting features requiring additional air terminals. Positioning of conductors is important for
safety reasons, but, in the case of historic buildings, for also being able
to provide the necessary protection without altering the character and
appearance of the monument.
• To ensure adequate earthing and protection the installation must be regularly inspected and maintained. A qualified contractor should carry out
checks once a year and after each lightning strike checks the electrodes.
Maintenance of the system is of paramount importance, as the provision of a lightning conductor will not prevent lightning from striking,
just direct into the earth safely. If through lack of maintenance this is
not possible the building and its occupants will lose protection.
Case study – Reconstruction of church spire
St Quentin-sur-Indrois, France (contributor: Bertrand Penneron,
Architect,Tours, France)
Historical background
The St Quentin sur Indrois church was built in the eleventh century,
probably as a replacement of an earlier timber church, on being granted
to the Abbey of Marmoutier. The Bell Tower was erected at the beginning of the twelth century with a vaulted stone first floor. The Chancel
has been subject to substantial alterations from the end of the fifteenth
century to the beginning of the sixteenth century. To enable their vaulting over, the walls were raised, additional supports built, and buttresses
added. The Nave roof structure was comprehensively restored.
In 1614, a manorial chapel was built against the chancel and bell tower,
which is now the Vestry. The two asymmetrical altars on the east side of
the nave were also erected during this period. Another major transformation took place during the eighteenth century. The nave walls were
reduced by about 1 m; the roof structure was restored re-using salvaged
elements. The gallery, which at that time still existed on the south elevation of the nave, was part demolished, part incorporated above the portal. Finally, it was the nineteenth-century refurbishment that gave
the church its present appearance: the bay openings, the panelling of
the underside of the nave’s roof timbers, the erection of the dais, and the
removal of the Southern gallery.
During this time, the church was almost entirely restored: the walls and
vaults, the Bell Tower base, and spire were renewed in ashlar and rubble
stone and re-rendered. The roof structure was refurbished, the Vestry and
Chancel roof coverings repaired, and that of the nave completely
113.
96 Natural Disastersrenewed. The Chancel’s render was renewed to give the appearance of
stonework, and was painted in distemper. The vault supporting the Bell
Tower was restored; the Belfry refurbished with an oak copy. The inside
of the spire was cement rendered. The spire base was strengthened
with a metal device, but it is difficult to be specific about this as several
projects are mentioned in the archives.
The works executed are described as follows in a November 1880 account:
An external strapping with iron circles tied internally by tie-rods of the
same metal and supported by vertical uprights. (…) Dressing of the Spire
and the bell Tower, rendering with hydraulic lime. This render covering the
irons will preserve them from the direct action of the air and oxidation. The
iron used come from the Berry forge will be soft, treated with a minimum
of two oil-based coats before use. All assemblies will be executed with the
greatest care, the bolt and nut fillets will be regular and thick, the nuts
will always be used in pairs, one over the other, and the bolts level on the
last nut
The church was listed on the Historic Monuments Supplementary List
on 28 October 1926.
On 21 June 1957, the Bell Tower was hit by lightning and suffered substantial damage. The repairs consisted of the re-building of the Belfry,
repair of a crack on the north side of the Tower, rebuilding of the finial
of one the pinnacles, repairs to the lower part and replacement of the
upper part of the Bell Tower, the readjustment of the cross, and the
renewal of the weather vane cock. Lightning struck the Bell Tower again
on 16 May 1988, causing minor damage. It is likely that the strengthening of the tower with concrete was undertaken at this time: a concrete
floor supporting the belfry, concrete perimeter tie-beams replacing or
complementing the metal devices. It is amazing that despite repeated
damage from lightning a lightning conductor was not installed!
On 12 April 1998, the Bell Tower was hit by lightning once again.
This time the stone rubble Spire was almost entirely destroyed, its fall
causing substantial damage to the roof timbers and coverings of
the entire church, the chancel vaults, the furnishings, and the flooring
(see Figs 5.10 and 5.11).
Emergency measures were then undertaken: the remains of the chancel
vault was enclosed in shuttering, a tie-rod was inserted between the
north and south nave walls, which were no longer linked by the roof timbers, and a temporary roof cover was installed over the damaged roofs.
An architect experienced in historic building restoration and familiar
with traditional buildings techniques (Bertrand Penneron) was appointed
to oversee the repair works (see Contributors notes). The rebuilding
work was financed mostly by insurance funds and by some grants from
114.
Fig. 5.10St Quentin sur Indrois – church
spire damaged by lightning.
Fig. 5.11
St Quentin sur Indrois – damage to
church roof detail.
115.
98 Natural Disastersregional and departmental funds, as well as by The French Ministry of
Culture. However, as a result of administrative and insurance procedure
requirements, it was only at the end of January 2001 that funds were
secured and remedial work initiated.
Building survey following the disaster
The nave
The roof timber structure was constructed with truss forming rafters, and
panel lined with nailed but jointed boards. There are five apparent main
trusses with tie beams and octagonal king post and secondary trusses at
approximately 65 cm centres.
The eastern half of the nave was entirely destroyed. The furnishings
were partly destroyed. The nave had two Altars, constructed in timber
with plaster reredoses, all decorated in ‘faux marble’ style. One has been
destroyed and the two reredoses damaged when the roof fell in. A great
number of pews were destroyed. The five plaster statues placed on
brackets along the walls were damaged.
The chancel
A large part of the roof timber structure was destroyed by the fall of the
stone spire and the parts, which remained in situ, were disturbed (breakage of assembly). The floor was partly smashed by the fallen stone vault.
The plywood Altar used for Mass was destroyed by the falling structural
timbers.
The bell tower
The spire was almost entirely destroyed as a result of the explosion
caused by the expanding heated air and debris flying hit the stone
facades across the road leaving marks resembling bullet holes. The base,
which remained in situ, was completely disturbed (see Fig. 5.12).
Fig. 5.12
St Quentin sur Indrois – church spire
damage. © Bertrand Penneron.
116.
Weather conditions 99One part of the bay level was also destroyed. One of the little towers,
also in rubble stone, had shifted away from the group. The rest of the
tower remained in relatively good condition.
The vestry
Falling masonry and roof timbers disturbed the vault
The re-building work
The principle adopted was to reinstate what was lost exactly in the same
way as it was before the damage occurred, and to restore all the elements
damaged by the disaster (see Figs 5.13 and 5.14).
Contractors were selected amongst professionals experienced in historic
building restoration, with specific qualifications such as those issued by
QUALIBAT or other similar references.
The nave
The part of the structural roof that was destroyed was entirely re-built,
copying the components of the surviving portion using the same type of
timber, the same section, and type of decoration. The timber structure of
the roof and the timber boarding were re-built using traditional methods
and re-using as much as possible the old timbers. The surviving part was
inspected (in particular the assembly joints that had been shaken by the
strike). The roof was entirely recovered with slate, matching the rest of
the church. In order to retain the unity of the volume, it was decided to
renew the entire floor, not just the part that was destroyed in the nave, and
part of the Chancel. A combination of clay tiles and chalk stone slabs was
used and advantage was taken of the restoration work to install an underfloor heating system, replacing the existing heating system that did not
comply with building safety standards. The Altars and the pulpit were
B
N
W
E
S
C
NEF
Choeur
Clocher
Abside
C
Sacristie
B
Fig. 5.13
St Quentin sur Indrois – church plan.
© Bertrand Penneron.
Plan au niveau du beffroi Plan au niveau de la Fleche
0 1
5
m
117.
100 Natural Disasters0
1
5
m.
Fig. 5.14
St Quentin sur Indrois – church
repairs section. © Bertrand
Penneron.
reproduced exactly as the originals, in accordance with surviving features
and the record photographs from the archives kept in the Town Hall.
The chancel
The vault was rebuilt as an exact replica of the surviving bay, and has
been decorated in ‘faux’ stone as the existing one, which has been
restored. The roof coverings and timber structure has been renewed as for
the nave. Taking advantage of the works, it was decided to reinstate a
junction between the chancel and the bell tower. This existed in the past
as witnessed by the remains of the flashing mark on the bell tower; it had
118.
Weather conditions 101the advantage, amongst others, of improving the disposal of rainwater
and of allowing access into the roof space of the Chancel from the bell
tower, through an opening that existed in the rubble stone wall. The
Altar, of a very modest construction (plywood covered by a piece of
cloth), was entirely destroyed and the opportunity arose to design a more
noble piece of furniture. With the agreement of the clerics, a solid wood
altar is being constructed.
The apse
The roofing was renewed as for the rest of the church. The existing roof
was executed on cut slopes, probably for economic reasons; advantage
was taken of the works to renew it in a conical shape, more suitable for
a circular apse.
The bell tower
When the lightning hit the masonry, the extreme heat caused it to explode.
Here, almost the whole of the spire had fallen. The base, which remained
in place, was entirely disturbed and had to be dismantled and rebuilt. The
perimeter ties at the base of the spire has allowed the upper part of the belfry to remain in place. Nevertheless, the lightning has probably passed
along the chamfer of the southern bay of the east face, and the entire corresponding angle had to be refurbished. An opening existed in the slopes of
the spire, visible in the photographs; this was reinstated. As witnessed by
the numerous estimates in the Town hall archives, at the end of nineteenth
century the bell tower was showing serious structural problems. Apart from
the age of the masonry, it was due to the excessive thrust exerted by the
vault supporting the belfry, which was removed and replaced by a wood
and metal floor, and then by a concrete one, thus removing one of the
causes of the problem. The bell tower was otherwise strengthened.
The reinforced concrete strengthening was maintained, checked, and
restored. As the concrete floor supporting the belfry was very thin
(10 cm) it was strengthened. The checking and restoration of the belfry,
bells, and mufflers were also undertaken. At long last a lightening conductor, protecting the entire building, was installed!
The vestry
The timber roof structure and coverings over the nave were renewed.
Here too it was decided to take advantage of the works to reinstate a valley forming roof slope (of which there still remained traces under the
form of a flashing) in order to improve the disposal of rainwater. Certain
sections of the cornice and stained glass were also renewed. The
church’s lighting scheme was entirely re-designed, the existing installation no longer complying with the safety standards; the lighting was
designed to allow, on the one hand, the conduct of the religious service
and, on the other, to enhance the remarkable features of the monument
(Altars, vaults, panelling). Figure 5.15 shows the church building after
restoration work was completed.
119.
102 Natural DisastersFig. 5.15
St Quentin sur Indrois church
after repairs.
Extreme temperatures
Temperature records – extreme cold
General
In central Europe, records go back to the sixteenth century; in central
England, to the seventeenth century.
The Climatic Research Unit (CRU) at the University of east Anglia,
Norwich (UEA), widely recognized as one of the world’s leading institutions concerned with the study of climatic change, used 17 sets of data to
build up a record of average summer temperatures for both hemispheres
from the year 1000 to 1991, with 10 applying to the Northern Hemisphere.
Five are from tree rings from northern Sweden, Siberian, Alberta, and
Idaho. Ice core data are two from Greenland and one from Spitzbergen.
The result has been that the temperatures currently being experienced
are higher than at any time over the last 1000 years, with 1998 being the
hottest single year on record.
The CRU team is examining patterns past and present that have had a
forcing effect on climate, including events like volcanic activity and solar
cycles. The aim is to compare patterns of the past with those of today to
prove conclusively if current temperature changes are significantly different from patterns of natural variability in the past. Climate models suggest that anthropogenic global warming will show a distinctive pattern,
120.
Weather conditions 103for example, that it will be greatest in northern latitudes of the great continental landmasses. Already recent summer temperatures in Siberia are
higher than for a 1000 years.
Summary of changes occurred over the last 100 years, attributable to
human-induced global warming (Source: CRU)
• Sea level has risen up to 250 mm since 1860 and could rise by 1 m by
2100.
• There has been a marked increase in the incidence and severity of storms.
• El Nino has produced effects of unprecedented severity effects due to
the warming in the Pacific.
• Receding polar ice is resulting in the rapid expansion of flora;
Antarctic summers have lengthened by up to 50% since the 1970s and
new species of plants have appeared as glaciers have retreated.
• In Switzerland, glaciers have retreated by up to 50%.
• Global mean surface air temperature has increased between 0.3 and
0.6⬚C since the later part of the nineteenth century. The hottest year on
record was 1998.
• Seasonal shifts and changes in rainfall patterns are becoming increasingly pronounced.
• Spring in the northern hemisphere is arriving at least 1 week earlier
than 20 years ago.
• Deserts are expanding.
• Pests and pathogens are migrating to temperate latitudes, most notably
vector-borne malaria.
Extreme cold
November 1998 was the coldest in Moscow and other parts of European
Russia since complete records were first kept in 1879. In Petropavlosk,
the city’s mayor told residents to take to their cellars and cover the radiators in their apartments with blankets to save the heating system from
total collapse. In Vladivostok, Russia’s main Pacific Ocean port, the cold
spell that has already brought daytime temperatures to ⫺25⬚C (⫺13⬚F)
was forecast to be the longest in any December since 1941. Coal
reserves at a power station that provided the city’s central heating stood
at 80 000 tonnes, compared to 250 000 tonnes the previous year. A
spokesman for the local electricity company said that if the next delivery of fuel were held up at all, the heat would have to be shut off.
Subsequently, 17 frozen apartment blocks had to be abandoned in the
town of Alapayevsk near Yekaterinburg in the Ural Mountains because
fuel was late in arriving at the town. In the remote Arctic outpost of Cape
Schmidt opposite Alaska, vanishing fuel supplies forced 190 families to
abandon their frozen apartments and relocate to military barracks or
move in with relatives.
January 2001 was the coldest in 50 years in Siberia. (Northern
Hemisphere’s low-temperature records were not surpassed however.
121.
104 Natural DisastersThey remain: ⫺90⬚F in Verkhoyansk on 5 and 7 February 1892, and in
Oimekon on 6 February 1933, both in Siberia.) There were two episodes
of unusually cold weather in Siberia in 2001: 1–13 January and
27 January to 6 February. The lowest temperatures in the western political
subdivisions (oblasts) of Siberia (Tomsk, Novosibirsk, Omsk, and Altay
Kray) occurred during the first episode, with minimum temperatures
ranging from ⫺42 to ⫺61⬚F.
The normal daily average temperature for stations in these oblasts ranges
from 6 to ⫺9⬚F during early January. The observed average temperature
at these stations on the coldest days ranged from ⫺31 to ⫺51⬚F. The
lowest temperatures at stations farther east in the east Siberian region
(most notably in the Irkutsk oblast) occurred during the second episode,
mostly on 31 January and 1 February, with minimum temperatures ranging from ⫺48 to ⫺72⬚F. Daily average temperatures ranged from 28 to
46⬚F below normal.
The coldest weather actually occurred in what is known as the Russian
Far Eastern Region, in Oimekon (⫺78⬚F) and Verkhoyansk (⫺73⬚F) on
29 and 27 January, respectively.
In Table 5.4, some of the coldest days observed at Russian stations in
January and February 2001 are shown. (The ‘WMO number’ identifies
a particular surface station in the World Meteorological Organization.)
Although the weather in January 2001 was unusually cold in Siberia and
the Far East, it was not the coldest in the last 50 years. The average
monthly temperatures in 1969, 1977, and 1972 (for some stations) were
probably lower (see Table 5.5).
Vostok, Antarctica, is the home of the coldest temperature on Earth at a
cool ⫺89⬚C (183 K). At the Russian research station the temperature is
regularly in the ⫺30 to the ⫺60⬚C mark. This chilly weather is due to
Table 5.4 Coldest five days observed at Russian weather stations in January and
February 2001.
Date
WMO number
City
Minimum
(⬚F)
Maximum
(⬚F)
29 January 2001
27 January 2001
15 January 2001
28 January 2001
31 January 2001
1 February 2001
1 February 2001
2 February 2001
2 February 2001
1 February 2001
24 688
24 266
24 678
24 382
24 817
24 688
24 817
24 918
30 127
24 713
Oimekon
Verkhoyansk
Zapadanya
Ust-Moma
Yerbogachen
Oimekon
Yerbogachen
Zhdanovo
Yuktukon
Nakanna
⫺78
⫺73
⫺70
⫺69
⫺69
⫺72
⫺72
⫺71
⫺71
⫺69
⫺65
⫺67
Unknown
⫺62
⫺54
⫺59
⫺68
⫺65
Unknown
⫺68
122.
Weather conditions 105Table 5.5 Coldest temperatures on earth.
Bibliographic entry
Result (with explanation)
Standardized
result
Earth Science Revised, 3rd edition. New
York: Prentice Hall, 1987: 217
World Book Encyclopedia. New York: World
Book, 2000: A530
Weather at the Coldest Place on Earth: Vostok
Antarctica. Central Atlantic Storm
Investigators (CASI), 1999
McFarlan, Donald. Guinness Book of Records.
New York: Guinness Publishing, 1992: 42
Antarctica Weather. The Antarctic
Connection, 2000
‘… the temperature in Vostok, Antarctica, dropped to nearly
⫺89.2⬚C, the lowest temperature ever recorded on Earth’
‘Scientists recorded the world’s lowest temperature, ⫺128.6⬚F
(⫺89.2⬚C), at Vostok Station …’
‘Vostok, Antarctica holds the world’s record for coldest
temperature: ⫺129⬚F (7/21/83)’
⫺8 9 . 2⬚C
‘⫺126.9⬚F. Vostok, Ant. Aug. 25, 1960’
⫺8 8 . 3⬚C
‘Antarctica has the coldest average annual temperatures, and
the lowest temperature ever recorded on earth (⫺129⬚F)
was at Vostok on July 21, 1983.’
‘Vostok station (Russian) NEW RECORD SET IN 1997!!! This is
an unconfirmed report from Vostok Station during the winter
of 1997. ⫺91⬚C (⫺132⬚F). This is colder than Dry Ice! The
“official” record is also from Vostok station on July 21,
1983 ⫺89.2⬚C (⫺128.6⬚F)’
⫺8 9 . 4⬚C
Pomeroy, Marc. Antarctic Facts. 1999
⫺8 9 . 2⬚C
⫺8 9 . 4⬚C
⫺9 1⬚C
(unconfirmed),
⫺8 9 . 2⬚C
(confirmed)
the exceptionally high speed of the arctic winds. The katabatic or downward type winds that bring the brisk temperature travel with speeds up to
200mph (about 90m/s) from the inland towards the coast of the continent.
As one moves toward the higher region inland – that is, towards the true
pole – the temperature drops from its normal ⫺40 to ⫺80⬚C. The coldest
temperatures usually occur during the winter months of around 22 March,
when Antarctica has completed days of darkness. Warmer temperatures,
usually still well below freezing, occur during the all-day summer months
around 22 September. Antarctica also holds the previous record of the lowest temperature on earth at ⫺88⬚C. Although still unofficial, Vostok
Station may have broken its own record for the coldest temperature on
earth. It has been reported that Vostok reached the temperature of ⫺91⬚C
during the winter of 1997. (Source: Yong Li Liang, 2000.)
Temperature records – extreme heat
Our life depends on the Sun heating and lighting the Earth.
The Sun’s surface temperature is 5500⬚C, and whilst the Earth is much
cooler, temperatures can still reach levels man find difficult to tolerate. At
41⬚C, proteins begin to denature and cells begin to be irreversibly damaged.
A body temperature of 45⬚C is lethal for humans and at temperatures
exceeding 50⬚C almost all cells are destroyed if exposed for a few minutes.
The hottest air temperature ever recorded was 58⬚C, measured in the
shade in Lybia (El Azizia, September 1992); temperatures of over 45⬚C
are recorded routinely in Central Australia, The Gulf States, and Sudan.
High temperatures can be registered in normally cold environments such
123.
106 Natural Disastersas mountain tops – Everest snowfields have recorded 30⬚C, but the highest temperatures on earth are found in deserts. Deserts are defined as
areas that receive less than 10 in. of rain a year. The extreme heat can be
further increased by hot dry winds and the lack of clouds allows the
intense sun radiation to build up rapidly during the day and cool equally
quickly at night.
With protective clothing humans can tolerate temperatures above boiling
point but only for short intervals as the body temperature inevitably rises
and brain cells, extremely sensitive to heat, cannot withstand more than
42⬚C, after which the brain function is severely impaired. Consequently,
our ability to survive in extreme heat depends on being able to keep body
temperature below 42⬚C. An example of the devastation that hot weather
can cause was witnessed in July 2000 in South East Europe, when recordbreaking temperatures caused deaths due to heat stoke, high blood pressure, and heart attacks in Greece, Romania, Turkey, Bulgaria, and Italy.
In Romania, hospitals were overcrowded with sufferers, pavements
melted in the heat and nearly 200 fires occurred within 24 h due to the
hot and dry conditions. Government employees were told to stay at
home because of lack of air conditioning and power failures. Similar
reports came from Bulgaria, Macedonia, Belgrade, and Turkey. The
region’s average top summer temperature, usually between 30 and 35⬚C,
was reaching 42⬚C in the shade and was set to rise due to a thermal air
heat mass flowing in from the Sahara desert.
In Italy, wildfires spread across the from Rome to Sicily and in Greece
authorities provided air-conditioned public auditoriums and halls for the
public, activating a civil defence fire and medical emergency alert.
Long-term planning to ensure communities at risk are better prepared
when they involve reviewing shelter and housing construction.
Traditionally, survival in hot climates has meant that man has sheltered
from heat in cooler underground locations and constructed buildings so
as to reduce heat absorption and maximize cooling effects.
The Matmata houses of the Sahara are sited 10m below the ground and
some people in the Australian desert town of Coober Pedy still live in
homes below the ground. In lesser heat, built-in features help to reduce
heat; for example, the wind catchers in Pakistan or the sliding walls in traditional Japanese houses, which allow cooling through winds. In more
temperate conditions, but still subject to periods of hot climate, such as
Italy or the south of France, stone walls, several feet thick, are employed
for their insulating qualities to provide refuge from intense heat.
Design elements for buildings in hot climates are discussed in detail in
the following chapter.
124.
Weather conditions 107General design features
‘Climate sensitive design’ has become a high priority in recent years.
Sometimes referred to as ‘solar architecture’, ‘climatic or bioclimatic
architecture’, it represents the acknowledgement of the significant role
climatic factors have in determining the basic internal environmental
conditions and, ultimately, the quality of buildings.
It has been possible to overcome some of the negative effects of poor
design that has disregarded the effect of climate conditions by the use of
heating, ventilation, and air conditioning, but the consensus is that an
extravagant use of such systems is becoming unacceptable, not least
because of its effect on energy consumption.
Climate-sensitive design is now adopting a number of factors in building construction, in recognition of their considerable impact within the
context of varying environmental conditions:
1. design of an appropriate building form avoiding unnecessary overshadowing of one building by another;
2. use of suitable construction techniques such as the relative positions
and thickness of insulation materials to maximize beneficial heat
gains or to exclude excess heat;
3. adapting the internal layout to climate and building orientation so that
rooms or spaces with specific functions are located adjacent to the
most appropriate facades;
4. division of buildings into thermal zones with buffer areas, such as
balconies, verandas, atria, courtyards, and arcades; avoiding the creation of barriers to cross-flow ventilation where this is required;
5. judicious choice and positioning of appropriate building materials
within the internal and external fabric, particularly where thermal
mass effects can be used to dampen temperature fluctuations;
6. location, size, and type of openings in the building envelope (including glazing type) chosen so as to exploit an advantageous solar gain
(glazing facing south in northern latitudes is easier to shade);
7. careful co-ordination between the building and the site so that site
disadvantages are not exacerbated.
Many of these features can be incorporated within the usual building
process, often at minimal additional cost. A recent example of a climatesensitive-design building, The City Hall London (Fig. 5.16) is not only
a remarkable landmark, but also ensures that it will run on a quarter of
the energy of a conventional office building.
Materials, thermal mass, and energy storage
One of the constituent elements of good climate-sensitive design
involves the choice of appropriate materials for energy absorption. In
many climates, ambient temperature varies in a daily pattern with maxima during the middle of the afternoon and minima overnight in the
125.
108 Natural DisastersMinimum surface area faces the sun
Fig. 5.16
City Hall London.
(Source: World Architecture
July/August 2002) Architect: Foster
and Partners; Structural, Services and
Acoustic engineers: ARUP. The
building uses glass extensively as a
design statement to express
accessibility and transparency. At the
same time, it is environmentally
efficient combining energy saving
measures such as judicious
orientation and shape to reduce
energy consumption.
Self shading
south elevation
Maximum
sunlight
Natural perimeter
ventilation
Chamber due north
to maximize transparency
Fresh air
Heat exchanger
Greywater
tank
Thermal
store
Bore hole
cooling
early morning. Maximum solar input also occurs during the middle
of the day. By choosing suitable building materials with appropriate
‘thermal mass’ (the accepted term for the overall effect of the amount of
material combined with its thermal capacity), heat can be stored and
temperature fluctuations reduced, with the result of more acceptable
thermal conditions.
Recent innovations include the promotion of cold storage in which building materials are pre-cooled overnight so as to be able to absorb and counteract some of the next day’s overheating. A Scandinavian system, known
as Termodeck, involves using an interconnected network of tubes running
through floor slabs. Cool air can be circulated at night to pre-cool the floor
slabs. Water, which has a high thermal capacity, may also be used to
absorb heat. Another interesting possibility involves the use of phasechange materials. When water changes from a solid (ice) to its liquid form,
it absorbs a large amount of heat without changing its temperature.
When adopting climate-sensitive design modern designers follow the
same principles used in the historic vernacular architecture of many
areas of the world. A number of scientific studies have confirmed that
traditional design was often extremely well suited to the specifics of its
local climate and the general trend is to revert to the traditional concepts,
which in the past were abandoned in favour of fast and cheap ‘modern’
building. (See Fig. 5.17a and b.)
Bioclimatic design
An analysis technique that considers thermal comfort zones in terms of
air temperature and moisture content (humidity), from which alternative
126.
Weather conditions 109(a)
Fig. 5.17
Traditional hot dry house.
(a) day-time heat absorbtion;
(b) night-time cooling effect.
(b)
solutions can be devised, includes:
1. use of increased thermal insulation levels in the building fabric;
2. increase of effective thermal mass arising from choice and location of
construction elements and materials;
3. increased natural ventilation and associated heat transfer encouraged
by building openings;
4. increased night-time ventilation (when external temperatures are
likely to be at their lowest) to promote cooling;
5. use of evaporative cooling on building surfaces or at openings;
6. use of radiative cooling from building surfaces.
Solar design
Whether the priority is to encourage or exclude solar radiation from
affecting a building, design should consider a number of parameters in
relation to the site; for example:
1. the sun’s position relative to the building (solar altitude and azimuth);
2. site orientation and slope;
3. existing obstructions on the site;
127.
110 Natural Disasters4. potential for overshadowing from obstructions outside the site
boundary;
5. grouping and orientation of buildings;
6. road layout and services distribution;
7. proposed glazing types and areas, and facade design;
8. nature of internal spaces into which solar radiation penetrates.
Effect of extreme temperatures on buildings
Cold
Extreme cold does not affect buildings in isolation, but only in conjunction with moisture through the process of freezing. The resulting expansion of ice when the temperature drops and the subsequent thaw when it
rises subject buildings to movements that sometimes are sudden and
excessive, thus causing structural or morphological failure. The common
effects of low temperatures are
• Frost heave – an expansion causing the sub-soil to move and affect
foundations that are not deep enough. This is often the case when
buildings are constructed on fine sand, silt, or clay soil where the
water table is close to the ground level. When the ground below the
floor slabs lifts and expands sideways it causes tilting and horizontal
cracks in walls.
• Damage to porous building materials such as brick or stone, especially when saturated with water. Ice forms in the pores and when
these are not able to expand, either due to rigidity or hydrophilic characteristics, they ‘cleave’, crumble, and disintegrate (see Fig. 5.18).
• Snow – whilst providing good insulation it can also cause structural
failure through its weight if inadequate loads have been allowed in this
respect.
• Melting snow on an inappropriate roof slope can degenerate into
avalanche-like descents damaging structures below or cause flooding
through blockages and overflows. Some of these aspects are further
examined in Section D.d. Simple precautions such as snow boards,
duckboards, and regular maintenance are cost-effective prevention
measures.
Heat
A building undergoes a constant heat exchange process with the outdoor
environment. This can take place in a number of ways:
• inwards or outwards by conduction;
• heat gain from solar radiation, or the internal output of appliances,
human bodies, lamps, etc.;
• movement of hot and cold air, that is, ventilation;
• mechanical control of temperature (heating or cooling);
• evaporation of water, either externally such as pooling rainwater on
the roof, or internally from human sweat, baths, drying laundry, etc.,
which can have a cooling effect.
128.
Weather conditions 111Stone masonry affected by frost.
29 6:56
Fig. 5.18
The effect of alternating extreme heat from direct solar radiation by day
and the cooling convection at night subjects buildings to a cycle of
expansion and contraction, known as thermal movement.
The way in which building materials heat up is subject to a number of
factors such as their colour (light colours absorb less heat), absorbency,
surface treatment, thermal expansion coefficient, etc.
Building materials respond differently to thermal movement, depending
on their capacity for dimensional change, rigidity, plasticity, structural
restraint, and variations in moisture contents. For example, the increase
in length of a 30-m element will be 20 mm for aluminium, 58 mm for
wood across the grain, but only 3.36 mm for limestone or 6.7 mm for
brickwork. Thermal movement can affect:
1. An existing building element such as a roof or a wall. Unrestricted it
will expand freely, but if restricted or longer than 30 m the element
will be stressed by the constraint. Walls will develop longitudinal and
diagonal cracks (see Fig. 5.19a–c). It is, therefore, important in
129.
112 Natural DisastersMax 30 m
Cracks
Expansion joints
Expansion joint
Diagonal cracks
(a) Cracking when wall panels are pinned
to roof slab and movement is restricted
Expansion
joints
Effect
without
expansion
joints
Expansion
joints
a – Sliding joints
b – Split mullions
between members
c – Split mullions
and transoms
(b) Curtain walling
To prevent the accumulation of
thermal movement in mullions, each
section is jointed to the next so as to allow
independent movement
Sliding
joints
Expansion
joints
(c) Expansion joints are necessary to
cope with thermal movements
Fig. 5.19
Thermal movement: (a) building structure; (b) curtain walling; (c) expansion joints.
conditions of substantial seasonal variation (which even in Britain
can be as high as 50⬚C) to incorporate suitable provisions, such as
expansion joints to facilitate unimpeded movement of the structural
elements.
2. An entire structure is also subject to movement and the length and
shape of the building play a major role in ensuring that adequate provisions are available to permit the necessary expansion. The spacing and
width of the joints depend on the materials and temperatures involved,
and their location is determined by the size and shape of the building.
General design considerations with respect of the effects of extreme
temperature variations have been mentioned in Section D.c. As an extensive specialist subject, the design of buildings in hot climates could not
be considered in depth here, but looking at the general principles of a
typical house design for a hot and dry climate will give an idea of the
main aspects involved:
1. Objective: to provide reasonable comfort and protection from the
intense heat radiation coming from the sun, ground, and surrounding
buildings during the day. This can be achieved by maintaining inner
surface temperatures lower than the skin.
130.
Weather conditions 1132. Form and planning: because of the hostile outdoors an essentially
inward looking building is the most suitable. Surfaces directly exposed
to the sun should be reduced to a minimum, and if possible the building
should have a north/south orientation. West is to be avoided. Siting
buildings close together will decrease heat gain thanks to mutual shading, which is why traditional settlements tend to have closely grouped
buildings, narrow streets, colonnades, and small enclosed courtyards.
3. Internal courtyards can be used as thermal regulators and are the best
external places, as they provide shade during the day and cooler surface earth that draws the heat during the night (see Fig. 5.17a and b).
4. Adjustable openings – small during the day and large during the night
with heavy shutters or other type of screening, to regulate intake of
hot and cool air.
5. Use of the thermal capacity of structural elements, especially roofs to
enable the storage of day heat and its dissipation during the night.
6. Suitable surface treatments can help reduce the heat load. The
absorbency and emittance of heat values of materials differ when
receiving heat from solar radiation and this is a major consideration
when selecting roof-surfacing materials. Traditional shelter in desert
regions tends to use earth, brick, or stone painted white.
7. Ventilation and airflow must be designed to minimize the entry of hot
air during the day and maximize the intake of cool night air. Whilst
ventilation will not reduce the radiant heat transfer, it will help reduce
radiant heat emission by lowering the temperature of the inner face
of the outer envelope. Adequate ventilation of the roof space also
helps and careful location and orientation of the openings is vital.
Case study – Anchorage Performing Arts Center roof repair
(Contributor: Jon Kumin)
Introduction
Anchorage Alaska is located at latitude 60⬚N, a sub-arctic zone.
(see Fig. 5.20). Although the weather is moderated by the nearby Gulf
of Alaska, winters are long and by some standards quite cold. Extreme
lows experienced in Anchorage approach ⫺40⬚C, although this is
unusual. Warmer periods with extensive snowfall are often followed by
extended spells of clear, dry weather that can average ⫺20⬚C for weeks
at a time. Snow usually falls in significant quantities by mid-October
and 5 months or more of snow cover is common. Although Anchorage
does not experience the extreme arctic temperatures that embrittle common steels or congeal motor oil, this is a challenging climate for roofs.
Experience has shown that design approaches that work in regions at
lower latitudes often do not work in Anchorage. This is true even for
assemblies that have been proven in climates that for brief periods experience low temperatures that are similar to Anchorage. The extended
duration of the winter severely tests a roof.
Selection of a roofing assembly is a complex balancing of issues.
Typically, all roofs should have sufficient capacity to support the full
131.
114 Natural Disastersgik
na
ge
Al
e
ag
or
ch
An
Fig. 5.20 Map of Alaska.
weight of the maximum expected snow load, which is 195 kg/m2 in
Anchorage. This is moderate – other communities in Alaska experience
snow loads up to 600 kg/m2. The snow can wind drift and slide to form
extraordinary concentrations, and that is a key part of the difficulties
faced by the roof considered in this example. Roofs should also be
weather-tight, and if visible present an attractive appearance.
This discussion is offered as a cautionary tale of what can go wrong, and
as an instructive one describing a successful repair.
Background
The Anchorage Performing Arts Centre (PAC) is a major public building,
with construction completed in 1988. It encompasses about 16600m2 and
has three theatres, the largest seating over 2000 people. The handsome
steel and concrete framed structure has pitched roofs over major areas.
The roof experienced difficulties virtually from the outset. There were several major issues – snow sliding, moisture build-up, and leaks.
Initial construction
The facility is covered with a mixture of steeply pitched and low slope –
almost flat – roofs. This article focuses on the pitched roof areas. The
132.
Weather conditions 115structure is typically steel framed, with a corrugated metal deck. Over
the theatres concrete fill was used on the steel deck for acoustic isolation. About 75 mm (minimum thickness) of concrete was placed on
the 75-mm deep corrugated metal deck. Cold-formed light gauge galvanized steel purlins about 100-mm deep were fastened to the concrete,
spaced about 1220 mm apart. Rigid phenolic foam insulation was
placed between the purlins. This was covered by 19-mm thick plywood,
treated with fire-retardant chemicals. The plywood was covered with
stamped stainless steel shingles. The shingles formed a surface with
little vertical relief, so that the seams between each shingle were close
to the plane of the roof where runoff water flowed.
Over less acoustically sensitive areas, the concrete was not used. The
corrugated metal deck has an initial layer of 13-mm gypsum board to
create a level substrate. This was covered with Kraft paper. In these
areas, 200-mm deep purlins were used, with the bottom 100 mm
filled with fibreglass insulation and the top 100 mm again filled with
phenolic foam. As with the other areas, a layer of 19-mm-thick fireretardant plywood was screwed to the purlins, topped with the stamped
stainless steel shingles. Slopes vary, typically running from 26.5 to 33.8⬚.
The shingles were thin in profile with minimal overlap and had no
underlying building paper or roofing felt.
Issues to resolve
There were three major problems areas – snow sliding, water intrusion
(leaking) into the building, and moisture build-up within the roof assembly. They are interrelated as discussed below. A number of ancillary
issues were also addressed, such as leaks at the low slope roof areas and
intermediate gutters. This narrative focuses on the major issues.
As the pitched roof eaves are high above a busy downtown sidewalk, snow
sliding was a concern from the inception. The original design used a series
of large snow fences to block the sliding action. This was successful in
keeping avalanches from injuring pedestrians; however, large quantities of
snow would stack up against these fences, stressing the flashings.
A common cause of leaks in a snow country is water backed up by the
formation of ice dams. These can be created by many factors. They are
most common at the edge of poorly insulated roofs, where melt water
encounters the cooler exposed edge and freezes. The piles of snow at the
snow fences grew ice dams. The low-profile shingles had minimal
resistance to water backing under them, causing leaks.
Moisture attacked this roof from both directions, not just from above.
The building is humidified to about 45% relative humidity. As cold air
holds little moisture, this creates a strong vapour pressure drive from the
interior to the exterior. Water vapour pressure flow follows Pascal’s ‘law
of partial pressure’. The cold exterior air holds little moisture, with consequently a much lower vapour pressure. The vapour is forced toward
the exterior, cooling as it moves from the interior warmth towards the
133.
116 Natural Disastersexterior. Once it cools to the dew point, it condenses into liquid water.
This water can damage a roof assembly in a number of ways, such as
fostering wood rot or corrosion of metals.
The standard response to this issue is a vapour-retarding membrane of
some type, placed on the warmer side of the insulation. In this case, the
vapour barrier selected was an emulsion of asphalt brushed on the concrete, and Kraft paper in the areas without concrete. These proved inadequate barriers, allowing water vapour to penetrate into the insulation. As
it moved towards the outside, it cooled and condensed into liquid water.
This water combined with the water leaking from the outside to create a
problem ultimately much worse than a simple leak. Phenolic foam insulation when wet produces a corrosive acid. The acid ate away the steel
purlins, to the point where they crumbled at touch. This left the entire
assembly vulnerable to blow-off in a strong wind.
Resolution
Although repair funds were limited, it was determined that partial
measures would not do. A complete repair was instituted for the portion
of the roof that could be afforded. This initial effort was completed in
1999; the remaining portion of the roof will be repaired as funds become
available. Every component of the roof was replaced from the deck up.
Typically, different materials were chosen to resolve specific issues.
A key change was elimination of the snow fences, replacing them with
a grid of square stainless steel tubes, placed perpendicular to the ribs of
the new standing seam roof.
The original roof assembly was removed down to the concrete. A 0.25mm-thick polyethylene vapour barrier was placed directly on the concrete. This has far more resistance to the passage of water vapour than
the original asphalt emulsion. New galvanized steel purlins, 200-mm
deep, were placed next, and secured at 610 mm intervals. Rigid
expanded polystyrene foam, 200-mm thick was placed between the
purlins. This material does not support development of a corrosive product, even when wet. This was covered with 19-mm-thick plywood, modified bitumen waterproofing membrane, and a new concealed fastener
stainless steel standing seam roof. The waterproofing membrane acts as
an additional layer of protection under the exposed metal roof. The
standing seam material has 50-mm high ribs, and is therefore much less
susceptible to water intrusion than the shingles. The panels are continuous
from ridge to eave, and the lateral seams are raised 50 mm out of the
plane of the water runoff surface. A transverse section below portrays
the new assembly (see Fig. 5.21).
The 19-mm square tubes were placed on the ribs at 610 mm centres, over
the entire roof. These act as snow guards, anchoring the snow to the roof.
The attachment is by a clamp mechanism at the top of the ribs, so that
there are no penetrations of the exterior surface.
134.
Weather conditions 11719 mm2 Stainless steel tubes
at 610 mm spacing
50 mm high ribs
Rubberized bituminous membrane
19 mm Plywood
Four layers of 50-mm thick foam insulation
200 mm Steel purlins
Fig. 5.21
Anchorage Art Centre, section
through roof. © John Kumin.
New vapour barrier membrane
Existing concrete deck
Section through new roof assembly
Fig. 5.22
Anchorage Art Centre, view of roof
under snow. © John Kumin.
Lessons learned
After three winter seasons, the repaired roof is performing well. No
slides have been observed. It is instructive to compare the appearance of
the repaired versus the original roof immediately after a snowfall. The
photograph (see Fig. 5.22) was taken 24 h after a major snowfall (725
mm fell in a 24-h period). The portion on the left shows the new roof;
the portion on the right is the original assembly. Note how the snow has
slid down to the snow fences on the portion of the sloped roof not yet
replaced. The areas with the new system show a uniform coverage, with
the snow load distributed over the entire surface. Snow fences to avoid
danger to pedestrians are unnecessary. There have been no signs of leaks
or moisture build-up. Based on this performance, the intent is to complete the repairs as presently designed.
The lessons for future construction are evident. Moisture transport
mechanisms must be understood. A competent vapour barrier on the
warmer side of the insulation must be in place. Roofing materials in a
snow country should be detailed to keep vulnerable seams out of the
water drainage plane. Snow sliding on steeply pitched roofs must be
considered. It is most useful to contemplate roof assemblies as systems,
not isolated components. Each key element – underlying structural support, vapour barrier, insulation, and exposed roof – covering must be
considered as part of an integrated whole.
135.
118 Natural DisastersFig. 5.23
Algenak, Alaska – gymnasium roof
collapsed under snow weight.
© John Kumin.
The effects of snow weight can be dramatic as the unfortunate experience of an Alaskan school gymnasium whose roof collapsed under the
snow load can illustrate (see Fig. 5.23).
New materials
The advance of science and technology has brought a new generation of
materials that allow man to adapt to living in extreme temperature conditions and that can provide inspiration for building designers with their
high performing insulation and flexibility characteristics.
Some examples from the NASA (National Aeronautics and Space
Administration) innovation web site (http://nctn.hq.nasa.gov/innovation/
Innovation51/insulatn.htm) are given below:
Layered composite insulation
NASA has developed layered composite insulation (LCI) technology for
use in commercial applications. Designed by the Cryogenics Test
Laboratory at the John F. Kennedy Space Centre (KSC) in Florida, this
system can benefit multiple industries that depend on regulation of low
temperatures in equipment and products.
The synergistic effect of improvements in materials, design, and manufacture of this new insulation technology exceeds current multi-layered
insulation (MLI) or foam insulation products such as companies that
transfer fluids (liquefied natural gas, refrigerants, chilled water, crude
oil, low-pressure steam) or transport companies that move refrigerated
containers by land and sea and need to protect food, medicine, and other
perishable commodities. Similarly, it can have an application in the construction industry for buildings in areas of extreme temperatures.
The technology
The technology combines a unique layered cryogenic insulation system
with specific manufacturing, packaging, wrapping, and rolling methods.
One of the unique features of the LCI is its superior thermal performance:
approximate R-values per inch for cryogenic conditions are R-1600 for
136.
Weather conditions 119high vacuum, R-90 for soft vacuum (about 1torr), and R-10 for no vacuum. This new LCI system surpasses the current limitations of current
MLI systems and the insulation can currently be continuously rolled or
manufactured in blanket, sheet, or sleeve form. This technology is part of
the NASA Technology Transfer Program, which seeks to stimulate development of commercial applications from NASA-developed technology.
Milk bottle blankets ‘better than wool’
Rescue blankets made of recycled plastic milk bottles are a new spin-off
from NASA’s research into the development of lightweight metal insulation for spacecraft. Using the same ‘honeycomb’ concept that will be used
to make future spacecraft metal heat barriers, researchers working with
scientists at NASA Ames Research Centre have created a lightweight plastic insulation for blankets and clothing that is ‘better than wool’. Like
wool, the new material can also keep a person warm, even when it is wet.
Eventually, about 70 000 emergency blankets are expected to be distributed annually by Thermalon Industries, Ltd., El Segundo, California.
Currently, 250 blankets are being evaluated for use in emergencies by
the Disaster Assistance and Rescue Team at Ames Research Centre. The
blankets are reported to be better than wool or fleece because they are
non-allergenic, and they dry five times faster. The new material is also
four times warmer than wool in cold and damp conditions, and more
efficient than fibres for insulation. The honeycomb is made from metals
for high-temperature usage, and the plastic insulation can be made even
from recycled milk bottles.
Space program insulation down to Earth
Space age insulation derived from NASA materials is finding a myriad
of new applications right here on Earth.
Energy Q Radiant Barrier is the commercial name for the material,
manufactured and marketed by Tech 2000 LLC of Roswell. NASA has
used highly effective radiation barriers made of aluminized polymer film
since the days of the Apollo missions. The insulation ensured constant,
comfortable temperatures inside the command modules and permitted
the astronauts to work in their shirtsleeves. The material has been used
to protect the inner workings of satellites and a number of unmanned
spacecraft, and it protects the Space Shuttles’ computers. The doublesided material, made of 99% pure aluminium with a fire-resistant
polypropylene insert, reflects 97% of the heat that strikes it.
Energy Q uses reflective technology to reduce energy consumption and is
key for homes, offices, industrial plants and farm buildings. Energy Q is
being used in protective clothing, sleeping bags, and emergency care
thermal blankets. Researchers are investigating the use of Energy Q to line
bridges and golf courses and to wrap water pipes for sprinklers and irrigation systems. Food storage systems from picnic coolers to pizza delivery bags to refrigerated vans and railroad cars are lined with the material.
137.
120 Natural DisastersInsulation technology
NASA Langley Research Centre has been promoting the commercialization of its line of innovative insulation technologies, which were
developed with a number of manufacturing companies. The low-density
foam can be processed into neat or syntactic foams, foam-filled honeycomb or other shapes, and microspheres.
The process for this foam begins with a monomeric solution with salt-like
properties, which yields a homogeneous polyamide precursor solid
residuum. It is this resulting precursor that can be processed into the foams
and shapes that produce useful articles through normal foaming techniques. NASA/Unitika’s process can produce foam and microsphere
materials by reacting a derivative of a dianhydride (e.g. ODPA, BTDA,
PMDA) with a diamine (e.g. ODA, PDA, DDS). An admixture of two or
more polyamides can be combined or used separately to make a variety of
polyamide foams with varying properties. These products can be used in
a variety of ways: flame retardant and fire protection, thermal insulation,
acoustic insulation, weight reduction, gaskets and seals, vibration damping pads, spacers in adhesives and sealant, extenders, etc.
The NASA polyamide foam technologies resist fire, are non-toxic and
non-fuming, and have low smoke emissions. They also offer several
thermal performance benefits: low thermal conductivity from cryogenic
to elevated temperatures, low coefficient of thermal expansion, and high
glass transition temperature. Mechanically, they are highly resilient (i.e.
low friability) and offer high compressive strength. Finally, these technologies resist chemicals, solvents, and hot water, and they have a low
dielectric constant. These products offer excellent thermal and acoustic
insulation but their long-term effectiveness can only be proven in time.
Mass movement
What is mass movement and how it occurs
Mass movement can be defined as the large-scale down slope movement
of rock, earth, debris, etc. (the mass) accompanied by a moving agent
such as water from rivers, floods, glaciers, wind, etc.
This movement process is influenced by factors such as:
• gravity – acting proportionately to the weight of the moving material
and the gradient of the site;
• slope angle;
• pressure from the moving agent, which can saturate or force apart
particles increasing their weight and movement.
The movement eventually causes the failure of the slope.
This takes place through alterations of the shear stress, which can
• Increase, resulting in strong forces pulling the mass down the slope.
This can be due to many factors, such as
– a lack of friction, proportionate with the steepness of the slope;
– lack of cohesive strength resulting in reduced binding and liquefaction;
138.
Weather conditions 121– vegetation trapping moisture;
– large volume of water.
• Decrease, resulting in slope failure. Causes can be
– weathering and water contents and table variations;
– alterations to the slope (steepening, undercutting, etc.);
– dumping of waste such as mine waste;
– vibration shock such as an earthquake.
Types of mass movement and slope failure
Mass movement and slope failure can be classified according to the
following considerations:
• the speed of the mass movement;
• the water content of the mass;
• the type of the movement.
These manifest themselves in different ways with different effects.
Speed of movement
Slow
Soil creep: a very slow continuous movement that is a result of repeated
alternation of contraction and expansion (wet and dry or freeze and thaw).
Its manifestations include large cracks in sloping roads, tilting of trees,
telegraph poles, or tombstones and bulging walls due to soil pressure.
Solifluction: slightly faster activity, usually in periglacial conditions
where surface water from melting cannot drain.
Fast
Landslide: a rapid movement occurring when an entire volume ruptures
and slides along a straight, flat plane, retaining its shape and structure
until it reaches the bottom of the slope. Weather events, earthquakes or
volcanic eruptions often trigger landslides.
The world’s two largest landslides of the twentieth century occurred at
Mount St Helens, Washington, in 1980 where rock and mud broke free
releasing pressure and a major eruption followed and at Usoy Tajikistan
in 1911, which was triggered by an earthquake. The landslide moved a
huge amount of material creating a dam some 1880 ft high on the
Murgob River. Fortunately, casualties were low due to evacuation action
at St Helen’s and the relatively unpopulated area at Usoy.
The deadliest landslide, causing some 50 000 deaths, happened in 1990
in western Iran and was caused by an earthquake.
Weather-related landslides have become increasingly deadly in recent
years. In Venezuela, some 30 000 deaths have been attributed to a landslide; whilst in 1998, Hurricane Mitch caused the side of Casito Volcano
to collapse, creating a landslide that wiped out two towns in Nicaragua
killing over 2000 people.
139.
122 Natural DisastersIn 1983, El Nino caused a landslide that led to the flooding of Thistle, a
Utaha town, creating the costliest landslide known in US history, with
losses estimated at $400 million at that time.
Far removed from this large-scale tragedy, but no less relevant, are
smaller landslides that can be just as destructive if not observed in time.
One such example is described below.
Case study – The Dalles Middle School (Contributors: Anne
Deutsch, Josh Glavin, and Assoc Prof Christine Theodoropoulos,
University of Oregon)
Summary. The Dalles Middle School, a public school for students aged
11–13, in the northwest of the United States, illustrates the importance
of siting buildings to avoid unstable soil conditions. The original school
buildings were constructed on a portion of the site subject to landslides.
Damage to the school buildings occurred over a period of several years.
A proposed project to rebuild in 1999 was delayed in favour of mitigating the problem by stabilizing the landslide area. The school was finally
demolished in 2001, and a new school building, now under construction,
has been relocated to a more stable area of the same property.
Fig. 5.24
Dalle School – wall ceiling junction.
© Anne Deutsch, Josh Glavin, and
Christine Theodopoulos.
Site conditions. The Dalles is a small Oregon town located approximately
30 miles Northeast of Mount Hood, in the northern portion of the Dalles
Basin, in the Columbia River Gorge. It is part of the Colombian River
Plateau Physiographic Province in which the bedrock units have been folded
by primarily southwest to northwest trending synclines and anticlines and
north and northwest intersect the structural folds to southeast trending faults.
The site is located at 280-ft elevation, about 200 ft above the Columbia
River and slopes from the south to the north, with a drop in elevation of
80 ft. Originally, the site contained four existing buildings and four temporary classroom structures, with asphalt paved parking and play area in
the northern portion of the site. The remaining space consisted of grass
playing fields, sidewalks, landscaped areas, and a baseball field at the
southernmost point.
Fig. 5.25
Dalles school – infill panel/column
detail. © Anne Deutsch, Josh Glavin,
and Christine Theodopoulos.
The school property is mapped as landslide topography and is located on
the toe of an active landslide. The landslide area is described as a combination of a deep bedrock translational slide and a rotational slump. A hazard study for the city of The Dalles indicated that the site is located in
hazard zone B, a low to mid-risk to development based on landslide hazards and soil stability. Based on borings and test pit excavations, a near
surface groundwater zone was observed at the project site between 5 and
10ft below the ground surface. Groundwater was encountered at depths
from 2.5 to 12ft and flow varied from slight to moderate, with severe
caving occurring where flow was moderate. Initially, the school district
drilled down to the location of the water in an attempt to release the
pressure that was causing the ground movement, and installed pumps to
140.
Weather conditions 123discharge the water out to the Columbia River. Unfortunately, the ground
continued to move and the buildings began to slide with it, down the slope.
Damage to buildings. The most recent land movement in 1991 caused
extensive damage to the existing buildings on the site, forcing the school district to make the decision to vacate the premises and begin plans for a either
a new building after stabilizing the soil or to find another site on which to
build. Some of the damage to the buildings included exterior walls separating from the structural elements, and the sliding of the foundation causing
the base of the exterior walls to move away from the floor slab, both of
which required temporary bracing of the structure (see Figs 5.24–5.27).
Fig. 5.26
Dalles school – partition wall detail.
© Anne Deutsch, Josh Glavin, and
Christine Theodopoulos.
School replacement considerations. Recent damage to three of the existing
buildings resulted from ground movement associated with the Kelly
Avenue Landslide. Immediate action was taken to analyse the site’s
stability, and propose a solution to reuse the site for a new middle school
building. AMEC Earth and Environmental, Inc., were asked to conduct
a geo-technical evaluation of the site and BOORA Architects were
appointed to design a new school building. The solution provided by the
geo-technical engineers, included cutting a key trench through the alluvium, ash and silt stone to the top of the weathered basalt to the north of
the landslide location. The trench was then filled with basalt and covered
with gravel fill and topsoil. The new school is restricted to the northern
portion of the site to increase the safety factor against the building being
affected by further possible land movement.
Slump: a rapid, rotational movement along a curved slide plane, usually
occurring where weaker material such as clay overlies stronger layers such
as limestone. This type of mass movement often happens along coastlines
weakened by erosion and is facilitated by water action, which reduces
friction thus helping flow. Such a situation was created along the North
Yorkshire coast, south of Scarborough in the case of the Holbeck Hall Hotel.
Case study – Holbeck Hotel
On 5 June 1993, the north-east wing of the four-star Holbeck Hall
Hotel, containing the lobby and several bedrooms, collapsed into
Scarborough’s South Bay, leaving the other half behind (see Fig. 5.28).
Fig. 5.27
Dalles school – slippage of exterior
wall marked on external tap. © Anne
Deutsch, Josh Glavin, and Christine
Theodopoulos.
The area had a history of cliff movements: local records mention the
spa being carried away by a landslide in 1770 and the Holbeck cliffs
suffering a major slip in 1912. The East Yorkshire coast’s steep clay
cliffs has always been considered by geologists as vulnerable and the
40 miles of Holderness cliffs are probably the fastest eroding European
coastline. The average rate of erosion was reported to be between 6 and
65 ft (Holderness Council).
Opinions have been divided as to the extent to which the sea erosion was
the main factor causing the slump, considering the existence of a protective
sea wall at the base of the cliff. Many have considered that the main
141.
124 Natural DisastersFig. 5.28
Holbeck Hotel. © Yorkshire Press.
problem had been caused by the heavy rain that spring, which happened
after several dry summers and which penetrated layers of sand and
gravel in the cliffs.
This lubricated the clay, which had cracked in the dry weather; the saturated clay becoming unstable slumped along a curved plane. The only
course of action left was to allow the slip to stabilize itself. Geologists
estimated that this would happen when it reached 25⬚.
The engineers are considering a number of solutions to be undertaken
once the movement has stopped: improving the drainage of the boulder
clay, weighting the front end, and examining cliff stabilization schemes.
Water content
Wet (of fluid) movements
Flows: more continuous than slumps, they tend to redistribute the mass
into a new form. Water-saturated particles lose cohesion and consequently flow.
They can take the form of mudflows, which occur on relatively bare,
steep slopes, during heavy rain fall, or earthflows, which are more solid
and slower and as such tend to be less catastrophic.
A well known tragic example of the deadly destruction mudflows can
cause was the case of the village of Aberfan, South Wales, UK, where
in October 1966 an estimated 100 000 m3 of spoil and water engulfed
a primary school and 20 houses, killing 147 people, 116 of whom were
primary school children. The problem was created by the existence of
large amounts of spoil from the Merthyr Vale Colliery, stored 200 m
above the village, on 25⬚ slopes, and unwittingly located in a line of
springs. When heavy rain combined with the water from the springs
increased the weight of the spoil the catastrophe followed.
142.
Weather conditions 125Dry movements or rock falls
These occur on slopes steeper than 40⬚. The process is started by
the loosening of rocks due to weather variations such as frost, erosion,
weak lines, wild fires, etc. When rocks start falling, gravity adds speed
and momentum and they free fall or bounce at the bottom forming a
‘scree’.
Type of movement
Expansive move
Heave: an expansion of the soil, which can occur as a result of:
– plastic failure of the soil under excessive load (see Fig. 5.29);
– frost action;
– swelling of clay saturated with moisture.
Receding move
Subsidence: the downward movement of soil, which can occur due to:
– ground movement;
– excessive loading;
– differential loading;
– soil recovery under variations of moisture.
Common causes
The common causes of subsidence are
1. Variation in the moisture content of the sub-soil. The nature and
properties of soil determine the degree of settlement for the structure
that it supports. Fine-grained cohesive soils such as clay will change
considerably in volume with moisture content variations, which can
occur due to weather conditions or the effects of tree roots.
Shrinkable clays, like those in the southeast of England are most susceptible to these changes. They shrink when they dry and swell, or
heave when wet. Both actions can cause considerable damage to the
buildings supported by the soil in question. Normal seasonal variations affect depths of up to 1 m, but during times of long droughts,
such as the one in 1976, the effect goes considerably deeper, and
Heave of surface
Fig. 5.29
Heave effect.
Slip plane
143.
126 Natural Disasters2.
3.
4.
5.
foundation design must ensure that these go to a sufficient depth to
overcome this type of problem.
Tree roots extend in a circle with a radius equal to its height, sometimes
more, and they extract water from the soil to considerable depths, drying out clay soil below any nearby building. Conversely, when the tree
dies or is cut, the ground will re-absorb moisture and swell.
Settlement of old mine works. These may be quite a distance away
from where the damage occurs. As often it is difficult to find records
of their exact layout, specialist professional advice is required to
ensure safety of buildings existing or knew.
Long term consolidation of fill.
Modification in the nature of lower soil layers. When watertable levels change, previously stable layers become biodegradable or dry out,
and in both cases shrink. This causes the buildings supported by the
soil to settle and crack. Sub-soils can also be damaged or ‘softened’
by water flowing through them from springs, leaking pipes, or drains.
Instability of uneven ground. This can often be the case with sloping
ground such as coastal cliffs, which become unstable and begin to
slip, or even collapse. Man-made excavations creating great differences in ground levels can also have the same effect (see Figs 5.30
and 5.31).
Type of damage
The most common is structural damage: cracks and distortions in the
general fabric of the building (see Figs 5.32 and 5.33). These require
assessment by a specialist professional to establish whether the main
load bearing elements have been affected and provide recovery and consolidation solutions.
Fig. 5.30
Effect of trees on ground near
buildings.
144.
Weather conditions 127Fig. 5.31
Instability of uneven ground
effect on buildings.
Fig. 5.32
Typical structural damage due to
ground effects.
Subsidence is unlikely to cause instability suddenly. Cracks should be
monitored and sub-soil analysed to establish its nature.
Initial signs that a building may be subjected to ground movement can be:
– doors or windows begin to stick even after being planed off and
adjusted;
– wall paper begins to crease and ripple in places where it was smooth
before;
– new cracks appear inside and outside, generally in one part of the
building: corner, bay window, recent annex;
145.
128 Natural DisastersFig. 5.33
Example of settlement crack.
– old cracks become wider;
– external brickwork may show fresh cracks;
– drains leak or do not work properly, gullies take longer to drain.
Preventing further damage
This can be achieved by dealing with the individual causes for the
excessive movement:
– Repair leaking pipes.
– Tree control. It is advisable to manage vegetation in a way that will
not allow significant fluctuations of moisture.
– Consolidation of foundations by underpinning, piling, or raft foundation.
– Design parameters selected to ensure that foundations extend deep
enough to avoid the layer that could be affected by seasonal moisture.
– Soil moisture management – specialist process ensuring that the moisture content of a given soil is kept at an acceptable level regardless of
external variations by re-hydration and tree control.
146.
Part IIMan-made Disasters
147.
This Page Intentionally Left Blank148.
6Conflict
The Oxford Dictionary defines conflict as: a fight, struggle (both literally and figuratively), a clashing of opposed principles. Each individual
has a unique viewpoint, understanding and experience of life. This
human nature creates diversity, which can lead to disagreements and
conflict within the context of social relationships.
Types of conflict
There are many types of conflict, each with complex implications and
ways of expression. In broad terms, conflicts can be defined by the
nature of their issues and by the methods employed to resolve the
difference of opinion.
Conflict issues types
For example:
• Religious – initiated by opposing principles about values central to
human existence. Religious beliefs sometimes become identified with
tradition, or blurred by superstition. Theological issues have often
been used as means of social control.
• Sociopolitical – initiated by different social expressions of economic
and power struggles.
• Ethnic – stemming from racial prejudice and often relates to previously unresolved conflicts and is fuelled by economic factors.
• Economic – brought on by the increasing number of poor people and
poverty-related crises.
When extremes are emphasized in each type of disagreement, the effect
is of further polarizing the dispute, which can degenerate into aggression.
Methods of resolving conflict issues
These can be:
• Peaceful coercion.
• Authoritarian socioeconomic control – those dissenting are kept under
strict control, like in the Eastern Block, ‘police states’, or by way of
trade restrictions.
149.
132 Man-made Disasters• Segregation – on the basis of race, religion, or ethnic origin creating
ghettoes.
• Use of force – as in the case of social unrest, military coup, revolutions, etc.
• Armed conflict – the use of armed military force between governments, or organized armed groups, resulting in battle-related deaths.
• Terrorism – the worst use of force aimed specifically at killing
innocent people.
In most instances, buildings are involved in the evolution of each conflict. From places of worship, to temporary shelters, they reflect the situation or can be caught between conflicting sides becoming targets for
destruction. Governments and interstate organizations are attempting to
find solutions and create infrastructures to cope with the effects. An
example of the extent and complexity of the task can be seen from the
intricate organisational infrastructure set up to manage and aid reconstruction outlined below.
The European Agency for Reconstruction is responsible for the management of the main European Union (EU) assistance programmes in
the Federal Republic of Yugoslavia (the Republic of Serbia, Kossovo,
and the Republic of Montenegro) and the former Yugoslav Republic of
Macedonia (fYROM). It was established in February 2000 and has its
headquarters in Thessaloniki, and operational centres in Belgrade,
Pristina, Podgorica, and Skopje.
It is an independent agency of the EU, accountable to the European
Council and the European Parliament, and overseen by a Governing Board
composed of the European Commission and representatives from EU
Member States. Its 2001 assistance programme amounted to some €525
million, while the 2002 figure will be some €510 million. It now oversees
a total portfolio of some €1.6 billion across its four operational centres.
The agency’s three main objectives are:
(i) to carry out immediate physical and economic reconstruction (rehabilitation and repair of key infrastructure and public utilities, such
as energy, housing, water, transport);
(ii) to lay the foundation for the development of a market-oriented
economy and to foster private enterprise (support to enterprise
development, agriculture, health);
(iii) to support the establishment of democracy, human rights and the
rule of law (strengthening of local administration, NGOs, the media
and the judiciary).
The agency plays its part within a wider EU commitment to the Federal
Republic of Yugoslavia and the former Yugoslav Republic of
Macedonia. This, in turn, is part of the EU’s process of Stabilization and
150.
Conflict 133Association which is underway with five countries in southeastern
Europe, also including Croatia, Bosnia and Herzegovina, and Albania.
Other EU assistance includes macro-financial, humanitarian, democratization; customs and fiscal planning aid, as well as support for educational
exchange programmes. It also includes the bilateral contributions made
by EU Member States. The extent of the task can be illustrated by the
comparison of the before and after images of a simple house in Kosovo
(see Figs 6.1 and 6.2).
Fig. 6.1
Kossovo, war damage.
© European Agency for
Reconstruction.
Fig. 6.2
Kossovo, new house. © European
Agency for Reconstruction.
151.
134 Man-made DisastersEffect of conflict and terrorist attack on buildings
Whether in the context of social unrest, war, or terrorist attack, it is a sad
reality of modern life that destruction of buildings will occur. It is important to understand the nature of the damage in order to be able to protect
the occupants. Building professionals will be called to:
1. Assess the damage and making recommendations for reinstatement.
2. Incorporate damage limitation or prevention features in building
design and specification.
Types of damage
The following types of damage may occur in these situations:
1. damage caused by explosive devices (bombs) or sabotage;
2. fires;
3. damage to glazing caused by ballistic or missile attacks.
Explosions
By far the most common occurrence, explosions occur when a quantity
of gas or inflammable liquid undergoes a chemical reaction resulting in
high pressure gases, which with intense heat expand rapidly into the surrounding space that becomes pressurized and creates an ‘air shock wave’.
+
–
Fig. 6.3
Effect of explosion air shock
wave: positive /negative.
The effect of the air shock wave is to produce an immediate high pressure (the positive phase) followed by a rapid fall in pressure below
atmospheric (the negative phase) (see Fig. 6.3). The magnitude of the
various stages depends on the characteristics of the surrounding environment and the effects are greatly influenced by the ratio between the
positive phase and the natural vibration period of the structures involved.
The duration of impact being almost instantaneous, materials do not
have the time to react before the negative phase begins.
The damage created by explosions occurs as a result of the air pressure
and movement caused by the accumulation of gases which creates a
dynamic pressure known as ‘blast wind’. The dynamic pressure’s effect
is greater at the point of explosion and on nearby objects as under normal
circumstances it diminishes rapidly as it travels away from the source.
The pressure also compresses the ground resulting in a ‘ground shock
wave’, which has the effect of:
(a) radiant compression waves;
(b) shear wave at the point;
(c) surface (Raleigh) wave.
The ground wave diminishes in strength as it travels away from the
source, depending on the position of the structural elements relative to
the line of wave propagation.
152.
Conflict 135Effect of explosion on structural components and materials
The shock wave from an explosion will cause structures to deflect or
to be blown away depending on the extent of their rigidity, weight, degree
of fixing, and the characteristics of the pressure applied. Ductile materials
such as steel or plastic can withstand a great deal of pressure deflection,
brittle ones like plaster, light masonry, or lightly fixed items such as slates,
tiles, or suspended ceilings tend to disintegrate more easily, whilst timber
would split. Heavy elements will be less affected.
In addition a building’s type of structure, its condition, if defective, will
compound the effects of an explosion. Reinforced concrete and steelframed structures have been found able to withstand explosion effects
without collapse if connections are suitably designed. Similarly,
masonry buildings tend to suffer only localized damage.
Structural steel – if the design has allowed sufficient margin of size and
shape and if adequate continuity has been provided, only localized
distortions or misalignment would occur. Residual deflection may
affect the load-bearing capacity in which case localized repairs and
strengthening would be necessary.
Reinforced concrete – a certain amount of shrinkage and cracking happens under normal circumstances so it should not automatically be
assumed, if these are in evidence that they are due to the explosion.
Careful survey should reveal whether there is a case for replacement
or in situ repairs. Design of connections between beams and columns
can include preventive provisions (see Fig. 6.4a and b).
Brickwork and masonry – cracks and evidence of settlement should be
carefully examined to establish whether they are not due to different
response of materials or insignificant movement. Masonry is fairly tolerant of vibrations as can be seen in many industrial buildings and
unnecessary removal of walls may disturb the building’s new geometry
Column
Additional
links
Disintegrated
concrete
Original
reinforcement
bar
position
Fig. 6.4
Column beam connection
design detail. (a) Improved R.C. beam
Column Connection; (b) Common
detail showing failure mode.
Additional
links
(a)
Failed
reinforcement
(b)
Beam
153.
136 Man-made Disastersunnecessarily. Expert structural engineering trials and opening up
should be undertaken before deciding on consolidation or replacement.
Foundations and underground services – other than fractured drains, gas
or water supplies, it is not usual for serious damage to the sub-structure
and soil to occur from short-term vibration, unless the explosion
produces a localized damage.
Glass, cladding, and roof coverings – damage to windows and glazing
is the type of damage that affects a wide area around an explosion. The
blast can project deadly shards of glass in the immediate vicinity of the
explosion. Further away glass can just fall out of the frames, or when it
is strong enough, it is the frames that incur the damage, which they can
also transmit to the surrounding elements. Cladding, if heavy could be
fractured or if light, distorted or failing at fixing points, joint seals may
be damaged and require replacement to restore weather-proofing.
Similar damage can incur from loosely fixed panels and tiles. Internal
finishes can suffer considerable damage either directly or due to
vibrations, which can shake loose plasterboard fixings, for example.
Design considerations
Although it is not really possible to design a ‘bomb proof’ building that
will survive completely unscathed, it is possible to design features that
can help reducing injury and minimize damage to the fabric:
Planning stage
If there is a potential threat, consideration should be given to a number
of relevant aspects at the planning stage:
• Increasing the distance between a likely bomb and the building.
Strategically placed trees, bollards, and street furniture can ensure that
in crowded, busy locations, as much stand-off distance as possible is
provided (see Fig. 6.5; Royal Law Court bollards).
Fig. 6.5
Old Law Courts, Belfast.
© Andrew Beatty Grant (ABG).
154.
Conflict 137Fig. 6.6
New Law Courts, Belfast. © ABG.
• Simplifying the shape of the building to avoid multiple reflections of
the blast (see Fig. 6.6; Belfast New Law Court).
• Underpasses or car parking within the building are best avoided.
• Access, entrance areas, and public spaces should be easily monitored
and free of obstructions, which would facilitate planting a bomb inside
the building.
• Internal partitions in sensitive areas should be substantial enough to
contain blast damage as much as possible.
Structural design
The following should be taken into account to improve blast resistance:
• Track record shows that reinforced concrete and steel frame structures
with cast in situ floors have a better blast resistance; they should be
preferred if possible.
• Framed buildings are usually designed to withstand gravity and wind
loads and are not able to tolerate load reversal, which can take place
by elastic rebound or blast load opposing wind or gravity load.
Improved connections and additional cleats should be provided.
• There is also a high incidence of column/beam/ slabs failure and effective connections must be provided.
• Connection between components should be upgraded. For example,
lateral restraint to the bottom flange of beams, additional ties between
beams, and perimeter columns and moment resisting connections
between beams and columns, continuous top steel in reinforced
concrete slabs.
Windows and cladding
• The design of the windows is a priority when designing a blast-resistant
building. Frame rebates should be 30mm thick and glazing beads
155.
138 Man-made Disastersshould be capable of resisting movement in both directions. Openings
should have strong hinges, multipoint locking for secure closing and fixings capable to withstand blast loading. When laminated glass fractures
it becomes flexible, will fold up, and consequently can be pushed out of
its frame. To overcome this problem, deep rebates should be provided
for the frames, as they will prevent the interlayer to pull out at the corners, especially if associated adhesive and clamping are also in place.
• The choice of glazing is crucial, laminated glass being the most effective kind as it resists longer after cracking due to the interlayer membrane. Whilst plain glass would fail straight away, laminated glass will
only incur total failure when coming away from the frames, with the
added advantage of remaining in one piece with no flying shards. Glass
can be chosen to remain integral or remain in place when broken.
Given the necessary parameters, it is possible to design glass that will
not break in an explosion, such as laminated toughened glass. A minimum thickness of 7.5 mm is recommended for laminated glass to be
used in blast-prone situations, consisting of two 3 mm layers with a
PVB interlayer of 1.5 mm, which is the key element in ensuring that the
glass remains in place. If double-glazed, the inner panes should be of
laminated glass, the outer pane preferably of toughened glass.
• In cost-prohibitive situations, a minimum provision can be made by
using blast-resistant film on the outer glazing of ordinary windows
and ‘blast curtains’ designed to enfold and capture flying debris. The
disadvantage of this method is the limited life of the film and the fact
that the curtains are only efficient if used in conjunction with the film
failing, which would be ripped by shards of ordinary glass.
Security glazing
In conflict-prone areas, special provisions are required to protect buildings from aggression starting with casual vandalism, to deliberate manual and missile attack (stone, bricks, hammers) culminating with armed
attacks (see Fig. 6.7).
BS 55 defines anti-bandit glazing as glazing that resists impact from a
1kg object dropped five times from a height of 3m and then once from a
height of 9m. A 6.4mm laminated glass is not considered security glass
but would deter a housebreaker. In the case of a blunt dead weight
protection can be achieved by 7.5mm laminated glass with a Poly Vinyl
Butyral (PVB) interlayer of 1.5mm. Objects that are sharp, have cutting
edges or are dropped from a greater height, etc. can still cause substantial
damage, so glass with higher performance is needed such as greater
thicknesses of laminated glass 11.3 mm or more, with several interlayers.
Toughened glass does not offer adequate entry prevention as it is susceptible to impact from sharp objects, which is why is used in fire fighting routes as speedy access can be gained with axe blows.
The quality of framing should not be overlooked the method of fixing
being as important as the glazing resistance. The highly resistant glass
156.
Conflict 139Fig. 6.7
Smashed glazing phone booth.
would be useless if it can just betaken out by levering off beading, so
suitably heavy duty hinges catches and fixings should be provided.
Bullet resistant glazing is defined by BS 5051 as glazing for interior use
withstanding either three bullets spaced apart at 100 mm in a triangle, or
in the case of a shotgun resisting at close range impact: two solid slugs
in the same position. Specialist manufacturers like Pilkington Glass supply laminated glass of different qualities, conceived to provide resistance
to standard bullets from a variety of weapons such as 9 mm Parabellum,
up to shotguns and 7.62 mm rifles. Bulletproof glass is used for protective screening, and BS 1995 – Code of practice for installation of security glazing – gives guidance for installation principles.
Case studies
Northern Ireland
Whilst this section does not attempt to deal with the conflict itself, some
awareness of the historic background is necessary to understand how deep
rooted it is and to what extent long term is an inherent, relevant feature and
constitutes an important aspect when analysing effect on buildings.
The following dates in the history of Northern Ireland give an outline:
• 1170: Settlers from Britain arrive in Ireland.
• 1608: Plantation of Ulster began.
157.
140 Man-made Disasters• 1641: The Catholic–Gaelic rising in response to the Plantation and the
confiscation of land by Protestant settlers from England and Scotland.
• 1690: The Battle of the Boyne and the victory of Protestant William
III over Catholic James II – this victory is still celebrated in many
parades in Northern Ireland.
• 1801: Act of Union which abolished the Irish Parliament and bound
Ireland and Britain together as parts of the United Kingdom.
• 1912: Ulster Solemn League and Covenant signed by over 400 000
Protestants who wanted to remain in the Union.
• 1916: The Easter Rising in Dublin against British rule.
• 1921: A treaty leading to the establishment of an Irish Free State of
26 counties, with the six counties of Northern Ireland remaining British.
• 1968: The starting point of the present ‘troubles’ arising, in part, out
of the campaign by Catholics in Northern Ireland for civil rights.
• 1998: The Belfast Agreement, sometimes called the Good Friday
Agreement.
• 1999: The setting up of a power sharing Assembly in Northern Ireland.
Northern Ireland has had more than its fair share of conflicts with many
lives and buildings lost in the process.
‘Peace lines’, or peace walls, are physical barriers between the
Protestant/Loyalist community and the Catholic/Nationalist community
in certain areas in Northern Ireland. The walls are usually constructed of
concrete, stone, and/or steel, and can be over 6 m tall. There were
approximately 35 peace lines in existence by 2001. Of these, 26 were in
Belfast, mainly in the west and north of the city. Outside of Belfast there
were six peace lines in Derry, two in Portadown, and one in Lisburn.
Fig. 6.8
Peace line graffiti, Nortern Ireland.
The ‘official’ peace lines grew out of barricades that the local communities
erected themselves during periods of intense conflict in 1969 (and in later
years). When the British Army was deployed in August 1969, it replaced the
existing barricades with barbed-wire barriers of its own. It had been hoped
that these would only be needed temporarily. However, the barbed-wire barriers were replaced with more permanent structures and over the years new
peace walls have been erected and older ones extended in length and height.
The peace lines represent the most visible form of the ‘sectarian interfaces’
between the two main communities in Northern Ireland. Currently there is
no widespread support for the removal of peace walls, indeed there are
demands from certain communities for additional walls (see Fig. 6.8).
In recent years, consensus rather than strong tactics has steadily encouraged dialogue and constructive relationship. Political analysts and experts
in conflict resolution believe that despite setbacks, Northern Ireland’s tortuous road to peace has left signposts that others could usefully follow.
The same could be said about lessons learned about protecting human life
and buildings. The list of destroyed buildings, attributed to the ‘troubles’,
is long and all-embracing. From ordinary homes of militants on either
side, to shopping malls, hotels, or landmark monuments, they have been
158.
Conflict 141carefully selected to inflict maximum material and moral damage. They
also have in common the fact that they were destroyed by bomb blasts,
often in underground car parks like near the Canary Wharf Tower, or in
cars parked nearby, like the Hong Kong Bank and Nat West Tower.
The Europa Hotel in Belfast is said to be the most bombed hotel in
Europe. Its rebuilding has become symbolic of people who, believing in a
peaceful future, show characteristic resilience. In the constant reconstruction process that has been taking place in Northern Ireland, lessons learned
have been applied to new design in order to prevent as much as possible
that buildings and their occupants suffer. Many are outlined in Section B.
Nevertheless, all the wealth in the world would not be able to provide 100%
safety, and ‘fortress’-like measures would undoubtedly prevent normal life
to take place. The architectural practice ‘Building Design Partnership’ has
worked for many years in Northern Ireland and one of its executive directors, Roy Adams, has recently been appointed to support the Peace
Building in North Belfast initiative. His view sums up the general trend:
It may seem surprising but the widely held political view in Northern
Ireland is that people should be designing buildings with peace in mind.
Therefore there is no policy of security beyond the normal Health, Safety
and Fire requirements, which enforces the design of buildings in Northern
Ireland. For example the new Law Courts buildings close to the river
Lagan (the much improved river which flows through the centre of
Belfast) has a glazed wall along its entire facade which makes the occupants clearly visible from outside
Whilst the Old Court, a substantial stone building (Fig. 6.5), had to have
a 5 m blast wall erected in front of it to protect its occupants, the new
building (Fig. 6.6) is set back some 20 ms from the road and has a glazed
facade with special glass and gasket fixings.
Central University Library, Bucharest, Romania
The restoration and structural repair following damage during the 1989
revolution was undertaken by MIRO Group structural engineers.
The building and its structure
One of Bucharest’s civic landmarks and part of the main Royal Palace
Square (see Fig. 6.9), the Central University Library was designed by
Paul Gottereau and built in two stages: first in 1895 and the second
between 1911 and 1914 (see Fig. 6.10).
A substantial building of a total floor area of 5850 m2 (7083 including
the roof space) 20 m high, structurally consisted of:
plain concrete and brick masonry foundations;
load bearing brick walls,
steel girders with concrete encased bottom flanges;
steel trusses;
timber floor and roof structures;
159.
142 Man-made DisastersFig. 6.9
Central University Library building,
Bucharest before the revolution.
Biblioteca Universitara
Bucuresti
Plan parter
Fig. 6.10
Central University Library,
Bucharest – plan. © MIRO Group.
• steel frame cupolas with timber elements and reinforced concrete
higher central one.
Investigation of the general condition and the
extent of the damage
During the Romanian Revolution events of December 1989, the Library
building, which was strategically placed relative to the Communist Party
160.
Conflict 143Fig. 6.11
Library building when restoration
work begun. © MIRO Group.
Headquarters and across the square from the Royal Palace, was used
by rebel groups for shelter and as cover during the fierce exchange with
the Ceausecu’s guards (see Fig. 6.11). The events, which were watched
‘live’ on TV by millions around the world, took their toll on the building, which was riddled with bullets damaged by explosions and lost
its main cupola and roofs in the tremendous fire that broke out on
22 December 1989 and which continued to rage because of the thousands
of rare books and priceless manuscripts the building housed. The survey
conducted to establish consolidation needs, found that the building had
already been weakened by an amazing succession of events:
• No less than 10 earthquakes with magnitudes over 6.0 (of which the
most powerful were those of 1940, M ⫽ 7.4; and 1977, M ⫽ 7.2) took
place since its construction.
• Severe bombing during the last war 1940–1944 hit the library several
times.
• The fire of 22 December 1989, caused substantial damage:
– most of the older wing was lost and the beautiful Professors’ Hall
destroyed;
– the timber roof and floor structures were completely burned;
– the brick walls had been affected by fire to depths of 10–100 mm on
most surfaces;
– the lower parts of concreted steel girders were also affected, as
were the steel columns;
– the reinforced concrete central cupola presented numerous radial
cracks, displacements on the half way circumference and severe
concave deformations;
– many walls had become dislodged with cracks in the joining sections;
– the two smaller cupolas and trusses were severely distorted, especially in the front sections;
– the stone stairways were partly destroyed.
161.
144 Man-made DisastersRepairs were undertaken after the two major earthquakes of 1940 and
1977 but they consisted mostly of metal ties and localized repairs. Two
more earthquakes took place while the structural consolidation work
was in progress! One on 30 May 1990, M ⫽ 6.7 and another of 31 May
1990, M ⫽ 5.8.
Non-destructive trials on the existing materials were undertaken and the
results did show a maximum strength for the concrete to be Bc 7.5, for
bricks C100, and for mortar M10. The brickwork had an average breaking resistance of 60 dN/cm2 in compression. The ground consisted of a
clay layer on sand and gravel with the water level at ⫺7 m.
Structural analysis
Romanian normative standards of design for seismic resistance
(P100–92) place the Library building in the Class I category of importance in respect of its location, setting out a basic acceleration value at
0.2 g with an amplitude coefficient of 1.4 in seismic conditions.
In calculations, the application of this coefficient is instrumental in defining the recurrence period for an earthquake. For example, a coefficient of
1.4 will indicate a recurrence period of 110 years, which on simple formulae, without a coefficient, would be reduced to 50 years.
The average building’s behaviour in earthquake conditions must also be
taken into account for calculating the resistance capacity of a building, and
the basis of average resistance values has been accepted as appropriate. The
structural designers for the consolidation of the Library, opted for a coefficient of 1.75 and average resistance values, which would give a theoretical
recurrence period of 500 years (or 110 years without the coefficient).
Consolidation techniques
The main principle for the strengthening method selected was to encase
the existing structure with a reinforced concrete skin of 100 mm. The
fact that the walls had suffered damage from the fire to a depth of 100 mm
made it necessary to hack out to sound fabric, which at the same time
gave a good rough surface for adherence of the new skin. Externally, a
flat reinforced concrete grid was designed to frame all openings and tie
the external walls to the new reinforced concrete floors (see Figs 6.12
and 6.13). The basement was tied into the consolidation framework of
the walls and the foundation system was strengthened with ring beams
interconnected at the internal walls and tied into the existing foundations. The steel trusses were repaired and strengthened and the smaller
cupolas reconstructed with metal elements.
The main central cupola, originally of reinforced concrete, was replaced
with a new metal one (see Fig. 6.14). The surviving structural timbers
were fireproofed and the fire protection of the metal ones was to follow.
To overcome the extensive damp problems in the basement a waterproof,
reinforced concrete ‘box’ was constructed on the entire perimeter of the
building with provisions for adequate ventilation of all basement external walls. Concern for the preservation of the historic building features
has also been a consideration. The complex geometry and details were
162.
AA
A
A
Fig. 6.12
Central University Library, Bucharest:
facade concrete grid consolidation.
© MIRO Group.
6 10
6 10
# STNB
7.1/100/100
1/1000
2 × 3 12
14 × 2 10/15
4 10
~35
20
2 12
# STNB
7.1/100/100
Fig. 6.13
Facade strengthening
detail A-A.
© MIRO Group.
# STNB
7.1/100/100
50
4 × 2 12
163.
146 Man-made DisastersFig. 6.14
Central University Library, Bucharest:
New roof construction in progress.
© MIRO Group.
Fig. 6.15
Central University Library, Bucharest:
consolidation and restoration work
complete. © MIRO Group.
closely followed and solutions adjusted to suit them. Temporary supports were provided moulds and full size templates executed and
progress recorded and compared with photographs.
Observation of building’s behaviour
A specific follow-up plan has been devised to observe the following:
settlement;
rigidity variations or changes;
effects of all movement such as measurement of microvibrations;
periodic data recording after all exceptional events such as earthquakes, strong winds, or large quantities of snow.
Figure 6.15 shows the completed restoration.
164.
Conflict 147World Trade Centre collapse
Minoru Yamasaki (d. 1986) the Architect of the World Trade Centre
Building is reported to have said:
The World Trade Centre is a living symbol of man’s dedication to world
peace … beyond the compelling need to make this a monument to world
peace, The World Trade centre should, because of its importance, become
a representation of man’s belief in humanity, his need for individual dignity, his beliefs in the co-operation of men, and through co-operation, his
ability to find greatness
Terrorism and the reality of what has happened have made a mockery of
his vision and the building will now remain in history as the symbol of
evil destruction. The tragic events of 11 September 2001 when, at
8:45 AM, New York local time, the North Tower was hit by a hijacked
767 commercial jet aeroplane, loaded with fuel for a trans-continental
flight, followed 18 min later, by an other who hit the South Tower, have
been at the forefront of international analysis ever since.
Indeed at the time of writing, engineering forensic studies are still in
progress trying to establish how and why the towers collapsed and much
have already been and will continue to be written on the subject. The purpose of this case study is to establish the main facts and to outline what
is thought to have been the cause of the collapse at the time of writing.
The buildings
The site was a 16 acre formerly run-down area of lower Manhattan, and
the towers were part of a group arranged around a 5 acre central plaza,
they were 110-storeys high, with a 10 000 000 ft2 of rentable space and
occupied by about 50 000 people.
Started on 5 August 1966 and inaugurated on 4 April 1973, the Centre
was to be a landmark signifying new technology. When initial designs of
80 storey towers fell short by about 2 million square feet of the brief target for rentable space, revolutionary re-thinking and technology were
needed to meet the challenge. The problem was that too much floor
space was taken by:
(a) the traditional sky scraper structural system;
(b) the number of lifts required if the number of floors was to be raised
at 84.
The lift problem was solved by treating the towers as two 40-storey
buildings one on top of the other. This meant that fewer shafts were
needed and people needing access to the top floors would change to
local lifts on the way.
The structural design faced a real challenge from the following factors
that had to be considered:
(a) the wind;
(b) maximizing the available rental space;
165.
148 Man-made Disasters(c) keeping cost down;
(d) providing resistance to the building being hit by an airplane
(following the 1945 Empire State Building incident).
New York winds could reach 100mph with a push force several times
stronger than a Los Angeles or Tokyo earthquake. This could ‘shake’ a structure to pieces by the dynamic motions concentrated in the outer walls. To
overcome this, a ‘tube structure’ design was conceived, with high-strength
steel concentrated in the outer walls, 3⫻30ft columns welded together to
form rigid prefab panels and a core of lifts and stairways that allowed considerable open space and saved money, as only half of the steel required by
a conventional grid of steel columns and beams was necessary. The design
also took into account the fact that the towers would shelter each other.
The fast construction (three floors in 2 weeks) also helped save costs.
The disaster (Fig. 6.16)
The building stood the test of time for 23 years without problems until, in
1993, when there was a terrorist attack: a bomb exploded in an underground
(a)
Fig. 6.16
World Trade Centre collapse.
© Adrian Alexander.
(b)
166.
Conflict 149car park, killing 16 people and injuring 1042. The bomb attempted to
demolish the base of the North Tower causing it to fall into the South
one, bit it did not succeed because it was outside the perimeter skin of
the tube structure. Also, the towers acted as giant chimneys aspiring the
smoke through the lift shafts and stairways.
The reasons the 11 September 2001 attack was so devastating was: first,
because the plane had penetrated the perimeter wall, the building’s
defence mechanism; and second, because the plane was much larger and
carried more fuel than it was envisaged by design.
The building, which was designed to withstand impact from a fully loaded
Boeing 707, was hit by a 767. When considering the design, the engineers
considered that as a fully loaded 747, crashing into the outer walls, would
bring 300 tonnes on impact, the fact that the walls were designed to carry
13000 tonnes of wind pressure, will mean that impact effects could only
be localized. The size and power of the Boeing 767 was substantially more
than that envisaged at the design stage. As the engineers have pointed out,
the building did not fall down on impact! In fact it remained standing for
53min allowing thousands to escape and took 11s to collapse. It was,
however, stressed well beyond the design calculations.
The causes
Experts are still collecting data and cannot offer yet definitive answers. A
preliminary report produced by the FEMA and the American Society of
Civil Engineers (ASCE) attributes the collapse to three ‘loading’ events:
1. The Boeing hitting the building and creating a fireball.
2. The continuing fire, which heated and weakened the structural system which added further stress to the structure.
3. The progressive collapse.
The report calls for further research. At the time of writing, the wide consensus is that the cause of the disaster was the intense heat from the jet fuel
fires (estimated in the region of 1000–3000⬚F), which melted the steel
infrastructure, and went past its yield strength and caused the collapse.
Bare steel if heated gets weaker, does not melt straight away. It begins
to lose strength and if unprotected, slowly sags. Analysis of the twisted
steel columns from the wreckage found them completely clean, even
though they were had been covered by sprayed-on fireproofing. Some
experts have explained this as having been blown away by the blast,
leaving the steel unprotected.
It has also been observed that the immense force was applied at t ⫽ 0 and
there was no actual time for the materials to adapt. Also, that there were
certain vulnerable elements in the link construction of the tube frame
structure such as the weak floor trusses and floor connections.
167.
150 Man-made DisastersThe building materials used for the fire protection of the structural elements withstood the fire for 40–60 min, but once they were destroyed,
the steel melted and the structure collapsed on the floors below. These
floors, in turn, collapsed from the weight of the structure falling from
above, resulting in a ‘progressive collapse’ chain reaction.
The future
While a report on initial forensic investigations is being prepared, apart
from finding what happened and why, there are many other questions to
be answered, not least what to do with the site.
The parties involved are the tenants who have a 99-year lease since July
2001; the owners of the land, The Port Authority; and the City of New
York, each having their own priority. The tenants consider they have the
right and obligation to rebuild, but cannot do so without the permission
of the owners whose main concern is the reinstatement of the commuter
line (estimated to take 2 years) which they seek to integrate with the
New York subway. New York City has the task to clear the site of the disaster, and once the site is clear and foundations stabilized, they take a
back seat.
There have been several ideas but forward, but at the time of writing, no
architects had been appointed. Whatever follows will not only have to be
outstanding, but will also have find a number of answers to wider issues
concerning how we wish to evolve. The debate continues!
168.
7Fire
From the earliest days of humankind, fire has been part of life, and striking a fine balance between the benefits it offered and the danger it posed
has remained a constant concern. Whether through man’s own errors or
disregard for its power of destruction, or natural phenomena, fire has
claimed countless lives, buildings, forests, and land. From Nero’s Rome
and London’s 1666 great fire, to the World Trade Centre, many of man’s
finest buildings have been lost to flames.
How does fire occur
Fire is one of the main universal elements, but unlike air, water, or earth
fire is not a form of matter but a chemical reaction. It requires three ingredients: fuel, temperature, and oxygen. When a material such as oil, wood,
or wax is heated to a certain temperature (flash point) it ignites and the
compound molecules break and the atoms recombine with oxygen forming water and carbon dioxide, amongst others. As the burning the material
decomposes, some products are released as volatile gases, or smoke.
What sets this chemical reaction apart is that it is self-perpetuating,
the heat from the flames continuing to create temperatures required for
combustion, etc.
Of nature’s disasters, forest fires are the most frightening. Giant walls of
flames can burn acres of land in a few minutes moving at incredible
speeds. Wildland fire is unstoppable and the Australian bush fire in
December 2001 has been a terrifying reminder of the near unstoppable
destruction it can cause.
It would be well beyond the purpose of this book to attempt considering
all aspects of fire hazard in depth. The way it affects buildings alone is
complex enough to deserve several books of its own. Consequently,
within the context of this subject, information will be restricted to looking at the overall picture, giving some general guidance in respect of
areas of concern as well as sources of information.
169.
152 Man-made DisastersTypes fire (Statistics source: infoplease.com/
spot /forestfire.html)
Fire disasters affecting wildland and forests
Bush fires – fires affecting low vegetation (less than 6 ft). A constant feature of summers in the south of France and Italy, wildland fires advance
with considerable speed and destroy all in their path. Some are caused by
careless smokers, others by arsonists eager to make way to land development without any regard to the long-term effect on the environment and
ecosystem. When sufficiently fuelled by grass, bush, or saplings in windfavourable conditions, bush fires can extend to trees and forests.
Forest fires – uncontrolled vegetation fires more than 6 ft in height. This
fire can travel at high level through the forest canopy, before affecting
the forest floor. The difference of air pressure created causes hot
updraughts and firestorms. According to the US National Interagency Fire
Centre, in 2002, between January and May, 24 421 fires burned
442575 acres of wild land and a severe drought has devastated much of the
Great Planes, which has left the area susceptible to forest fires. In 2001,
84079 separate fires destroyed 3570911 acres of land and 731 structures.
It cost US$ 542 million to fight these fires. In 2000, nearly 123 000
separate fires burned 8.5 million acres of forest and it took 30 000
people and US$ 1.3 billion to fight the fires. It is estimated that twothirds of forest fires are started accidentally by people, almost a quarter
is intentionally set, and about 10% caused by lightning.
Fire prevention
The Australian bush fire in December 2001 has raised awareness of the
risk and the need to protect the natural environment without compromising the need for the protection of human life and property.
While burning by Aboriginal people and graziers and the occasional
wildfire have been part of the Australian environment and have created
its characteristic vegetation patterns and landscape, the common practice
of ‘hazards reduction burning’ has been brought into question by the
long-term effect it is having on the natural ecosystem.
The Nature Conservation Council (NCC) in New South Wales has been
promoting public education and pursuing strategies for better bush fire
risk management since 1984. With the support of legislation such as the
Rural Fires Act 1997, it has been working towards enabling the community to participate in management planning with ecologically sustainable
policies with emphasis on a cyclical planning process.
Some causes of wild fire are:
• arson;
• campfires;
170.
Fire 153discarded lit cigarettes;
burning debris;
fireworks;
prescribed fires.
Some examples of fire fighting methods as used in the United States are:
• Hotshots: US fire-fighters building firebreaks around a fire to stop it
from spreading.
• Smokejumpers: employed by the US Bureau of Land Management and
Forest Service with the aim to surpress small fires before they spread.
Fire fighters are parachuted in place.
• Backfires: these are fires started on the ground in the direction of
advancing fires for the purpose of controlled burning of potential fuel
for the progressing wildfire.
• Air tankers: fire fighting from planes and helicopters dropping water
and fire retardants.
Fire disasters affecting humans
Domestic fire risks (statistics FEMA/US National Fire
Protection Association)
The US National Fire Protection Association estimates that each year
fire kills more Americans than all natural disasters combined. Fire is the
third leading cause of accidental death in the American homes and at
least 80% of all fire deaths occur in residences, representing about 22%
of all fires and 74% of structures burnt.
Fires mostly start in
the kitchen: 23.5%;
the bedroom: 12.3%;
the living room: 7.9%;
the chimney: 7.1%;
laundry area: 4.7%.
Fires are often caused by:
cooking fires, usually due to unattended cooking or human error;
careless smoking;
heating;
arson – the third leading cause after cooking and heating.
Life-saving measures include:
smoke alarms, but they have to be properly and regularly maintained;
residential sprinklers;
fire doors and protected means of escape;
fire-protected structure to allow sufficient time for the occupants to
escape.
171.
154 Man-made DisastersFire in public buildings
There are many causes for fires occurring in public places. Amongst the
most common are:
• Inadequate design or fire protection. This, in simple terms concerns:
– making adequate provisions made to prevent the structure from collapsing for a set time required allowing occupants to leave the
building;
– providing suitable means of escape;
– preventing the fire from spreading by creating fire-resistant compartments to contain it.
• Poor management, contributed by:
– allowing fire hazards to accumulate (rubbish, flammable furnishings, and materials, etc.);
– lack of maintenance: faulty electrical installations or malfunctioning sprinklers, alarms, etc.;
– carelessness such as work using naked flame or smoking;
– lack of staff training for fire emergency.
• Arson.
• Human error/negligence.
As with forest fires, carelessness or negligence can cause devastating
loss, not only in terms of human life and costs but also in loss of irreplaceable historic heritage. An example of how a careless moment has
caused the loss of a unique part of British heritage and involved hundreds of people in years of painstaking re-building work is that of the
Windsor Castle fire (see ‘Case study’).
Fire effects
1. The loss of life – this is caused by the smoke induced asphyxia, collapse of the structural elements, and victims jumping out of windows.
2. The destruction of the building fabric and contents by the flames. The
fire will use every available material as fuel: timber structure, furnishings, fabrics, finishes, etc. and consume it in the process.
3. The destruction, alteration, and damage caused to the building elements by the high temperatures, which will cause them to expand,
crack, vitrify, plastify, melt, etc.
4. The damage caused to the fabric and contents by the large quantities
of water used to put out the fire.
5. The damage caused by the mechanical collapse of structural elements.
Monitoring and prevention strategy
Whether due to negligence, arson, lightning, or accidents, fires are a
major threat to humans not only because of life and property loss but
also for the long-term effect in the irreversible destruction of the ecosystem. For this reason, the United Nations has included in its International
Strategy for Disaster Reduction (ISDR), a separate activity concerning
172.
Fire 155fire: the Global Fire Monitoring Centre. The centre provides documentation, information, and monitoring systems accessible through its website. A worldwide network of institutions and individuals generate the
information, which is regularly updated. The data, systematically collected and interpreted, is displayed and archived with products such as:
early warning of fire danger;
near-real-time monitoring of fire events;
interpretation and synthesis of fire information;
archive of global fire information;
facilitation of links between institutions involved in fire research,
development, and policy development;
• support of local, national, and international initiatives to develop longterm strategies for wildland fire management;
• emergency hotline for assistance and rapid assessment supporting
decisions in emergency response.
The World Fire Web is a system for globally mapping fires in vegetation.
It uses satellite images acquired by a worldwide network of receiving
stations. Each station operates a data processing chain for detecting fires
in the satellite imagery (see Fig. 7.1) (NOAA AVHRR). Daily, global
fire maps are built up at each station from this regional data by automatically sharing regional fire maps over the Internet. Global fire information is then available on-line, from each station, in near-real-time.
Timetable: a pilot network with partial global coverage is in its implementation phase, started in June 1998. By the end of 1999, the network
should provide a virtually global coverage of vegetation fire.
The World Fire Web has been chosen as a pilot project to supply fire
information to the Global Observation of Forest Cover (GOFC) project.
Fig. 7.1
World fire map. © Global Fire
Monitoring Center.
173.
156 Man-made DisastersThe GOFC project (http://www.gofc.org/gofc/projects.html) is coordinating an international research programme designed to produce a comprehensive global forest mapping and monitoring system.
Case study – Windsor Castle
Windsor Castle has been the home of British kings and queens for nearly
900 years. On 20 November 1992, a fire was started in the chapel from
a tungsten lamp, which came into contact with curtains screening the
altar (see Fig. 7.2). The fire spread rapidly through the roof voids and
over 15 h devastated the building destroying 105 rooms of which nine
were principal staterooms. The heat and the water from fire extinguishing efforts caused irreparable damage. Many floors had collapsed and
others were on the point of collapsing. In the Brunswick Tower, 12 ft of
debris covered the main floor. The bay window of the Crimson Drawing
Room had been pushed out by the thermal expansion of the steel roof
trusses and the wrought iron floor beams in the Prince of Wales Tower
had expanded and were distorted. The large quantity of water poured
over the burning structure had affected the condition of the salvaged
remains and a considerable amount of time was going to be required to
allow them to dry out. The built in timbers were likely to have been
affected by dampness and it was anticipated that salt damage would
affect the carved masonry.
The first decision was to proceed to carefully dismantle remains, using
specialist teams suspended in harness above the wreck for safety and to
avoid further damage to the surviving fabric. The cost of repairing the
damage was estimated at £60 million and the drying out time before
applying finishes at 10 years! The water trapped inside the structure was
a major problem, as the remedial work had to wait for the moisture contents to drop to acceptable levels.
The first stage of the remedial work concerned the assessment of the
damage to materials, which would determine the extent of what could be
retained. A great number of samples from the Brunswick Tower rooms
were laboratory tested and fire and salt damage danger justified stripping
Fig. 7.2
Windsor Castle on fire. © CINTEC.
174.
Fire 157out finish from certain parts of the structure to ensure a satisfactory drying out. The stone masonry had also been affected by the fire: the Bath
stone had crack openings at mortar joints and general microcracking as
was the York stone, which also presented spalling of entire blocks of up
to 150 mm.
The specialist survey of the ground and walls uncovered a number of
voids and concealed flues within the existing structure, which required
stabilizing. This was achieved with the use of a proprietary system, the
Cintec anchor, consisting of stainless steel anchors enveloped in a woven
polyester-based cover. The anchor body, which can be a solid bar, hollow section, or threaded rod, reaching lengths of up to 50 m long (at
Windsor the longest anchor was 12 m) is inserted in the masonry and
cementitious grout is pumped at low pressure into the enveloping cover.
This realizes a strong masonry/grout/anchor bond and any likely movement is resisted by the low shear stresses between the masonry and
grout, into the anchor body. The Cintec system was used around the window at the northeast corner of the St. George’s Hall and at the top of the
Brunswick Tower where the fire had weakened the crenellated parapet.
Different types of problems were posed by the discovery of earlier mediaeval features under the burned Victorian work, such as the Royal Kitchen
and St. George’s Hall roof, where new designs were adopted. The remedial work took 5 years and was completed at a cost of £36.5 million and
on 17 November 1997, the Queen held a reception in St. George’s Hall
for all the contractors, craftsmen, and consultants involved in restoring
Windsor to its former glory.
175.
176.
8 Disasters resulting from human activitiesClassification and impact
The general perception is that disasters are the result of natural phenomena. Historically, this has been predominantly so, but over the past
200 years, the impact of human existence and activities has altered the
situation substantially. Human activities can lead to disasters when they
cause widespread ill health, loss of life, and irreversible destruction of
the environment. This can happen in a number of ways, as a result of
direct and indirect human action.
Technological advances
The advance of technology has enabled humans to improve many
aspects of their existence, develop, and expand their sphere of activity,
use natural processes to their advantage. At the same time, there are new
challenges to be faced as a consequence.
Relatively new technological processes and materials have not yet had
the full test of time, and unlike natural ones, which have been around for
thousands of years, they are still to fully manifest themselves. While we
know what to expect of stone, timber, or brick, we are only beginning to
understand the long-term behaviour and effects of plastics, fibres, or
fossil fuel use. We are discovering more and more the negative consequences of human intervention in the natural ecosystem and the effect of
man-made materials and their production process. The disastrous effects
of technological production can be grouped in the following categories:
(a) The products themselves.
(b) The harmful by-products from the manufacturing process such as:
• radiation;
• pollution.
(c) The production, transportation, and technological systems failures.
Excessive exploitation of natural resources and
inappropriate land development and building
Global warming and climate changes are probably the world’s major
challenges at present. They affect our well-being and threaten the survival
177.
160 Man-made Disastersof the ecosystem. It is widely accepted that the world is warming up
more than ever before and that the 1990s have been the hottest decade in
the past millennium. The steady rise in temperatures (1–2⬚C) is accompanied by a rise in sea level (20–80 cm). The consensus is that this is due
to ‘greenhouse gases’, a by-product from the burning of fossil fuel for
energy and transport. Carbon dioxide is exchanged naturally through
photosynthesis in the living world, oceans and forests by balancing the
carbon volume. However, as humans introduce millions of tonnes of carbon artificially as well as clearing or causing the die back of forests, the
climatic balance becomes disturbed. Solar radiation becomes trapped by
the greenhouse effect created in this way.
The interaction between environment, health, and development has
become a major global issue. The destruction of the ecological balance,
which occurs through urbanization, deforestation, and desertification, has
lead to food shortages, poverty, and famine. Man-made materials and
processes requiring high-energy consumption have been shown to affect
human health and be a major factor contributing to climate change.
Contamination of the food chain and environment
Throughout the world, people are becoming victims of industrial
accidents when hazardous materials are released into the environment.
This can occur through the use of chemicals, improper waste management, or unethical manipulation for material gain as in the case of mad
cow disease.
Impact
1. Physical damage – Damage or destruction of structures and infrastructures can occur through explosions in plant and storage facilities as a
result of inadequate safety features and/or maintenence, unsuitable
buildings and technological systems, lack of trained staff, or sabotage.
Transport accidents damage vehicles and other objects on impact, and
are often shown to be the cause of poor vehicles, containers, such as
some oil transporting cargo ships which were not found seaworthy.
Industrial fires also destroy infrastructures and affect large areas.
2. Environmental damage – Dangerous substances suspended in the air
such as gases, vapours, and volatile liquids can cause serious
health problems, sometimes even death. Direct inhalation of toxic
substances and skin contamination are common. Large-scale release
of airbourne polluants can spread for hundreds of kilometres.
Contamination of the water supply, land, and animal life can also
be devastating. Persons or livestock nearest to the scene are most vulnerable, but in certain cases, the damage can reach several countries,
such as in the case of the Chernobyl accident in Ukraine or the
cyanide spill in Northen Romania. Disrupted ecological systems can
cause irreversible damage such as the extinction of some species or
long-term damage such as desertification or land and sea shores contamination, which can take generations to clean and reinstate.
178.
Disasters resulting from human activities 161The following sections take a brief look at some of those aspects more
pertinent to buildings and planning, but the subject of man-made disaster warrants a further and extensive separate study. Sources of information are listed at the end of this book.
Technological production
Listed below are examples of the types of harmful effects arising from
technological production, which are causing particular concern.
Manufacture and use of harmful products
Asbestos is a derivative of a group of natural silicate minerals, which can
be separated into strong long fibres and can be woven, it is resistant to
heat and fire. During the twentieth century, asbestos has been extensively
used in a wide range of products with commercial applications, for consumer, industrial, maritime, scientific, and building use. Some of the
most common asbestos-containing products have been used to protect
against heat and fire, especially in the construction industry. Examples
are numerous: pipe-covering, insulating blankets, insulating cement,
asbestos cloth, asbestos plaster, gaskets, packing materials, thermal
seals, boiler insulation, fireproofing spray, vinyl flooring, ceiling tiles,
mastic, adhesives, coatings, acoustic treatment, roofing products such as
asbestos cement slates or diamond slates, asbestos rope, insulated electrical wire, brake and clutch assemblies, etc. Figure 8.1 shows where
asbestos products can be found in a typical building. It is now known
that asbestos is a dangerous substance because of the serious human
Flexible
fabric joint
Roofing
asphalt
and felt
Roofing
paint Fire doors
internal lining
Acoustic
ceiling
material
Ductwork
seam tape
Ceiling tiles
Window
putty
Vinyl
asbestos
floor tiles
Textured
paint and
plaster
Asbestos
cement
wallboard
Fig. 8.1
Common building materials
containing asbestos.
Pipe
lagging
Floor tile and
lino backing
Pipe
Block
elbow
insulation
179.
162 Man-made Disastershealth hazards caused by the inhalation of asbestos fibres. Controlled by
a specific EC directive (87/217/EC) asbestos is no longer used in new
construction products, but it is still present in buildings and products of
the 1950s and 1960s and therefore can affect people involved with disposal, demolition, and refurbishment of these buildings.
Use of lead produces a cumulative poison affecting mental and physical
well-being through ingestion, inhalation, and skin contact. This can
occur from the use of lead water pipes and cooking utensils. Lead dust
can be released from poly (vinyl chloride) (PVC) products such as certain vinyl blinds as they deteriorate through exposure to sunlight, and
certain types of paint.
Synthetic materials used in building construction and furnishings have
been found to produce volatile organic compounds that adversely affect
human health. Some examples are discussed in the following text.
PVC vinyl – one of the most widely used types of plastic presents a real
threat to human health and the environment through its toxic manufacturing process which releases a number of cancerogenic chemicals such
as doixins, ethylene dichloride, and vinyl chloride. When PVC is combined with additives such as plasticizers and stabilizers, which are not
chemically bound to the polymer, a number of harmful substances
are released representing a potential threat of causing asthma, cancer,
lead poisoning, immune system damage, etc. PVC vinyl also constitutes a fire hazard, creates toxic fumes and is not easy to dispose of
safely: it has to be burned or buried, which can lead to soil and water
contamination.
Formaldehyde – a chemical used widely in the manufacture of building
materials and household products, it is also a by-product of combustion
and other natural processes. Formaldehyde has been found to cause
health problems such as: asthma attacks, breathing difficulties, nausea,
throat irritations, skin rashes, severe allergic attacks, and it may induce
cancer. Formaldehyde is mostly used as part of the adhesive used in the
manufacture of pressed wood products such as:
• hardwood plywood panelling, used in decorative panelling, furniture;
• particle boards used as sub-flooring, shelving, furniture;
• medium density fibreboard (MDF) used for drawer fronts, kitchen
units, and tabletops. As it contains a higher resin to wood ratio, MDF
is recognized as being the highest formaldehyde emitting pressed
wood product.
Also used in preservatives in certain paints, cosmetics, and coatings, and
certain insulation materials (urea–formaldehyde foam and fibreglass
insulation), formaldehyde is released in the air by burning wood,
kerosene, or natural gas as well as cigarettes.
180.
Disasters resulting from human activities 163The following steps are helpful in reducing exposure to the effects of
formaldehyde:
• the use of ‘exterior grade’ pressed wood products, which are lower
emitting because they use phenol resins;
• reducing humidity and temperature levels;
• increasing ventilation.
Harmful by-products and/or processes
Radiation – what is it and how it occurs
Radiation is energy in transit and as such, we encounter it in some form
every day as electromagnetic waves when we use light, radio, television,
ultraviolet, and microwaves, etc. When radiation-causing energy is high
enough, it can interact with atoms causing them to become ionized.
Radioactivity is the spontaneous process of transformation or disintegration of an unstable atom and can be defined through the number of
nuclear transformations occurring in a given quantity of radioactive
material per unit of time, expressed in becquerels (Bq) or curies (Ci).
Certain elements such as uranium, polonium, radon, etc. (nine in total)
are naturally radioactive, natural in the sense that radioactive elements are
part of nature and we all contain things like radioactive carbon-14, but all
radioactive emissions are dangerous to living things. The loss of an electron can induce cell death or genetic mutations and certain particles,
whilst having no effect outside the human body, can be very dangerous if
eaten or inhaled.
The amount of energy from ionizing radiation deposited in a material
mass is known as a dose. Doses can be: absorbed expressing the
quantity of energy absorbed by any given material for any type of radiation (measured in units of Gray) or effective and equivalent dose which
differentiates between different types of tissues and radiation (measured
in Sieverts). The unit used to measure absorbed doses is a RAD (radiation absorbed dose) 1 RAD represents the absorption of 100 ergs/g of
material. The unit used to derive the equivalent dose relating to human
tissue is called a REM (roentgen equivalent man) and it relates the dose
absorbed by human tissue to the effective biological damage. 100 REMs
equal 1 Sievert. Doses can be: chronic (received over a long period of
time) or acute (received over a short period of time). The effects of
radiation can be: somatic (seen in an individual receiving the radiation);
genetic (seen in the offspring of the individual receiving the
radiation before conception) teratogenic (seen in offspring of individual
receiving radiation during gestation) stochastic (occurring on a random
basis unrelated to dose such as cancer) or non-stochastic (directly related
to dose).
Radiation can be lethal to man in circumstances that enable high doses
to contaminate his organism, food chain, and environment. This takes
181.
164 Man-made Disastersplace usually in the context of nuclear accidents. There are several types
of nuclear accidents:
nuclear reactors;
nuclear fuel reprocessing plants;
nuclear waste storage facilities;
nuclear weapons;
radioisotope generator and heating units;
nuclear weapons tests;
production and re-processing facility discharges (like Sellafield UK,
Hanford, Savannah River, etc.).
The radioactive plume (the concentration profile of an air or waterborne
release of material spreading from its source) from nuclear accident
results in dry and wet ground deposition. Human exposure to contamination occurs in several ways:
1.
2.
3.
4.
external exposure;
absorption (dermal deposition);
inhalation;
ingestion.
The effects of contamination are also related to the time of exposure,
which can be:
1. Early – for the length of time that critical exposure is maintained
(10 days at Chernobyl).
2. Intermediate – 1 week to 6 months.
3. Late and very long term exposure to biologically significant ground
deposition 6 months to over 100 years.
Case study – Chernobyl, Ukraine (Source: Nuclear Energy Agency,
NEA, Assessment on Radiation Protection and Public Health,
Chernobyl 10 years on)
The Chernobyl case encompasses several of the man-made hazards
listed above: the harmful radiation by-product, the inadequate infrastructure, technological systems failure and inadequate safety and
emergency provisions. The compounded effect of all these elements
resulted in one of the worst peace time disasters the world has suffered
in recent times, not only in its immediate effect but also in its long-term
implications.
Background
Chernobyl power station was located in a populated area where 2 million people lived, part of Belarus, a former Soviet Union republic with a
population of about 11 million, which produced chemicals, engineering
products, and electrical goods.
182.
Disasters resulting from human activities 165The accident
On 26 April 1986, a major accident at the nuclear power station in
Chernobyl, Ukraine, caused the release of large quantities of radioactive
substances the effect of which spread across Europe, reaching as far as
Canada and Japan. The accident is by far the most devastating in the
history of nuclear power.
The number four RBMK reactor (a Russian acronym which translated
roughly means ‘reactor cooled by water and moderated by graphite) went
out of control during a test at low power, leading to an explosion and fire
which demolished the reactor building and released large amounts of
radiation into the atmosphere. Safety measures were ignored, the uranium fuel in the reactor overheated and melted through the protective barriers. RBMK reactors do not have what is known as a containment
structure, a concrete steel dome over the reactor itself, designed to keep
radiation inside the plant in the event of such an accident.
The accident happened during a routine maintenance test when inadequate safety precautions combined with a lack of coordination between
different sections of staff and the unstable elements in the reactor’s
design, which made possible a loss of control in operational errors conditions. A number of violent explosions took place resulting in the almost
total destruction of the reactor. The fact that the quantity of radioactive
material released was extremely large, that it reached high altitude (1 km)
and took place over more than a week with changing winds, resulted in a
catastrophe of unprecedented proportions which caught emergency services and national authorities completely unprepared (see Fig. 8.2).
The lack of information at the early stages of the disaster and the inadequacy of the intervention procedures in place created confusion among
the public, doubt among experts and a general reluctance to act. The
most difficult decisions concerned the long-term management of the
contaminated areas and the associated relocation and a need for international efforts to harmonize criteria and approaches to emergency management was highlighted. The main issues were the following.
The estimation of radiation dose. Most of the population of the Northern
Hemisphere was exposed to varying degrees of radiation from the
Chernobyl accident. The main concern is over the effect on the thyroid
gland from external irradiation and inhalation of radioactive iodine
isotopes and the effects on the whole body from radioactive caesium
isotopes.
The groups concerned.
• The evacuees – over 100 000 persons were evacuated from the 30 km
radius area around the accident location during the first few weeks.
They received initial significant doses of both types of radiation (from
70 millisieverts, mSv, to 1 Sievert to thyroid and 15 mSv to the body)
183.
166 Man-made DisastersFig. 8.2
Chernobyl fall out sequence.
© Atmosphere Release Advisory
Centre.
and continued to be exposed, albeit to a lesser degree at their site of
relocation.
• The first on the scene teams, ‘the liquidators’ – some 800 000 workers, military personnel, firemen, and medical staff involved in the initial emergency action at the time of the accident and the clean-up
operation which lasted a few years.
• The personnel on site at the time of the accident – about 400 persons
suffered very high doses (from a few Grays to 10 Grays) and many
developed acute radiation syndrome requiring emergency treatment.
• People living in contaminated areas of the former Soviet Union –
approximately 270 000 people continue to live in contaminated areas,
184.
Disasters resulting from human activities 167where protection measures are still needed. Children in the Gomel
region of Belarus have received the highest thyroid doses through
cow’s milk (up to 40 Sieverts). Whole body doses between 1986 and
1989 averaged 40 mSv.
• People outside the former Soviet Union – doses received were lower,
the upper extreme in some European countries being 1 or 2 mSv,
which is the equivalent of an individual annual exposure from natural
background radiation.
Impact.
• Health – the initial explosion and graphite fire killed 31 people, 140 suffered various degrees of health impairment. According to statistics
released by the Ukrainian Government 10 years on, over 5700 ‘liquidators’ also died during the period following the disaster. The Ukrainian
Ministry of Health has released a total of 125 000 subsequent deaths,
natural or otherwise, since the accident. The observed trend is of an
increase of cancer incidence, especially thyroid cancer, the peak not
having been reached yet. A widespread psychological stress was suffered by the population in the areas affected, reflected in fears about
unknown radiation and mistrust towards officials and experts.
• Agricultural and environmental – agriculture and environment were
widely affected and food production and environmental aspects in
general are still suffering. Large areas of agricultural land are still out
of use and are expected to remain so for a long time, as are animal
production restrictions. Waterways have been contaminated and a
number of forests have suffered from irradiation due to the filter effect
of trees, affecting wild life, and forest habitat in general. In some
places, the irradiation effect had been so high as to kill trees which
then had to be destroyed as radioactive waste. Whilst severe environmental impact was short term, low-level radioactive contamination
will persist for decades.
Residual risk. After the accident the remains of the reactor were encased
in a massive concrete structure, known as the ‘sarcophagus’, which was
conceived as a provisional protection means until a safe way of disposing of the radioactive materials is found. However, a solution is still to
be identified and the long term resistance of the ‘sarcophagus’, in particular its roof, which presents a number of cracks, raises concerns as do
a number of massive structures rendered unstable or damaged by the
accident and which could fail causing the collapse of the roof. This in
itself would be a major disaster but the fact that Unit 3 of the Chernobyl
plant is still in operation poses an added and even bigger threat. The proliferation of waste storage sites constitutes a potential source of contamination of ground water.
Lessons learned. Although the Chernobyl accident was very specific in
nature and as such is not a useful reference for future emergency planning
185.
168 Man-made Disasterselsewhere, it has made clear that a major nuclear accident can affect
directly and indirectly other countries, even at a large distance away.
This realization has underpinned a concerted effort of international
cooperation covering communication, harmonization of emergency
management criteria, and coordination of protective action. A decade of
assistance to the countries of Central and Eastern Europe and the former
Soviet Union focused on identifying the weaknesses in the design and
improving design safety of RBMK reactors. Upgrading was performed
on all RBMK units to eliminate the design deficiencies which contributed to the Chernobyl accident. The European Commission has
launched an extensive collaborative research programme. Sixteen projects have been funded to study health and environmental issues including emergency response procedure and long-term management. One of
these projects has led to the publication of an Atlas illustrating the deposition of radioactive material (in particular caesium 137) after the
Chernobyl accident. Apart from the severe health consequences of the
accident, the physical, industrial, and economic short-term effects there
are also long-term consequences of socio-economic disruption, psychological stress, and lack of confidence in nuclear energy.
Pollution
Pollution is one of the major global public health concerns of the twentieth century. In simple terms, pollution is defined as ‘any harmful or
undesirable change in the physical, chemical, or biological quality of air,
water, or soil’. Closely associated with contamination in the context of
high concentration of non-characteristic substances in other mediums,
pollution can be the result of natural disasters, such as volcanic eruptions
or forest fires, but it is predominantly associated with the direct or indirect human introduction of harmful substances in the environment.
Atmospheric pollution can be defined as the presence in the atmosphere
of substances or energy in such quantities and of such duration as to be
liable to cause harm to life, damage to human-made materials and structures or changes in the weather and climate (source: Elsom).
Habitat pollution through the introduction of chemicals in the environmental cycle has had harmful effects on wild life and biodiversity. The
main offenders are:
• Chlorine-based poisons such as DDT, PCBs, and dioxin. Widely used
to destroy insects, DDT saved millions of lives by killing mosquitoes
that spread malaria, but it has lead to contamination of the food chain.
Banned in the United States since 1972, it is still being manufactured
in Mexico and Asia.
• Organophosphates.
• Nutrient pollution – mainly agricultural run-off and sewage, it reaches
bodies of water seeping into the soil. The effect is an alteration of
the global nitrogen cycle and the pollution of surface waters with
186.
Disasters resulting from human activities 169phosphorus and nitrogen. Amongst other negative effects, nutrient pollution also stimulates the growth of algae in a process called eutrophication, which uses oxygen to the detriment of other marine wildlife,
notably fish. The East Coast of United States, The Baltic Sea and the
Adriatic have been affected, and the city of Venice is collecting
500 tonnes of algae per day.
• Air pollution and acid rain: acid emissions from fossil-fuel combustion (SO2, CO2, and NO) combine with the water in the air to form
sulphuric and nitric acids, causing acid rain. This destroys plants
and animals as well as man-made structures and it can travel long
distances away from the polluting source (see Fig. 8.3).
Pollutants are measured in micrograms per cubic metre of air (g/m3)
and affect buildings as:
Wet deposition – this is brought intermittently from high up in the atmosphere and from distant sources by rain or snowfall, polluting substances
dissolved in the rain or snow are deposited on the building.
Dry deposition – this takes place more or less continuously involving
local pollutants, which react directly with the building fabric causing
erosion.
Pollutants affecting the fabric of buildings include:
• Carbon dioxide results naturally from respiration and artificially from
fuel combustion. It is capable of dissolving limestones converting
them into water-soluble compounds.
• Carbon monoxide.
• Sulphur dioxide.
• Ozone occurs naturally in the upper atmosphere and from man’s activities and exhaust fumes. Ozone can cause rapid corrosion of metals
Fig. 8.3
Building in Glasgow showing
pollution effect. © ABG.
187.
170 Man-made Disastersthrough its oxidizing action with dramatic effects. Some of the world’s
best-known monuments like the Taj Mahal or St. Paul’s Cathedral
have suffered from ozone corrosion attack on exposed iron ties and
embedded iron cramps.
• Chlorides.
• Carbon monoxide.
Preventing and mitigating the effects of
atmospheric pollution
Legislation: reducing the level of air pollution has been the focus
of a number of EC legislative measures and US directives cover the
headings of:
– exhaust systems;
– gaseous pollutants;
– industrial plants and large combustion plants;
– lead;
– nitrogen dioxide and ozone depletion;
– sulphur dioxide;
– integrated pollution control;
– air quality assessment.
The European Environment Agency (EEA) has monitored a noticeable
fall in SO2 levels since the introduction of new directives in 1990. This
has been explained partly as the result of change from coal to other types
of fuel and desulphurization practices. Current strategy adopted by
organisations such as the US Environmental Protection Agency (EPA)
follows the following principles:
(a) Whenever possible, pollution should be prevented or reduced at
source.
(b) If prevention is not possible, pollution should be recycled in an environmentally safe manner.
(c) If prevention or recycling are not possible, pollution should be
treated.
(d) Disposal or any other type of release into the environment should
only be employed as a last resort, and conducted in an environmentally safe manner.
Pollution can also be reduced through better urban and building design
and maintenance along the following lines:
(a) Improving plant management and design.
(b) Reducing the use of pollutants through energy-efficient buildings
design.
(c) Creating urban pattern design which reduce the need for transport
energy.
(d) Provide the use of alternative and renewable energy in design.
188.
Disasters resulting from human activities 171(e) Cleaning the external surfaces of buildings to remove soluble salts
which cause decay and techniques such as ‘dry scrubbing’ for the
removal of SO2 with pulverized limestone.
(f) Judicious location of new industries.
Indoor air pollution and the effect of certain synthetic materials have
brought on adverse effects on human health. Two different conditions
have ensued.
Sick building syndrome (SBS) – usually affecting more than 25% of a
building occupants, covers persistent non-specific symptoms (irritation
of the eyes any respiratory passages, headaches, chronic fatigue, etc.)
which stop when the persons affected leave the building. SBS is often
diagnosed based on the exclusion of other identifiable illness. Causes of
SBS are yet to be proven. Some research links it to man-made mineral
fibres amongst others, and SBS appears more common in buildings
which are air tight and have been built in the 1960–1980 period.
Indoor air quality is certainly a factor and number of factors have been
identified in respect of basic requirements:
• thermal acceptability;
• normal concentration of respiratory gases;
• dilution and removal of contaminants and pollutants to acceptable
levels.
Amongst contaminants considered are: combustion products, chemicals,
respirable particulate, radio-nucleates and microbiological agents
(indoor bioaerosols).
Building-related illness (BRI) – is the clinically diagnosed disease of
building occupants resulting from exposure of indoor air pollutants.
BRI persists for a relatively prolonged time after the sufferers leave the
building.
Excessive exploitation of natural resources and
inappropriate land development
The effects of the climate warming are more and more visible:
• Europe’s alpine glaciers are melting and the US Government predicts
that by 2030 there will be no more glaciers left in Montana.
• Low-lying lands and islands are threatened by the rising sea levels.
• Heat waves are causing rising death tolls in cities like Chicago,
Athens, and New Delhi.
• Wildlife such as coral reefs or North Pacific salmon are dwindling.
• Extreme weather such as super hurricanes like Mitch or Floyd is
becoming commonplace.
189.
172 Man-made DisastersIn 1988, an Intergovernmental Panel on Climate Change was created
in Geneva to form national and international polices aimed at reducing
energy use in order to have less pollution. The current solution is to
call on governments and businesses accounting for large power consumption to take responsibility for a major change in energy use.
As around 25% of the world’s population living in the industrialized
nations consume about 80% of the world’s energy, developing nations
have been looking to the industrialized ones to take the lead in cutting
carbon dioxide, but it is expected that the developing countries will
overtake the developed ones in 20–30 years time in energy
consumption.
With the Rio Agreement in 1990 and Kyoto in 1995, there has been
positive move towards reducing greenhouse gases and a legally
binding timetable to make cuts by 2010 has been undertaken by the
‘rich’ nations. At the same time, scientists have been reluctant to
fully underwrite the current theories for the causes behind global
warming and climate change on the basis that further analysis and data
will be needed. Consequently, introducing effective measures is somewhere between the short-term political agenda of governments who
want to be seen to make electoral progress and the long-term agenda
of scientists who require sound scientific reasons before deciding on
solutions.
Inappropriate land development and building
The current environmental predicament calls for global coordination of
the development to redress the ecological balance and changes in the
acceptable standards of construction and manufacturing of building
materials. Complex legislation at European level as well as international
agreements has been focusing on achieving an integrated approach to
environmental protection and enhancement.
Sustainable development – The development focusing on meeting
the needs and improving the life of the world’s population without
depleting the natural resources beyond the environment’s capacity to
supply them – has been identified as an essential consideration. Urban
planning, transport, waste energy consumption and water management
are important aspect of the sustainable development concept.
Green buildings and materials represent the means to mitigate the current environmental problems and their use an important step in preventing future disasters. Examples of ‘green’ products are:
• Products made from environmentally helpful materials such as
salvaged materials, rapidly renewable, natural or requiring minimal
processing.
• Environmentally aware products such as alternatives to ozone depleting
products, PVC, preservatives, etc.
190.
Disasters resulting from human activities 173• Products that reduce the impact of new construction, demolition, or
renovation.
• Equipment facilitating the conservation of energy and water.
• Products that contribute to a safe healthy indoor environment.
• Products that prevent pollution and reduce waste.
• Systems and equipment employing renewable energy.
Contamination of the food chain and environment
Case study – The cyanide spill at Baia Mare, Romania
(Source: The UNEP/OCHA Report on the Cyanide Spill at Baia
Mare, Romania compiled by a team of 20 scientists during the
period 23 February to 6 March 2000)
The accident
On 30 January 2000, at 22:00 hours, there was a break in a dam encircling a tailings pond at a facility operated by Aurul SA Company in Baia
Mare, northwest Romania. The result was a spill of about 100 000 m3 of
liquid and suspended waste containing about 50–100 tonnes of cyanide,
as well as copper and other heavy metals.
The break was probably caused by a combination of design defects in
the facilities set up by ‘Aurul’, unexpected operating conditions and bad
weather. The contaminated spill travelled into the rivers Sasar, Lapus,
Somes, Tisza, and Danube before reaching the Black Sea about 4 weeks
later (see Fig. 8.4).
Some 2000 km of the Danube’s water catchment area was affected by the
spill. Romanian sources said that, in Romania, the spill caused interruptions to the water supply of 24 municipalities, and costs to sanitation
plants and industries, because of interruptions in their production
processes. Romania also reported that the amount of dead fish was very
small in Romania. Hungary estimated the amount of dead fish in
Hungary at 1240 tonnes. Yugoslavian authorities reported large amounts
of dead fish in the Yugoslavian branch of the Tisza river and no major
fish kills in the Danube river.
On 18 February 2000, a team of international experts were requested to
carry out a mission to analyse the damages caused by the spill. The mission, a joint venture of UNEP and OCHA, lasted from 23 February to
6 March undertook sampling, analysis, and discussions with national
and local experts, national authorities, affected populations and NGOs.
Its findings are summarized below.
Baia Mare and Maramures County
Maramures County, where the town of Baia Mare is located, lies at
Romania’s northwestern border with Ukraine and Hungary. It has a long
history of mining, especially in gold, silver, lead, zinc, copper, manganese, and salt. Waste at the county’s seven key mining sites is stored
191.
12
3
2
Budapest
BAIA MARE
3
1
Hungary
4
4
Romania
5
9
6
Belgrade
7
5
11 February
It crosses the Hungarian
Yugoslavian border
6
13 February
The plume reaches Belgrade
(Perlez), Yugoslavia
7
15 February
It meets the Romanian
border again at ram
8
17 February
Cyanide shows up in tests
at Iron Gate, Romania
9
25–28 February
The plume reaches the
Danube Delta
Bucharest
8
Yugoslavia
Sources: MTI, Ministry for Environmental Protection (Hungary) Environmental Inspectorate, UNEP.
Fig. 8.4
Map of Romania showing spread of cyanide spill. © UNEP.
30 January 2000
Cyanide spill occurs at
BAIA MARE, Romania
1 February
Spill plume reaches
Romanian Hungarian border
5 February
Cyanide registers in tests
at Tiszalok
9 February
Spill plume reaches Szolnok
174 Man-made Disasters
Progress of the spill plume
Spread of the cyanide spill from Baia Mare, Romania
192.
Disasters resulting from human activities 175in ponds and 215 waste (‘tailings’) dams. The county has high levels of
chronic (‘persistently recurring’) soil, water, and air contamination that
comes from many pollutants. These were released over decades of past
industrial activities that used environmentally unsound technologies which
included an old lead smelter, copper smelter, sulphuric acid plant, and the
operations of the mining company, Romanian Compania Nationala a
Metalelor Pretioase si Neferoase (Remin), established in 1992.
Some Baia Mare residents live within 50 m of highly toxic, chronically
leaking, waste sites. The World Health Organization (WHO) identifies
Baia Mare as a health risk hotspot, with the population’s exposure to
lead being among the highest ever recorded. Lead in the blood of some
adults averages almost 2.5 times above safety levels. In some children,
it averages nearly six times above safety levels. High lead levels in
humans are now thought to be associated with impaired learning ability,
mental retardation, problems with kidney and neurological functions,
hearing loss, blood disorder, hypertension, and death. Baia Mare residents have complained about dust from industrial processes for some
time. It is also important to know that the city of Baia Mare’s population
and urban development are growing, with expansion restricted in some
areas by old contaminated tailings ponds.
The company: Aurul SA
Aurul SA is a stock company jointly owned by Esmeralda, Exploration
Limited, Australia, and Remin, Romania.
Over a 7-year period, Aurul obtained all of the necessary environmental
permits required under Romanian law for its plant in Baia Mare, before
beginning operations in May 1999. It was hoped that the Aurul project
would meet the needs of both the Romanian authorities and the
Australian investors. Aurul would gain profits through its mining operations and local authorities would benefit from Aurul’s management and
removal of Baia Mare’s old contaminated ponds, which blocked further
development in the city.
The process and technologies used at the Baia Mare plant for recovering
precious metals were completely new to Romania and were expected to
be the most modern, safe, and efficient in the region and a major environmental improvement. The Baia Mare plant was designed to process
2.5 million tonnes of tailings per year – to recover about 1.6 tonnes of
gold and 9 tonnes of silver per year. The project was to last 10–12 years,
although this may increase due to recent business deals made with
Romanian companies. The tailings, originating from earlier mining
activities and stored next to Baia Mare, contain small amounts of precious metals, especially gold and silver. Aurul’s process uses high concentrations of cyanide to remove the precious metals from the tailings.
As part of the process, tailings are transported 6.5 km away from Baia
Mare to a new dam near Bozanta Mare village. The process was
193.
176 Man-made Disastersdesigned to release no waste to the surrounding environment, but it has
not been possible to determine how often the plant had been inspected
by government authorities before the spill occurred. Soon after operations
began in 1999, however, two leaks were reported in Aurul’s pipeline
system.
Facts on dangerous substances
Cyanide
Cyanide is acutely and almost instantaneously poisonous (‘toxic’) to
living organisms, including humans. Cyanide harms by blocking the ingestion of
oxygen by cells. Acute effects include rapid breathing, tremors, effects on the
nervous system, and ultimately, death. Chronic effects include weight loss,
effects on the thyroid and nerve damage.
Fish are about one thousand times more sensitive to cyanide than humans. If fish
do not die from limited exposure, they can still have reduced swimming ability,
problems in reproducing (possibly creating deformed babies), and increased vulnerability to predators. Fish are excellent in gauging the presence of cyanide in
water – if fish are living after exposure, then no other form of life have been
harmed.
Cyanide, however, does not remain in the environment for long and does not
accumulate in sediments or organisms (including humans).
Heavy metals
Heavy metals do not break down and are ‘bio-accumulative’ in plants, animals and
the environment. This means that the level of toxins builds up in an organism over
time, increasing its toxicity and threat to local ecosystems.
Toxins may also be passed on to other species if a toxic organism is eaten.
Therefore, living organisms face high risks with long-term and chronic exposure
to heavy metals.
Among the heavy metals used by mining industries, the most harmful to humans
include arsenic, cadmium, lead, nickel, manganese and molybdenum, even at
small doses. Zinc, lead, aluminum, boron, chromium, and iron are also all toxic
to plant growth.
The acute and chronic effects of copper to humans include stomach and intestinal distress, liver and kidney damage and anemia. Copper is also toxic to most
aquatic plants, often contained in river sediments. Copper easily dissolves in
water so it is more available for uptake by living things along rivers.
At relatively low levels, health effects from lead can include interference with
red blood cell chemistry, delays in normal physical and mental development in
babies and young children, chronic exposure to lead has been linked to brain and
kidney disease and cancer in humans.
194.
Disasters resulting from human activities 177Cause of accident
The breakage in the Aurul dam was partially caused by heavy rains and
rapidly melting snow that made the water level in the pond rise. This rise
was quicker than the rise of the dam which was intended to ‘grow gradually over time’ as additional tailings accumulated. The newly engineered dam system therefore failed under the circumstances, and this
could have been foreseen.
There were no plans to deal with such a rise in water or to catch overflow
wastewater. A completely closed operation with no discharges to the
environment was thus not possible under the conditions. Furthermore, the
operation was actually open at two points, at the old and the new ponds,
which allowed unmonitored amounts of cyanide to be regularly lost into
the air and/or groundwater. At the same time, Aurul was operating in line
with government permits. Under Romanian law, the plant and ponds, categorized as ‘regular’ risk, did not require any special emergency planning
or monitoring to detect dangerous situations. Accident plans did exist, but
were not sufficient. The mission therefore believed that both the company
and local authorities had inadequate plans and responses in place for
emergencies, considering the large quantities of hazardous materials
being used close to human populations and the river system.
Government response
In Romania, about 10 h were lost between the time the Baia Mare
Environmental Protection Agency received notification of the spill from
Aurul and the time the local Romanian Waters Authority was informed.
As a result, local residents near the source of the spill were not informed
as early as possible.
Once the Romanian Water Authority was informed, however, their
regional environment and water authorities immediately checked information about the breach and the spill to determine the degree of pollution, and ordered Aurul to stop activities and close the breakage and
timely information exchange and measures taken by the Romanian,
Hungarian, and Yugoslavian authorities, including a temporary closure
of the Tisza lake dam, reduced the impact of the spill.
Environmental assessment
The assessment of the impacts of the spill on the environment is taken
from three main sources: (i) background reports by the affected countries; (ii) monitoring of impacts, by the affected countries, as the cyanide
wave travelled downstream; and (iii) information collected by the
UNEP/OCHA mission. The methods used to analyse cyanide and heavy
metals in each of the three countries produced comparable data according to international standards.
Surface water. In general, the data show that concentrations of cyanide
and heavy metals decreased rapidly with increasing distance from the
195.
178 Man-made Disastersspill. Regarding cyanide, acute effects occurred along long stretches of
the river system down to where the Tisza and Danube rivers meet. Water
plankton (plant and animal) were completely killed when the cyanide
plume passed and fish were killed in the wave or immediately after. Soon
after the plume passed, however, plankton and aquatic microorganisms
recovered relatively quickly (within a few days) due to unaffected water
coming from upstream. As a result, the mission concluded that muddwelling organisms in the lower Tisza and middle Tisza regions in
Hungary and Yugoslavia were not completely destroyed by the cyanide
spill beyond quick recovery.
However, the situation in the upper Tisza (north of Tokaj, Hungary) is
more complex. Parts of the Tisza region had been damaged before
the cyanide spill by years of chronic pollution (i.e. heavy metals) and
dam building. Pollutant safety levels had also often been exceeded.
The region has many poorly maintained and operated industrial plants
and ponds containing cyanide and/or heavy metals, many of which
are leaking continuously. Chronic pollution is also high from sewage
and agriculture. Pollution of surface water, groundwater, and soils is
thus likely to re-occur.
In comparison to surface water, the data show a less negative impact on
the ecosystem from sediment pollution. The spill drastically increased the
existing heavy metal contamination (especially copper, lead, and zinc) of
sediments in WHO guidelines available on acceptable standards of
cyanide. However, heavy metal contamination then dropped rapidly with
increased distance from the source. Therefore, the resulting toxic effects
on the aquatic ecosystem may not have moved far downstream. At the
same time, many river areas downstream were found to have concentrations of heavy metals in their sediments, including some tributaries that
were not even affected by the spill. This was especially true in the
Baia Mare area but also further downstream in Hungary. These hotspots
were probably caused by past industrial, sewage, and agricultural activities over a long period of time. The result is that sediment quality is
already at a stage where adverse toxic effects on the aquatic ecosystem
may occur.
Drinking water. In Romania, the village of Bozanta Mare near the Aurul
plant has private wells that are shallow and connected with the river.
They are thus highly vulnerable, especially to pollution from the Aurul
pond, which is in the water catchment area of the wells. The wells were
affected by the spill with cyanide levels nearly 80 times over permissible limits on 10 February. By 26 February, cyanide concentrations fell
below limits but the concentrations of cadmium, copper, manganese, and
iron were higher than admissible Romanian values. Also, the mission
found ongoing pollution from human waste and an excessive use of agricultural fertilizers.
196.
Disasters resulting from human activities 179Further downstream from Bozanta Mare, along the river Somes, the drinking water does not appear to be at risk. Nevertheless, most wells are also
shallow and vulnerable to surface pollution. Consequently, in Romania,
immediate human health risk seems to be minimal from the spill, although
chronic health impacts due to long-term pollution by heavy metals are
possible. Also, there is usually no water monitoring of private wells in
Bozanta Mare, or groundwater monitoring downstream of Bozanta Mare,
except in Satu Mare.
In Hungary, contaminated drinking water is not expected to be a longterm effect of the mining accident. Neither cyanide nor heavy metals
were found in the water of Hungary’s deep wells, which are well protected against surface pollution, with probably no connection between
the river Tisza and deep groundwater. Hungarian public water supply
systems were also not endangered by the cyanide pollution.
In Yugoslavia, the Becej public water supply system and two assessed
private wells were not affected by the spill.
Lessons learned
The following recommendations from the UNEP/OCHA report were
intended to mobilize and assist local governments and the people in the
affected areas in their efforts to reduce the negative effects of the industries around them.
1. Information – There is a great need for more objective and reliable
information, especially from local authorities and the media. The
spill and mission showed that the level of public knowledge of toxic
chemicals, and future risks from mining and related industrial
processes, is very low. At the same time, people in the Baia Mare area
were well aware that soil and groundwater had been polluted before,
and that pipes transporting tailings had broken on several occasions,
spilling water containing cyanide outside of industrial areas.
2. Communications – Communication between local authorities, NGOs
and the public, concerning preparations for emergencies and damage
prevention options, is poor. Communications channels should be
improved and NGOs and other interest groups should help to inform
the population.
3. Health – The long-term effects of mining activities on public health,
especially by cyanide and heavy metals, is a key concern, especially
in Bozanta Mare and Baia Mare, as are dust problems in the summer.
4. Assessments – At Aurul SA, a full risk assessment of operations
should be done to make them safer. An emergency plan for the
improved system should also be produced and made fully accessible
to workers and local stakeholders. The organisational responsibilities
off-site for dealing with a future dam breakage should be clear and
dependable early warning systems should be established, especially
for Baia Mare.
197.
180 Man-made Disasters5. Sediment analysis – Further analysis of the heavy metals in river
sediments is urged in all three countries (especially at Aurul SA), to
make a reliable assessment of the long-term risks of the spill and
chronic pollution. Sediment quality was already found threatening
to many local aquatic ecosystems.
6. Drinking water – Improvements should include surveys to plan and
develop new water resources (Baia Mare and along Somes river)
and new monitoring systems for groundwater and private wells by
local authorities. An inventory of current private wells (Romania,
Hungary, Yugoslavia) and an inventory of polluted areas that endanger groundwater, surface, and drinking water (entire river basin)
should be created. Emergency water supplies should be available to
the region, a health survey of the population in affected areas should
be drawn up and proper monitoring of diseases caused by water pollution should be established. Finally, the drinking water supply systems for private households in Maramures County should be
changed to public collective systems along with required sewage
treatment facilities.
7. Biodiversity – Multinational monitoring of the long-term ecological
effects of the spill on the region’s biodiversity, especially birds,
mammals, and water vegetation, is urged.
8. Regional industries – An inventory and risk assessment study of all
mining and related industries in Baia Mare and the entire Maramures
region, including abandoned sites, should be made. Dams containing
toxic waste or other liquids should have retention systems for
overflow or accidents resulting from breaks in dams. Plants using
cyanide should pay special attention to preparing for emergencies,
public communication, and special monitoring and inspection by
authorities.
9. Local economies – The longer-term economic implications of the
spill and other polluting activities in the region need to be assessed.
Maramures County, rich in mining and related industries, is of key
economic importance to Romania. But it can create environmental
problems downstream in areas dependent on the environment for
fishing, tourism, agriculture, and other economic activities. Many
workers and businesses in the area are concerned about a loss of
markets, as the image of products from the region has greatly suffered as a result of the spill (i.e. consumer fear of contaminated
food).
10. Regional plans – There is a strong need for a broad, longer-term
environmental management and sustainable development strategy
for both Maramures County and the entire water catchment area of
the Tisza river. This should address mining and related industries,
other economic activities, cross-border economic development, biodiversity, social needs, and increased international cooperation and
support.
11. International objectives – Romania should sign the international
UN/ECE Convention on the Trans-boundary Effects of Industrial
198.
Disasters resulting from human activities 181Accidents, and there should be an international system for addressing the issues of liability and compensation related to such spills
and their consequences. Moreover, there is a need for intensive and
ongoing dialogue between members of the mining industry and
governments to come to more secure and safe management practices in mining. This is especially so among those industries dealing
with reservoirs containing hazardous and highly toxic substances
such as cyanide.
199.
This Page Intentionally Left Blank200.
9Historic buildings destruction
Earthquakes, storms, or hurricanes do not discriminate between
famous landmarks or bus shelters, centuries old masterpieces or commercial hoarding. They have no regard for history, family heirlooms,
or national treasures. While the death toll and material loss caused by a
disaster are immediately apparent, the long-term effect of losing the
historical frame work of our lives and culture is perhaps the most
difficult loss to come to terms with in the aftermath of a disaster. When
disaster strikes the first priority is to survive, but having done so, the
destruction of familiar landscape and landmarks put our predicament
into perspective.
Natural disasters such as the major storms, which hit northern France
in December 1999, have completely changed its landscape. Winds of
over 100 mph, lashed out at The Notre Dame Cathedral, Palace of
Versailles, and the Mont St. Michel Abbey, which lost some of their former glory, but these paled into insignificance compared to the effect on
the landscape of 300 million trees being felled by the storms! Some were
young and some were hundreds of years old, 12 ft in circumference,
weighing 10 tonnes, they were all pulled out and thrown about like
matchsticks.
An entire building with all its contents, art objects, and royal treasures
part of our national that were identity were lost in the fire at Windsor
Castle. The loss is irreversible, despite the magnificent rebuilding and
restoration.
Man’s intervention can be equally destructive. Wars, greedy property
development, demolition, vandalism, and neglect have been the cause of
losing more historic buildings than many earthquakes and hurricanes put
together. The problem is vast and it has been the subject of continuous
international concern for a long time.
Here, we can only attempt to identify some of the general issues and
establish guidelines for the protection of historic buildings from the
threat of natural and man-made disasters.
201.
184 Man-made DisastersGeneral issues
Vulnerability
Many historic buildings that have survived natural and man-made
calamities over the years, are considered ‘safe’ simply because they are
still there. To a certain extent, this is supported by the fact that local vernacular and craftsmanship have adapted over the years to meet the specific local conditions (wind, rain, snow, earthquake, etc.) as efficiently as
possible. However, a number of aspects should be considered:
• Old buildings become weakened by each experience and if not protected they eventually collapse.
• Similarly, if conditions change, for example, water tables have moved,
trees have been cut, surrounding areas built on, the reaction of the
ground and of the old structure will differ.
• Some of these buildings are converted and ‘modernized’ in ways
which can weaken or alter their structural equilibrium or introduce
new dangers (electrical faults, gas explosions, etc.).
• Change of use can also alter the dead weight of the building (furniture,
office equipment, etc.) which will alter the building’s reaction to
stresses such as earthquake.
• Some building materials suffer irreversible morphological changes in
time and this will alter the way in which the structure responds to strain.
Specific type of damage
Old buildings are subjected to the same stresses as new ones, but they
can react differently not only because of their age but also because of the
way they have been constructed. Areas of particular concern are highlighted below.
Earthquake damage
Vibration damage – some old buildings are not securely fastened to the
ground or the structural frame and can be literally be shaken to pieces,
pulled off the ground, or slide off their foundations.
Foundation failure – result this may in partial or total collapse due to
ground displacements, or liquefaction will affect those old buildings
whose original foundations have been eroded or become inadequate
due to changing circumstances.
Failure of non-reinforced masonry – this happens because of poor resistance to side to side motions. This usually occurs as a result of insufficient connections between floors and roofs, floors, and walls which
causes walls to deflect and collapse. The lack of steel or other reinforcement in the walls causes them to crack diagonally and buckle.
Old lime mortar which has lost its bonding strength can also contribute to failure.
Failure due to an irregular shape – old buildings often have asymmetrical
plan shapes as a result of diverse transformations and additions that
took place over the years. This induces different inertia loads, which
can have catastrophic effects in an earthquake.
202.
Historic buildings destruction 185Storm, hurricane, tornado damage
Roof damage – this is a common occurrence when old buildings are hit
by strong winds. Depending on the strength of the storm, the suction
effect can range from roof tiles being stripped off to an entire roof
being lifted. This is usually the result of poor maintenance and weak
ties to the structure.
The effect of pressure – the difference between a sudden drop in outside
pressure and the higher one inside, can cause the higher pressure inside
to effectively ‘explode’ the building, with spectacular effects, especially
if the building is of light timber frame and boarding construction.
Flood damage
Water, mud and dampness – these will cause irreversible damage to historic objects and property located below flood lines. Floods and burst
pipes being somewhat more predictable than other phenomena such
as earthquakes or hurricanes, sensible storage and preventive organization can make all the difference.
Mechanical damage – this will be caused by sudden bursts of water hitting all in its path. This will easily shatter old structures and can dislodge and carry away whole parts of buildings as well as any
projecting decorative features.
Objects and substances carried by the water – these may also cause
damage. Debris, spilled heating oil, or chemicals can destroy vulnerable historic objects such as manuscripts, fabric, watercolours, etc.
Salt damage – seawater brought by wind surges and high tides pose the
added problem of salt damage to the building fabric and the danger of
permanent dampness.
Fire damage
Historic buildings frequently contain added fire risks such as:
Combustible materials – the structural elements are often constructed of
highly combustible materials. Old, dry timber frames and staircases
burn easily and much of the irreplaceable contents catch fire rapidly.
Floor wax polish or wall fabrics enable flames to spread almost
instantaneously. The Windsor Castle fire was started by a heated light
placed too close to curtains.
Antiquated services and fittings – factors such as electrical wiring, cooking ranges or heating appliances, open fires, and unswept chimneys,
all add to the fire danger.
Lack of fire compartmentation – in old buildings, the lack of fire compartmentation facilitates the rapid spread of fires from one room to the
rest of the building.
Neglect, vandalism, and theft
Man’s indifference and abuse of historic buildings closely rivals natural
disasters in numbers lost. The process is gradual and therefore, its extent
is more difficult to detect. Lack of maintenance and funds, delays or
failure by authorities and owners to intervene in time allow degradation
203.
186 Man-made Disastersto escalate. Neglected buildings are vulnerable to break in by ‘architectural salvage’ operators. First to go are the lead roofing, decorative fittings, fire surrounds, ironmongery, then panelling, doors, windows, etc.
Once the rainwater can make its way in, the whole fabric becomes damp,
mortar disintegrates, frost dislodges masonry, and progressive collapse
sets in.
Homeless people may take shelter overnight, light a fire which spreads
to the roof and floor timbers and what was a historic place becomes
a ruin.
The Eltham Orangery case study below, illustrates an all too common
example of how such a process can lead to near loss of a unique building, giving an idea of the high cost and painstaking effort involved in
restoring such a building, all of which could have been avoided with
reasonable preventive maintenance and monitoring.
Vandalism and neglect
Case study – Eltham Orangery (Contributors: Rena Pitsilli-Graham,
Caroe & Partners, and Freeman Historic Properties)
History and description of the building
The Eltham Orangery is an early seventeenth century structure that was
originally part of Eltham House. It is believed that the Orangery was
built by Colonel Petit, who after a distinguished army career, retired to
Eltham. The house was situated on what is now Eltham High Street, in
the London Borough of Greenwich. The Orangery was built against the
rear garden wall facing south. The early seventeenth century was a
period of horticultural interest and experimentation and there is evidence
to suggest that Colonel Petit and his circle were keen followers of developments in this field.
The Orangery may be the work of the architect John James, architect to
St. George’s Church, Hanover Square, where similarities with the
Orangery can be seen in the architectural details. John James is also
reported to have taken a keen interest in horticulture and garden design,
and to have translated French gardening books.
The Orangery is a handsome building with impressive architectural features (see Fig. 9.1); The main South elevation is faced with fine-gauged
brickwork, with Portland stone dressings, which bear military decorations, evidence of Colonel Petit’s career. The rear elevation, which
formed the original garden boundary wall and the flank walls, are constructed with ordinary stock brickwork (see Fig. 9.2).
Case history
The building has lain derelict since the house was demolished. There are
reports that it lost its parapets early on, with oral history suggesting that
204.
Eltham Orangery – South elevation. © Caroe & Partners.Historic buildings destruction 187
Fig. 9.1
205.
188 Man-made DisastersFig. 9.2
Eltham Orangery – before
restoration. © English Heritage.
they were taken down for use in someone’s garden. In the 1970s, it was
taken over by the local authority, the London Borough of Greenwich and
there have been several unsuccessful attempts to find a use for it. The
building is listed grade II*.
Over the recent years, it has suffered from mindless vandalism and
neglect, with increasing intensity. A fire set inside the building in 1978,
by vandals burned the roof down and charred the windows (later replacements) but also the original, carefully detailed panelling on the reveals on
206.
Historic buildings destruction 189the central doorway. A prospective developer was allowed by the authorities administering the listed building control legislation to take up the
stone floor of the Orangery, on the basis of investigations into the footings
of the building; a completely unnecessary and destructive operation as
trial holes in limited areas would have been sufficient for the purpose. In
this case, ignorance and lack of understanding of the value of the historic
fabric, contributed to the erosion of the integrity of the building.
During its ownership of the building, the local authority has been reluctant to expend any money on securing or repairing the building, the only
exception being the introduction of a scaffold supporting a temporary
roof, to protect the building after the fire. Without the restraint afforded
by the roof timbers, the walls of the building were now in danger of
spreading, outwards. The scaffold provided a brace for the rear and front
walls and allowed protective polythene sheeting to be wrapped around
the building (see Fig. 9.3). A timber hoarding was also erected around
the site but this proved ineffective against intruders.
In 1995, encouraged by English Heritage, Freeman Historic Properties
expressed an interest in acquiring the building, undertaking its repair
with a view to finding a use for the building. Caroe & Partners were
appointed by Freeman Historic Properties to survey the building, prepare a schedule of work for its repair and produce drawings for extending the building. Planning permission was given in early 2000 for small
extensions on either side of the building and for office use. An estimate
of cost for the repair of the building, excluding the cost of the extension
was prepared and English Heritage offered a grant of 93.75%.
Negotiations for the transfer of the building to Freeman Historic
Fig. 9.3
Eltham Orangery – scaffold.
© Rena Pitsilli-Graham.
207.
190 Man-made DisastersProperties proved lengthy and the building remained in the local authority ownership until the middle of summer 2000.
Vandalism by local youths and vagrants seeking refuge inside the building, under the shelter of the temporary roof continued. The thin brickwork walls below the windowsills were kicked in, after Caroe & Partners
had initially surveyed the building in 1996. Major damage was caused by
the collapse of the West flank wall possibly a year or so after the demolition of the window aprons. This wall was weakened by decayed horizontal bonding timbers above the original door opening. The absence of
header bricks between the facing and core brickwork of this wall and the
lack of ties to the rear and front walls made the wall very vulnerable to
collapse. The cause was thoughtless, malicious damage, and at the same
time, there was deliberate disturbance to the remaining base stones of the
balustrade, that still remained on top of the walls.
The main damage to the West wall was discovered during a visit to site
by the architect, in the early summer of 2000. A structural engineer’s
advice was sought immediately. The local authority officers responsible
for the building were reminded that demolition under a dangerous structure notice should not be contemplated without listed building approval.
Freeman Historic Properties undertook the emergency propping of the
partly collapsed West wall. Further security measures were undertaken
with the introduction of corrugated iron sheeting screwed to the outside
scaffold and barbed wire nailed on top, in an effort to stop all unauthorized access inside the building (see Fig. 9.3). These security measures
proved to be effective.
A specification and drawings were prepared for the repair of the building and tenders were sought in the spring of 2001. The lowest tender was
considerably higher than anticipated and there followed a period of
uncertainly, while English Heritage applied to the Department of Media
Culture and Sport for the increase in funds required for the project to
proceed. In the interim, Caroe & Partners urged English Heritage to consider emergency repairs to reinstate the collapsed part of the West wall.
This would have reinstated the stability of the building and enabled it
to better withstand any possible further delays, should funding not be
forthcoming.
Instructions were issued to the appointed contractor for the rebuilding of
the West elevation, on the basis of an emergency grant. Through pure
human error, the mason on site took down the remaining part of the West
elevation still adjoining the rear wall, approximately 30% of the overall
area of the wall. Although the incident was traumatic for everyone in the
team working for the rescue of the building, including the mason himself, it is not certain that it would have been possible to save this section
of brickwork. As illustrated above, it was poorly constructed and not tied
to the rear wall.
208.
Historic buildings destruction 191Fig. 9.4
Eltham Orangery – new brickwork.
© Rena Pitsilli-Graham.
Shortly after instructions for emergency works were issued, approval
was given for an increase in the state funding of the project. A contract
was placed with the contractor for undertaking the entire project in
September 2001. Delays in the mobilization of the contractor and further
delays in the supply of hand-made bricks resulted in the first bricks
beginning to be laid in February 2002 (see Figs 9.4 and 9.5). Work is
currently continuing and the West elevation is well on the way to being
rebuilt, using original bricks salvaged from the demolition and new
hand-made bricks to match.
Fig. 9.5
Eltham Orangery – section showing
repairs and reconstruction details.
© Rena Pitsilli-Graham.
A new slated roof with lead parapet gutters will be built (see Fig. 9.6).
Photographs of the burned out roof, showing the charred timbers still in
position, and the rafter sockets still evident on the inside face of the
South wall were used to produce the drawings for the new roof. The sash
windows will be reinstated to details historically correct for the date of
the building and the new central doorway and reveal panelling will be
remade using the evidence of the damaged timbers on site. The gauged
brickwork of the front elevation is being carefully repaired including the
rebuilding of the cornices using existing sound bricks and new moulded
bricks to match (Figs 9.4 and 9.5).
The central niche, below the pediment will be carefully repaired by conservators, who will also clean the stone carvings (see Figs 9.7 and 9.8).
A new, Portland stone, bottle balustrade has been designed based on the
evidence of the base stones that had survived. The moulded stone steps
to the front of the building will be uncovered when the scaffold is struck
and completed where damaged or missing. The octagon and square pattern stone floor has now been transferred from the local authority’s
warehouse to site; sound and partially damaged stones will be reinstated,
inside the building. If funds permit new stones will be cut to complete
the floor. Completion of the works is due at the end of August 2002.
209.
192 Man-made DisastersFig. 9.6
Eltham Orangery – section showing repairs and reconstruction details. © Caroe & Partners.
210.
Historic buildings destruction 193Fig. 9.7
Eltham Orangery – new brickwork
corner detail. © Rena Pitsilli-Graham.
Fig. 9.8
Eltham Orangery – deatil of Central
Pediment looking West © Rena
Pitsilli-Graham.
Development demolition
Case study – ‘THE HOUSE OF THE PEOPLE’,
Bucharest, Romania
Occasionally, we come across destruction of epic proportion such as the
one in Bucharest, Romania where one of the city’s oldest areas, representing approximately one-sixth of the city (see Fig. 9.9) was raised to
the ground to make way for the Civic Centre development which
includes amongst others the ‘Casa Poporului’ (People’s House) and a
kilometre long boulevard of the ‘Victory of Socialism’ (see Fig. 9.10).
Seventy thousand people were forced out of their homes, 26 churches
and two synagogues were bulldozed and the Vacaresti Monastery, built
on the South bank of the river Dimbovitza in 1718 was completely
destroyed. Its thick walls were so difficult to demolish that controlled
explosion techniques had to be employed to remove it. The neighbouring sixteenth Prince Mihai Monastery was moved 279 m east, to a small
wasteland area, between high-rise block of flats.
Ceausescu, the deposed Romanian leader initiated the development in
the early 1980s, in the aftermath of a powerful earthquake, which caused
extensive damage in Bucharest in March 1977.
211.
194 Man-made DisastersFig. 9.9
Bucharest, demolished old district.
The site for the gargantuan ‘Casa Poporului’, which has the largest footprint in the world after the Pentagon, was chosen because the district’s
elevated location is reputed to have anti-seismic properties, supported by
the fact that it had escaped relatively unscathed from two major earthquakes in the last century.
The structural engineer’s brief was to ensure that the building survives
future earthquakes for at least the next 500 years! (see Vrancea case
study, Chapter 2).
Having escaped sustained bombing during the Second World War, this
largely residential district, unique in its character with a blend of traditional
features and oriental influence, has been replaced by overbearing, characterless blocks of flats, which sadly abound in this country (Fig. 9.11).
212.
lniceanuBD.Koga
1. Izvorul Tamaduirii
demolished 1984
2. Alba Postavari
demolished 1984
3. Spirea Veche
demolished 1984
4. SF. Nicolae “Sirli”
demolished 1985
5. SF.Vineri
demolished 1987
6. SF.Spiridon
demolished 1987
River
r
vo Arhivele statului
iz
Mihai
Voda
10
INST.Cantacuzino
CEC
Calea Victorie
i
Str
FAC.Biologie
Park
1
Izvorul
Tamaduirli
Curiea
Veche
BD Natiunile unite
6
SF.Spiettdon
r
o
izv
Str
P ut
Dia
Balasa
ul
a pa
re
ce
5
SF.Vineri
12
7
Olteni
Shop
SF.Ilie 11
Biblioteca
8
Schitul
Maiolor
Calea 13 Septembrie
Patriarhie
i
ve
ho
le
Ca
SF.Nicolae
Sirbu
4
BD.Marasesti
U
DA
Buour
Dobroteasa
ei
Casa Academiei hov
Ra
lea
Ca
Fig. 9.10
Bucharest, Victory of Socialism Boulevard plan superimposed on the old town plan.
sti
9
SF.Treime
Bradu
Staicu
Historic buildings destruction 195
a
aR
BD.Dimitrie Cantemir
Str
DU
.De
Ur
an
Antim
Spirea
Veche
3
7. Olteni
demolished 1987
8. Bradu Staicu
demolished 1987
9. SF.Treime Dudesti
demolished 1987
10. Mihai Voda
moved 1985
11. SF.Ilie
moved 1984
12. SF.Nicolae Jitnita
demolished 1986
SF.Nicolae Jitnita
Piata
Unirll
Casa
Poporului
Alba
2
Postavari
us
cu
r
ilo
as
lar
Ca
C.
BD.I.C.Bratianu
Dimbovita
213.
196 Man-made DisastersFig. 9.11
Victory of Socialism Boulevard.
Historic buildings protection in disaster conditions
Preparedness
Lessons learned from past natural disaster’s effect on historic buildings
should form the basis for general recommendations.
• If well maintained, historic structures and their surroundings
have more chance of survival. A regular programme of repairs and
monitoring of the fabric condition will make it possible to save and
preserve old buildings. It has been shown that of the historic buildings
lost, those already in poor condition before the disaster outnumber
those in good repair, which survived with comparatively little damage.
• Availability of a written action plan when a disaster strikes, setting
priority tasks specific to the historic building in question, will be
invaluable in preventing the occurrence of irreversible damage and
loss. It will also provide valuable guidance for the ‘first on the scene’
interventions and building and engineering teams, inexperienced with
the historic aspects.
• Availability of measured surveys, records, photographs, and inventories are essential for loss assessment, repairs, and restoration. A network of public and private sources of information regarding the
monument and its contents must be identified to guide funding of
repairs and insurance claims.
• Strengthening (retrofitting) of old buildings reduces their vulnerability to specific hazards identified for their location. This can include:
– underpinning foundations;
– improving the quality of tying the roof and floor structures and to
walls;
– fireproofing and strapping together structural timbers;
214.
Historic buildings destruction 197– strapping timber frames to foundations;
– adding expanded metal reinforcement to traditional timber panels;
– reinforcing masonry by drilling and grouting reinforcement steel;
– thickening walls.
Mitigation
• Immediate intervention: in a disaster situation there is shock, panic,
and confusion. First priority is given to saving lives and general
emergency action will be concerned with putting out fires, evacuating
people to safety, and preventing looting. In these conditions, looting
and indiscriminate demolition are the biggest threats to historic buildings and their contents. The military, volunteers, and disaster relief
agencies will need guidance to ensure they can be effective in protecting cultural property.
• Emergency inspections must be made; dangerous sections made safe
and damage assessed. Specialist expertise will be necessary to diagnose historic structures and identify specific problems and solutions.
When surveying the condition of buildings, a system of colour coding
of the damage extent is widely recognized and employed:
green ⫽ usable grades 1, 2, and 3: superficial damage from almost
intact to light structural;
yellow ⫽ temporarily unusable grades 1 and 2: structural damage
from components to load-bearing walls;
red ⫽ Unusable grades 1, 2 and 3: severe structural damage, partial or
total collapse.
• Emergency protection: it is important that this is provided as soon as
possible and of as good a quality as possible, as it may be some time
before repair work can start. Valuable property must be labelled and
stored at a previously designated safe location. A conservation architect should be consulted to avoid unnecessary demolition as specialists available could be reluctant to take responsibility for keeping a
partially collapse building. There are a number of international volunteer organizations such as Architectes sans Frontières or Architectes
de L’Urgence in France who aim to provide immediate help in disaster
conditions.
Management
• Legislation and the implementation of comprehensive systems for the
prevention and mitigation of future disasters would be principal concerns. The following aspects are:
– raising public awareness;
– introducing building control standards adapted to enable old buildings to cope with specific disaster threats;
– providing the means to enable cooperation and coordination of the
different ‘first at the scene’ intervention teams.
• Ensuring that appropriate skills and materials are available before
commencing repairs is an important consideration before embarking
on repairs
215.
198 Man-made Disasters• Instituting financial incentives and funding aimed specifically at
covering the additional costs involved in pre-disaster consolidating of
historic buildings or post-disaster repairs
• Incorporating historic buildings considerations in local and national
emergency procedures.
216.
Appendices217.
218.
Emergency action checklists and fact sheetsEarthquake emergency checklist
(Source: FEMA fact sheet)
1. Find out if your property is at risk from earthquake. Check with your
local building official, city engineer, or planning department. They
can tell you whether you are in an earthquake hazard area and give
you further advice about how to protect yourself and your house and
property from earthquakes.
2. Take steps to provide the necessary protection. Earthquake protection
can involve a variety of changes to your house and property varying
in complexity and cost.
(a) Large-scale structural alterations or consolidation work, which
must be carried out only by a specialist building contractor under
the supervision of a professional such as a structural engineer or
architect.
(b) Small-scale measures to improve safety such as:
• secure tall and heavy furniture such as bookcases to the walls
to prevent them topple over;
• distribute heavy or dangerous substances at lower levels in fastened cupboards;
• secure water heaters, gas and oil containers;
• keep gas pipes and electrical wiring in good repair as they are
a potential source of fire.
3. Establish safety procedure.
(a) Identify safe places inside your building and outdoors:
• inside the building: under sturdy furniture, away from where
glass could shatter, against an inside wall doorframe;
• outside: away from buildings, trees, overhead roads, and cables.
(b) Work out a basic family action plan:
• make sure everybody knows how to call emergency services,
switch off gas, electricity, etc.;
• have disaster kit prepared (torch, first-aid kit, emergency food
and water, dust mask, battery radio, etc.);
• work out how to communicate if event happens while the family dispersed at work, school, etc.;
• have a ‘contact’ (friend, relative) in a safer area to call for news
and keep in touch.
219.
202 Appendices4. What to do during an earthquake
(a) Inside: take cover under a sturdy piece of furniture such as a
heavy desk or against an inside wall and avoid leaving the building during the shaking when the danger of heavy objects or
masonry falling on you is high.
(b) Outside: move away from buildings, overhead structures, cables,
etc. and stay in the open until the shaking stops.
5. What to do after an earthquake
(a) Beware of aftershocks, secondary tremors, which may bring
weakened structures down; they can occur soon after the earthquake, but also days or even months later, so avoid damaged
buildings.
(b) Help people in need or injured, but do not move those seriously
injured, call for help.
(c) Listen for emergency information to find out when it safe to
return home.
220.
Emergency action checklists and fact sheets 203Flood emergency checklist (Fact sheet: Floods and flash
floods; Source: http://www.fema.gov/library/floodf.htm)
Mitigation pays. It includes any activity that prevents an emergency,
reduces the chance of an emergency happening, or lessens the damaging
effects of unavoidable emergencies. Investing in mitigation steps now,
such as constructing barriers such as levees and purchasing flood insurance will help reduce the amount of structural damage to your home and
financial loss from building and crop damage should a flood or flash
flood occur.
Before
1. Find out if you live in a flood-prone area from your local emergency
management office or Red Cross chapter.
2. Ask whether your property is above or below the flood stage water
level and learn about the history of flooding for your region.
3. Learn flood-warning signs and your community alerts signals.
4. Request information on preparing for floods and flash floods.
5. If you live in a frequently flooded area, stockpile emergency building materials.
6. These include plywood, plastic sheeting, lumber nails, hammer and
saw, pry bar, shovels, and sandbags.
7. Have check valves installed in building sewer traps to prevent floodwaters from backing up in sewer drains. As a last resort, use large
corks or stoppers to plug showers, tubs, or basins.
8. Plan and practise an evacuation route.
9. Contact the local emergency management office or local American
Red Cross chapter for a copy of the community flood evacuation
plan. This plan should include information on the safest routes to
shelters. Individuals living in flash flood areas should have several
alternative routes.
10. Have disaster supplies on hand.
• flashlights and extra batteries;
• portable, battery-operated radio and extra batteries;
• first-aid kit and manual;
• emergency food and water;
• non-electric can opener;
• essential medicines;
• cash and credit cards;
• sturdy shoes.
11. Develop an emergency communication plan.
12. In case family members are separated from one another during floods
or flash floods (a real possibility during the day when adults are at
work and children are at school), have a plan for getting back together.
13. Ask an out-of-state relative or friend to serve as the ‘family contact’.
After a disaster, it is often easier to call long distance. Make sure
everyone in the family knows the name, address, and phone number
of the contact person.
221.
204 Appendices14. Make sure that all family members know how to respond after a
flood or flash flood.
15. Teach all family members how and when to turn off gas, electricity,
and water.
16. Teach children how and when to call 9-1-1, police, fire department,
and which radio station to tune to for emergency information.
17. Learn about the National Flood Insurance Program.
18. Ask your insurance agent about flood insurance. Homeowners’
policies do not cover flood damage.
During a flood watch
• Listen to a batter-operated radio for the latest storm information.
• Fill bathtubs, sinks, and jugs with clean water in case water becomes
contaminated.
• Bring outdoor belongings, such as patio furniture, indoors.
• Move valuable household possessions to the upper floors or to safe
ground if time permits.
• If you are instructed to do so by local authorities, turn off all utilities
at the main switch and close the main gas valve.
• Be prepared to evacuate.
During a flood
1. If indoors:
• Turn on battery-operated radio or television to get the latest emergency information.
• Get your pre-assembled emergency supplies.
• If told to leave, do so immediately.
2. If outdoors:
• Climb to high ground and stay there.
• Avoid walking through any floodwaters. If it is moving swiftly,
even water 6 inches deep can sweep you off your feet.
3. If in a car:
• If you come to a flooded area, turn around and go another way.
• If your car stalls, abandon it immediately and climb to higher ground.
Many deaths have resulted from attempts to move stalled vehicles.
During an evacuation
• If advised to evacuate, do so immediately.
• Evacuation is much simpler and safer before floodwaters become
too deep for ordinary vehicles to drive through.
• Listen to a battery-operated radio for evacuation instructions.
• Follow recommended evacuation routes – shortcuts may be blocked.
• Leave early enough to avoid being marooned by flooded roads.
After
1. Flood dangers do not end when the water begins to recede. Listen to
a radio or television and do not return home until authorities indicate
it is safe to do so.
222.
Emergency action checklists and fact sheets 2052. Remember to help your neighbours who may require special
assistance – infants, elderly people, and people with disabilities.
3. Inspect foundations for cracks or other damage.
4. Stay out of buildings if floodwaters remain around the building.
5. When entering buildings, use extreme caution.
• Wear sturdy shoes and use battery-powered lanterns or flashlights
when examining buildings.
• Examine walls, floors, doors, and windows to make sure that the
building is not in danger of collapsing.
• Watch out for animals, especially poisonous snakes that may have
come into your home with the floodwaters. Use a stick to poke
through debris.
• Watch for loose plaster and ceilings that could fall.
• Take pictures of the damage – both to the house and to its contents –
for insurance claims.
6. Look for fire hazards.
• Broken or leaking gas lines.
• Flooded electrical circuits.
• Submerged furnaces or electrical appliances.
• Flammable or explosive materials coming from upstream.
7. Throw away food – including canned goods – that has come in contact with floodwaters.
8. Pump out flooded basements gradually (about one-third of the water
per day) to avoid structural damage.
9. Service damaged septic tanks, cesspools, pits, and leaching systems
as soon as possible. Damaged sewage systems are health hazards.
Inspecting utilities in a damaged home
1. Check for gas leaks – if you smell gas or hear blowing or hissing
noise, open a window and quickly leave the building. Turn off the gas
at the outside main valve if you can and call the gas company from a
neighbour’s home. If you turn off the gas for any reason, it must be
turned back on by a professional.
2. Look for electrical system damage – if you see sparks or broken
or frayed wires, or if you smell hot insulation, turn off the electricity
at the main fuse box or circuit breaker. If you have to step in water
to get to the fuse box or circuit breaker, call an electrician for advice.
3. Check for sewage and water lines damage – if you suspect sewage
lines are damaged avoid using the toilets and call a plumber. If water
pipes are damaged, contact the water company and avoid the water
from the tap. You can obtain safe water by melting ice cubes.
223.
206 AppendicesFact sheet: hurricanes and tornadoes (Source:
http://www.fema.gov/library/hurricaf.htm)
Hurricanes can be dangerous killers. Learning the hurricane warning
messages and planning ahead can reduce the chances of injury or major
property damage.
Before
1. Plan an evacuation route.
2. Contact the local emergency management office or American Red
Cross chapter, and ask for the community hurricane preparedness
plan. This plan should include information on the safest evacuation
routes and nearby shelters.
3. Learn safe routes inland.
4. Be ready to drive 20–50 miles inland to locate a safe place.
5. Have disaster supplies on hand.
• flashlight and extra batteries;
• portable, battery-operated radio and extra batteries;
• first-aid kit and manual;
• emergency food and water;
• non-electric can opener;
• essential medicines;
• cash and credit cards;
• sturdy shoes.
6. Make arrangements for pets. Pets may not be allowed into emergency shelters for health and space reasons. Contact your local
humane society for information on local animal shelters.
7. Make sure that all family members know how to respond after a
hurricane.
8. Teach family members how and when to turn off gas, electricity, and
water.
9. Teach children how and when to call 9-1-1, police, or fire department and which radio station to tune to for emergency
information.
10. Protect your windows. Permanent shutters are the best protection.
A lower-cost approach is to put up plywood panels. Use 0.5 in.
plywood – marine plywood is best – cut to fit each window.
Remember to mark which board fits which window. Pre-drill holes
every 18 in. for screws. Do this long before the storm.
11. Trim back dead or weak branches from trees.
12. Check into flood insurance. You can find out about the National
Flood Insurance Program through your local insurance agent or
emergency management office. There is normally a 30-day waiting
period before a new policy becomes effective. Homeowners polices
do not cover damage from the flooding that accompanies a hurricane.
13. Develop an emergency communication plan.
14. In case family members are separated from one another during a
disaster (a real possibility during the day when adults are at work
and children are at school), have a plan for getting back together.
224.
Emergency action checklists and fact sheets 20715. Ask an out-of-state relative or friend to serve as the ‘family contact’.
After a disaster, it is often easier to call long distance. Make sure
everyone in the family knows the name, address, and phone number
of the contact person.
Hurricane watches and warnings
A hurricane watch is issued when there is a threat of hurricane conditions within 24–36 h. A hurricane warning is issued when hurricane conditions (winds of 74 mph or greater or dangerously high water and rough
seas) are expected in 24 h or less.
During a hurricane watch
• Listen to a battery-operated radio or television for hurricane progress
reports.
• Check emergency supplies.
• Fuel car.
• Bring in outdoor objects such as lawn furniture, toys, and garden tools
and anchor objects that cannot be brought inside.
• Secure buildings by closing and boarding up windows. Remove outside antennas.
• Turn refrigerator and freezer to coldest settings. Open only when
absolutely necessary and close quickly.
• Store drinking water in clean bathtubs, jugs, bottles, and cooking utensils.
• Review evacuation plan.
• Moor boats securely or move them to a designated safe place. Use
ropes or chain to secure boat to trailer. Use tiedowns to anchor trailer
to the ground or house.
During a hurricane warning
• Listen constantly to a battery-operated radio or television for official
instructions.
• If in a mobile home, check tiedowns and evacuate immediately.
• Store valuables and personal papers in a waterproof container on the
highest level of your home.
• Avoid elevators.
If at home:
• Stay inside, away from windows, skylights, and glass doors.
• Keep a supply of flashlights and extra batteries handy. Avoid open
flames, such as candles and kerosene lamps, as a source of light.
• If power is lost, turn off major appliances to reduce power ‘surge’
when electricity is restored.
If officials indicate evacuation is necessary:
• Leave as soon as possible. Avoid flooded roads and watch for washedout bridges.
225.
208 Appendices• Secure your home by unplugging appliances and turning off electricity and the main water valve.
• Tell someone outside of the storm area where you are going.
• If time permits, and you live in an identified surge zone, elevate
furniture to protect it from flooding or better yet, move it to a higher
floor.
• Bring pre-assembled emergency supplies and warm protective
clothing.
• Take blankets and sleeping bags to shelter.
• Lock up home and leave.
After
1. Stay tuned to local radio for information.
2. Help injured or trapped persons.
• Give first aid where appropriate.
• Do not move seriously injured persons unless they are in immediate danger of further injury. Call for help.
3. Return home only after authorities advise that it is safe to do so.
• Avoid loose or dangling power lines and report them immediately
to the power company, police, or fire department.
• Enter your home with caution.
• Beware of snakes, insects, and animals driven to higher ground by
floodwater.
• Open windows and doors to ventilate and dry your home.
• Check refrigerated foods for spoilage.
• Take pictures of the damage – both to the house and to its
contents – for insurance claims.
4. Drive only if absolutely necessary and avoid flooded roads and
washed-out bridges.
5. Use telephone only for emergency calls.
Tornado watches and warnings
When a tornado is coming, you have only a short amount of time to
make life-or-death decisions. Advance planning and quick response are
the keys to surviving a tornado. A tornado watch is issued by the
National Weather Service when tornadoes are possible in your area.
Remain alert for approaching storms. This is the time to remind family
members where the safest places within your home are located, and
listen to the radio or television for further developments. A tornado warning is issued when a tornado has been sighted or indicated by weather radar.
Mobile homes
Mobile homes are particularly vulnerable. A mobile home can overturn
very easily even if precautions have been taken to tie down the unit.
When a tornado warning is issued, take shelter in a building with a
strong foundation. If shelter is not available, lie in ditch or low-lying
area a safe distance away from the unit.
226.
Emergency action checklists and fact sheets 209Tornado danger signs
Learn these tornado danger signs:
• An approaching cloud of debris can mark the location of a tornado
even if a funnel is not visible.
• Before a tornado hits, the wind may die down and the air may become
very still.
• Tornadoes generally occur near the trailing edge of a thunderstorm. It
is not uncommon to see clear, sunlit skies behind a tornado.
During
1. If at home:
• Go at once to a windowless, interior room; storm cellar; basement;
or lowest level of the building.
• If there is no basement, go to an inner hallway or a smaller inner
room without windows, such as a bathroom or closet.
• Get away from the windows.
• Go to the centre of the room. Stay away from corners because they
tend to attract debris.
• Get under a piece of sturdy furniture such as a workbench or heavy
table or desk and hold on to it.
• Use arms to protect head and neck.
• If in a mobile home, get out and find shelter elsewhere.
2. If at work or school:
• Go to the basement or to an inside hallway at the lowest level.
• Avoid places with wide-span roofs such as auditoriums, cafeterias,
large hallways, or shopping malls.
• Get under a piece of sturdy furniture such as a workbench or heavy
table or desk and hold on to it.
• Use arms to protect head and neck.
3. If outdoors:
• If possible, get inside a building.
• If shelter is not available or there is no time to get indoors, lie in a
ditch or low-lying area or crouch near a strong building. Be aware
of the potential for flooding.
• Use arms to protect head and neck.
4. If in a car:
• Never try to out drive a tornado in a car or truck. Tornadoes can
change direction quickly and can lift up a car or truck and toss it
through the air.
• Get out of the car immediately and take shelter in a nearby building.
• If there is no time to get indoors, get out of the car and lie in a ditch
or low-lying area away from the vehicle. Be aware of the potential
for flooding.
After
• Help injured or trapped persons.
• Give first aid when appropriate.
227.
210 Appendices• Do not try to move the seriously injured unless they are in immediate
danger of further injury.
• Call for help.
• Turn on radio or television to get the latest emergency information.
• Stay out of damaged buildings. Return home only when authorities
say it is safe.
• Use the telephone only for emergency calls.
• Clean up spilled medicines, bleaches, or gasoline or other flammable
liquids immediately. Leave the buildings if you smell gas or chemical
fumes.
• Take pictures of the damage – both to the house and to its contents –
for insurance purposes.
• Remember to help your neighbours who may require special
assistance – infants, the elderly, and people with disabilities.
Fujita – Pearson Tornado Scale
F-0: 40–72 mph, chimney damage, tree branches broken.
F-1: 73–112 mph, mobile homes pushed off foundation or overturned.
F-2: 113–157 mph, considerable damage, mobile homes demolished,
trees uprooted.
F-3: 158–205 mph, roofs and walls torn down, trains overturned, cars
thrown.
F-4: 207–260 mph, well-constructed walls levelled.
F-5: 261–318 mph, homes lifted off foundation and carried considerable
distances, autos thrown as far as 100 m.
Inspecting utilities in a damaged home
1. Check for gas leaks – if you smell gas or hear blowing or hissing
noise, open a window and quickly leave the building. Turn off the gas
at the outside main valve if you can and call the gas company from a
neighbour’s home. If you turn off the gas for any reason, it must be
turned back on by a professional.
2. Look for electrical system damage – if you see sparks or broken or
frayed wires, or if you smell hot insulation, turn off the electricity at
the main fuse box or circuit breaker. If you have to step in water to get
to the fuse box or circuit breaker, call an electrician first for advice.
3. Check for sewage and water lines damage – if you suspect sewage
lines are damaged avoid using the toilets and call a plumber. If water
pipes are damaged, contact the water company and avoid the water
from the tap. You can obtain safe water by melting ice cubes.
Mitigation
Mitigation includes any activities that prevent an emergency, reduce the
chance of an emergency happening, or lessen the damaging effects of
unavoidable emergencies. Investing in preventive mitigation steps now
such as strengthening non reinforced masonry to withstand wind and
flooding and installing shutters on every window will help reduce the
impact of hurricanes in the future.
228.
Emergency action checklists and fact sheets 211Fact sheet: extreme heat (Source: FEMA)
Doing too much on a hot day, spending too much time in the sun or staying too long in an overheated place can cause heat-related illnesses.
Know the symptoms of heat disorders and overexposure to the sun, and
be ready to give first aid treatment.
Before
• Contact your local emergency management office or Red Cross for
information on extreme heat.
• Install window air conditioners snugly.
• Close any floor heat registers nearby.
• Insulate spaces around air conditioners for a tighter fit.
• Use a circulating or box fan to spread the cool air.
Keep heat outside and cool air inside.
• Install temporary reflectors, such as aluminium foil covered cardboard, to reflect any heat back outside. Keep the cool air inside by
weather-stripping doors and windowsills.
• Consider keeping storm windows up all year. Storm windows can
keep the heat of a house in the summer the same way they keep the
cold out in the winter.
• Check air-conditioning ducts for proper insulation.
During
• Protect windows. Hang shades, draperies, awnings, or louvers on
windows that receive morning or afternoon sun. Outdoor awnings
or louvers can reduce the heat entering the house by as much as
80%. Conserve electricity.
• During periods of extreme heat, people tend to use a lot more power
for air conditioning, which can lead to a power shortage or outage.
Stay indoors as much as possible. If air conditioning is not available,
stay on the lowest floor out of the sunshine. Remember that electric
fans do not cool, they just blow hot air around.
• Eat well-balanced, light meals.
• Drink plenty of water regularly. Persons who have epilepsy or heart,
kidney, or liver disease; are on fluid-restrictive diets; or have a
problem with fluid retention should consult a doctor before increasing
liquid intake.
• Limit intake of alcoholic beverages. Although beer and alcohol
beverages appear to satisfy thirst, they actually cause further body
dehydration.
• Dress in loose-fitting clothes that cover as much skin as possible.
Lightweight, light-coloured clothing that reflects heat and sunlight
and helps maintain normal body temperature.
• Protect face and head by wearing a wide-brimmed hat.
• Allow your body to get acclimated to hot temperatures for the first
2 or 3 days of a heat wave.
229.
212 Appendices• Avoid too much sunshine. Sunburn slows the skin’s ability to cool
itself. Use a sunscreen lotion with a high sun protection factor (SPF)
rating.
• Avoid extreme temperature changes. A cool shower immediately after
coming in from hot temperatures can result in hypothermia, particularly for elderly and very young people.
• Slow down. Reduce, eliminate, or reschedule strenuous activities.
High-risk individuals should stay in cool places. Get plenty of rest to
allow your natural ‘cooling system’ to work.
• Take salt tablets only if specified by your physician. Persons on saltrestrictive diets should check with a physician before increasing salt
intake.
• Vacuum air conditioner filters weekly during periods of high use.
• Learn the symptoms of heat disorders and know how to give
first aid.
During a drought
• Lower water use. Watering the lawn and washing the car waste water.
Whenever possible, re-use water.
• Place a brick or other large, solid object in the flush tank of the toilet
to reduce the water used to flush.
• Farmers should contact the county Farm Service Agency for disaster
assistance information.
Heat disorders
Sunburn
Symptoms: skin redness and pain, possible swelling, blisters, fever,
headaches.
First aid: take a shower, using soap, to remove oils that may block pores
preventing the body from cooling naturally. If blisters occur, apply
dry, sterile dressings and get medical attention.
Heat cramps
Symptoms: painful spasms usually in leg and abdominal muscles, heavy
sweating.
First aid: firm pressure on cramping muscles or gentle massage to
relieve spasm. Give sips of water. If nausea occurs, discontinue.
Heat exhaustion
Symptoms: heavy sweating, weakness, skin cold, pale and clammy,
weak pulse, normal temperature, possible fainting, vomiting.
First aid: get victim to lie down in a cool place. Loosen clothing. Apply
cool, wet cloths. Fan or move victim to air-conditioned place. Give
sips of water. If nausea occurs, discontinue. If vomiting occurs, seek
immediate medical attention.
230.
Emergency action checklists and fact sheets 213Heat stroke (sun stroke)
Symptoms: high body temperature (106⫹), hot, dry skin, rapid, strong
pulse, and possible unconsciousness. Victim will likely not sweat.
First aid: heat stroke is a severe medical emergency. Call 9-1-1 or
emergency medical services or get the victim to a hospital immediately. Delay can be fatal. Move victim to a cooler environment. Try
a cool bath or sponging to reduce body temperature. Use extreme
caution. Remove clothing. Use fans and/or air conditioners. Do not
give fluids.
231.
214 AppendicesFact sheet: landslides and mudflows
(Source: http://www.fema.gov/library/landslif.htm)
Landslide and mudflows usually strike without warning. The force of
rocks, soil, or other debris moving down a slope can devastate anything
in its path. Take the following steps to be ready.
Before
1. Get a ground assessment of your property.
2. Your county geologist or county planning department may have
specific information on areas vulnerable to landsliding. Consult a
professional geo-technical expert for opinions and advice on landslide problems and on corrective measures you can take.
3. Minimize home hazards:
• Plant ground cover on slopes and build retaining walls.
• In mudflow areas, build channels or deflection walls to direct the
flow around buildings.
• Remember: if you build walls to divert debris flow and the
flow lands on a neighbour’s property, you may be liable for
damages.
4. Learn to recognize the landslide warning signs:
• Doors or windows stick or jam for the first time.
• New cracks appear in plaster, tile, brick, or foundations.
• Outside walls, walks, or stairs begin pulling away from the
building.
• Slowly developing, widening cracks appear on the ground or on
paved areas such as streets or driveways.
• Underground utility lines break.
• Bulging ground appears at the base of a slope.
• Water breaks through the ground surface in new locations.
• Fences, retaining walls, utility poles, or trees tilt or move.
• You hear a faint rumbling sound that increases in volume as
the landslide nears. The ground slopes downward in one
specific direction and may begin shifting in that direction under
your feet.
5. Make evacuation plans.
6. Plan at least two evacuation routes since roads may become blocked
or closed.
7. Develop an emergency communication plan.
8. In case family members are separated from one another during a
landslide or mudflow this is (a real possibility during the day when
adults are at work and children are at school), have a plan for getting back together.
9. Ask an out-of-state relative or friend to serve as the ‘family contact’.
After a disaster, it is often easier to call long distance. Make sure
everyone knows the name, address, and phone number of the contact person.
10. Insurance.
232.
Emergency action checklists and fact sheets 215During
If inside a building:
• Stay inside.
• Take cover under a desk, table, or other piece of sturdy furniture.
If outdoors:
• Try and get out of the path of the landslide or mudflow.
• Run to the nearest high ground in a direction away from the path.
• If rocks and other debris are approaching, run for the nearest shelter
such as a group of trees or a building.
• If escape is not possible, curl into a tight ball and protect your head.
Sinkholes
A sinkhole occurs when groundwater dissolves a vulnerable land surface
such as limestone, causing the land surface to collapse from a lack of
support. In June 1993, a 100-foot wide, 25-foot deep sinkhole formed
under a hotel parking lot in Atlanta, killing two people and engulfing
numerous cars.
After
1.
2.
3.
4.
5.
6.
7.
8.
9.
10.
11.
12.
Stay away from the slide area.
There may be danger of additional slides.
Check for injured and trapped persons near the slide area.
Give first aid if trained.
Remember to help your neighbours who may require special
assistance – infants, elderly people, and people with disabilities.
Listen to a battery-operated radio or television for the latest emergency information.
Remember that flooding may occur after a mudflow or a landslide.
Check for damaged utility lines.
Report any damage to the utility company.
Check the building foundation, chimney, and surrounding land for
damage.
Replant damaged ground as soon as possible since erosion caused
by loss of ground cover can lead to flash flooding.
Seek the advice of geo-technical expert for evaluating land-slide
hazards or designing corrective techniques to reduce landslide risk.
Mitigation
Mitigation includes any activities that prevent an emergency, reduce the
chance of an emergency happening, or lessen the damaging effects of
unavoidable emergencies. Investing in preventive mitigation steps now
such as planting ground cover (low-growing plants) on slopes, or
installing flexible pipe fitting to avoid gas or water leaks, will help reduce
the impact of landslides and mudflows in the future. For more information on mitigation, contact your local emergency management office.
233.
216 AppendicesFact sheet: terrorism (prepared by FEMA in the
United States)
Before
Learn about the nature of terrorism.
• Terrorists look for visible targets where they can avoid detection
before or after an attack such as international airports, large cities,
major international events, resorts, and high-profile landmarks.
Learn about the different types of terrorist weapons including explosives, kidnappings, hijackings, arson, and shootings. Prepare to deal
with a terrorist incident by adapting many of the same techniques used
to prepare for other crises.
• Be alert and aware of the surrounding area. The very nature of terrorism suggests that there may be little or no warning.
• Take precautions when travelling. Be aware of conspicuous or unusual
behaviour. Do not accept packages from strangers. Do not leave luggage unattended.
• Learn where emergency exits are located. Think ahead about how to
evacuate a building, subway or congested public area in a hurry. Learn
where staircases are located.
• Notice your immediate surroundings. Be aware of heavy or breakable
objects that could move, fall or break in an explosion.
Preparing for a building explosion
The use of explosives by terrorists can result in collapsed buildings and
fires. People who live or work in a multilevel building can do the following:
• Review emergency evacuation procedures. Know where fire exits are
located.
• Keep fire extinguishers in working order. Know where they are
located, and how to use them. Learn first aid. Contact the local chapter of the American Red Cross for additional information.
• Keep the following items in a designated place on each floor of the
building:
– portable, battery-operated radio and extra batteries;
– several flashlights and extra batteries;
– first-aid kit and manual;
– several hard hats;
– fluorescent tape to rope off dangerous areas.
Bomb threats
If you receive a bomb threat, get as much information from the caller as
possible. Keep the caller on the line and record everything that is said.
Notify the police and the building management. After you have been notified of a bomb threat, do not touch any suspicious packages. Clear the
area around the suspicious package and notify the police immediately.
234.
Emergency action checklists and fact sheets 217In evacuating a building, avoid standing in front of windows or other
potentially hazardous areas. Do not restrict sidewalk or streets to be used
by emergency officials.
During
1. In a building explosion, get out of the building as quickly and calmly
as possible.
2. If items are falling off of bookshelves or from the ceiling, get under
a sturdy table or desk.
3. If there is a fire:
• Stay low to the floor and exit the building as quickly as possible.
• Cover nose and mouth with a wet cloth.
• When approaching a closed door, use the palm of your hand and
forearm to feel the lower, middle and upper parts of the door. If it is
not hot, brace yourself against the door and open it slowly. If it is hot
to the touch, do not open the door – seek an alternate escape route.
• Heavy smoke and poisonous gases collect first along the ceiling.
Stay below the smoke at all times.
After
If you are trapped in debris:
• Use a flashlight.
• Stay in your area so that you do not kick up dust. Cover your mouth
with a handkerchief or clothing.
• Tap on a pipe or wall so that rescuers can hear where you are. Use a
whistle if one is available. Shout only as a last resort – shouting can
cause a person to inhale dangerous amounts of dust.
Assisting victims
• Untrained persons should not attempt to rescue people who are inside
a collapsed building. Wait for emergency personnel to arrive.
Chemical agents
Chemical agents are poisonous gases, liquids or solids that have toxic
effects on people, animals or plants. Most chemical agents cause serious
injuries or death. Severity of injuries depends on the type and amount of
the chemical agent used, and the duration of exposure. Were a chemical
agent attack to occur, authorities would instruct citizens to either seek shelter where they are and seal the premises or evacuate immediately. Exposure
to chemical agents can be fatal. Leaving the shelter to rescue or assist victims can be a deadly decision. There is no assistance that the untrained can
offer that would likely be of any value to the victims of chemical agents.
Biological agents
Biological agents are organisms or toxins that have illness-producing effects
on people, livestock, and crops. Because biological agents cannot necessarily
be detected and may take time to grow and cause a disease, it is almost
impossible to know that a biological attack has occurred. If government
235.
218 Appendicesofficials become aware of a biological attack through an informant or warning by terrorists, they would most likely instruct citizens to either
seek shelter where they are and seal the premises or evacuate immediately.
A person affected by a biological agent requires the immediate attention
of professional medical personnel. Some agents are contagious, and victims may need to be quarantined. Also, some medical facilities may not
receive victims for fear of contaminating the hospital population.
More information on bio-terrorism preparedness and response is available online from the Department of Health and Human Services Centre
for Disease Control.
236.
Emergency action checklists and fact sheets 219Wildfire emergency checklist (Source: FEMA)
• Learn and teach safe fire practices.
• Build fires away from nearby trees or bushes always have a way to
extinguish a fire, never leave a fire unattended.
• Obtain local building codes and weeds abatement ordinances for
buildings near wooded areas.
• Use fire-resistant materials when building, renovating, or retrofitting
structures.
• Create a safety zone to separate home from combustible plants and
vegetables.
• Install electrical lines underground, if possible.
• Prune all branches around residence to a height of 8–10 ft.
• Keep trees adjacent to buildings free of dead or dying wood and moss.
• Remove all dead limbs, needles, and debris from rain gutters.
• Store combustible/flammable materials in approved safety containers
and keep away from home.
• Keep chimney clean.
• Avoid open burning, especially during dry season. Install smoke
detectors on every level of your home.
• Make evacuation plans from home and neighbourhood and have back-up
plans.
• Avoid using wooden shakes and shingles for roofing.
• Use only thick, tempered safety glass in large windows and doors.
• Have disaster supplies on hand (flashlights, extra batteries, portable
radios, first-aid kits, emergency food and water, non-electric can
opener, essential medicines, cash and credit cards, and sturdy shoes).
• Develop an emergency communication plan in case of separation.
• Ask an out-of-state relative to serve as the ‘family contact’.
If trapped in a wildfire, you cannot outrun it:
• Crouch in a pond or river and cover head and upper body with wet
clothing.
• If a body of water is unavailable, look for shelter in a cleared area or
among a bed of rocks and lie flat and cover body with wet clothing
or soil.
• Listen to radio for emergency information.
• Remove combustible items (outdoor furniture, umbrellas, tarp coverings, and firewood) from around the home.
• Take down flammable drapes and curtains and close all venetian
blinds or non-combustible window coverings.
• Close all doors and windows inside home to prevent draft.
• Close gas valves and turn off pilot light.
• Turn on a light in each room for visibility in heavy smoke.
• Place valuables that will not be damaged by water, in a pool
or pond.
237.
220 Appendices• If hoses and adequate water are available, leave sprinklers on roofs
and anything that might be damaged by fire.
• Be ready to evacuate all family members and pets when fire nears or
when instructed to do so by local officials.
• Be cautious when re-entering a burned wildland area – hot spots can
flare up without warning.
• Check the roof immediately and extinguish any sparks or embers and
the attic for hidden burning sparks.
• Re-check for smoke and sparks throughout the home for several hours
afterward.
• Breathe the air close to the ground through a wet cloth to avoid
scorching lungs or inhaling smoke.
238.
Emergency action checklists and fact sheets 221Nuclear accident mitigation
In the event of a nuclear accident, the most intense levels of contamination are associated with rain and snowfall events. Monitoring the
weather information will be essential in implementing emergency plans.
Information about the contamination, ground deposition, and ingestion
pathway is unlikely to be available for several months after the accident
takes place. This is because of the time consuming type of analysis
required, which must be undertaken in a laboratory setting.
In any nuclear accident there are two courses of action: evacuation and
sheltering.
Evacuation
This is the only viable option for people living in the vicinity of a
nuclear facility at the time of an accident because information about the
amount of the contamination and the direction of the plume passage is
very vague at the initial stages and this is not a straightforward operation. (At Chernobyl, population moved some 200 km away from the
immediate area of the accident, actually entered areas with greater
amounts of ground contamination because of the weather pattern.)
Emergency evacuation will require safety procedures as follows:
Access control into the contaminated area.
Control/sheltering of livestock and animals not evacuated.
Food and water control.
Decontamination efforts.
Relocation plan.
Sheltering
Except in situations where people are certain to be in close proximity and
downwind from a major nuclear accident, immediate sheltering is the safest
option in avoiding the most intense short-lived activity in the passing plume.
The main priority is to avoid inhalation and ingestion through contaminated foods. The following precautions are recommended.
• If no stocked fallout shelter is available, the best option is to remain
indoors in one’s own residence, keeping windows and doors closed
and blocking all other apertures to minimize inhalation of the passing
plume.
• Livestock and pets must also be sheltered and only uncontaminated
feeds used.
• If unable to find shelter, or if forced to go outside during the plume
passage, a simple dust mask would be an essential first-line protection
against inhaling radioactive particles.
239.
222 Appendices• Surface water and rainwater supplies should be avoided.
• Contaminated clothing and footwear should be removed from the
immediate vicinity of occupation.
• Certain types of food should be avoided, namely, leafy vegetables with
foliar contamination , fruits difficult to wash as raspberries for example, food subject to rapid animal ingestion such as cow’s or goat’s
milk, and cheese.
• Filtering and/or diluting will make most sources of public drinking
water safe.
• Garden ground should be covered with tarpaulins if possible to prevent absorption into the soil.
240.
ContributorsProf. Ing. Alexandru Cismigiu
Born in Romania in a family of researchers, Alexandru Cismigiu has
established a distinguished academic career teaching theory of structures
and materials and engineering. He taught for 15 years at the Technical
Construction University and 35 years at the School of Architecture and
Town Planning in Bucharest, his professional life combining a personal
style of teaching, design, and research.
Amongst the many buildings he has been responsible for designing the
structure, are: The Parliament House, The Palace Hall, The National
Theatre, all in Bucharest, the first tall buildings in Skoplije after the
1963 earthquake.
An internationally valued expert in seismic matters in the Balkans,
Prof. Cismigiu was designated UNESCO expert when a major earthquake
hit Skopje, a town he is now an honorary citizen of. After the 4 March
1977 earthquake in Bucharest, Prof. Cismigiu has taken part in a large
number of expert consolidations of Romanian historic monuments, some
of which were on the point of collapse, developing his own concept for
structural strengthening. His experience of the Romanian earthquakes has
been the subject of a number of conferences he gave on seismic matters in
Tokyo 1960, Santiago 1962, and New Delhi 1977.
He continues to take an active part co-authoring with his daughter, also
a structural engineer, a number of specialist presentations to international conferences such as:
• WCEE – Acapulco 1996: The seismic pathology of religion related
buildings in Romania and their treatment.
• The 6th World Conference on Composite Materials in Los
Angeles: Mixed structures of composite materials in front of the
20th century.
In recognition for his professional achievements, The National
Association of Romanian Builders has elected Prof. Alexandru Cismigiu
‘Constructor of the twentieth century’.
241.
224 ContributorsBertrand Penneron
A French architect graduate of the Paris-La Villete Architectural School
since 1987, Bertrand Penneron has also completed further studies at the
Versailles Architectural School, the Chaillot School of History and
Conservation of Historic Monuments. In 1994, he also gained a degree
in landscape studies.
He has established his own practice in Tours, Central France since 1988,
and works with three other colleagues: an architect graduate of the Chaillot
School (the French equivalent of postgraduate studies on the conservation
of historic buildings), a designer draftsman, and a quantity surveyor.
His work is multifaceted with a prevalence of historic buildings and
landscaping projects, many of which are on the banks of the Loire river.
Miro Group
Miro Group is a Franco-Romanian group of structural engineers created
in 1993, working in central Europe, especially in Romania and France.
The group specializes in structural design of new buildings, consolidation and restoration of historic buildings, and the consolidation and rehabilitation of civil and industrial buildings.
The group (working at the time part of the design consortium
S.C. Carpati Proiect S.A) have been responsible for the restoration and
structural consolidation of the Central University Library in Bucharest,
Romania. The following engineers were involved.
Group Director: Mircea Mironescu – Structural Engineer Group Director,
Vice- President of the Romanian Commission for Seismic Risk Reduction;
Member of the Romanian Historic Monuments Engineering Committee;
President of the Association of Romanian Construction Engineers (AICR);
Consultant Structural Engineer for projects in Romania, Bucharest such
as: The Industrial Export Centre, The World Trade Centre, Financial
Plaza, etc.
Group members
• based in Romania: Andrei Bortnowschi, Virgil Sava, Teodor Brotea,
Adrian Stanescu, structural engineers.
• based in France: Bogdan Goilav founder member of AICR and
Everest Engineering France, member of American Concrete Institute
(ACI), The French Association of Seismic Engineers, and French
Association of Civil Engineers.
Jonathan P. Kumin, AIA
American Institute of Architects, Alaska Chapter (including past
Chapter President)
242.
Contributors 225Construction Specifications Institute
National Council of Architectural Registration Boards Certificate
As Principal-In-Charge at Kumin Associates since 1978, Jon Kumin has
directed the successful design of new construction and renovations of a
diverse range of project type. Assignments range from science laboratories at the geographic South Pole for the National Science Foundation to
a complete, self-contained community in Yuzhno-Sakhalinsk, Russia.
Jon Kumin has been involved with technical investigations of existing
structures for both major public and private clients, and has helped
develop appropriate standards for buildings in Alaska and other northern
regions. He is particularly interested in the integration of the architectural, engineering and construction efforts. He is a frequent lecturer on
appropriate design for cold climates, at venues such as the University of
Alaska and numerous professional conferences.
Projects designed under Jon Kumin’s guidance have won national recognition as outstanding examples of their type from organisations as
diverse as the Council of Educational Facility Planners, American
Association of School Administrators, and the US Department of
Defence. Public service includes serving on the Board of Governors for
the University of Michigan architecture school.
Christine Theodoropoulos, Anne Deutsch,
Josh Glavin, and Boora Architects, Inc.
Christine Theodoropoulos is an Associate Professor at the University of
Oregon – BS Civil Engineering (1979) Princeton, Master of Architecture
(1985) Yale, reg. Civil Engineer, California, reg. architect, California. In
her research and professional work, Prof. Theodoropoulos addresses the
intersection between the disciplines of structure and architecture. Her
professional activities involve research and consulting work in the fields
of seismic design and historic structures. She has served as a consultant
to AIA Research on projects and educational programmes related to
seismic design. Her involvement with historic structures has included
work with HABS/HAER, the directorship of the Neutra Research House
in Los Angeles and research regarding historic bridges in Los Angeles,
California and Portland, Oregon. Professor Theodoropoulos teaches
courses in seismic design, structures and architectural design studios.
Anne Deutsch is a graduate student in the Master of Architecture program
at the University of Oregon. She has an undergraduate degree, BS in
Architectural Studies, from the University of Illinois at Urbana-Champaign
(1993) and has several years of professional office experience.
Josh Glavin is also a graduate student in the Master of Architecture
programme at the University of Oregon. He has an undergraduate
degree, BS in Architecture from the University of Idaho (2000).
243.
226 ContributorsDeutsch and Glavin have been preparing studio projects for the new
school in The Dalles, Oregon for their Masters thesis project.
Boora Architects, Inc. have designed the new school, which is now under
construction. AMEC Earth & Environmental, Inc. conducted the Geo technical Engineering Investigation for the Dalles Middle School site in 2001.
Rena Pitsilli-Graham, Freeman Historic Properties,
and Caroe & Partners
Rena Pitsilli-Graham is an architect, trained in England and specialised
in the repair and conservation of historic buildings. She has worked with
Feilden & Mawson on the repair of Marlborough House and with Caroe &
Partners on the repair and representation of the White Tower and other
buildings in the Tower of London, on Rochester Cathedral, the British
Museum, and several churches.
Freeman Historic Properties Limited undertakes the repair of problem
listed buildings. An earlier project was the restoration of Wothorpe
Grandstand (Grade II*) near Stamford, a derelict eighteenth century
racecourse grandstand, which was adapted for residential use. Dr. Jenny
Freeman, Chairman has the AA Diploma in Building Conservation and
has written a book on the Edwardian architect, W.D. Caroe the founder
of Caroe & Partners.
Caroe & Partners was founded in 1884 by W.D. Caroe (1857–1938), and
through four generations of architects bearing the family name, the practice has been associated with the care of historic buildings of great significance, from cathedrals to National Trust Houses, from monuments of
international significance to humble parish churches.
244.
Information sourcesDisaster websites (Source: Cambridge scientific abstracts)
1. Asian Disaster Preparedness Center
(Asian Institute of Technology, PO Box 4, Klong Luang,
Pathumthani, 12120, Thailand)
http://www.adpc.ait.ac.th/default.html
2. Australian Emergency Management Information Centre
(Emergency Management Australia)
http://www.ema.gov.au/libraryf.htm
3. City of Seattle Emergency Management
(Seattle Public Access Network, Seattle, WA, USA)
http://www.ci.seattle.wa.us/eoc/default.htm
4. Disaster Emergency Response and Management Systems
(Caribbean Disaster Emergency Response Agency, The Garrison,
St. Micheal, Barbados)
http://www.cdera.org/derms.htm
5. Disaster Relief
(American Red Cross, 1621 N. Kent Street, Arlington, VA 22209)
http://www.disasterrelief.org/
6. Disaster Services
(Alberta Transportation and Utilities, Alberta, Canada)
http://www.tu.gov.ab.ca/DIS000.HTM
7. Disaster/Humanitarian Assistance
(Pan American Health Organization)
http://www.paho.org/english/ped/pedhome.htm
8. Emergency and Disaster Planning Information
(Teleport Internet Services)
http://www.teleport.com/~alany/uscg/ready.html
9. Emergency Preparedness Information Exchange
(Search and Rescue Society of British Columbia, P.O. Box 187,
British Columbia, V8W 2M6 Canada)
http://sarbc.org/sar-dis.html
10. Epidemic louse-borne typhus fever
(World Health Organization, Geneva, Switzerland)
http://www.who.int/inf-fs/en/fact162.html
11. EQE Earthquake Home Preparedness Guide
(EQE International, 1111 Broadway, 10th Floor, Oakland, CA
94607, USA)
http://www.eqe.com/publications/homeprep/
12. Global Emergency Management Disaster Counselling Support
Network
(University of Plymouth, Drake Circus, Plymouth, Devon PL4
8AA, UK)
http://tin.ssc.plym.ac.uk/gemc.html
245.
228 Information Sources13. Hazards Literature Database
(Natural Hazards Research and Applications Information Center,
Natural Hazards Center, Campus Box 482, University of Colorado,
Boulder, CO 80309-0482)
http://www.colorado.edu/hazards/litbase/litindex.htm
14. Illinois Disaster Resources
(University of Illinois at Urbana-Champaign, Champaign, IL, USA)
http://www.ag.uiuc.edu/~disaster/about.html
15. Integrated Natural Hazard Mitigation in Rhode Island
(Coastal Resources, University of Rhode Island, Narragansett Bay
Campus, Narragansett, RI 02882, USA)
http://brooktrout.gso.uri.edu/field/us/HazardMit/index.html
16. Mitigating the Impacts of Natural Hazards in the US Virgin Islands
(Island Resources Foundation, 6296 Estate Nazareth No. 11,
St. Thomas, VI 00802-1104)
http://www.irf.org/irhazmit.htm
17. Natural Disaster Management
(United Nations, Department of Humanitarian Affairs)
http://www.ndm.co.uk/
18. Natural Disaster Reduction: From Improved Forecasts to Effective
Mitigation
(National Oceanic and Atmospheric Administration, Department of
Commerce, 14th Street & Constitution Avenue NW, Room 6013,
Washington, DC 20230, USA)
http://www.noaa.gov/baker/agu1996.htm
19. Natural Disasters – The Virtual Past
(Charles Sturt University, Australia)
http://life.csu.edu.au/virtpast/Disasters.html
20. Natural Hazards Center – Information on Human Adaptation to
Disaster
(The National Hazards Center, University of Colorado, Boulder,
Colorado, USA)
http://www.colorado.edu/hazards/
21. Natural Hazards Mitigation Group
(Department of Mineralogy, University of Geneva, 13, Rue des
Maraichers, CH 1211 Geneva 4, Switzerland)
http://www.unige.ch:80/hazards/
22. Natural Hazards Research and Applications Center
(Natural Hazards Research, Applications and Information Center)
http://adder.colorado.edu/~hazctr/Home.html
23. North American Emergency Management
(P.O. Box 420731, San Francisco, CA 94142, USA)
http://www.naem.com/eqk/html/eqk.html
24. Population at Risk from Natural Hazards
(NOAA, National Ocean Service, 1305 East–West Highway, 9th Fl.,
Silver Spring, MD 20910-3281, USA)
http://state_of_coast.noaa.gov/bulletins/html/par_02/par.html
246.
Information Sources 22925. Preparedness Training and Exercises
(Federal Emergency Management Agency, 500 C Street SW,
Washington, DC 20472, USA)
http://www.fema.gov/pte/prep.htm
26. Reducing Risk Through Mitigation
(Federal Emergency Management Agency)
http://166.112.200.140:80/mit/
27. Report on Disaster Relief Programme
(The Internet Society, 12020 Sunrise Valley Drive, Suite 210,
Reston, VA 20191-3429, USA)
http://www.isoc.org/ftp/isoc/bodies/trustees/documents/94326.txt
28. Self Organization in Disaster Response
(University of Colorado Natural Hazards Program)
http://www.colorado.edu/hazards/qr/qr78.html
29. Transition from Response to Recovery: A Look at the Lancaster,
Texas Tornado
(University of Colorado at Boulder, Boulder, CO, USA)
http://www.colorado.edu/hazards/qr/qr79.html
30. A World Safe from Natural Disasters
(Pan American Health Organization)
http://www.paho.org/english/ped/peddisen.htm
Earthquake websites and organizations
http://www.georisk.com/terminol/termeq.shtml#Fault:
Weather information and organizations websites
1. Radar Information
metsys.weathersa.co.za/RadarInfo.htm
2. Earth Systems Education Real Time Information of the Earth
earthsys.ag.ohio-state.edu/earth_today.html
3. Met Office: Homepage
www.met-office.gov.uk/
4. BBC – Weather Centre – Home Page
www.bbc.co.uk/weather/
5. Meteorology Department Home Page
www.met.rdg.ac.uk/
Fire monitoring and information websites
1. Wildland Fire Information
http://www.nifc.gov/National Interagency Fire Center
http://www.or.blm.gov/nwfire/Northwest Fire Prevention/Education
Fire Restrictions and Closures Information
http://www.fs.fed.us/r6/w-w/firecenter/Northeast Oregon Interagency
Fire Center (NOC)
http://www.fs.fed.us/r6/uma/PICC/Pendleton Interagency Communication Center (PIC)
247.
230 Information Sources2.
3.
4.
5.
6.
7.
8.
9.
http://www.fs.fed.us/r6/centraloregon/index_rac.htmlRedmondAirCenter
http://www.nv.blm.gov/wgbccWestern Great Basin Coordination Center
http://www.rfl.psw.fs.fed.us/Riverside Fire Lab
http://www.fire.org/Fire.org
http://www.fs.fed.us/fire/planning/nist/Forest Service Fire Applications Support
International Fire Management Sites
http://www.anu.edu.au/Forestry/fire/firenet.htmlInternational Fire
Info Network
http://www.nofc.forestry.ca/fire/Canadian Fire Management
http://earthobservatory.nasa.gov/Observatory/Datasets/fires.trmm.html
http://earthobservatory.nasa.gov/Observatory/Datasets/fires.trmm.
htmlGlobal Fire Monitoring
http://www.gis.umn.edu/Department of Forest Resources (GIS)
http://www.fire.ca.gov/California Department of Forestry & Fire
Protection
http://flame.doacs.state.fl.us/Florida Fire Home Page
http://www.wsfire.com/WesternStates Fire Information Resource
Recommended Link (Favorite) Sites
http://wildlandfirefighter.com/links.htmlWildland Firefighters Link
Page
http://thomas.loc.gov/Thomas: US Congress
http://www.firstgov.gov/
Global Forest Watch
http://www.globalforestwatch.org/
Interactive Health Ecology Access Links (IHEAL)
http://mole.utsa.edu/~matserv/iheal/
United Nations System: Sustainable Development Country Archives
http://www.un.org/esa/agenda21/natlinfo/countinf.htm
United Nations System-Wide Earthwatch
http://www.unep.ch/earthw.html
World Rainforest Movement (WRM)
http://www.wrm.org.uy/
World Resources Institute (WRI)
http://www.wri.org/
United Nations Environment Programme (UNEP)
Regional Office for Europe, 15, Chemin des Anémones
1219 Chátelaine, Geneva, Switzerland,
Tel: (41–22) 917–8111; Fax: (41–22) 917–8024;
Email: [email protected]; http://www.unep.ch
Office for the Coordination of Humanitarian Affairs (OCHA)
United Nations Palais des Nations,
1211 Geneva 10, Switzerland,
Tel: (41–22) 917–1142; Fax: (41–22) 917–0247;
Email: [email protected]; http://www.reliefweb.int/ocha_01
248.
BibliographyAshcroft, Frances. Life at the Extremes: The Science of Survival. Harper
Collins (2000), Flamingo (2001).
Cherouette Patrick, Construction en zone sismique: les enseignements a
tirer du drame turc, Les Cahiers Techniques du Batiment No. 203,
2000; Pathologie Les erreurs de conception à corriger en zone
sismique, Les Cahiers Techniques du Batiment No. 219, 2001.
Cismigiu, Alexandru (1977). Dupa 4 martie 1977 Arhitectura nr. 4.
Cismigiu, Alexandru (1981). Dogaru Lucian Prezente Romanesti in
inginerie seismica, Arhitectura nr.1.
Comerio, Mary C. (1988). Disaster Hits Home – New Policy for Urban
Housing Recovery. University of California Press.
Dion, R. Histoire des levées de la Loire.
Dowrick, D.J. (1977). Earthquake Resistant Design – A Manual for
Engineers and Architects. John Wiley, London.
Environment Agency (2002). The Thames Barrier.
Feilden, Bernard M. (2001). Conservation of Historic Buildings.
Architectural Press.
Fisk, Dorothy (1940). Weather in the Making. The Scientific Book Club.
Gordon, J.E. (1991). Structures or Why Things don’t Fall Down. Penguin.
Jalil, Wolfgang, L’avis d’expert, Les Cahiers Techniques du Batiment
No. 203, 2000, No. 219, 2001.
King, Harold. Revised by Derek Osbourn Mitchell’s Building –
Components.
Koenigberger, O.H., Ingersoll, T.G., Mayhew, A., Szokolay, S.V. (1978).
Manual of Tropical Housing and Building. Longman Group Ltd.
Levitt, Allan M. (1997). Disaster Planning and Recovery. John Wiley.
Nelson, Carl. L (1991). Protecting the Past from Natural Disasters. The
Preservation Press, National Trust for Historic Preservation in the
United States.
Roaf Sue, Manuel Fuentes and Stephanie Thoms (2002). Ecohouse a
Design Guide. Architectural Press.
Smith, Anthony. (2002). The Weather: What is happenning to Our
Climate? Arrow Books.
Stroud Foster Jack (1973). Mitchell’s Building Building Construction –
Part 1 Structure and Fabric. Batsford Academic and Educational
London.
249.
232 BibliographyStrud, Foster and Raymond Harrington. Mitchell’s Building Series,
Structure and fabric Part 2. Batsford Academic and Educational
London.
The Institution of Structural Engineers (1995). The Structural
Engineer’s Response to Explosion Damage.
Toigo, John (2000). Disaster Recovery Planning. Prentice Hall.
UNESCO (1985). Building Construction under Seismic Conditions in
the Balkan Region and Post Earthquake Damage Evaluation. United
Nations Development Programme,Vienna.
250.
GlossaryEarthquake terms
Acceleration rate of increase of velocity per time unit.
Aftershock seismic event occurring after an earthquake, usually within
days. Although often smaller in intensity can be quite destructive as
buildings and structures have already been weakened.
Axial loading compressive force acting along the vertical axis of a
structural element.
Base shear probable maximum value of the force required to maintain
equilibrium when a system is vibrating laterally in response to a chaotic
disturbance.
Braced frames frames stiffened against lateral buckling.
Damping slowing down or preventing of oscillations caused dissipation of kinetic energy. Critical damping represents the minimum amount
of damping which would stop movement.
Epicentre the point on the Earth’s surface directly above the focus of
an earthquake.
Fault plane surface of fracture in a rock body, caused by brittle failure,
along which relative displacements between adjacent blocks can be
observed.
Focus the location, usually within the Earth of the first motion of an
earthquake is estimated to have occurred.
Hypocentre an alternative word for focus.
Liquefaction in soils, temporary transformation to a fluid state due to
sudden decrease in shear resistance associated with the collapse of the
surrounding structure as a result of an increase in fluid pressure.
Lithosphere the upper layer of the solid Earth, comprising blocks
known as tectonic plates. If subjected to stresses of the order of
100 Mpa, it deforms by brittle failure.
Loading term for the forces acting on a building.
Mode shape of oscillation taking place in a system of components and
masses. Normal mode is the first or fundamental mode where displacements from the base are observed.
Moment measure of the effect of a force about a point of rotation,
expressed in units of force and distance, for example, Newton metres
(Nm).
251.
234 GlossaryPancaking falling apart of a building, collapsing vertically rather than
falling over, in earthquake conditions.
Period the time a system takes to pass through the mean position
twice, travelling in the same direction. The fundamental period is that of
the normal mode.
Plate tectonics the movement of rigid units in the Earth’s lithosphere,
each of which has a separate motion from the other plates.
Seiches a disturbance within a closed body of water.
Seismograph instrument measuring timing and nature of ground
motion at locations remote from the station.
Seismometer device detecting seismic waves originating from earthquakes and measuring the effect of ground disturbance on particular systems of a given period and damping.
Shear effect on material resisting a sliding force, which causes its successive layers to be shifted laterally over each other. The maximum
value of the force responding to a disturbance of the design system is
known as Base Shear.
Spectrum the relationship between the response of a system (acceleration, velocity, displacement) and the period values of damping.
Subduction zone zone, at an angle to the surface of the Earth, down
which a lithospheric plate descends.
Torsion effect of a force on a structural member causing it to twist.
Tsunami giant seismic wave occurring as a result of a sub-ocean
earthquake. Its velocity is related to the depth of the water. At sea the
tsunami is hardly noticeable, but when reaching shallow waters they
build up heights of more than 30 metres, causing severe damage to
coastal areas.
Volcanoes
Lava molten rock. Its behaviour depends on its viscosity, which
depends on the silica content, temperature and dissolved gases. The less
viscous the lava the faster it flows, the more viscous the lava the greater
the tendency towards explosive eruption.
Magma supposed fluid strata under the solid crust of the Earth.
Eruption the release of lava and gas from the Earth’s interior to the
Earth’s surface and into the atmosphere.
Pyroclastic literally ‘fire-broken’, applied to volcanic rocks consisting
of fragmented particles, generally produced by explosive action.
Flood
Flash floods a brief but powerful surge of water, either over a surface
(‘sheet flood’) or down a normally dry stream channel (‘stream flood’),
usually caused by heavy rainfall of short duration, typical of arid
environment.
Flood plain part of a river valley, made of unconsolidated sediment
and periodically flooded.
252.
Glossary 235Dry-proofing measures taken to keep water out of the building.
Wet proofing measures taken to improve the ability to withstand the
effects of flooding once the water has entered the building.
Surge level height reached by water surge.
Valve a flap or other constriction that can close to ensure that a fluid
flows in only one direction.
Levée raised embankment of a river sloping away from the channel
resulting from periodic over bank flooding.
Weather
Anabatic wind wind that blows up a warm gentle slope.
Cyclone- system of winds rotating around a centre of minimum barometric pressure.
Cyclogenesis formation and strengthening of cyclonic air circulation
tending to form or deepen depressions.
Firn snow that has survived a summer melting season, an intermediate material in converting snow to glacial ice.
Gradient rate of change of a function in meteorology, such as pressure
or temperature, at right angles to the isolines.
Heat conduction the transfer of heat from a warmer to a colder region
in the same substance without mass transfer, depending on the thermal
conductivity of the material.
Katabatic wind wind that occurs when cold dense air chilled by radiation cooling moves gravitationally beneath less dense air.
Mean radiant temperature indicates the effect of surface temperature
of surrounding objects on human comfort.
Prevailing wind the wind direction that is most frequent over time in
a particular location.
Streamers column of light of objects on the surface of the earth
responding a strong electric field such as that of an electric storm.
Thermal mass mass of building expressed in volume of heated space.
Thermal movement movement due to expansion or contraction caused
by temperature changes.
Wind loading effect of wind force acting on a building.
Wind suction upward suction caused by wind passing over a roof,
tending to raise the roof and its structure.
Mass movement
Solifluction downhill movement of unconsolidated weathered material saturated with water.
Landslide mass movement consisting of transfer of earth material
down hillslopes.
Subsidence sinking or settling of the ground surface due to natural or
anthropogenic causes.
253.
236 GlossaryMan-made disasters
Anthropogenic resulting from human activities or of human origin.
Greenhouse effect The effect of heat retention in the lower atmosphere as a result of absorption and re-radiation by clouds and gases.
Grey water household generated wastewater from shower, bath, sink
and laundry waste, excluding toilet wastes.
CRUD acronym for ‘Chalk River Unidentified Deposits’ – black,
highly radioactive substances from inside piping and components of
Chalk River nuclear reactor.
Curie measurement of radioactivity: the amount of radioactive material relative to disintegrations per second.
Plume the concentration profile of an airborne or waterborne release
of material as it spreads from its source.
Radioactivity spontaneous decay of nucleus of an atom by emission of
particles, usually accompanied by electromagnetic radiation. Also
defined as the mean number of nuclear transformations occurring in a
given quantity of radioactive material per unit of time.
VOC Volatile Organic Compounds – generic name for a variety of
toxic chemicals used in reprocessing spent nuclear fuel and other industrial applications concerning weapons production.
254.
IndexA
Anchorage Alaska, Performing Arts Centre case
study, 113–17
AURUL SA, 175
B
Belfast Law Courts:
New, 137
Old, 136
Bertrand Penneron, 224
Bioclimatic design, 108
Blast wind, 134
Boora A Architets Inc., 225
Braced frames, 38
Bucharest:
building types, 47
effects of 4 March 1977 earthquake, 47, 48, 49, 50
Building Design Partnership in Northern Ireland, 141
Building Related Illness (BRI), 171
Bush fires, 152
C
Caroe and Partners, 186, 189, 226
Carpathian region geo dynamics, 44
Central University Library, Bucharest Romania case study, 141
Chernobyl 1986 nuclear accident case study, 164–8
CINTEC, 156–7
Cismigiu Alexandru Prof.Ing, 223
City Hall building London, 108
Climatic design features, 107
Coldest 5 days on Earth, 104–5
Comerio Mary, 11
Conflict:
damage types, 134
Definition, 131
effects on buildings, 134
issue types, 131
methods of resolving, 131
terrorist attack on buildings, 134
Contamination of food chain and environment, 160, 173
Cyanide facts, 176
Cyanide spill Baia Mare, Romania, case study, 173–81
Cyclogenesis, 84
D
Dalles Middle School, USA case study, 122–3
Desert definition, 106
Deutsch Anne, 122, 225
Development demolition, 193
Disaster:
and buildings, 4
characteristics, 9
classification, 159
definition, 1
direct effects, 29
general impact, 8
impact, 160
man made, 2
management, 11
mitigation, 11, 58, 210
mitigation for historic buildings, 197
most expensive natural of 20st century, 13–14
prevention strategy trends, 15
response, 10
resulting from human activities, 159
stages of development, 7
technological production related, 161
websites, 227
what it is, 6
Domino effect, 16
Drift principle, 35
E
Earth motions in earthquake, 32
Earthquake:
10 most powerful, 29
characteristics, 23
deadliest on record, 28
definition, 21
effects, 27
emergency checklist, 201
geographic and historic evolution, 26
Indirect or consequential effects, 35
measurement, 24
prediction, 26, 27, 42
statistics, 26
websites and organizations, 229
what happens during, 21
255.
238Index
El Nino, 103, 122
Eltham Orangery, Greenwich, London – case study, 186–93
Energy Q, 119
Environmental degradation, 16
Eurocode, 8, 42
European Agency for Reconstruction, 132
European Standards, 42
Excessive exploitation of natural resources and inappropriate
land development, 159
Explosion design consideration to prevent damage, 136–9
Explosion effect on structural components of buildings, 135
Extreme cold, 103
Extreme heat record, 105
Extreme temperatures effect on buildings, 110
F
FEMA – Project impact, 10, 11
FEMA project Chart, 91,
Fire:
disasters affecting humans, 153
disasters affecting wildland and forests, 152
effects, 154
how it occurs, 151
in public buildings, 154
monitoring information, 229
prevention, 152
types, 152
websites, 229
Flooding:
causes and effects, 63–4
damage to residential property, 65
emergency checklist, 203
how it occurs, 63
prevention design, 66–7
Forest fires, 152
Freeman Historic Properties, 186, 189, 226
Fundamental period, 32–33
G
Geometry of load bearing structure in seismic conditions, 37, 38
Glavin Josh, 122, 225
Global Positioning System (GPS), 43
GOFC (Global Fire Monitoring centre), 155
Green Buildings, 172
Ground lurching, 31
Ground shock wave, 134
Growing poverty in developing countries, 17
H
Harmful by-products and/or processes, 163
Harmful products – manufacture and use, 161, 163
Heat disorders, 212
Heave, heave effect, 125
Heavy metals facts, 176
Historic Buildings:
destruction, 183
earthquake damage, 184
fire damage, 185–6
flood damage, 185
protection in disaster conditions, 196–8
specific type of damage, 184–6
vandalism and neglect, 186
vulnerability and damage, 184
Holbeck Hotel Scarborough case study, 123–4
Hot water circulation principle, 77
HOUSE OF THE PEOPLE, Bucharest Romania, 56
Human and infrastructure vulnerability, 16
Hurricane:
damage, 89
scale Saffir-Simson, 88
what it is and how it occurs, 86–7
Hurricane Andrew case study, 89–90
Hurricane Camille, 89
I
Inappropriate land development, 159, 171–2
Information sources, 227
Inspecting utilities in a damaged home, 205, 210
Inter-governmental Panel on Climate change, 172
Intercontinental Hotel Bucharest Romania, 56
ISDR (UN International Strategy for Disaster
Reduction), 154
J
Johanesburg Summit September, 2002, 4, 16
K
Kossovo war damage, 133
Kumin Jonathan AIA, 224
Kyoto Agreement, 3, 172
L
Landslides, 32
Landslides and mudflows – fact sheet, 214
LCI (layered composite insulation), 118
Lead, 162
Lightning, 92
effects on buildings, 94
protecting buildings from, 94
types, 94
what it is and how it occurs, 92
Liquefaction, 30, 31
Loire river, France case study, 70–1
Loss assessment, 12
M
Magnitude scale, 25
Man made disasters, 129
and Technological advances, 159
and Technological production, 161
Management, 197
256.
IndexMass movement:
types, 121–2
what it is and how it occurs, 120
Matmata houses Sahara, 106
Mechanical enclenching, 53
Michael Fish storm prediction, 82
Milk bottle insulating blankets, 119
Mirauti church Romania consolidation, 54
MIRO Group, 141, 224
MLI (multi-layered insulation), 118
Mount Ruapehu, 62
Mudflows, 124
Mudslides, 32
N
NASA research, 118, 119
Natural Disasters, 19
Natural Resources excessive exploitation, 171
New materials, 118
Northern Ireland peace lines, 140
Northern Ireland case study, 139
Nuclear accident mitigation, 221
P
Paleo seismic method, 44
Pancaking, 33–4
Penneron Bertrand Arh., 224
Peoples’ House (now Parliament House), 56
Pollution, 168–71
Preparedness, 10, 196
PVC Vinyl, 162
R
Radiation, 163
Radioactive plume, 164
Rehabilitation of old structures in seismic conditions, 40
Reignac sur Indre, France: case study, 72
Rena Pitsilli-Graham, 186, 226
Richter Charles, 25, 26, 27
Richter scale, 25
Ring of Fire, 23
Rio Earth Summit 1992, 3, 172
Romanian:
anti-seismic consolidation techniques, 53, 54, 55
historic Buildings – effects of earthquake, 52
legislation and building control, 58
traditional church construction, 52
S
Scale model testing for seismic design, 43
Sea breeze principle, 77
Security glazing, 138, 139
Seiches, 35
Seismic design principles, 28, 36, 42, 43
Seismic resistant construction new ideas, 42, 43, 44
Seismometer high performing, 43
Seven wonders of the world, 27
Shear walls, 39
Sick Building Syndrome (SBS), 171
Slope failure, 120, 121
Soft storey principle, 34, 39, 40
St.Quentin sur Indrois church case study, 95–102
Storm what it is and how it occurs, 77
Storms of 1987 and 2000 in UK – case
studies, 81–6
Storms of UK in 1987 and 2000, 81–5
Subsidence, 125
common causes, 125
preventing damage, 128
type of damage caused by, 126
Surface faulting, 29
Sustainable development, 172
Synthetic aperture radar remote sensing, 43
T
Tectonic plates theory, 22
Telephone exchange Bucharest Romania, 57
Temperature records, 102
extreme cold, 103
extreme heat, 105
Terrorism – Fact sheet, 216
Thames Barrier case study, 67–70
Theodoropoulos Christine, 122, 225
Thermal movement, 111
Thermodeck system, 108
Tornado definition, 89, 91
Tornado ratings, 92
Torsion effect in seismic conditions, 39
Trees: effect on ground near buildings, 126
Tsunamis, 35
U
UN International Startegy for Disaster Reduction, 4
UN strategy to reduce vulnerability to Disasters, 17
UNEP/EPOCHA, 177
V
Vandalism and neglect, 186
Vesuvius, 60, 62
Volcanic eruptions, 60
Volcanic eruptions effects, 61
Volcanos, 59
types, 60
what they are and how they erupt, 59
Vrancea, Romania – case Study, 44–58
W
Weather conditions, 77
Weather information organizations
websites, 229
Wildfire emergency checklist, 219
239
257.
240Index
Wind:
effect on buildings, 79
effect relative to roof shape, 80
loading, 79
pressure, 79, 80
resistance to its effects, 80
scale – Sir Francis Beaufort, 78
Windsor Castle 1992 fire case study, 156
World Trade Center design, 6
World Trade Center collapse – case study, 147