 Бизнес
Похожие презентации:


")


Business Statistics: A First Course. Chapter 7
1.
Business Statistics: A First Course6th Edition
Chapter 7
Sampling and Sampling Distributions
Copyright ©2013 Pearson Education, Inc. publishing as Prentice Hall
Chap 7-1
2.
Learning ObjectivesIn this chapter, you learn:
About different sampling methods
The concept of the sampling distribution
To compute probabilities related to the sample
mean and the sample proportion
The importance of the Central Limit Theorem
Copyright ©2013 Pearson Education, Inc. publishing as Prentice Hall
Chap 7-2
3.
Why Sample?DCOVA
Selecting a sample is less time-consuming
& less costly than selecting every item in
the population (census).
An analysis of a sample is less
cumbersome and more practical than an
analysis of the entire population.
Copyright ©2013 Pearson Education, Inc. publishing as Prentice Hall
Chap 7-3
4.
A Sampling Process Begins With ASampling Frame
DCOVA
The sampling frame is a listing of items that
make up the population
Frames are data sources such as population
lists, directories, or maps
Inaccurate or biased results can result if a
frame excludes certain portions of the
population
Using different frames to generate data can
lead to dissimilar conclusions
Copyright ©2013 Pearson Education, Inc. publishing as Prentice Hall
Chap 7-4
5.
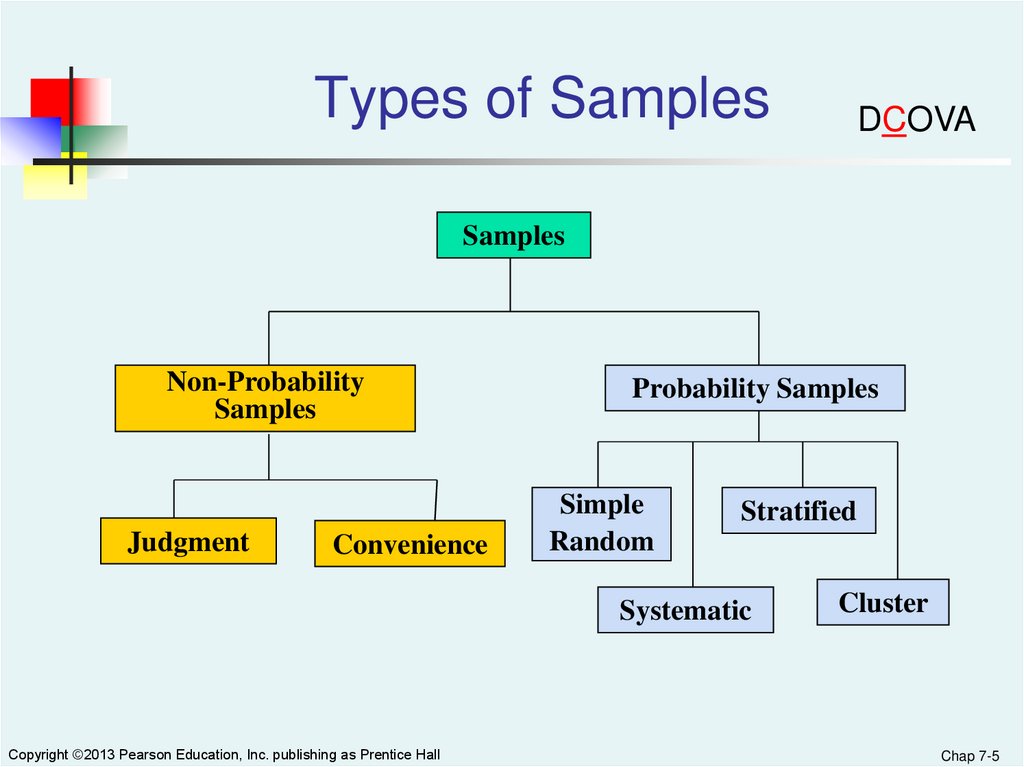
Types of SamplesDCOVA
Samples
Non-Probability
Samples
Judgment
Convenience
Probability Samples
Simple
Random
Stratified
Systematic
Copyright ©2013 Pearson Education, Inc. publishing as Prentice Hall
Cluster
Chap 7-5
6.
Types of Samples:Nonprobability Sample
DCOVA
In a nonprobability sample, items included are
chosen without regard to their probability of
occurrence.
In convenience sampling, items are selected based
only on the fact that they are easy, inexpensive, or
convenient to sample.
In a judgment sample, you get the opinions of preselected experts in the subject matter.
Copyright ©2013 Pearson Education, Inc. publishing as Prentice Hall
Chap 7-6
7.
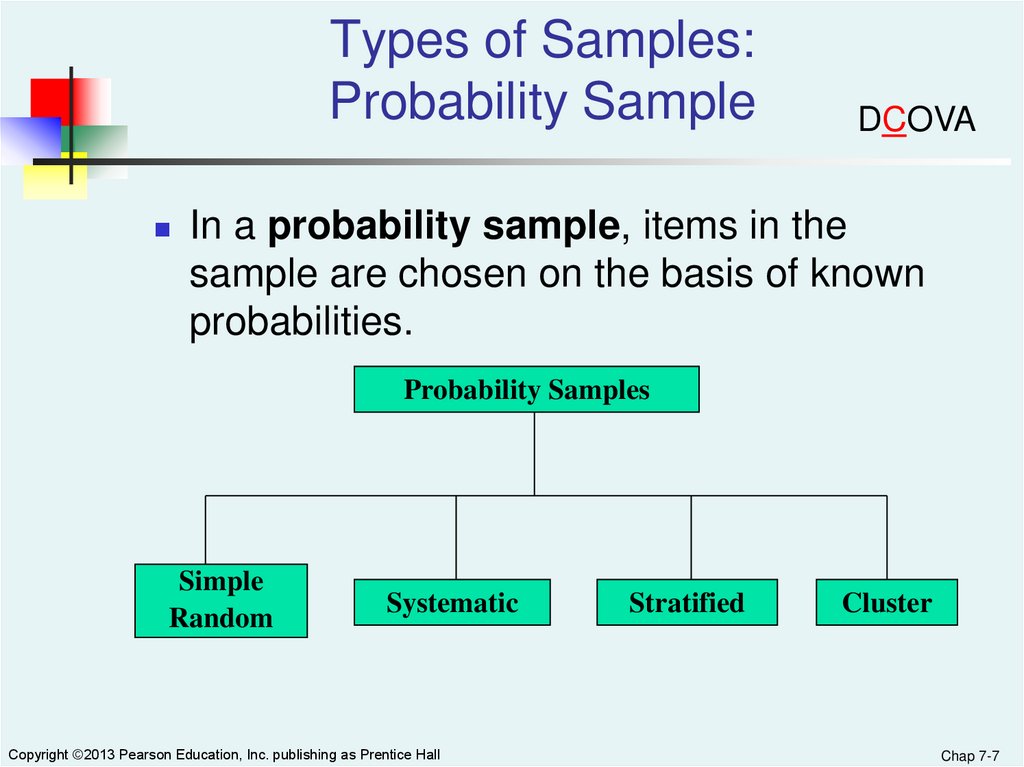
Types of Samples:Probability Sample
DCOVA
In a probability sample, items in the
sample are chosen on the basis of known
probabilities.
Probability Samples
Simple
Random
Systematic
Copyright ©2013 Pearson Education, Inc. publishing as Prentice Hall
Stratified
Cluster
Chap 7-7
8.
Probability Sample:Simple Random Sample
DCOVA
Every individual or item from the frame has an
equal chance of being selected.
Selection may be with replacement (selected
individual is returned to frame for possible
reselection) or without replacement (selected
individual isn’t returned to the frame).
Samples obtained from table of random
numbers or computer random number
generators.
Copyright ©2013 Pearson Education, Inc. publishing as Prentice Hall
Chap 7-8
9.
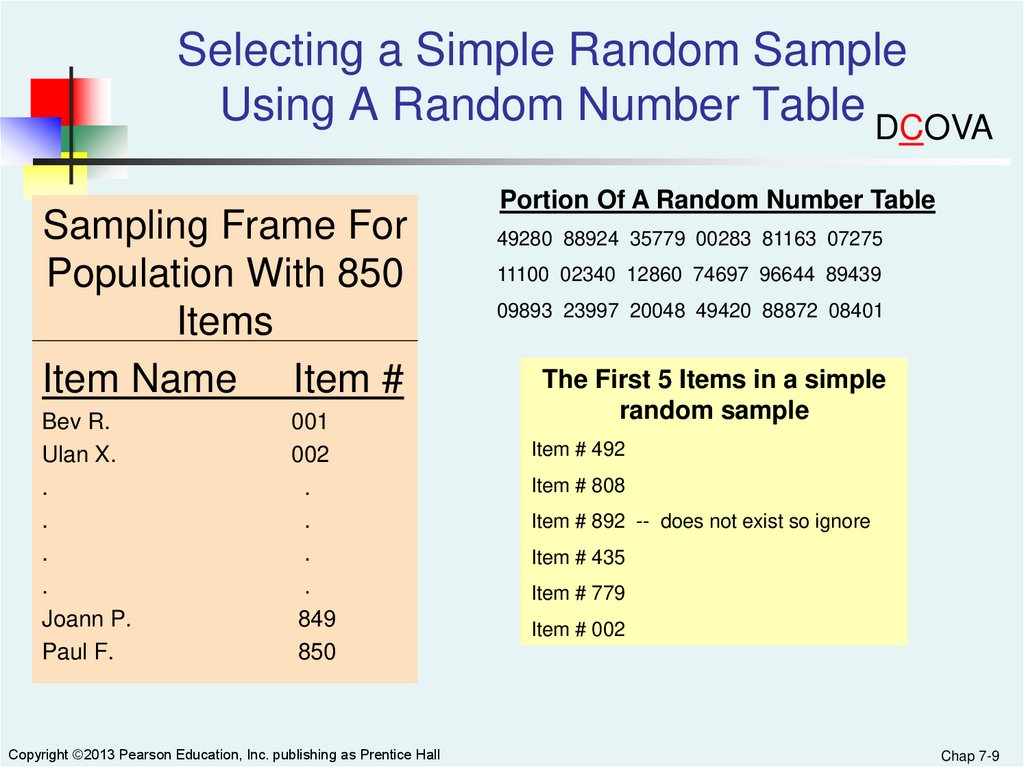
Selecting a Simple Random SampleUsing A Random Number Table DCOVA
Sampling Frame For
Population With 850
Items
Item Name Item #
Bev R.
Ulan X.
.
.
.
.
Joann P.
Paul F.
001
002
.
.
.
.
849
850
Copyright ©2013 Pearson Education, Inc. publishing as Prentice Hall
Portion Of A Random Number Table
49280 88924 35779 00283 81163 07275
11100 02340 12860 74697 96644 89439
09893 23997 20048 49420 88872 08401
The First 5 Items in a simple
random sample
Item # 492
Item # 808
Item # 892 -- does not exist so ignore
Item # 435
Item # 779
Item # 002
Chap 7-9
10.
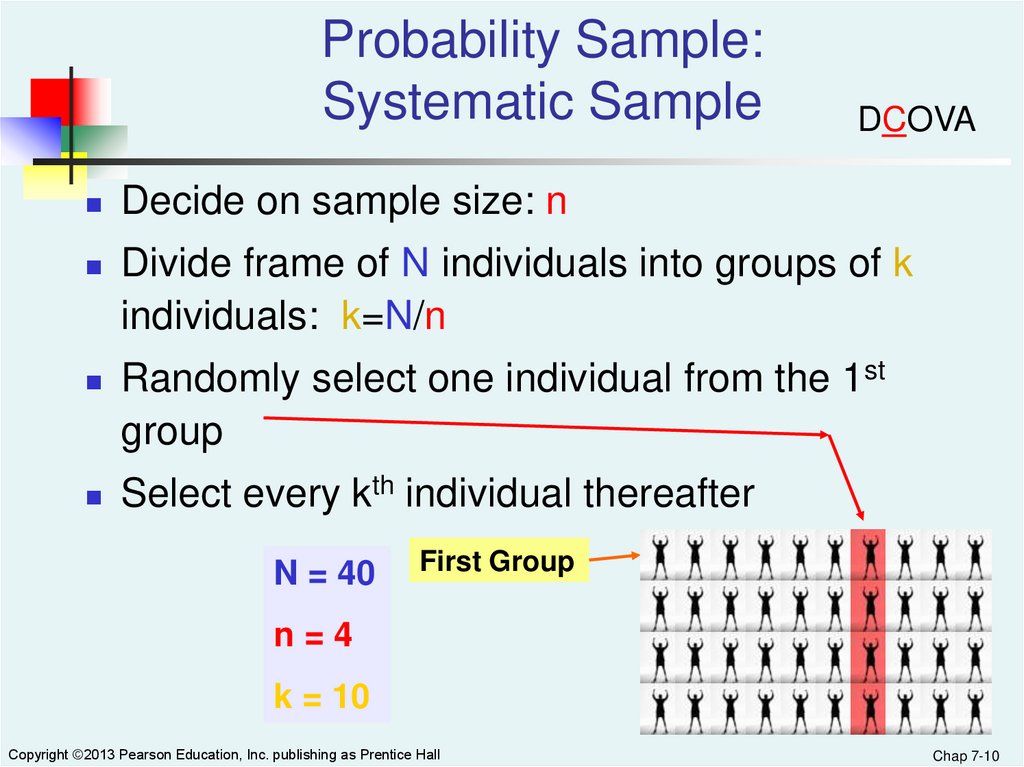
Probability Sample:Systematic Sample
DCOVA
Decide on sample size: n
Divide frame of N individuals into groups of k
individuals: k=N/n
Randomly select one individual from the 1st
group
Select every kth individual thereafter
N = 40
First Group
n=4
k = 10
Copyright ©2013 Pearson Education, Inc. publishing as Prentice Hall
Chap 7-10
11.
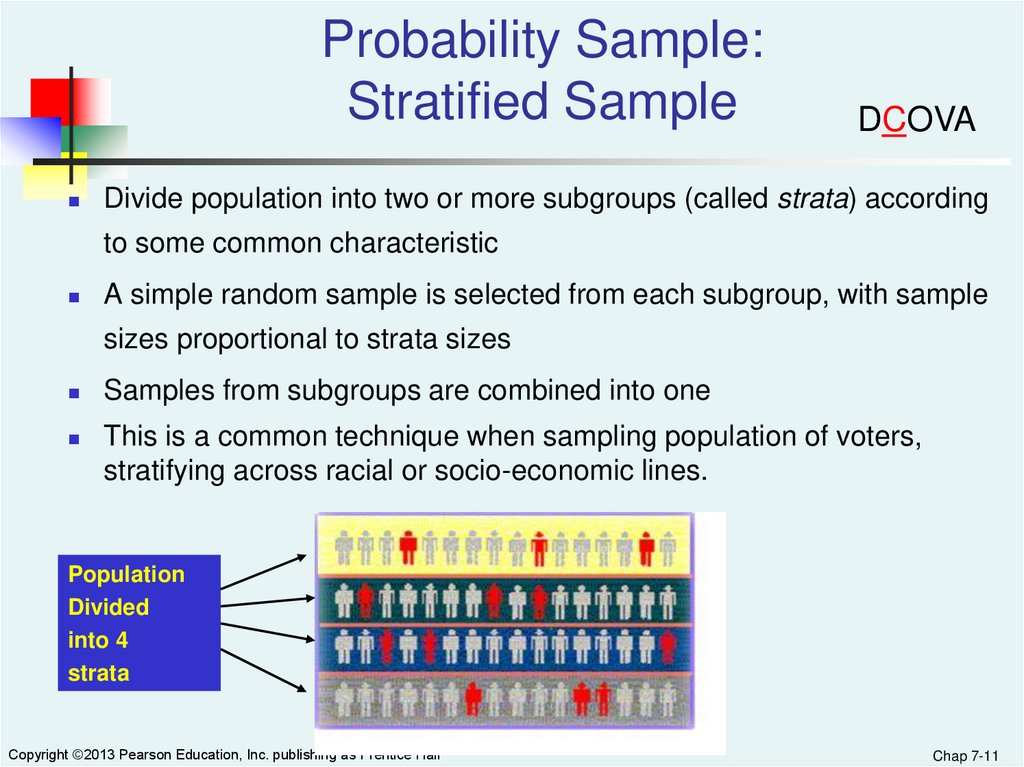
Probability Sample:Stratified Sample
DCOVA
Divide population into two or more subgroups (called strata) according
to some common characteristic
A simple random sample is selected from each subgroup, with sample
sizes proportional to strata sizes
Samples from subgroups are combined into one
This is a common technique when sampling population of voters,
stratifying across racial or socio-economic lines.
Population
Divided
into 4
strata
Copyright ©2013 Pearson Education, Inc. publishing as Prentice Hall
Chap 7-11
12.
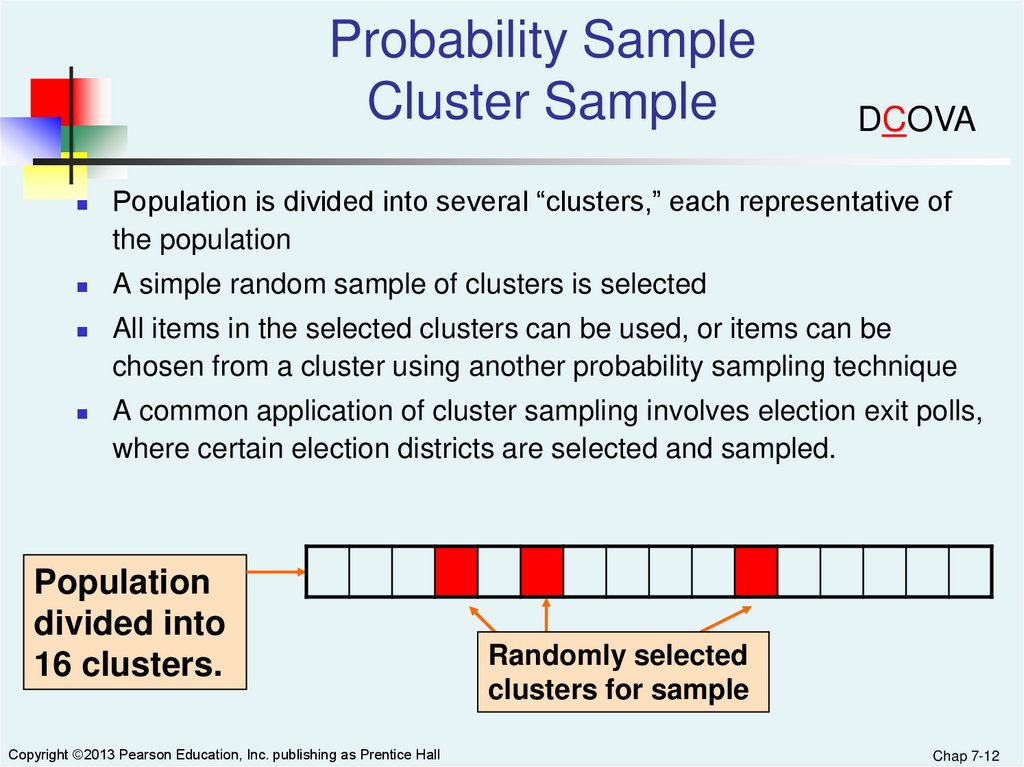
Probability SampleCluster Sample
DCOVA
Population is divided into several “clusters,” each representative of
the population
A simple random sample of clusters is selected
All items in the selected clusters can be used, or items can be
chosen from a cluster using another probability sampling technique
A common application of cluster sampling involves election exit polls,
where certain election districts are selected and sampled.
Population
divided into
16 clusters.
Copyright ©2013 Pearson Education, Inc. publishing as Prentice Hall
Randomly selected
clusters for sample
Chap 7-12
13.
Probability Sample:Comparing Sampling Methods
DCOVA
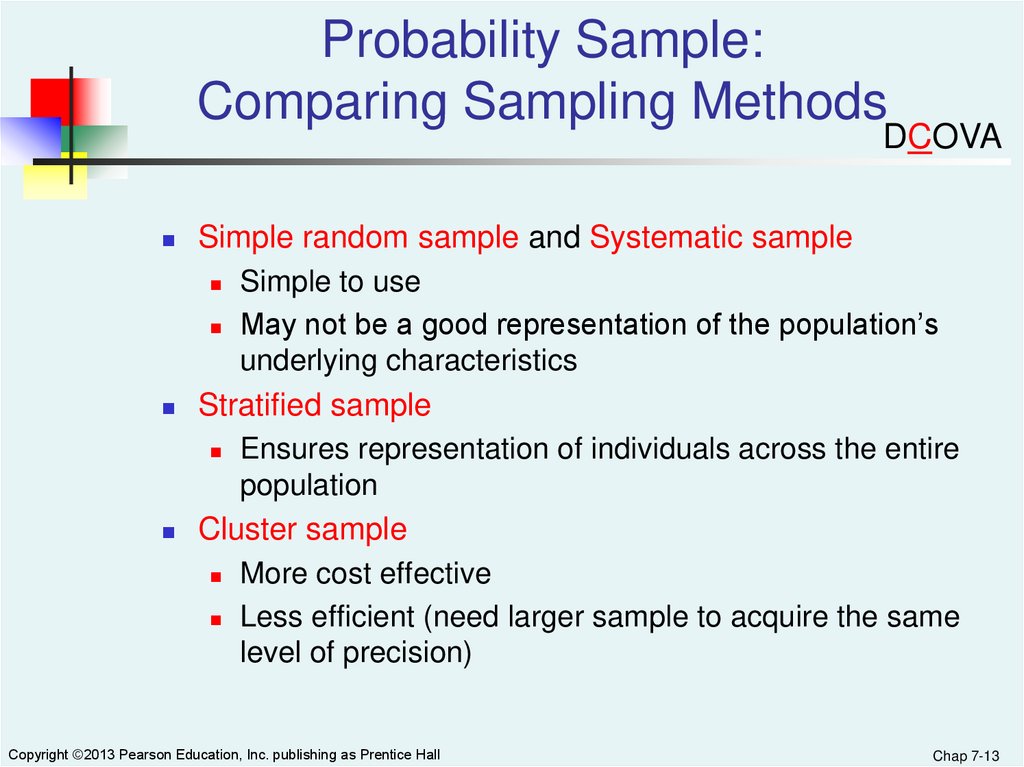
Simple random sample and Systematic sample
Simple to use
May not be a good representation of the population’s
underlying characteristics
Stratified sample
Ensures representation of individuals across the entire
population
Cluster sample
More cost effective
Less efficient (need larger sample to acquire the same
level of precision)
Copyright ©2013 Pearson Education, Inc. publishing as Prentice Hall
Chap 7-13
14.
Probability Sample:Comparing Sampling Methods
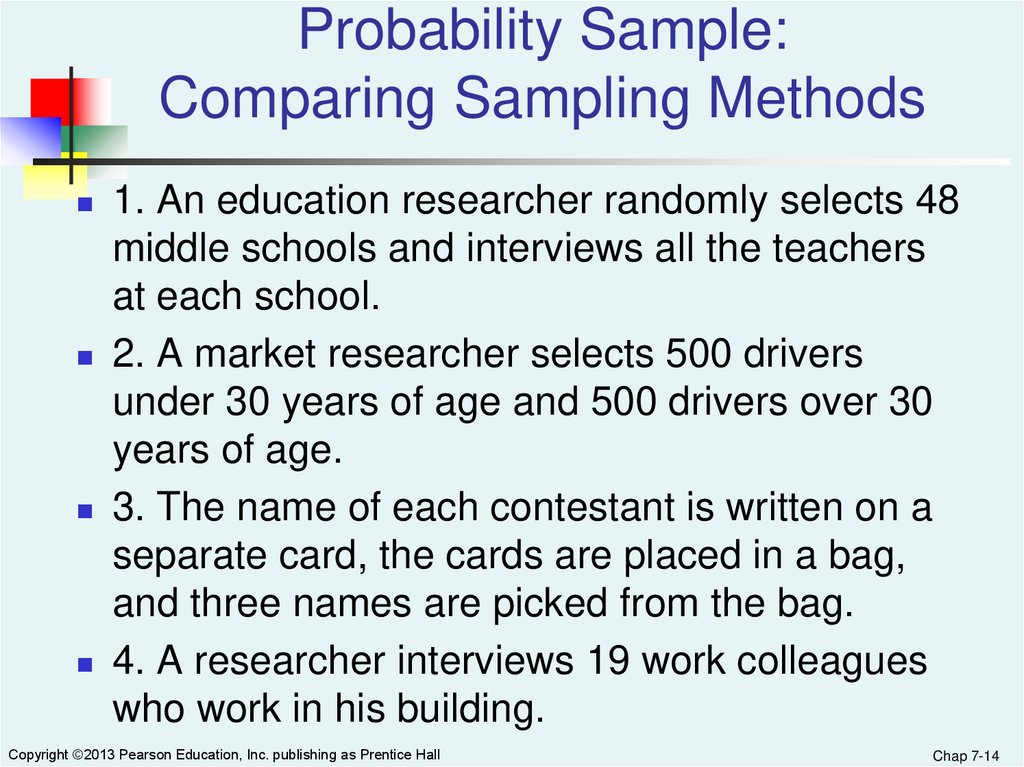
1. An education researcher randomly selects 48
middle schools and interviews all the teachers
at each school.
2. A market researcher selects 500 drivers
under 30 years of age and 500 drivers over 30
years of age.
3. The name of each contestant is written on a
separate card, the cards are placed in a bag,
and three names are picked from the bag.
4. A researcher interviews 19 work colleagues
who work in his building.
Copyright ©2013 Pearson Education, Inc. publishing as Prentice Hall
Chap 7-14
15.
Probability Sample:Comparing Sampling Methods
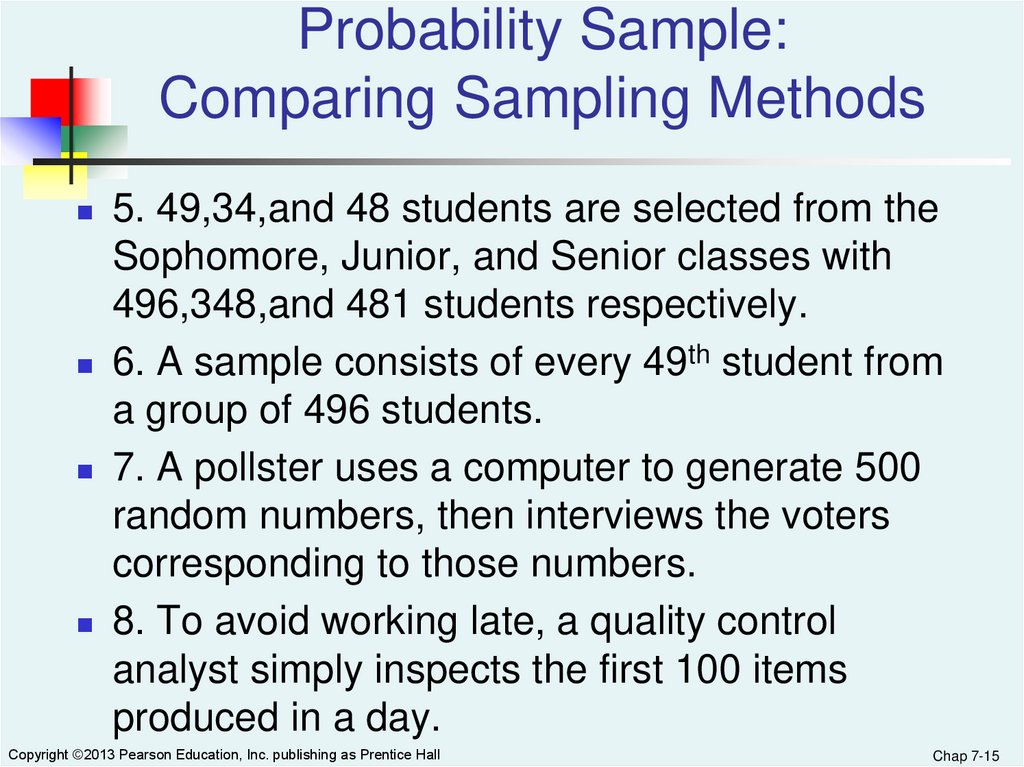
5. 49,34,and 48 students are selected from the
Sophomore, Junior, and Senior classes with
496,348,and 481 students respectively.
6. A sample consists of every 49th student from
a group of 496 students.
7. A pollster uses a computer to generate 500
random numbers, then interviews the voters
corresponding to those numbers.
8. To avoid working late, a quality control
analyst simply inspects the first 100 items
produced in a day.
Copyright ©2013 Pearson Education, Inc. publishing as Prentice Hall
Chap 7-15
16.
Evaluating Survey WorthinessDCOVA
What is the purpose of the survey?
Is the survey based on a probability sample?
Coverage error – appropriate frame?
Nonresponse error – follow up
Measurement error – good questions elicit good
responses
Sampling error – always exists
Copyright ©2013 Pearson Education, Inc. publishing as Prentice Hall
Chap 7-16
17.
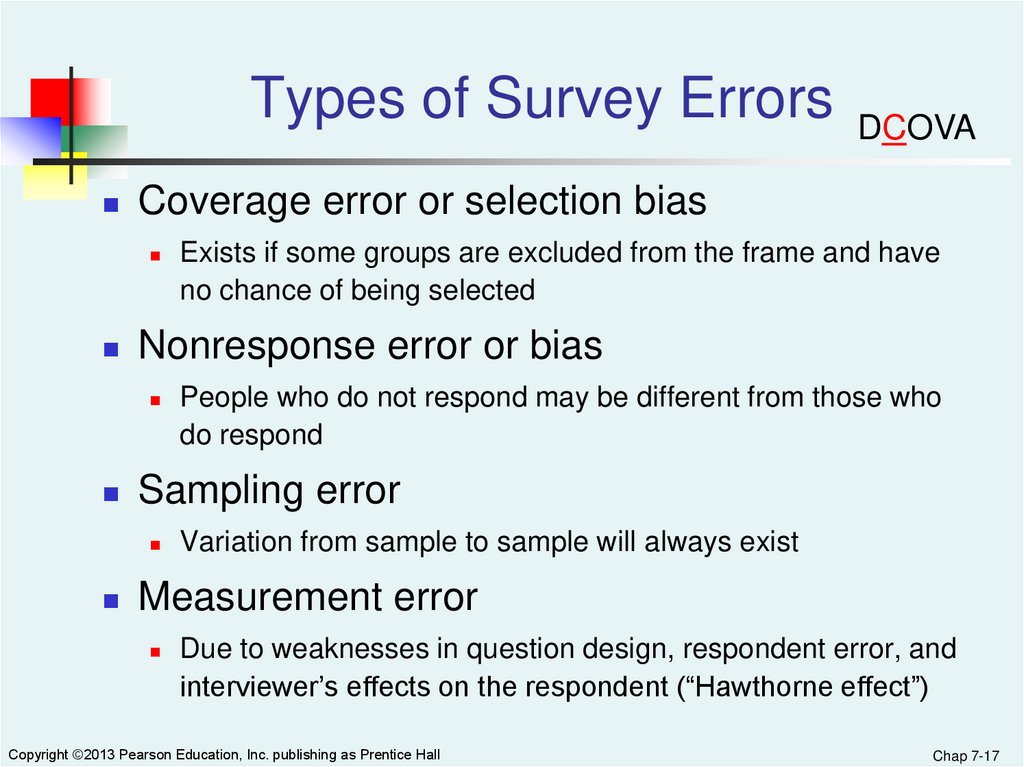
Types of Survey ErrorsCoverage error or selection bias
People who do not respond may be different from those who
do respond
Sampling error
Exists if some groups are excluded from the frame and have
no chance of being selected
Nonresponse error or bias
DCOVA
Variation from sample to sample will always exist
Measurement error
Due to weaknesses in question design, respondent error, and
interviewer’s effects on the respondent (“Hawthorne effect”)
Copyright ©2013 Pearson Education, Inc. publishing as Prentice Hall
Chap 7-17
18.
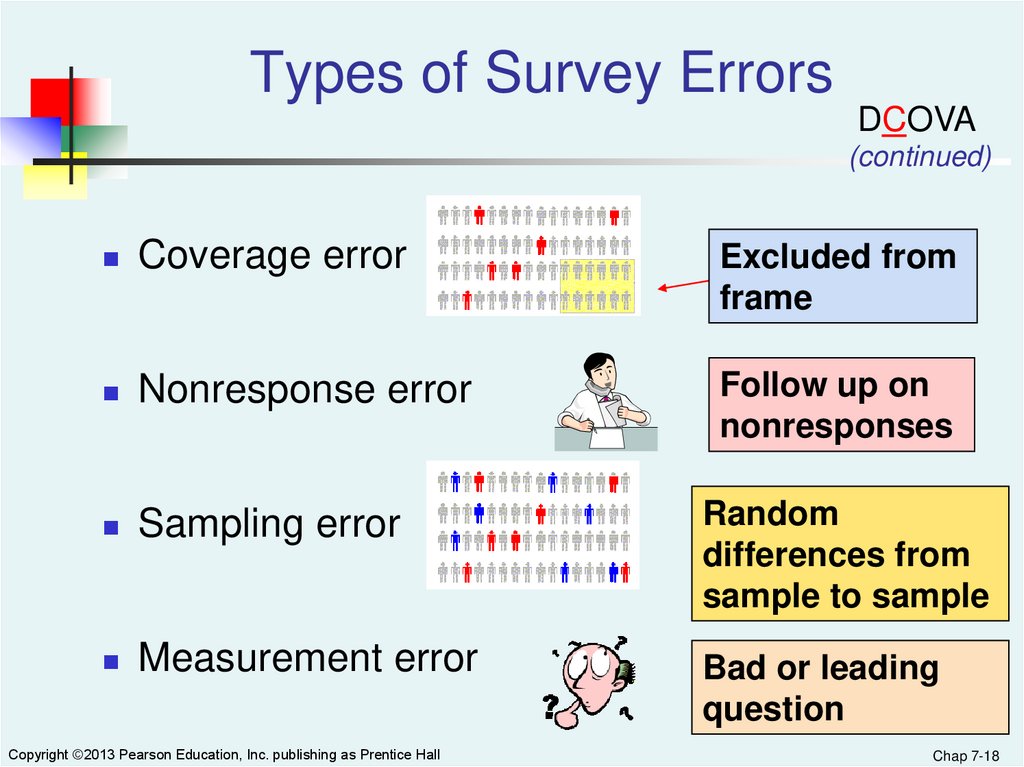
Types of Survey ErrorsDCOVA
(continued)
Coverage error
Excluded from
frame
Nonresponse error
Follow up on
nonresponses
Sampling error
Random
differences from
sample to sample
Measurement error
Bad or leading
question
Copyright ©2013 Pearson Education, Inc. publishing as Prentice Hall
Chap 7-18
19.
Sampling DistributionsDCOVA
A sampling distribution is a distribution of all of the
possible values of a sample statistic for a given size
sample selected from a population.
For example, suppose you sample 50 students from your
college regarding their mean GPA. If you obtained many
different samples of 50, you will compute a different
mean for each sample. We are interested in the
distribution of the mean GPA from all possible samples of
50 students.
Copyright ©2013 Pearson Education, Inc. publishing as Prentice Hall
Chap 7-19
20.
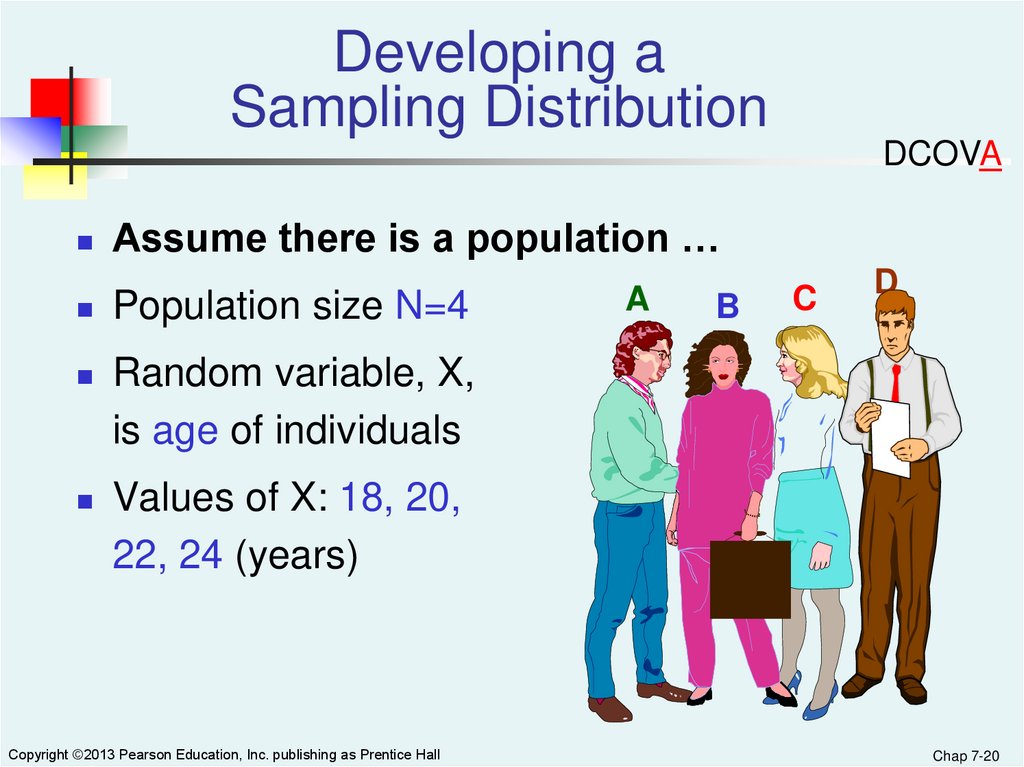
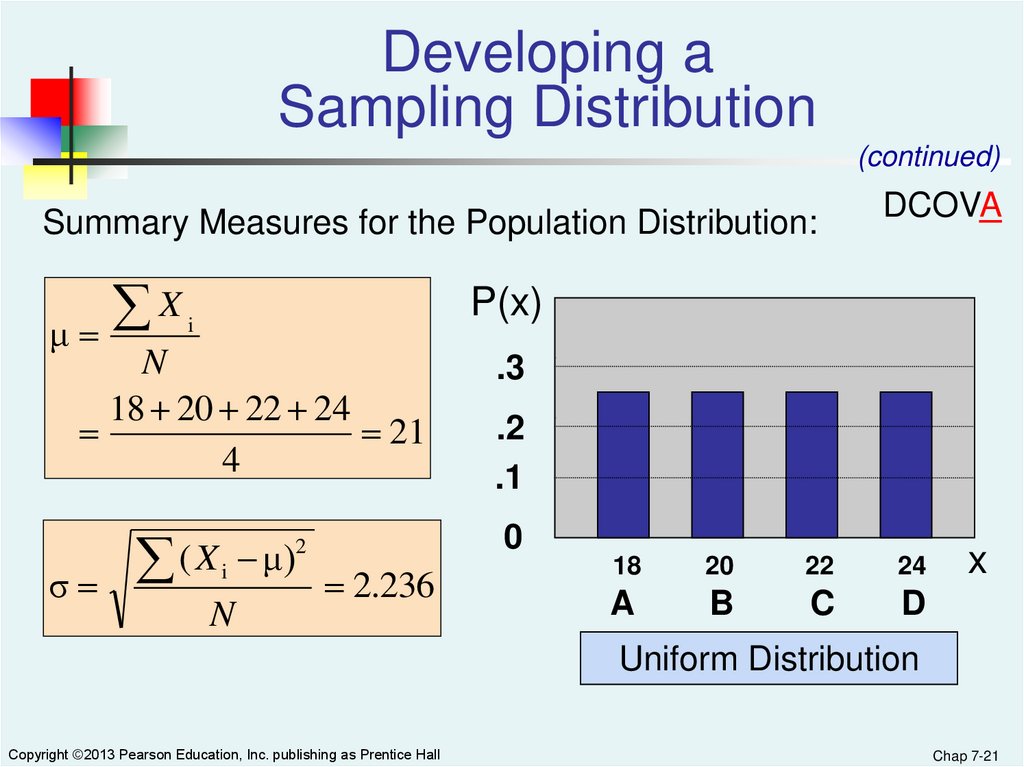
Developing aSampling Distribution
DCOVA
Assume there is a population …
Population size N=4
Random variable, X,
is age of individuals
Values of X: 18, 20,
22, 24 (years)
Copyright ©2013 Pearson Education, Inc. publishing as Prentice Hall
A
B
C
D
Chap 7-20
21.
Developing aSampling Distribution
(continued)
Summary Measures for the Population Distribution:
X
μ
P(x)
i
N
18 20 22 24
21
4
σ
DCOVA
(X
i
N
μ)
.3
.2
.1
0
2
2.236
18
20
22
24
A
B
C
D
x
Uniform Distribution
Copyright ©2013 Pearson Education, Inc. publishing as Prentice Hall
Chap 7-21
22.
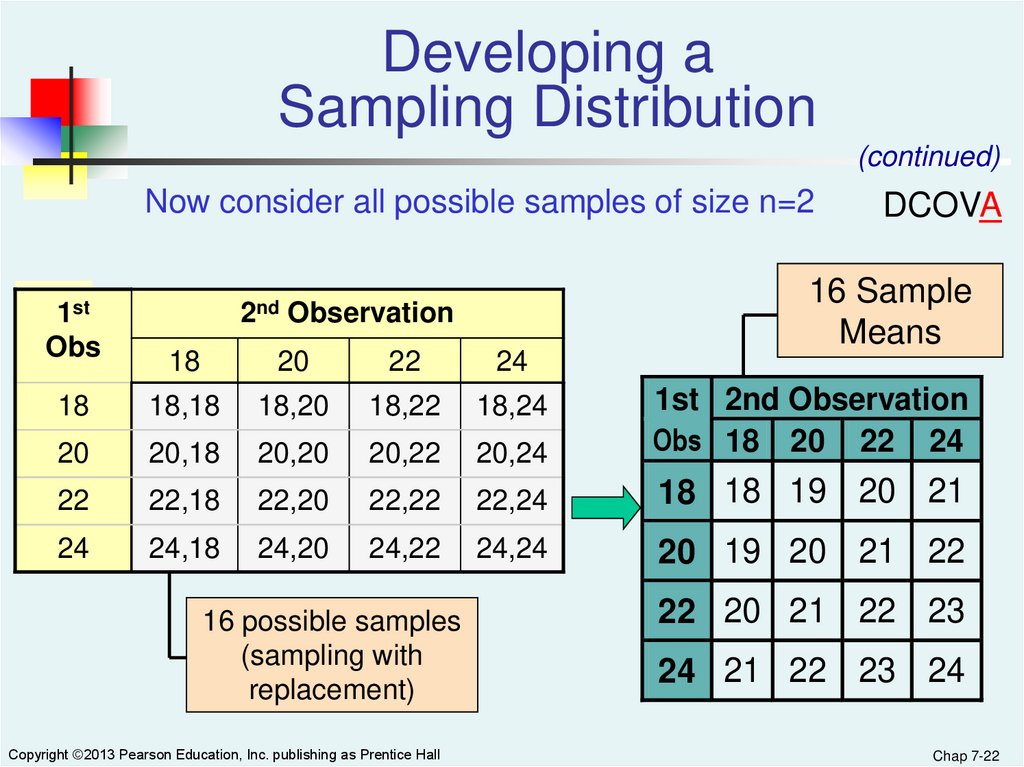
Developing aSampling Distribution
(continued)
Now consider all possible samples of size n=2
1st
Obs
DCOVA
16 Sample
Means
2nd Observation
18
20
22
24
18
18,18
18,20
18,22
18,24
20
20,18
20,20
20,22
20,24
1st 2nd Observation
Obs 18 20 22 24
22
22,18
22,20
22,22
22,24
18 18 19 20 21
24
24,18
24,20
24,22
24,24
20 19 20 21 22
16 possible samples
(sampling with
replacement)
Copyright ©2013 Pearson Education, Inc. publishing as Prentice Hall
22 20 21 22 23
24 21 22 23 24
Chap 7-22
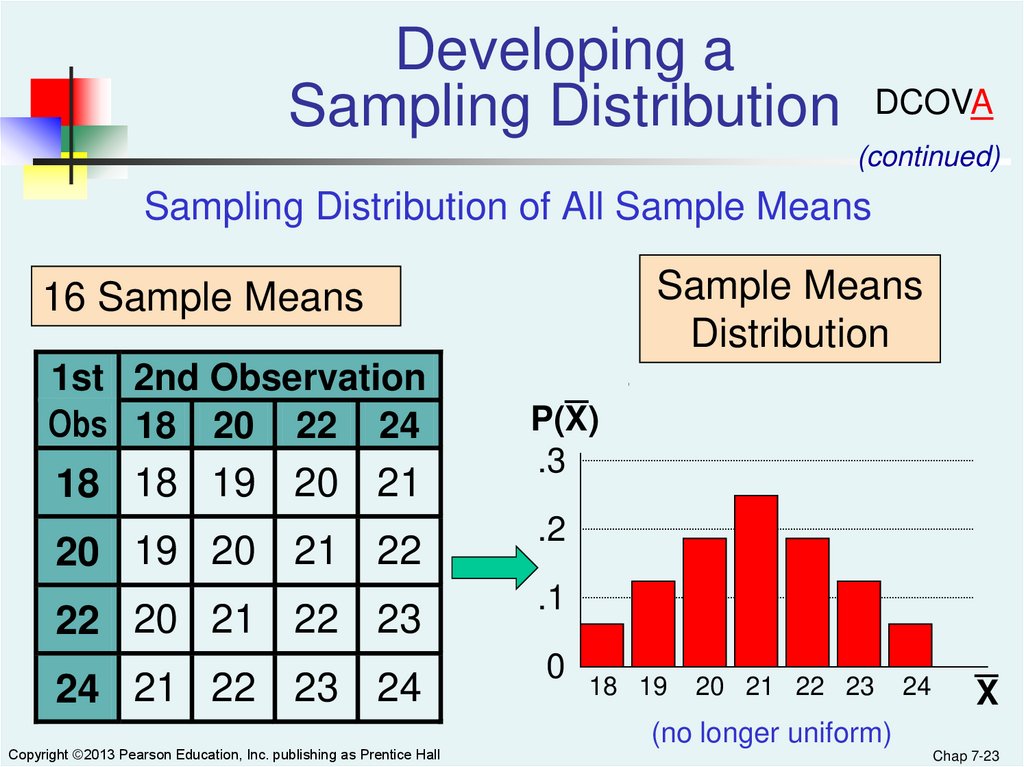
23.
Developing aSampling Distribution
DCOVA
(continued)
Sampling Distribution of All Sample Means
Sample Means
Distribution
16 Sample Means
1st 2nd Observation
Obs 18 20 22 24
18 18 19 20 21
20 19 20 21 22
22 20 21 22 23
24 21 22 23 24
Copyright ©2013 Pearson Education, Inc. publishing as Prentice Hall
_
P(X)
.3
.2
.1
0
18 19
20 21 22 23
24
_
X
(no longer uniform)
Chap 7-23
24.
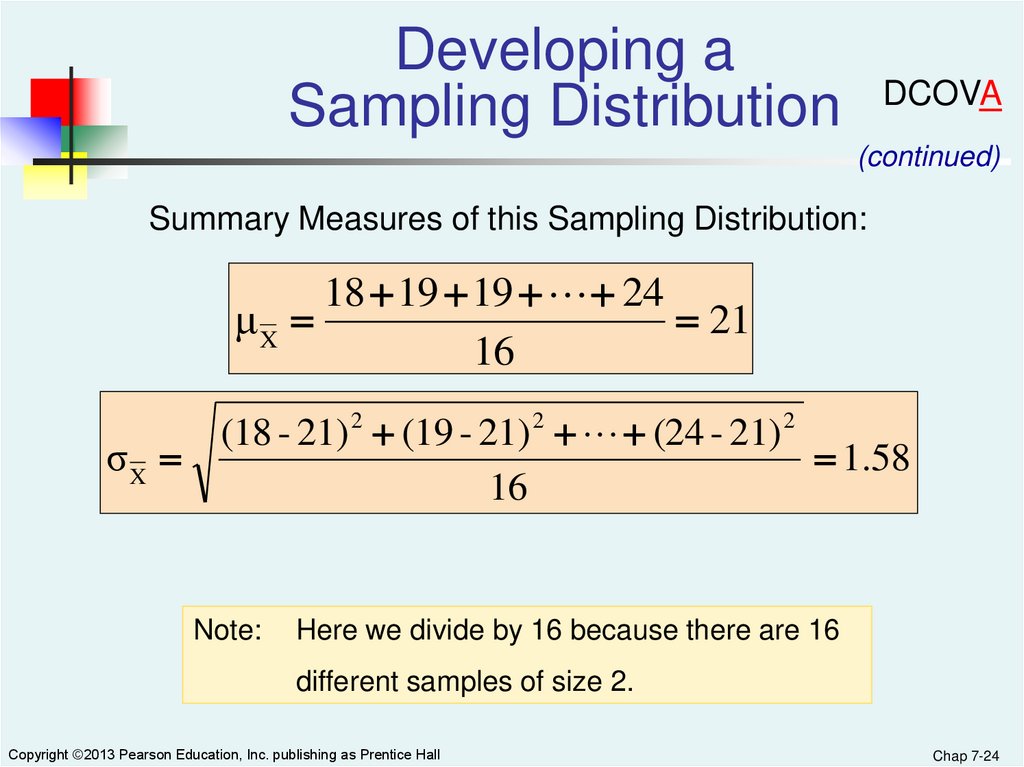
Developing aSampling Distribution
DCOVA
(continued)
Summary Measures of this Sampling Distribution:
18 19 19 24
μX
21
16
σX
(18 - 21) 2 (19 - 21) 2 (24 - 21) 2
1.58
16
Note:
Here we divide by 16 because there are 16
different samples of size 2.
Copyright ©2013 Pearson Education, Inc. publishing as Prentice Hall
Chap 7-24
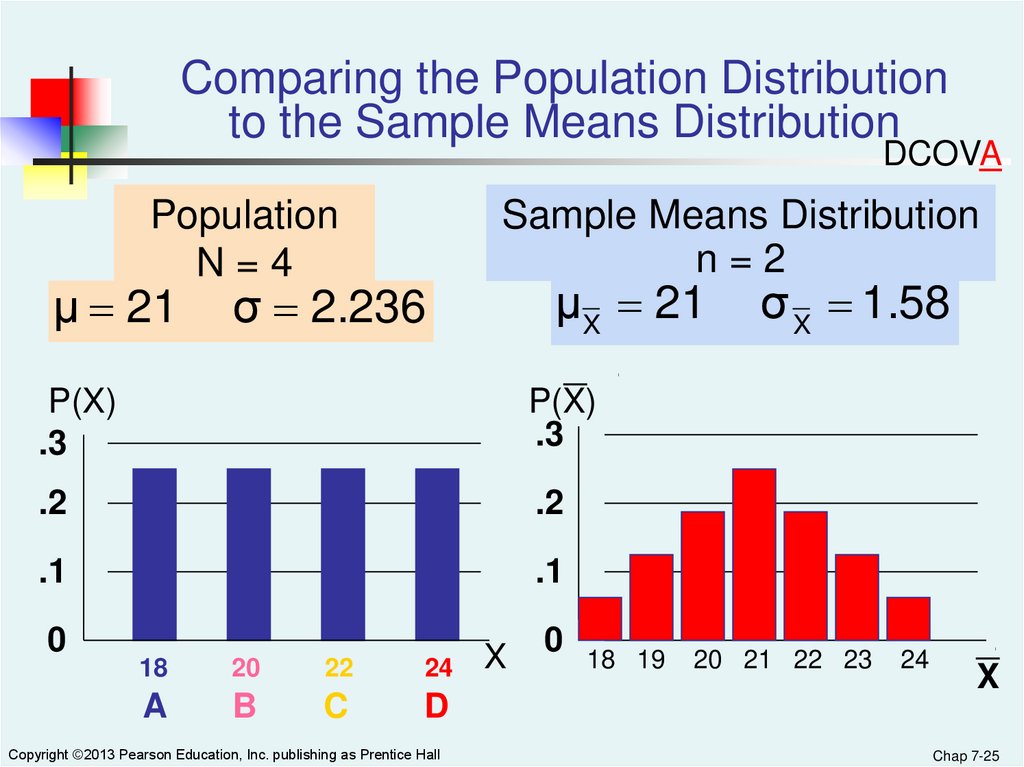
25.
Comparing the Population Distributionto the Sample Means Distribution
DCOVA
Population
N=4
μ 21
σ 2.236
Sample Means Distribution
n=2
μX 21
σ X 1.58
_
P(X)
.3
P(X)
.3
.2
.2
.1
.1
0
18
20
22
24
A
B
C
D
Copyright ©2013 Pearson Education, Inc. publishing as Prentice Hall
X
0
18 19
20 21 22 23
24
_
X
Chap 7-25
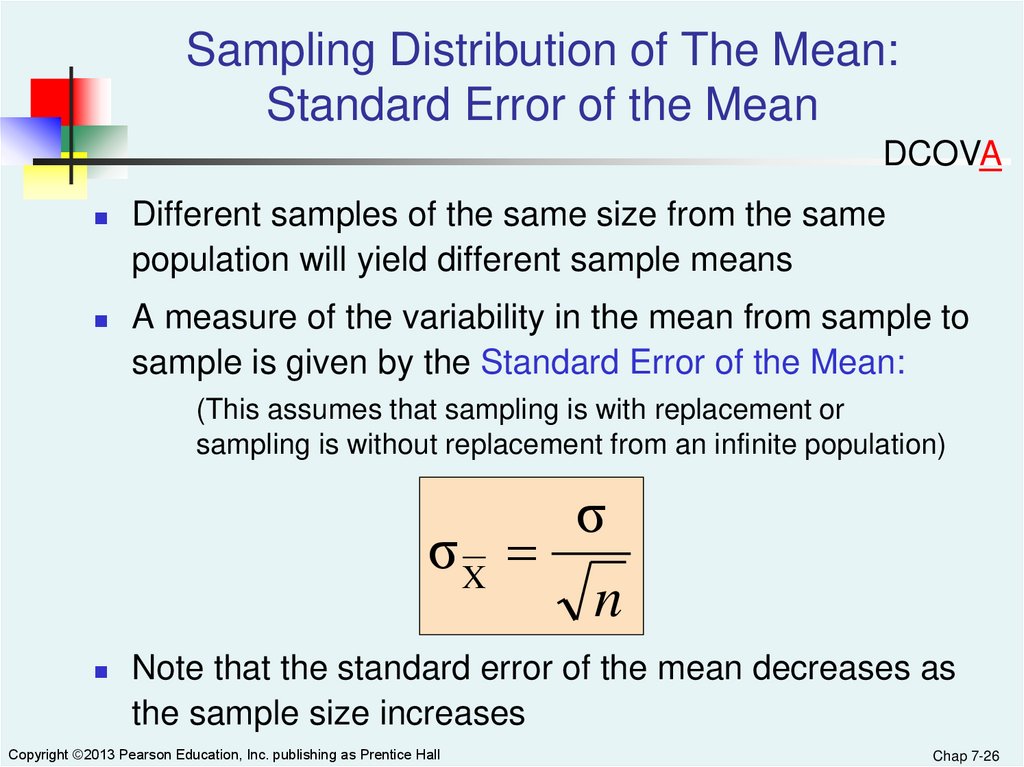
26.
Sampling Distribution of The Mean:Standard Error of the Mean
DCOVA
Different samples of the same size from the same
population will yield different sample means
A measure of the variability in the mean from sample to
sample is given by the Standard Error of the Mean:
(This assumes that sampling is with replacement or
sampling is without replacement from an infinite population)
σ
σX
n
Note that the standard error of the mean decreases as
the sample size increases
Copyright ©2013 Pearson Education, Inc. publishing as Prentice Hall
Chap 7-26
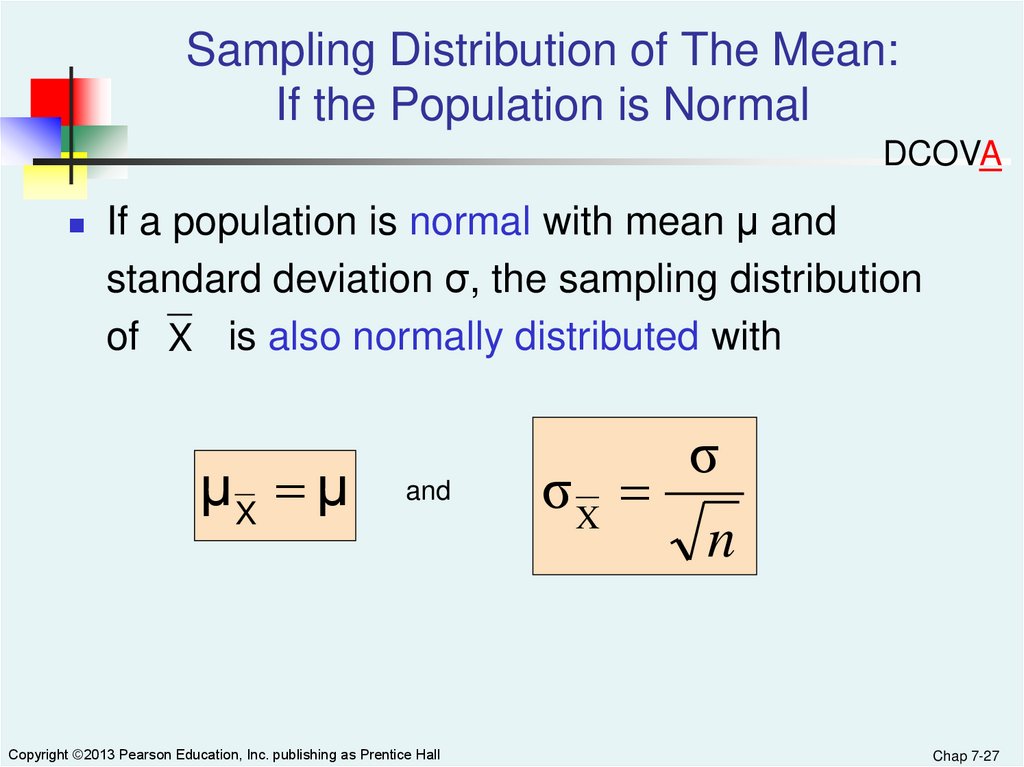
27.
Sampling Distribution of The Mean:If the Population is Normal
DCOVA
If a population is normal with mean μ and
standard deviation σ, the sampling distribution
of X is also normally distributed with
μX μ
and
Copyright ©2013 Pearson Education, Inc. publishing as Prentice Hall
σ
σX
n
Chap 7-27
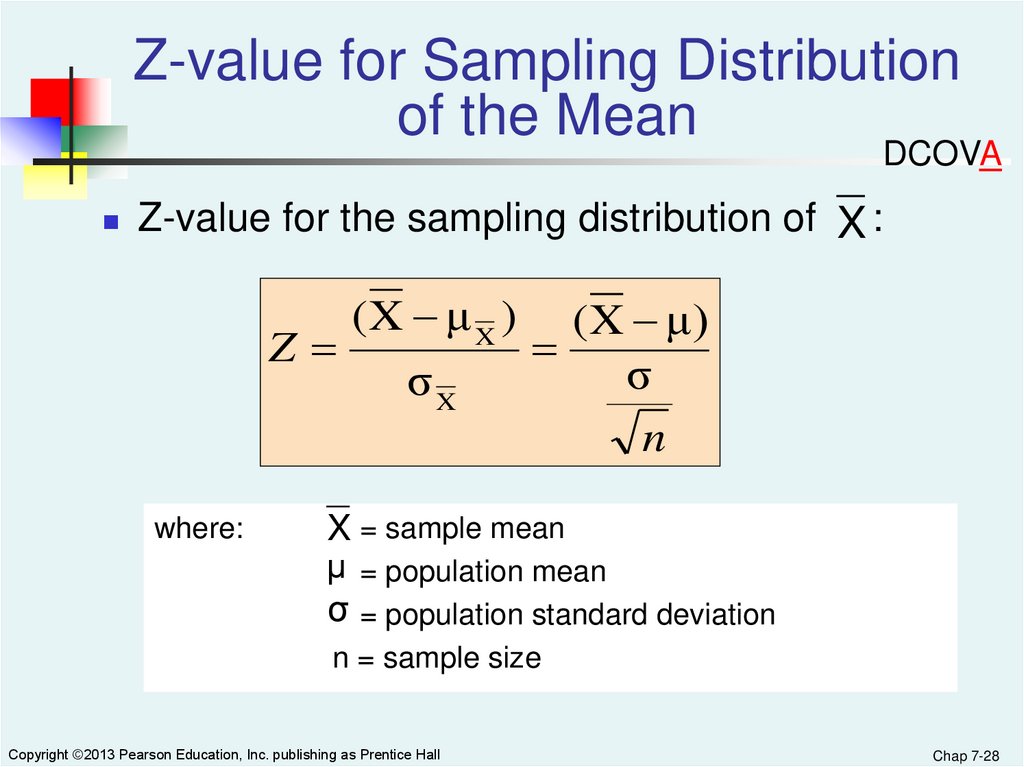
28.
Z-value for Sampling Distributionof the Mean
DCOVA
Z-value for the sampling distribution of X :
Z
where:
(X μ X )
σX
(X μ)
σ
n
X = sample mean
μ = population mean
σ = population standard deviation
n = sample size
Copyright ©2013 Pearson Education, Inc. publishing as Prentice Hall
Chap 7-28
29.
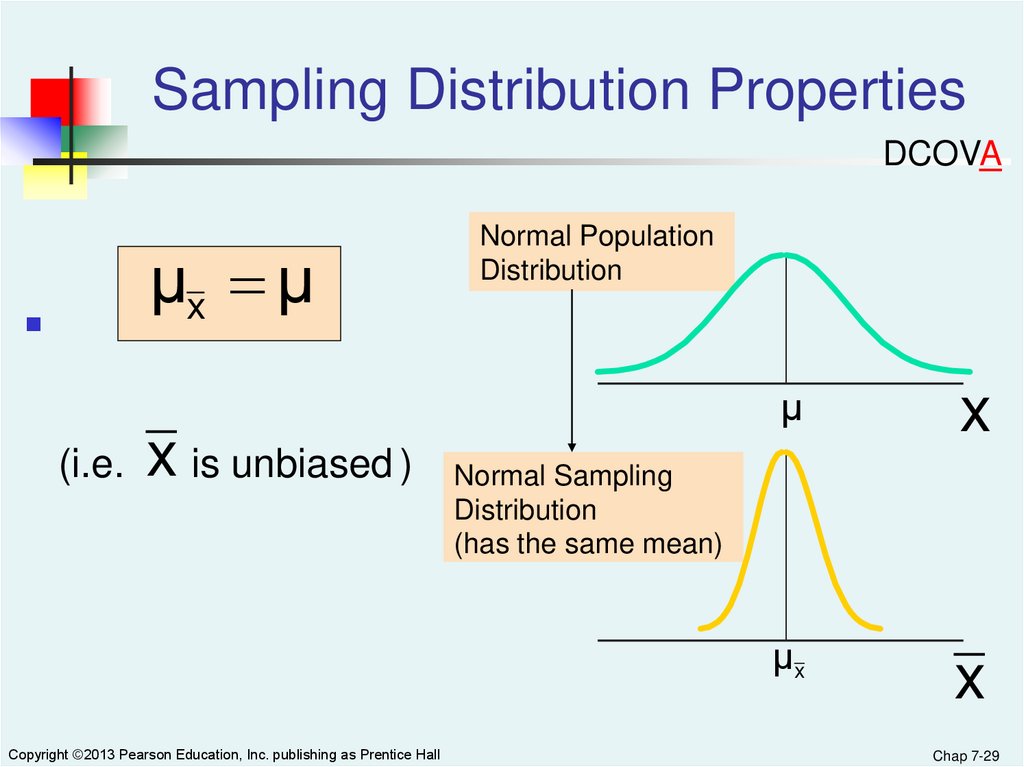
Sampling Distribution PropertiesDCOVA
μx μ
(i.e.
x is unbiased )
Copyright ©2013 Pearson Education, Inc. publishing as Prentice Hall
Normal Population
Distribution
μ
x
μx
x
Normal Sampling
Distribution
(has the same mean)
Chap 7-29
30.
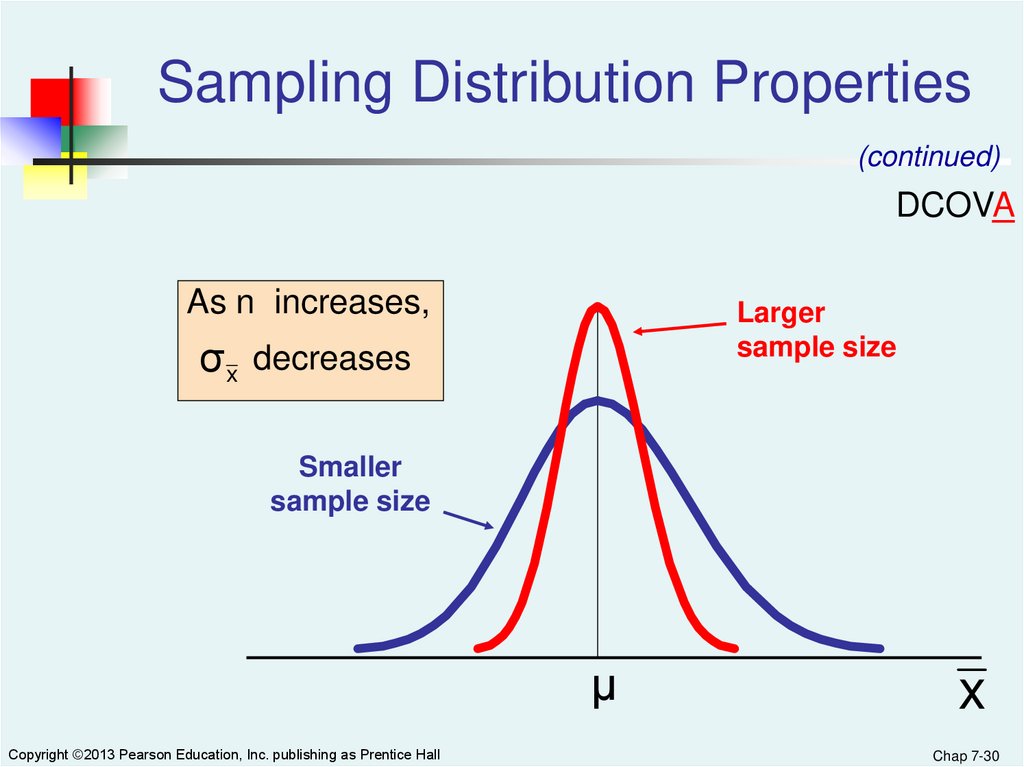
Sampling Distribution Properties(continued)
DCOVA
As n increases,
Larger
sample size
σ x decreases
Smaller
sample size
μ
Copyright ©2013 Pearson Education, Inc. publishing as Prentice Hall
x
Chap 7-30
31.
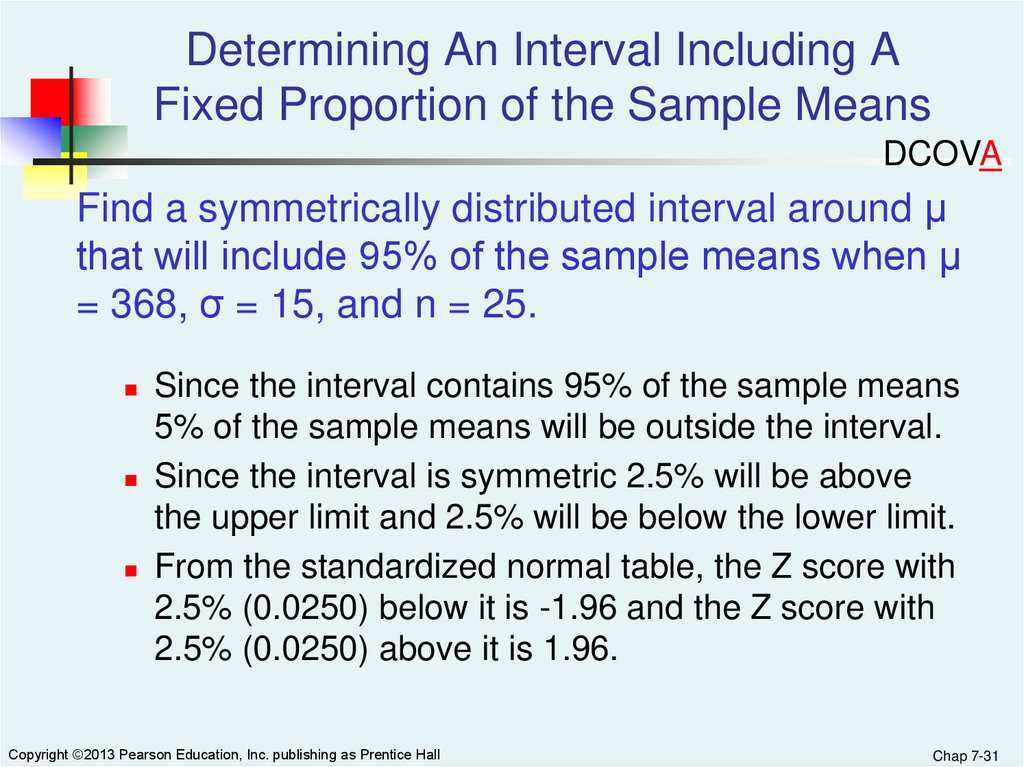
Determining An Interval Including AFixed Proportion of the Sample Means
DCOVA
Find a symmetrically distributed interval around µ
that will include 95% of the sample means when µ
= 368, σ = 15, and n = 25.
Since the interval contains 95% of the sample means
5% of the sample means will be outside the interval.
Since the interval is symmetric 2.5% will be above
the upper limit and 2.5% will be below the lower limit.
From the standardized normal table, the Z score with
2.5% (0.0250) below it is -1.96 and the Z score with
2.5% (0.0250) above it is 1.96.
Copyright ©2013 Pearson Education, Inc. publishing as Prentice Hall
Chap 7-31
32.
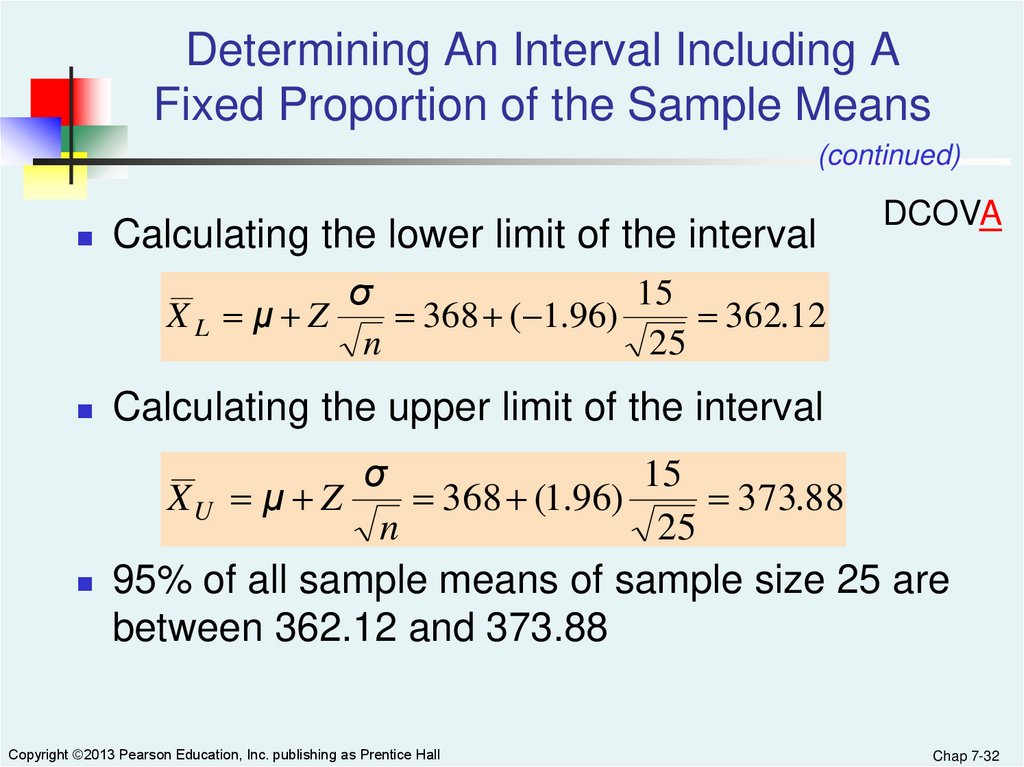
Determining An Interval Including AFixed Proportion of the Sample Means
(continued)
Calculating the lower limit of the interval
DCOVA
σ
15
XL μ Z
368 ( 1.96)
362.12
n
25
Calculating the upper limit of the interval
σ
15
XU μ Z
368 (1.96)
373.88
n
25
95% of all sample means of sample size 25 are
between 362.12 and 373.88
Copyright ©2013 Pearson Education, Inc. publishing as Prentice Hall
Chap 7-32
33.
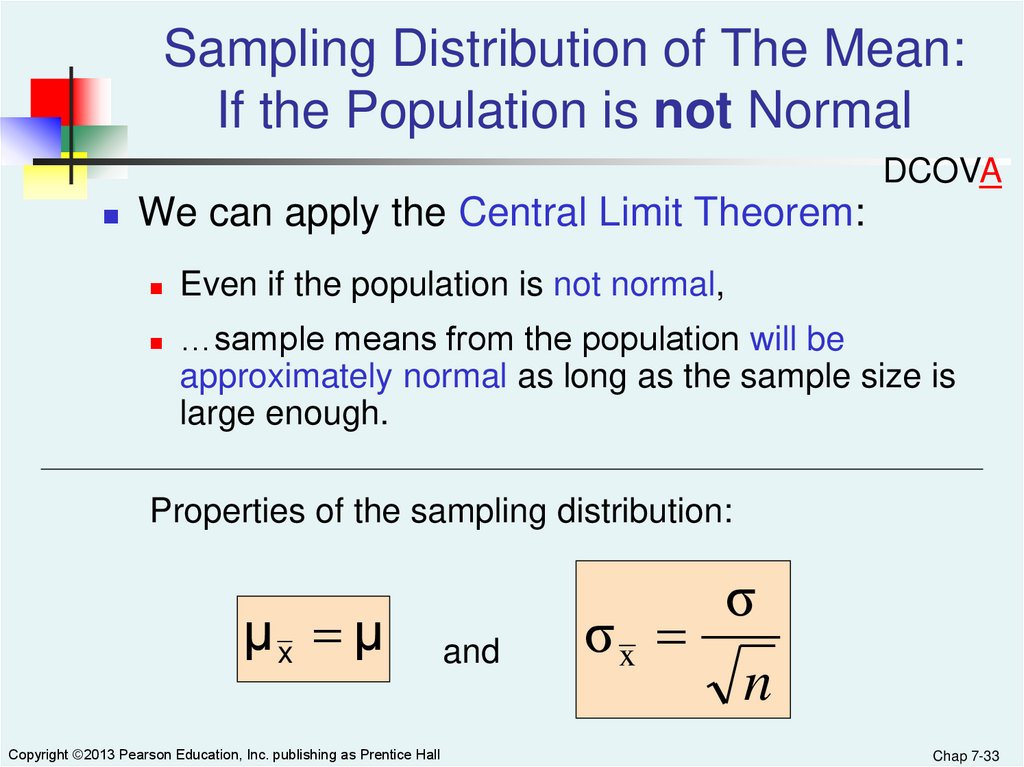
Sampling Distribution of The Mean:If the Population is not Normal
DCOVA
We can apply the Central Limit Theorem:
Even if the population is not normal,
…sample means from the population will be
approximately normal as long as the sample size is
large enough.
Properties of the sampling distribution:
μx μ
Copyright ©2013 Pearson Education, Inc. publishing as Prentice Hall
and
σ
σx
n
Chap 7-33
34.
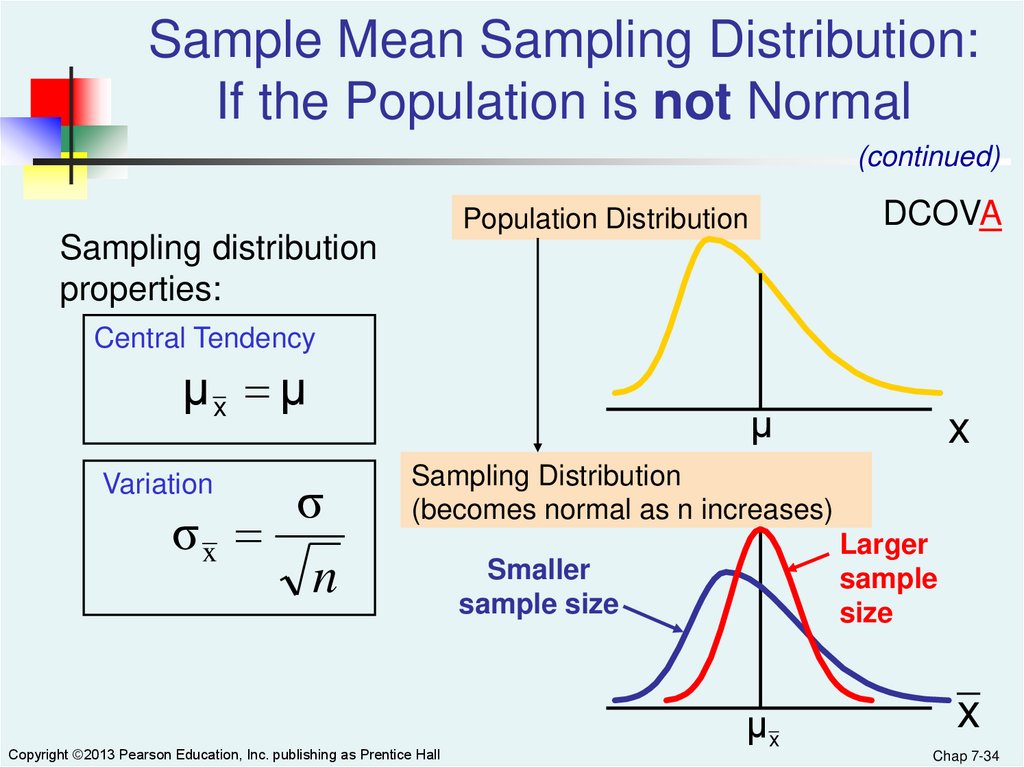
Sample Mean Sampling Distribution:If the Population is not Normal
(continued)
DCOVA
Population Distribution
Sampling distribution
properties:
Central Tendency
μx μ
σ
σx
n
Variation
μ
x
Sampling Distribution
(becomes normal as n increases)
Copyright ©2013 Pearson Education, Inc. publishing as Prentice Hall
Larger
sample
size
Smaller
sample size
μx
x
Chap 7-34
35.
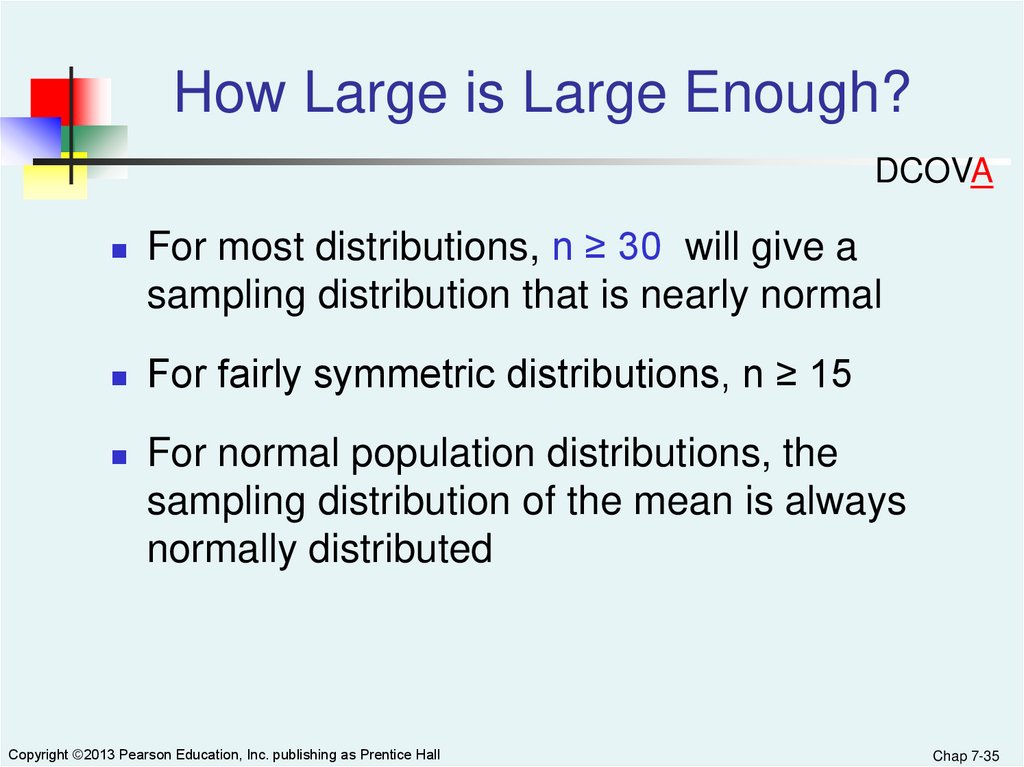
How Large is Large Enough?DCOVA
For most distributions, n ≥ 30 will give a
sampling distribution that is nearly normal
For fairly symmetric distributions, n ≥ 15
For normal population distributions, the
sampling distribution of the mean is always
normally distributed
Copyright ©2013 Pearson Education, Inc. publishing as Prentice Hall
Chap 7-35
36.
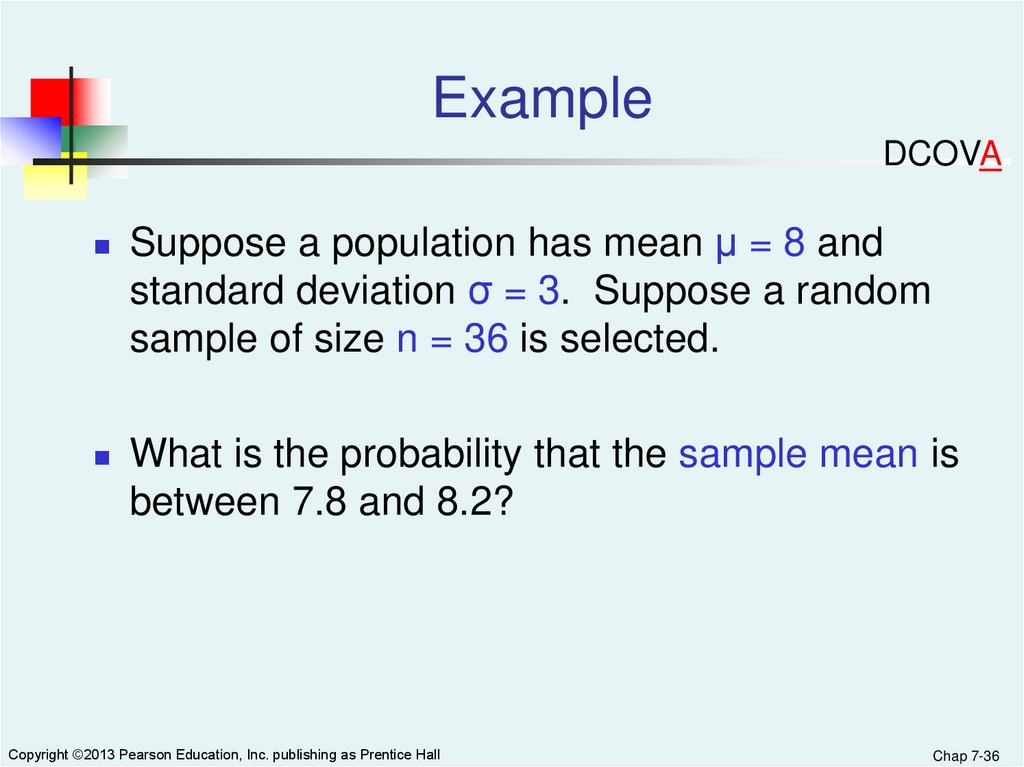
ExampleDCOVA
Suppose a population has mean μ = 8 and
standard deviation σ = 3. Suppose a random
sample of size n = 36 is selected.
What is the probability that the sample mean is
between 7.8 and 8.2?
Copyright ©2013 Pearson Education, Inc. publishing as Prentice Hall
Chap 7-36
37.
Example(continued)
DCOVA
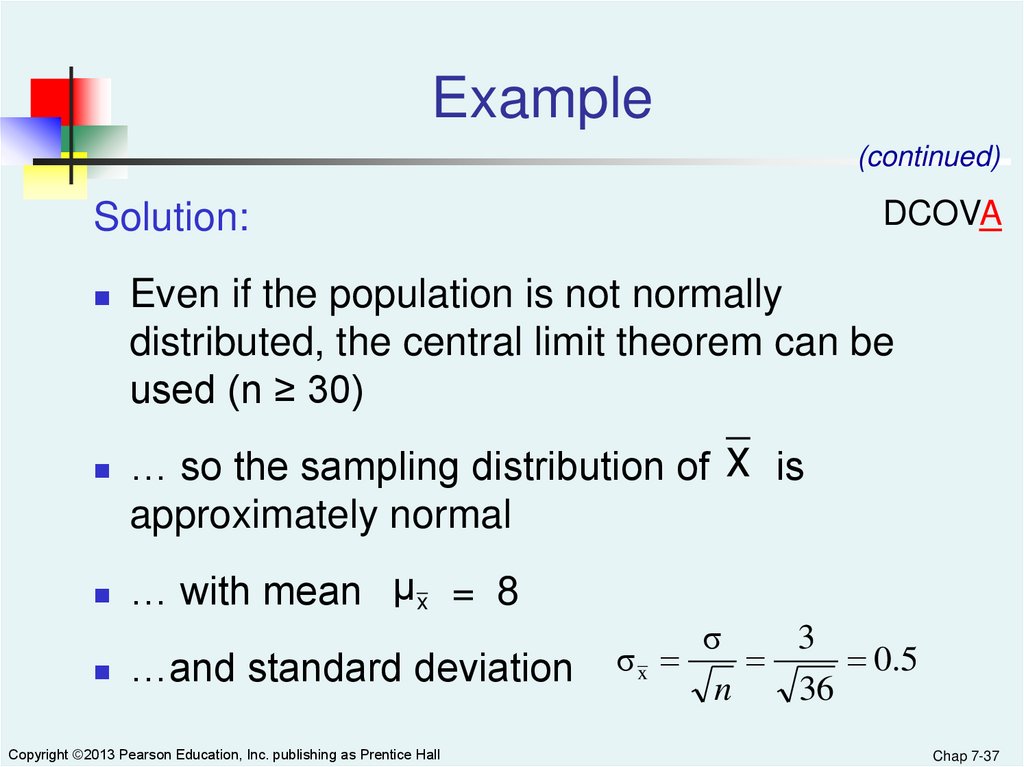
Solution:
Even if the population is not normally
distributed, the central limit theorem can be
used (n ≥ 30)
… so the sampling distribution of
approximately normal
x
is
… with mean μx = 8
…and standard deviation
Copyright ©2013 Pearson Education, Inc. publishing as Prentice Hall
σ
3
σx
0.5
n
36
Chap 7-37
38.
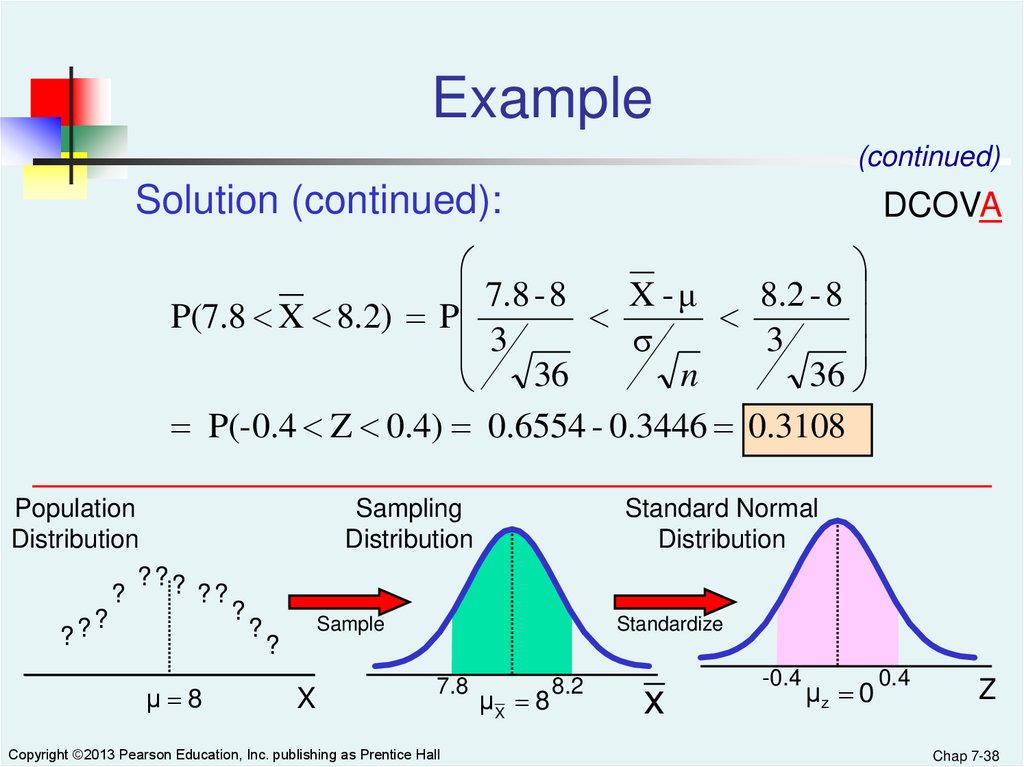
Example(continued)
Solution (continued):
DCOVA
7.8 - 8
X -μ
8.2 - 8
P(7.8 X 8.2) P
3
σ
3
36
n
36
P(-0.4 Z 0.4) 0.6554 - 0.3446 0.3108
Population
Distribution
???
?
??
?
?
?
?
?
μ 8
Sampling
Distribution
Standard Normal
Distribution
Sample
Standardize
?
X
7.8
Copyright ©2013 Pearson Education, Inc. publishing as Prentice Hall
μX 8
8.2
x
-0.4
μz 0
0.4
Z
Chap 7-38
39.
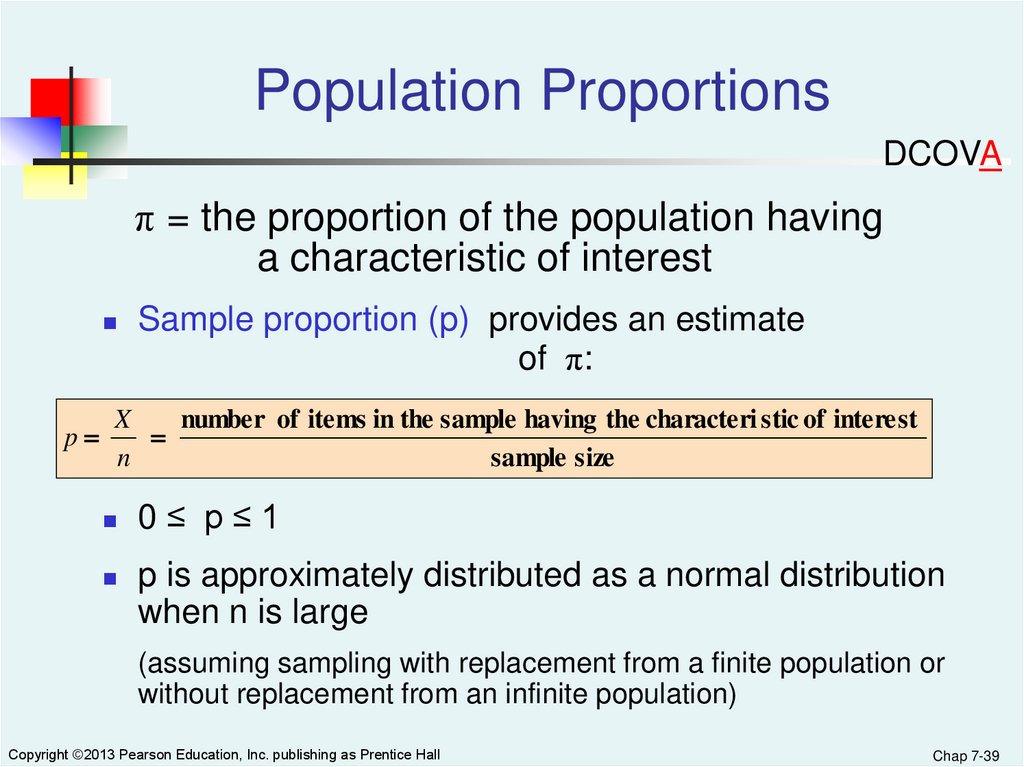
Population ProportionsDCOVA
π = the proportion of the population having
a characteristic of interest
p
Sample proportion (p) provides an estimate
of π:
X
number of items in the sample having the characteri stic of interest
n
sample size
0≤ p≤1
p is approximately distributed as a normal distribution
when n is large
(assuming sampling with replacement from a finite population or
without replacement from an infinite population)
Copyright ©2013 Pearson Education, Inc. publishing as Prentice Hall
Chap 7-39
40.
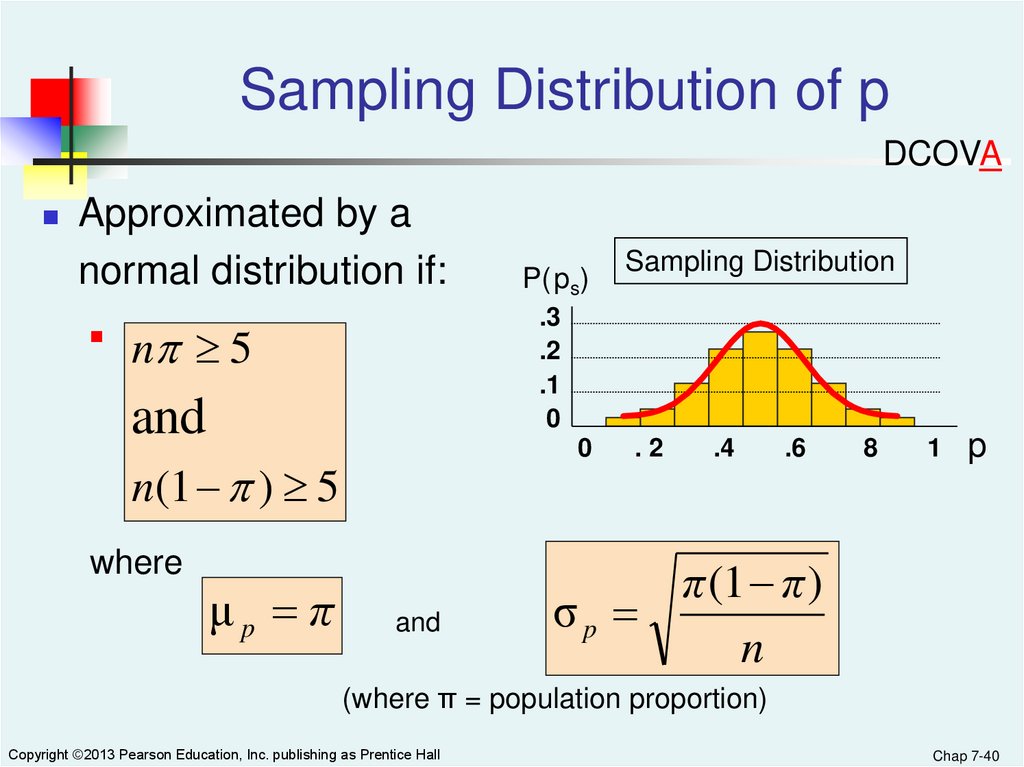
Sampling Distribution of pDCOVA
Approximated by a
normal distribution if:
and
0
n(1 ) 5
μp π
Sampling Distribution
.3
.2
.1
0
n 5
where
P( ps)
and
.2
.4
.6
8
1
p
π (1 π )
σp
n
(where π = population proportion)
Copyright ©2013 Pearson Education, Inc. publishing as Prentice Hall
Chap 7-40
41.
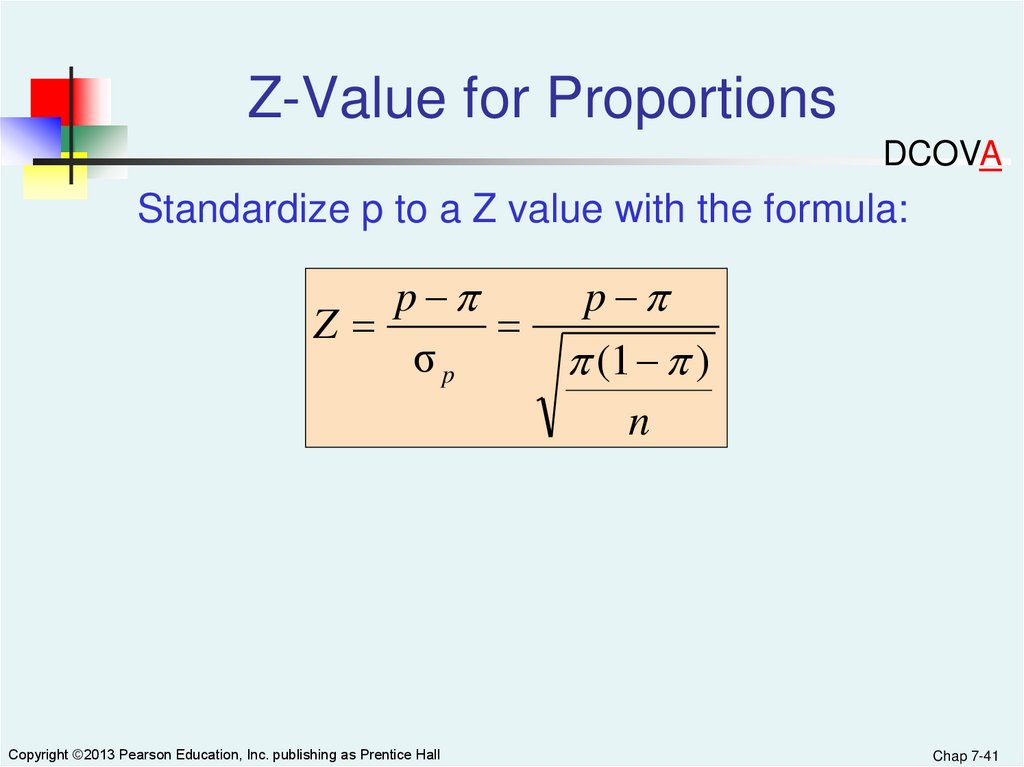
Z-Value for ProportionsDCOVA
Standardize p to a Z value with the formula:
p
Z
σp
Copyright ©2013 Pearson Education, Inc. publishing as Prentice Hall
p
(1 )
n
Chap 7-41
42.
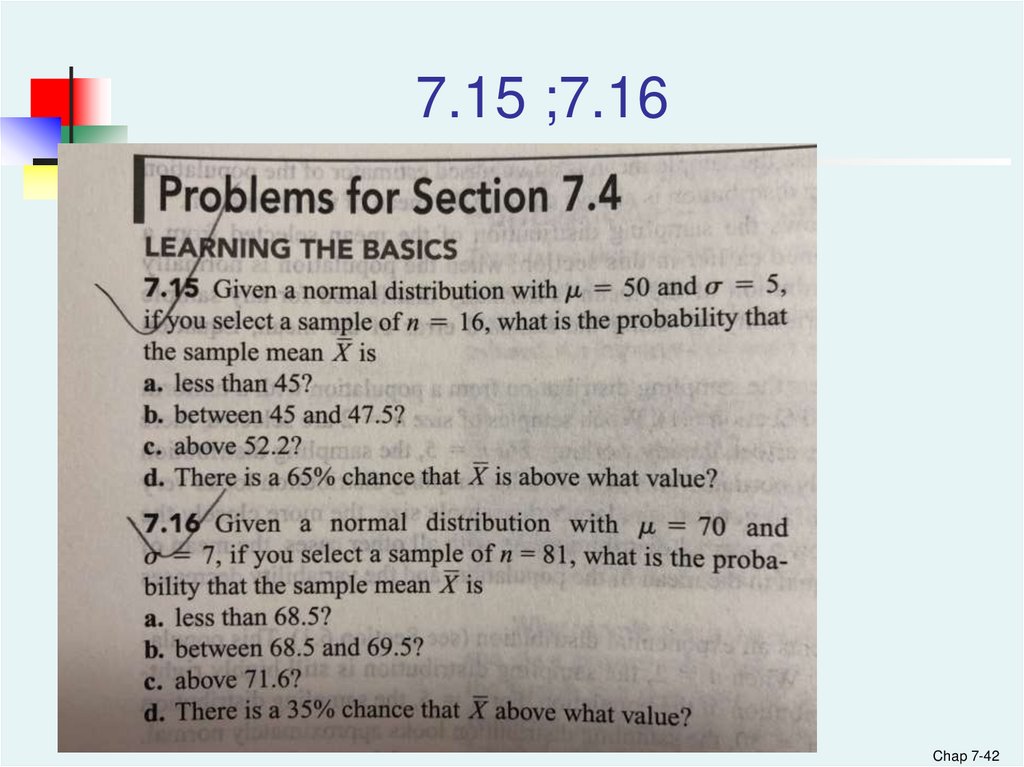
7.15 ;7.16Chap 7-42
43.
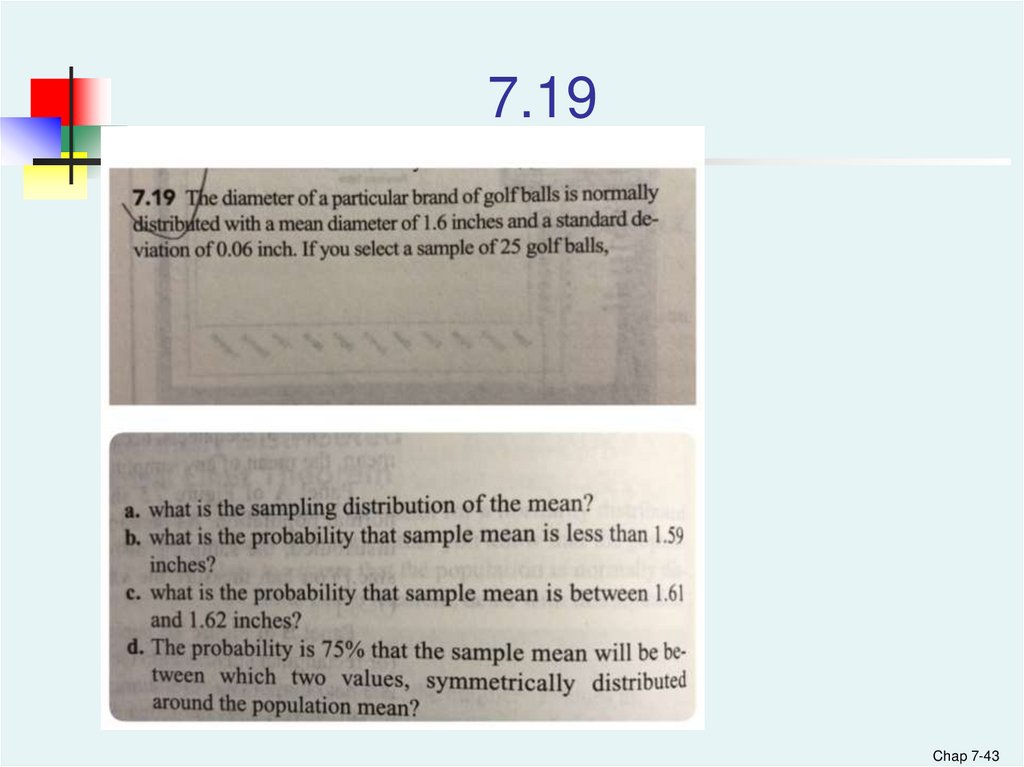
7.19Chap 7-43
44.
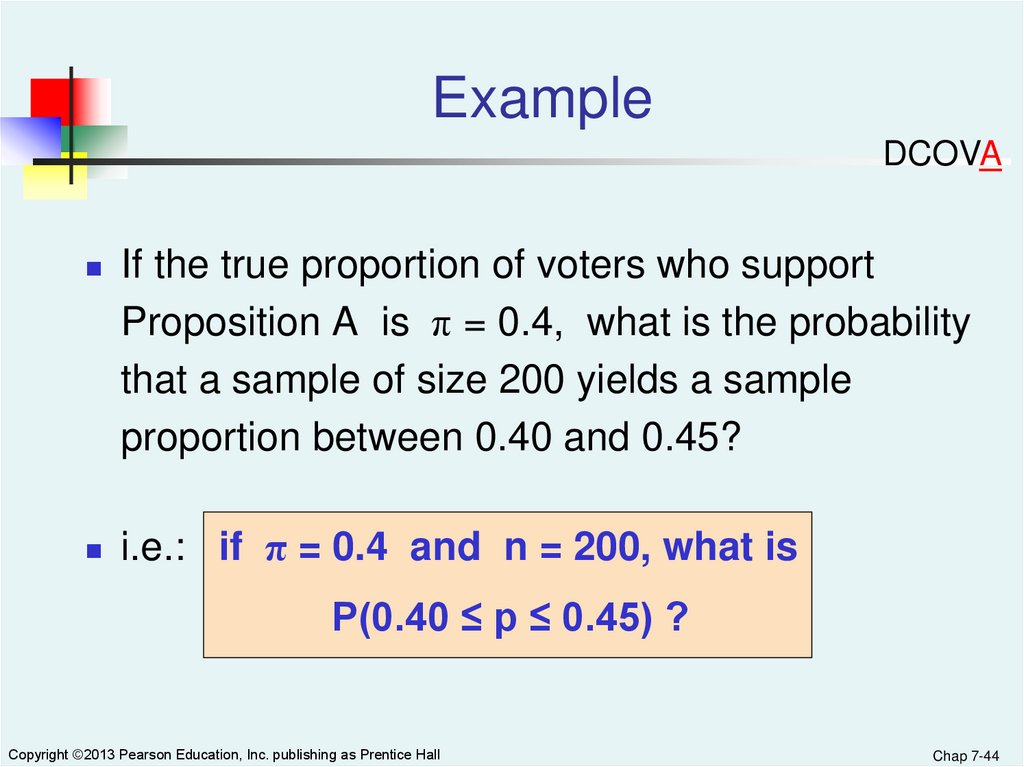
ExampleDCOVA
If the true proportion of voters who support
Proposition A is π = 0.4, what is the probability
that a sample of size 200 yields a sample
proportion between 0.40 and 0.45?
i.e.: if π = 0.4 and n = 200, what is
P(0.40 ≤ p ≤ 0.45) ?
Copyright ©2013 Pearson Education, Inc. publishing as Prentice Hall
Chap 7-44
45.
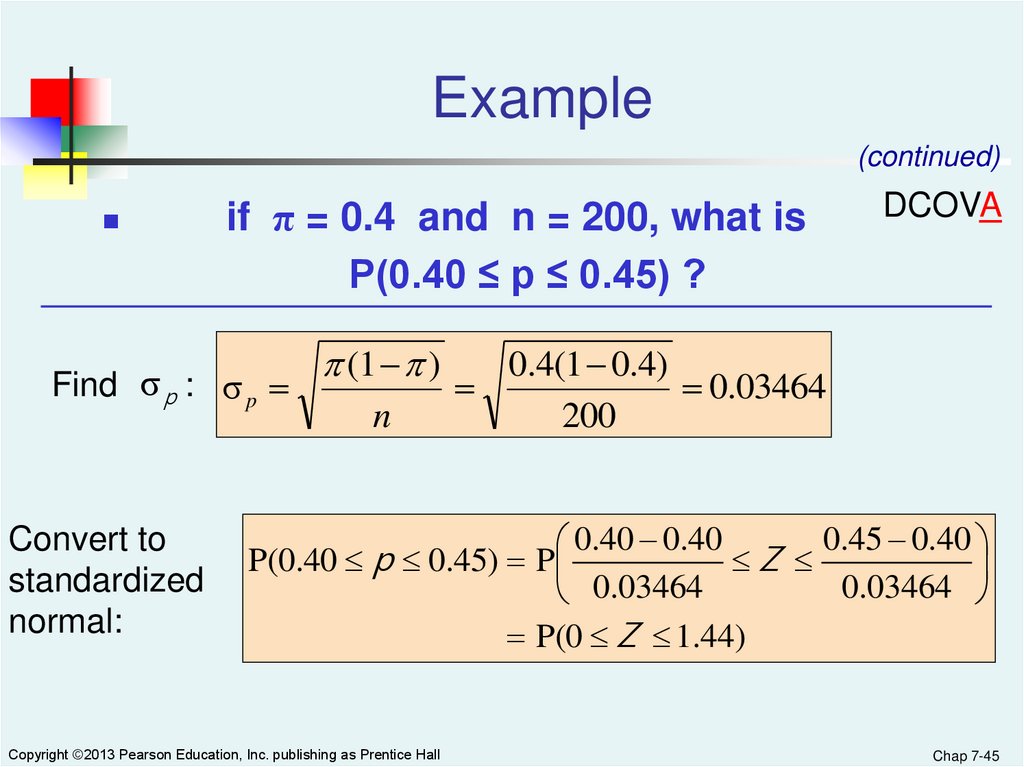
Example(continued)
if π = 0.4 and n = 200, what is
P(0.40 ≤ p ≤ 0.45) ?
Find σ p : σ p
Convert to
standardized
normal:
(1 )
n
DCOVA
0.4(1 0.4)
0.03464
200
0.45 0.40
0.40 0.40
P(0.40 p 0.45) P
Z
0.03464
0.03464
P(0 Z 1.44)
Copyright ©2013 Pearson Education, Inc. publishing as Prentice Hall
Chap 7-45
46.
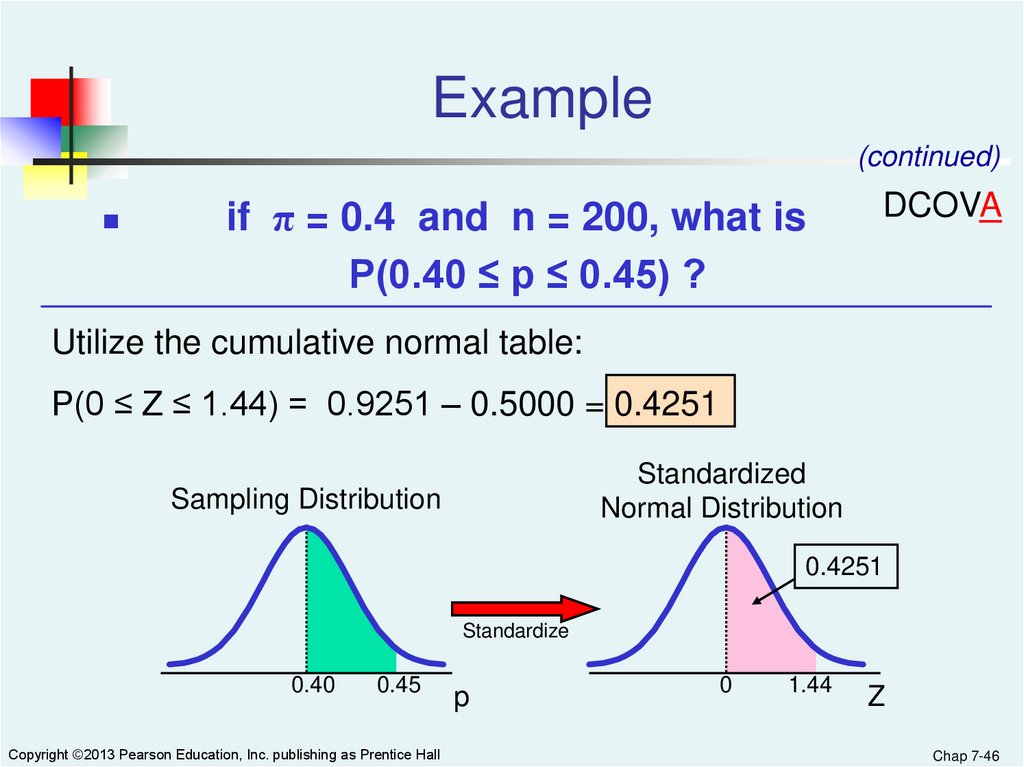
Example(continued)
if π = 0.4 and n = 200, what is
P(0.40 ≤ p ≤ 0.45) ?
DCOVA
Utilize the cumulative normal table:
P(0 ≤ Z ≤ 1.44) = 0.9251 – 0.5000 = 0.4251
Standardized
Normal Distribution
Sampling Distribution
0.4251
Standardize
0.40
0.45
Copyright ©2013 Pearson Education, Inc. publishing as Prentice Hall
p
0
1.44
Z
Chap 7-46
47.
Chapter SummaryDiscussed probability and nonprobability samples
Described four common probability samples
Examined survey worthiness and types of survey
errors
Introduced sampling distributions
Described the sampling distribution of the mean
For normal populations
Using the Central Limit Theorem
Described the sampling distribution of a proportion
Calculated probabilities using sampling distributions
Copyright ©2013 Pearson Education, Inc. publishing as Prentice Hall
Chap 7-47
48.
T/F1. If a simple random sample is chosen with
replacement, each individual has the same chance of
selection on every selection.
2. The only reliable way a researcher can make
statistical inferences from a sample to a population is to
use nonprobability sampling methods.
3. There can be only one sample selected from a
population.
4. Using different frames to generate data can lead to
totally different conclusions.
5. A convenience sample is a type of probability
sample.
Chap 7-48
49.
T/F6. Items or individuals in a judgment sample are
chosen according to their probability of occurrence.
7. The professor of a business statistics class wanted
to find out the mean amount of time per week her
students spent studying for the class. Among the 50
students in her class, 20% were freshmen, 50% were
sophomores and 30% were juniors. She decided to
select 2 students randomly from the freshmen, 5
randomly from the sophomores and 3 randomly from
the juniors. This is an example of a systematic sample.
Copyright ©2013 Pearson Education, Inc. publishing as Prentice Hall
Chap 7-49
50.
8. You stand at the main entrance to adepartment store and pick the first 20
customers that enter the store after it has
opened its door for business on a single day.
This is an example of a systematic sample.
9. An electronic appliance chain gathered
customer opinions on their services using the
customer feedback forms that are attached to
the product registration forms. This is an
example of a convenience sample.
Chap 7-50
51.
10. The professor of a business statistics class wanted tofind out the mean amount of time per week her students
spent studying for the class. She divided the fifty students on
her roster into ten groups starting from the first student on
the roster. The first student was randomly selected from the
first group. Then every tenth student was selected from the
remaining students. This is an example of a cluster sample.
11. As the sample size increases, the standard error of the
mean increases.
12. If the population distribution is unknown, in most cases
the sampling distribution of the mean can be approximated
by the normal distribution if the samples contain at least 30
observations.
Chap 7-51
52.
T/F13. A sampling distribution is a distribution for a statistic.
14. The Central Limit Theorem ensures that the
sampling distribution of the sample mean approaches a
normal distribution as the sample size increases.
15. As the size of the sample is increased, the standard
deviation of the sampling distribution of the sample
mean for a normally distributed population will stay the
same.
16. The mean of the sampling distribution of a sample
proportion is the population proportion, π.
Chap 7-52
53.
T/F17. It is always more informative by
investigating a sample than the entire
population.
18. Sampling distributions describe the
distribution of both parameters and statistics.
19. The standard error of the mean is never
larger than the standard deviation of the
population.
20. The shape of the sampling distribution is
always approximately normal.
Chap 7-53