


Похожие презентации:


")

")
")


Standard deviation
1. Standard deviation
There are three commonly used measures of spread (ordispersion) – the range, the inter-quartile range and the
standard deviation.
The standard deviation is widely used in statistics to measure
spread. It is based on all the values in the data, so it is
sensitive to the presence of outliers in the data.
The variance is related to the standard deviation:
variance = (standard deviation)2
The following formulae can be used to find the variance and s.d.
(x x )
variance
i
n
1 of 26
2
s.d.
(x x )
2
i
n
© Boardworks Ltd 2005
2. Standard deviation
Example: The mid-day temperatures (in °C) recorded forone week in June were: 21, 23, 24, 19, 19, 20, 21
First we find the mean: x
xi
xi x
( xi x )2
21
0
0
23
2
4
24
3
9
19
-2
4
19
-2
4
20
-1
1
21
0
0
Total:
2 of 26
21 23 ... 21 147
21°C
7
7
(x x )
variance
2
i
n
So variance = 22 ÷ 7 = 3.143
So, s.d. = 1.77°C (3 s.f.)
22
© Boardworks Ltd 2005
3. Standard deviation
There is an alternative formula which is usually a moreconvenient way to find the variance:
variance
( xi x )
2
n
But, ( xi x )2 ( xi2 2 xi x x 2 )
xi2 2 x xi nx 2
xi2 2 x nx nx 2
xi2 nx 2
Therefore,
3 of 26
x
variance
i
n
2
x and s.d.
2
x
i
n
2
x2
© Boardworks Ltd 2005
4. Standard deviation
Example (continued): Looking again at the temperaturedata for June: 21, 23, 24, 19, 19, 20, 21
147
21°C
We know that x
7
2
2
2
= 3109
x
21
23
...
21
i
2
Also,
So,
x
variance
i
n
2
3109
x
212 3.143
7
2
s.d. 1.77 °C
Note: Essentially the standard deviation is a measure
of how close the values are to the mean value.
4 of 26
© Boardworks Ltd 2005
5. Calculating standard deviation from a table
When the data is presented in a frequency table, the formulafor finding the standard deviation needs to be adjusted slightly:
s.d.
f
Example: A class of 20
students were asked how
many times they exercise
in a normal week.
Find the mean and the
standard deviation.
5 of 26
f i xi
2
x2
i
Number of times
exercise taken
Frequency
0
5
1
3
2
5
3
4
4
2
5
1
© Boardworks Ltd 2005
6. Calculating standard deviation from a table
No. of timesexercise taken, x
Frequency, f
x×f
x2 × f
0
5
0
0
1
3
3
3
2
5
10
20
3
4
12
36
4
2
8
32
5
1
5
25
20
38
TOTAL:
116
The table can be extended to help find the mean and the s.d.
38
x
1.9
20
6 of 26
s.d.
f x
f
i
i
i
2
116
x
1.92 1.48
20
2
© Boardworks Ltd 2005
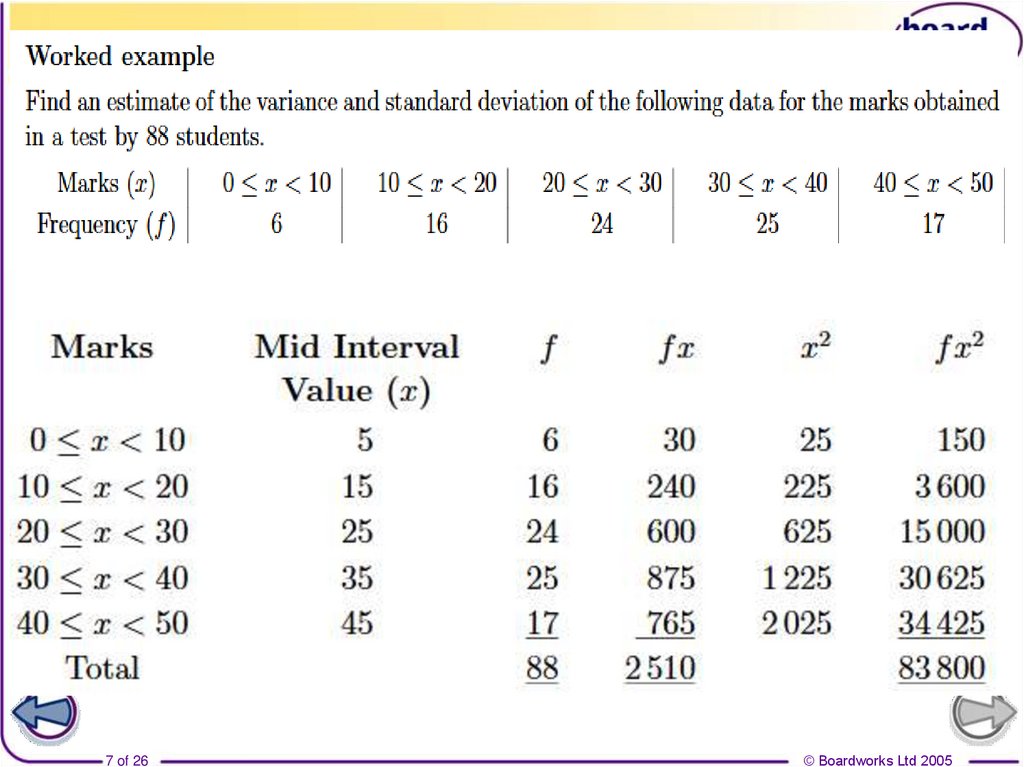
7.
7 of 26© Boardworks Ltd 2005
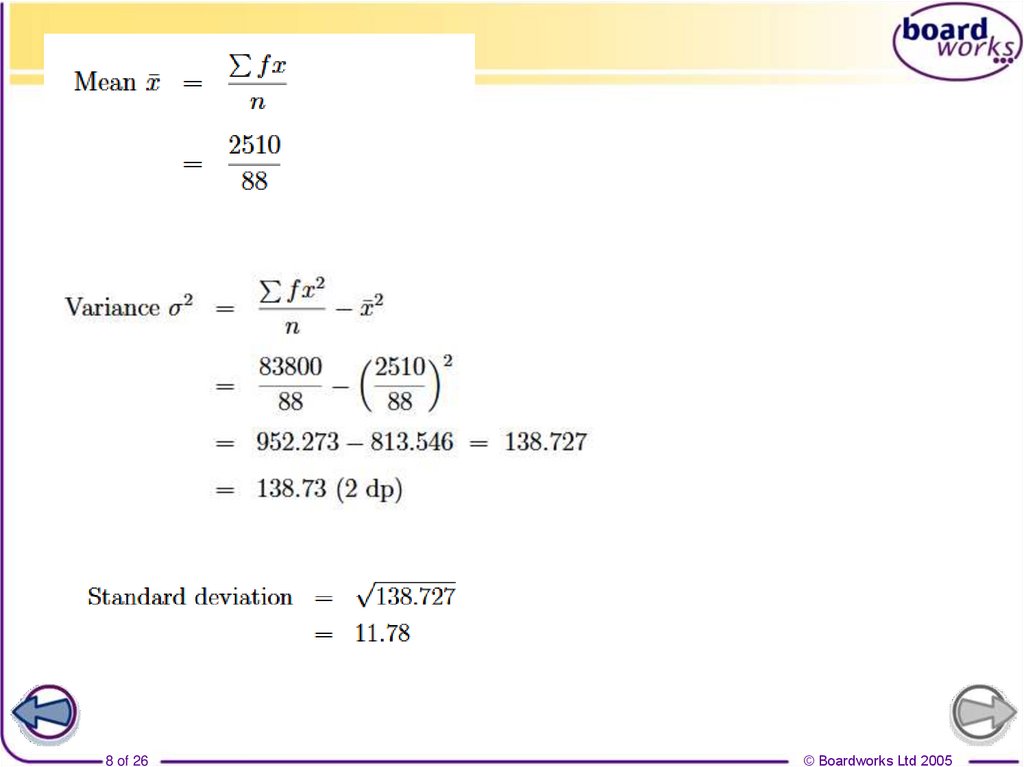
8.
8 of 26© Boardworks Ltd 2005