 Физика
Похожие презентации:


")


Acoustics of a Living Room
1.
Acoustics of a Living RoomCOMSOL
2.
IntroductionThe sound we experience from our stereo or home theater systems in our living rooms is
influenced not only by the quality of the loudspeakers, but also by factors such as the shape of the
room and the type and placement of the furniture
Reflections from walls and windows can both enhance and distort the sound that reaches our
ears, and the low bass notes from the speaker woofer units can shake the windows and make the
floor vibrate
This happens only for certain frequencies — the eigenfrequencies of the room. The simulation set
up in this tutorial solves for the eigenfrequencies of a living room in the low-frequency range and
analyzes the acoustic field in the room when the sound sources are the woofer units
3.
IntroductionThe analysis is useful, for example, when optimizing for loudspeaker locations inside a living room
4.
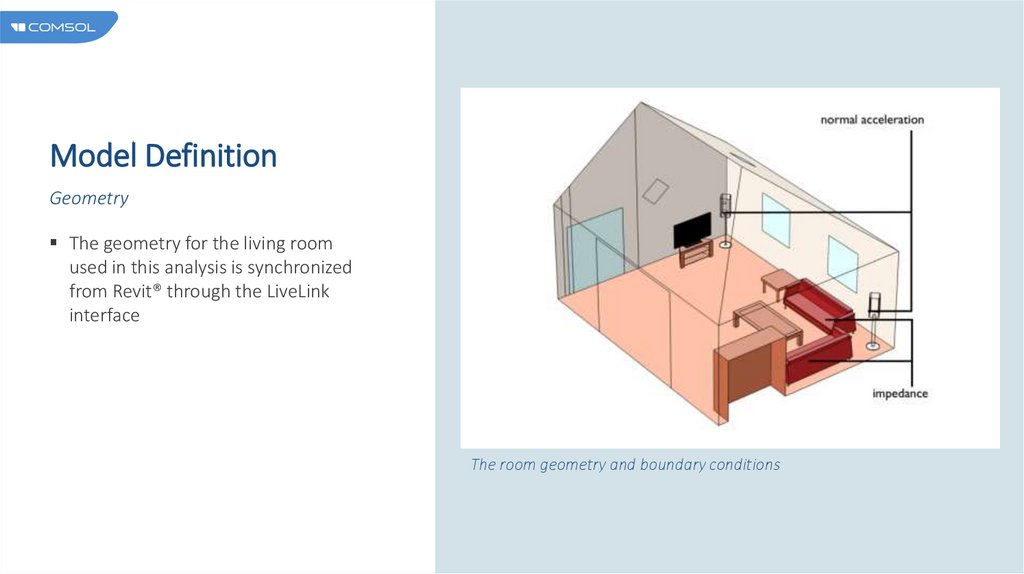
Model DefinitionGeometry
The geometry for the living room
used in this analysis is synchronized
from Revit® through the LiveLink
interface
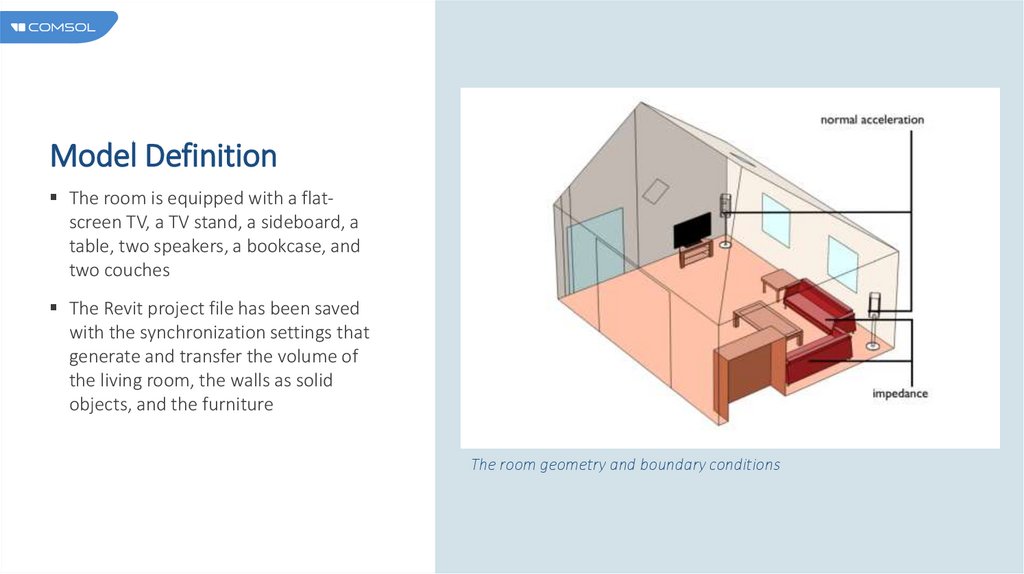
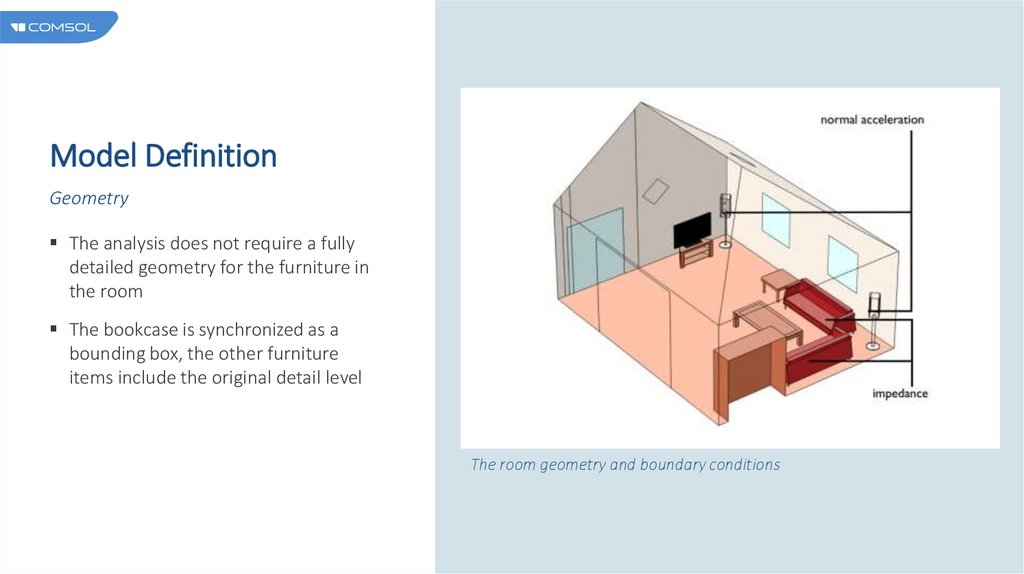
The room geometry and boundary conditions
5.
Model DefinitionThe room is equipped with a flatscreen TV, a TV stand, a sideboard, a
table, two speakers, a bookcase, and
two couches
The Revit project file has been saved
with the synchronization settings that
generate and transfer the volume of
the living room, the walls as solid
objects, and the furniture
The room geometry and boundary conditions
6.
Model DefinitionGeometry
The analysis does not require a fully
detailed geometry for the furniture in
the room
The bookcase is synchronized as a
bounding box, the other furniture
items include the original detail level
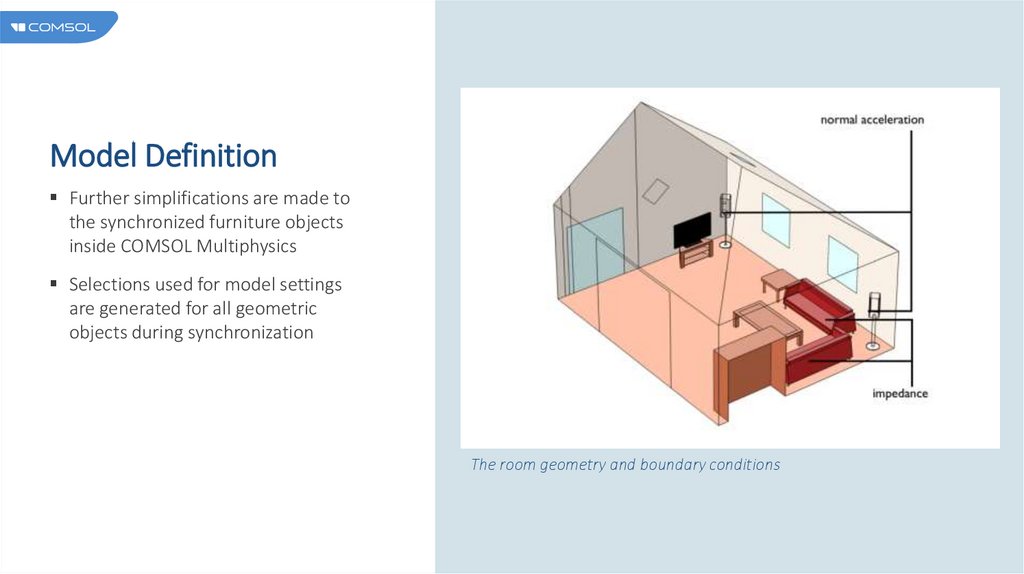
The room geometry and boundary conditions
7.
Model DefinitionFurther simplifications are made to
the synchronized furniture objects
inside COMSOL Multiphysics
Selections used for model settings
are generated for all geometric
objects during synchronization
The room geometry and boundary conditions
8.
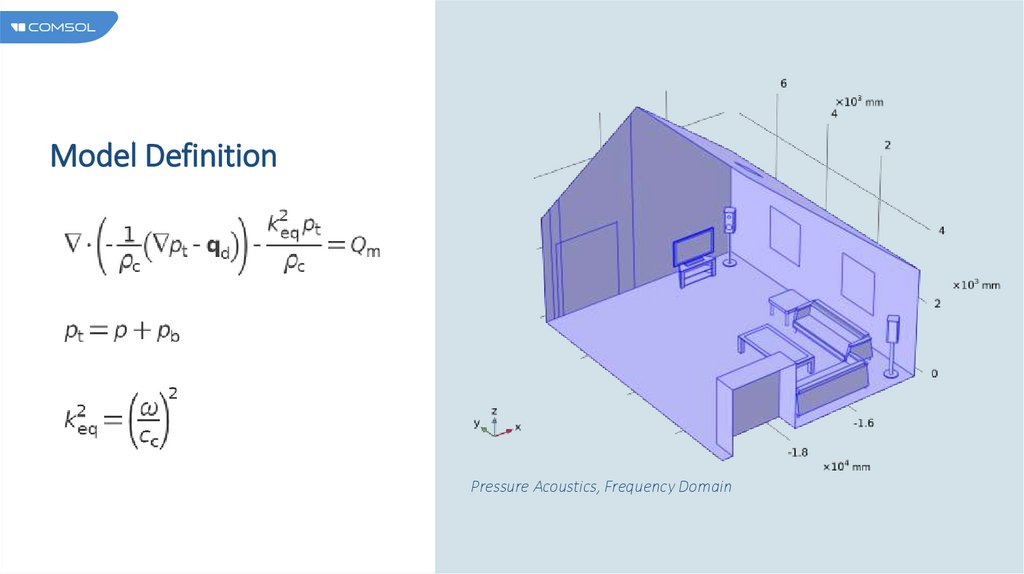
Model DefinitionPressure Acoustics, Frequency Domain
9.
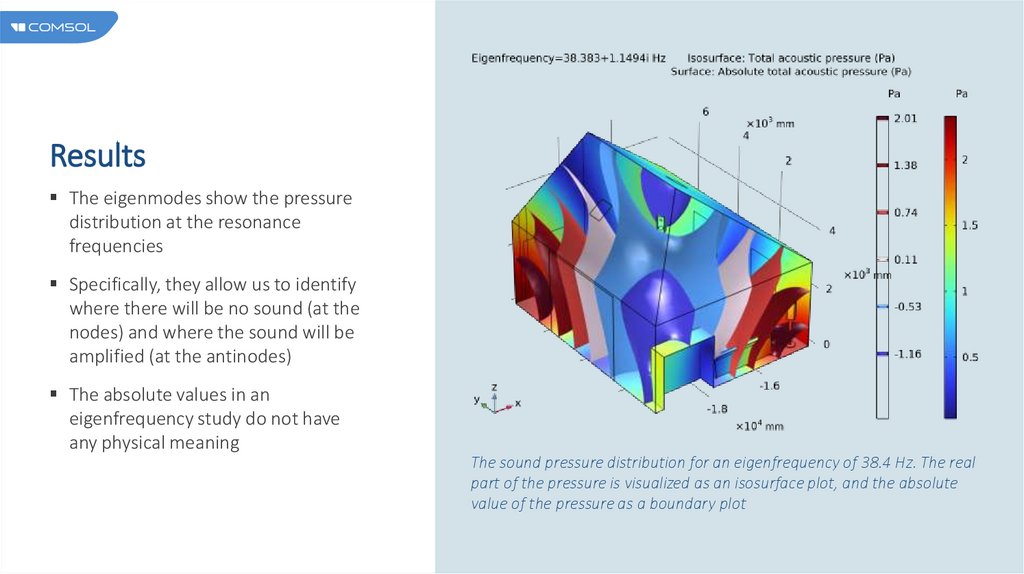
ResultsThe eigenmodes show the pressure
distribution at the resonance
frequencies
Specifically, they allow us to identify
where there will be no sound (at the
nodes) and where the sound will be
amplified (at the antinodes)
The absolute values in an
eigenfrequency study do not have
any physical meaning
The sound pressure distribution for an eigenfrequency of 38.4 Hz. The real
part of the pressure is visualized as an isosurface plot, and the absolute
value of the pressure as a boundary plot
10.
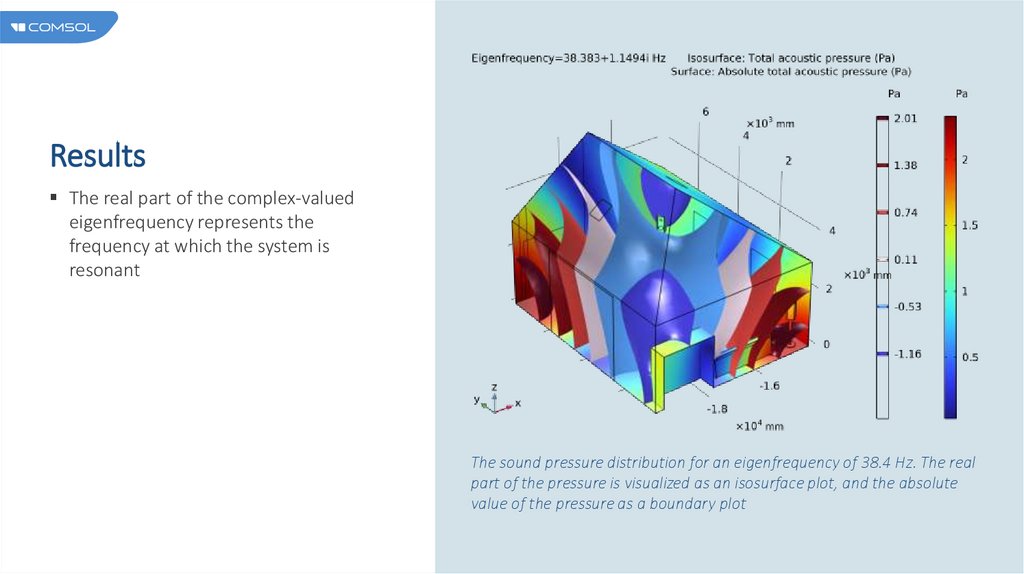
ResultsThe real part of the complex-valued
eigenfrequency represents the
frequency at which the system is
resonant
The sound pressure distribution for an eigenfrequency of 38.4 Hz. The real
part of the pressure is visualized as an isosurface plot, and the absolute
value of the pressure as a boundary plot
11.
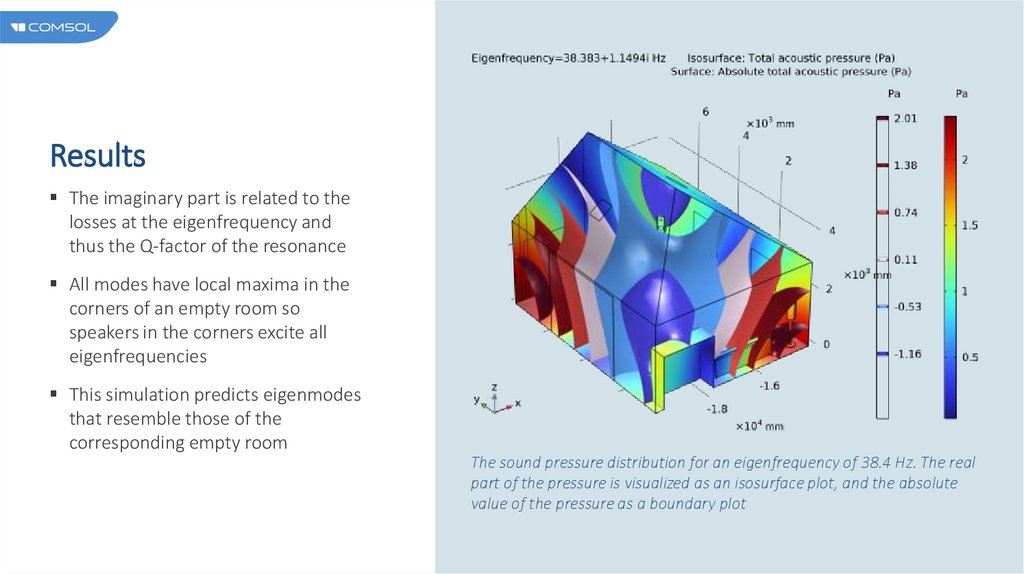
ResultsThe imaginary part is related to the
losses at the eigenfrequency and
thus the Q-factor of the resonance
All modes have local maxima in the
corners of an empty room so
speakers in the corners excite all
eigenfrequencies
This simulation predicts eigenmodes
that resemble those of the
corresponding empty room
The sound pressure distribution for an eigenfrequency of 38.4 Hz. The real
part of the pressure is visualized as an isosurface plot, and the absolute
value of the pressure as a boundary plot
12.
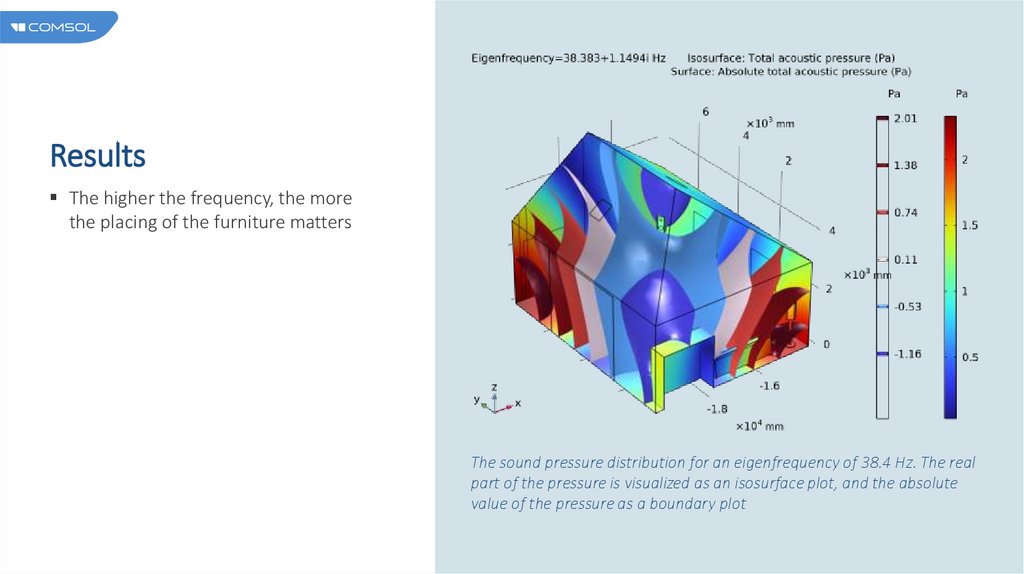
ResultsThe higher the frequency, the more
the placing of the furniture matters
The sound pressure distribution for an eigenfrequency of 38.4 Hz. The real
part of the pressure is visualized as an isosurface plot, and the absolute
value of the pressure as a boundary plot
13.
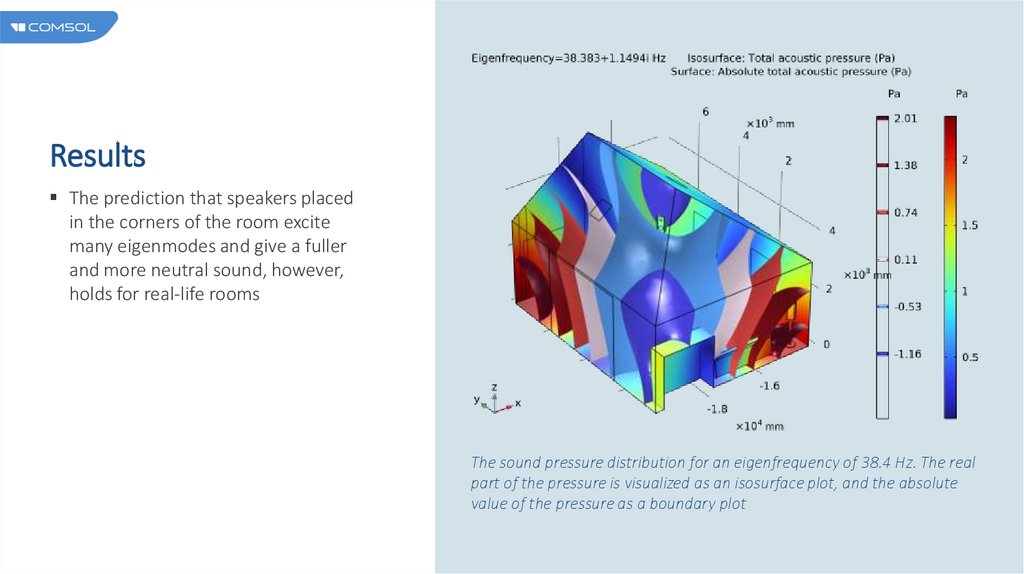
ResultsThe prediction that speakers placed
in the corners of the room excite
many eigenmodes and give a fuller
and more neutral sound, however,
holds for real-life rooms
The sound pressure distribution for an eigenfrequency of 38.4 Hz. The real
part of the pressure is visualized as an isosurface plot, and the absolute
value of the pressure as a boundary plot
14.
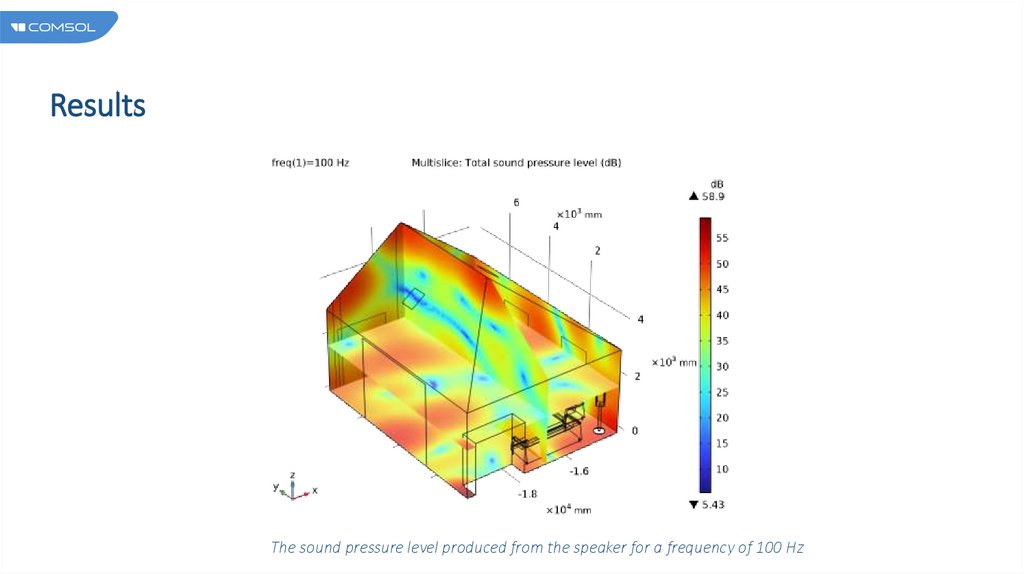
ResultsThe sound pressure level produced from the speaker for a frequency of 100 Hz
15.
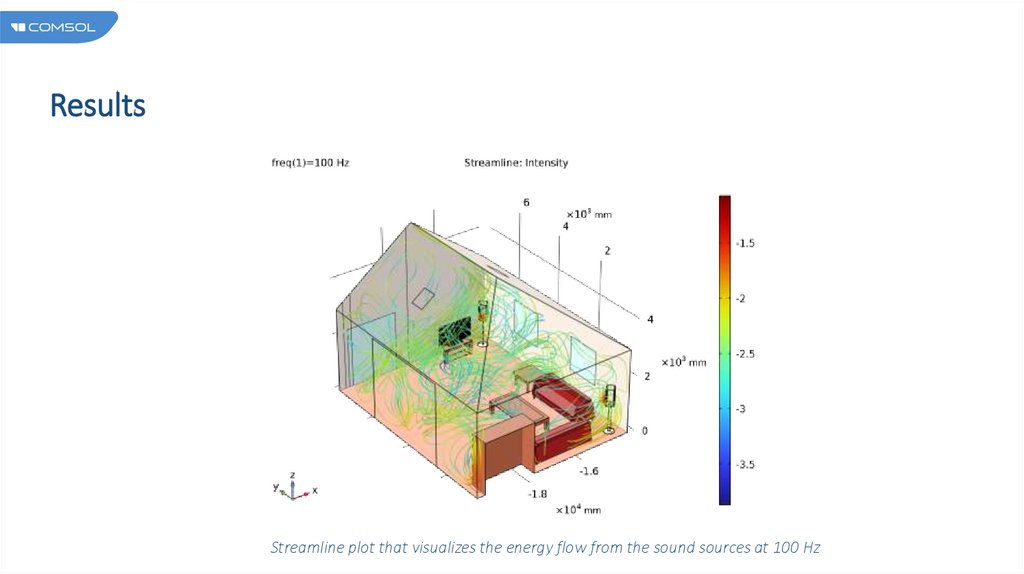
ResultsStreamline plot that visualizes the energy flow from the sound sources at 100 Hz