


")


")


 Экономика
Похожие презентации:

")


Macroeconomic Indicators: What They Are & How to Use Them
1. Macroeconomic Indicators: What They Are & How to Use Them
Macroeconomic Indicators:What They Are & How to Use
Them
O.I.Shalina
2. Macroeconomic Indicators
• Production: GDP, GNP, NI• Business Cycles
• Inflation
• Unemployment
• Interest Rates
3. Quantity Aggregates
• To understand the macroeconomy, we need tomeasure it.
Chief measure of economy is the level of
production
• We need to combine the many goods produced or
consumed in an economy into one measure.
+
+
+
+
=?
4. Gross Domestic Product (GDP)
All goods sold in an economyshare a common unit of
measure: the price at which
they are sold.
Sum up
the value
of goods
Gross Domestic Product (GDP)
• GDP is the sum of the value of new, final
goods produced within the domestic borders
of an economy.
Final goods are goods
sold to their end-users
5. Three Methods for Calculating GDP
1. Expenditure Method - The sum of thedomestic spending on final goods (less
domestic demand satisfied by imports).
2. Production Method - The value added
created in all the sectors of the economy.
3. Income Method – The Wage, Rent,
Interest and Profit Income generated by
the domestic economy.
6. Expenditure Method
C+
I
+
G
+
Consumption
Consumer durables, nondurables, services
Investment
Structures (incl. Residential),
Equipment, and Inventory
Government Government Spending on
Consumption Goods, Services, and Salaries.
X EXports
Goods & Services Shipped
IM IMports
Abroad
=
A + NX = (C + I + G) + (X – IM)
GDP
Goods & Services from Abroad
7. Japanese Expenditure
Fiscal Year(Billion Yen)
2003
Items
66.43%
7.70%
23.99%
2.16%
0.05%
12.04%
10.21%
Actual final consumption of households [C]
Government actual final consumption [G]
Gross domestic fixed capital formation [I]
Of which intangible fixed assets
Changes in inventories
Exports of goods and services [X]
(less) Imports of goods and services
332,970.6
38,578.9
120,238.8
10,810.2
270.0
60,375.7
(51,180.5)
Gross domestic expenditure
501,253.5 100.00%
(cf) Incomes from the rest of the world
to the rest of the world
(less) Income
Gross national income
12,787.4
4,001.1
510,039.8
8. GNP vs. GDP
GNPGross National Product
GDP
Gross Domestic Product
= income earned by
= income created within
domestic residents
national borders.
GNP = GDP +NFI
• Net Factor Income [NFI] is income earned on
overseas work or investments minus income
generated domestically but paid to foreigners.
9. Compare Macau and the Philippines GDP or GNP
• Macau produces a lot of profits paid tooverseas owners of casinos.
• Philippines workers earn a lot of income
overseas.
• Which is larger Philippines’ GDP or
Philippines GNP?
• Does Macau have greater GDP or GNP?
10. The main macroeconomic issues:
• Inflation.• Employment and unemployment.
• Stagflation and deflation.
• Business cycles.
• Economic growth.
• The balance of payments and exchange
rate.
11. 1. Inflation
• Inflation is the increase of prices over theperiod of time
12. Why prices increase?
• Demand-pull inflation – this occurs when aggregatedemand (AD) will be increasing faster than aggregate
supply (LRAS).
• Cost-push inflation – this occurs when there is a rise in
the price of raw materials, higher taxes, e.t.c
13. Types of inflation by rate of increase
Creeping inflation (1-4%)
When the rate of inflation slowly increases over time. For example, the inflation rate
rises from 2% to 3%, to 4% a year.
Walking inflation (2-10%)
When inflation is in single digits – less than 10%. At this rate – inflation is not a major
problem, but when it rises over 4%, Central Banks will be increasingly
concerned. Walking inflation may simply be referred to as moderate inflation.
Running inflation (10-20%)
When inflation starts to rise at a significant rate. It is usually defined as a rate
between 10% and 20% a year. At this rate, inflation is imposing significant costs on
the economy and could easily start to creep higher.
Galloping inflation (20%-1000%)
This is an inflation rate of between 20% up to 1000%. At this rapid rate of price
increases, inflation is a serious problem and will be challenging to bring under control.
Hyperinflation (> 1000%)
This is reserved for extreme forms of inflation – usually over 1,000% though there is
no specific definition. Hyperinflation usually involves prices changing so fast, that it
becomes a daily occurrence, and under hyperinflation, the value of money will rapidly
decline.
14.
15. Comparing GDP levels across time
• GDP measures the value of the goods producedby an economy by using the market price of
each good to assign it a value.
• Problem: Prices of goods in terms of money are
changing overtime making comparisons in
overall value difficult.
– Bias: Money prices are growing over time as money
supply grows.
• Solution: Choose a Base Year’s prices as a fixed
yardstick of value for different goods.
16. Real GDP: Yt
• GDP or Nominal GDP or Current DollarGDP is the weighted sum of the number of
goods produced using their current prices
as the weight.
• Real GDP or Constant Dollar GDP or GDP
adjusted for inflation is the weighted sum
of the number of goods produces using
the Base Year prices as yardsticks.
17. Solved Problem Real GDP: 2021 (2020 Base Year)
2020P
Kitkat
M&Ms
Nominal GDP
Real GDP
Q
2021
P
Q
8
150
6
135
10
150
4
135
18.
19. Price Indices: Pt
• Two most commonly used price indicesare GDP Deflator and Consumer Price
Index (CPI)
• The GDP deflator is the ratio of nominal
GDP to Real GDP (multiplied by 100).
Nominal GDP
P GDP Deflator
100
Real GDP
GDP
P
100
Y
20. Consumer Price Index
• The CPI is the price of a representativemarket basket of goods relative to the price of
that same basket during a benchmark/base
year (multiplied by 100).
Cost of Market Basket in year t
CPI t
100
Cost of Market Basket in Base year
21. Q: What is Inflation? A: The Growth Rate of Price Level
Pt Pt 1Inflation Rate
x100%
Pt 1
Inflation: prices are growing
Disinflation: inflation is slowing down but still
positive
Deflation: inflation is negative and prices are
actually dropping.
22. Adjusting for Inflation
We can use some price index to “adjust for
inflation” effectively converting a variable
measured in money (nominal) into a variable
measured in the prices of some reference
year.
Real series measures the value of goods that
could have been purchased with that amount
of money in the reference year.
23. Converting Current Price Series into Constant Price Series
• Series to be adjusted for inflation: Nt• Contemporaneous price level (Pt) and
comparable price level in reference year (PRef)
• Series adjusted for inflation – (i.e. how much that
the goods that you could have bought with N in
year t would cost in year Ref.)
N
Ref$
t
PRef
Nt
Pt
24. Housing Price: Hong Kong Island
• Compare the price of housing in HKaverage price of an apartment on HK
Island with an area between 100m2 and
160m2
– in December 2005 : HK$112,012/m2
– in December 1982: HK$14,742/m2
• How much did an apartment cost back
then when expressed in today’s dollars?
25. Housing Price: Hong Kong Island
• The Hong Kong CPI (2000=100) was35.5 in December 1982 and 94.5 in
December 2005.
• Calculate:
PRef
94.5
Real
Nt Nt
14, 742
39,242.79
Pt
35.5
• In real, terms, housing today is almost 3
times as expensive as in 1982!
26. Example
• Compare the box office take of “Shrek 2” and“Sound of Music” in 2004 dollars.
Sound of
Movie
Shrek 2
Music
Year
Box Office
P
2004
436,471,036
1965
163,214,286
189
32
27. Interest Rates
28.
• What are some major interest rates infinancial markets? Be as specific as
possible.
29. Nominal and Real Interest Rates
• Nominal return represents how muchmoney you will receive after 1 year for
giving up 1 dollar of money today
• Real return represents how many goods
you can buy if you give up the opportunity
to buy 1 good today.
• Nominal interest rate is money interest
rate. Real interest rate is goods interest
rate.
30.
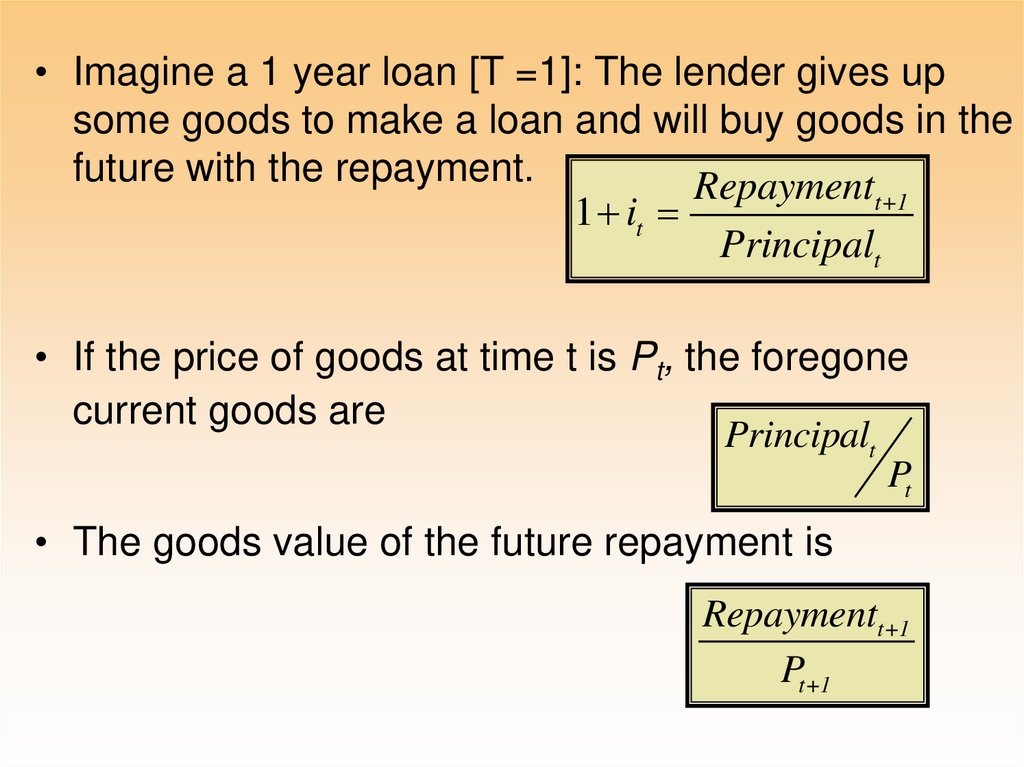
• Imagine a 1 year loan [T =1]: The lender gives upsome goods to make a loan and will buy goods in the
future with the repayment.
Repaymentt+1
1 it
Principalt
• If the price of goods at time t is Pt, the foregone
current goods are
Principalt
Pt
• The goods value of the future repayment is
Repaymentt+1
Pt+1
31. Real Interest Rate
• The real interest rate on the loan isdefined as the future goods received
relative to current goods foregone
Repaymentt+1
1 rt
Principalt
Pt+1
Repaymentt+1
Pt
1 it
1 rt
rt it t 1
1 t 1
Pt+1
Principalt
Pt
32. Ex Ante Rate and the Fisher Effect
• Savings and investment decisions must bemade before future inflation is known so
they must be made on the basis of an ex
ante (predicted) real interest rate.
• Fisher Hypothesis: Ex ante real interest
rate is determined by forces in the
financial market. Money interest rate is just
the real ex ante rate plus the market’s
consensus forecast of inflation.
it rt
EA
FORECAST
t 1
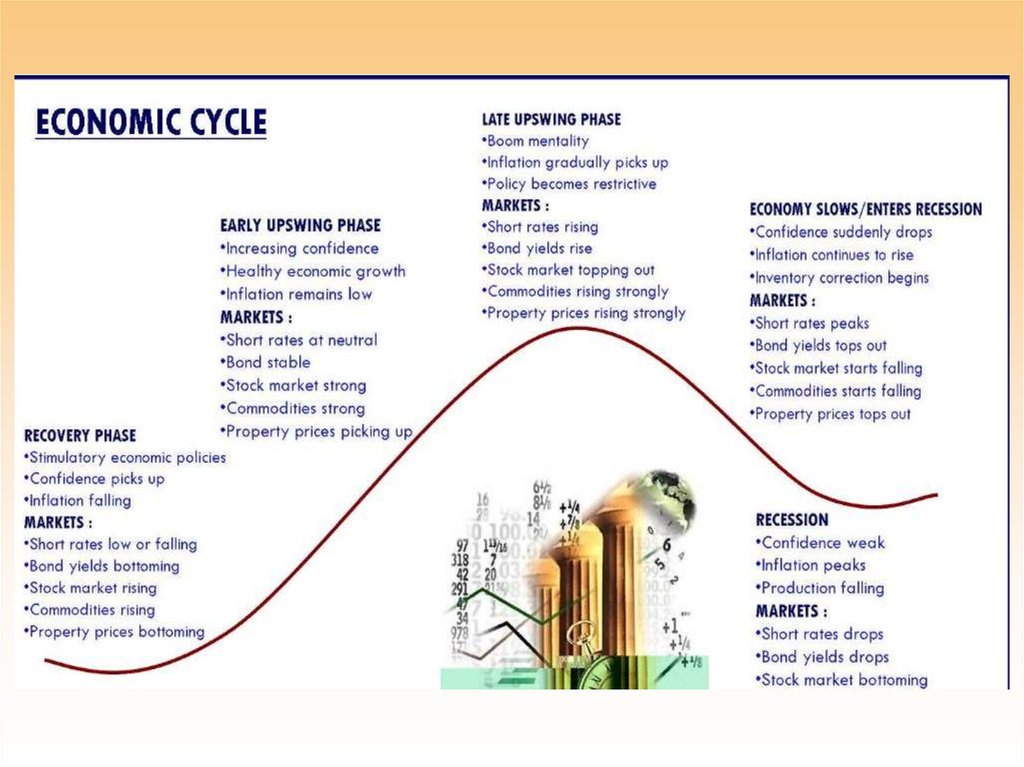
33. Economic growth
34. Recessions and Expansions
• Business cycle positions are sometimescharacterized as booms and recessions.
• These names have many definitions
– An expansion occurs roughly when real GDP
is above the trend growth path (detrended
output is positive).
– A recession occurs roughly when real GDP is
below trend growth.
• In the USA, recessions are sometimes defined as
2 consecutive periods of negative growth.
35.
36.
37. Stock Market tends to co-move positively with the business cycle.
.08.04
60
.00
50
-.04
40
-.08
30
20
10
1990 1992 1994 1996 1998 2000 2002 2004 2006
Hang Seng Price/Dividend Ratio
Detrended GDP
38.
39. Learning Outcomes
• Students should be able to:• Calculate simple real aggregates like real
GDP.
• Use price indices to calculate inflation
rates and real interest rates.
• Adjust nominal series for inflation.