


 Финансы
Похожие презентации:


")


Quantitave Methods. Part 1. Time value of money (TVM)
1.
CFA Level 1Quantitave Methods
Study Session 2 –3
Part 1
Exam weight –8-12%
1
2.
Time value of money (TVM)LOS #6
2
3.
Time value of money (TVM)The candidate should be able to:
a.
b.
c.
d.
e.
3
Interpret interest rates
Calculate and interpret the effective annual rate
Calculate and interpret the future value (FV) and
present value (PV)
Solve time value of money problems for different
frequencies of compounding
Solve time value of money problems for different
types of cash flow
4.
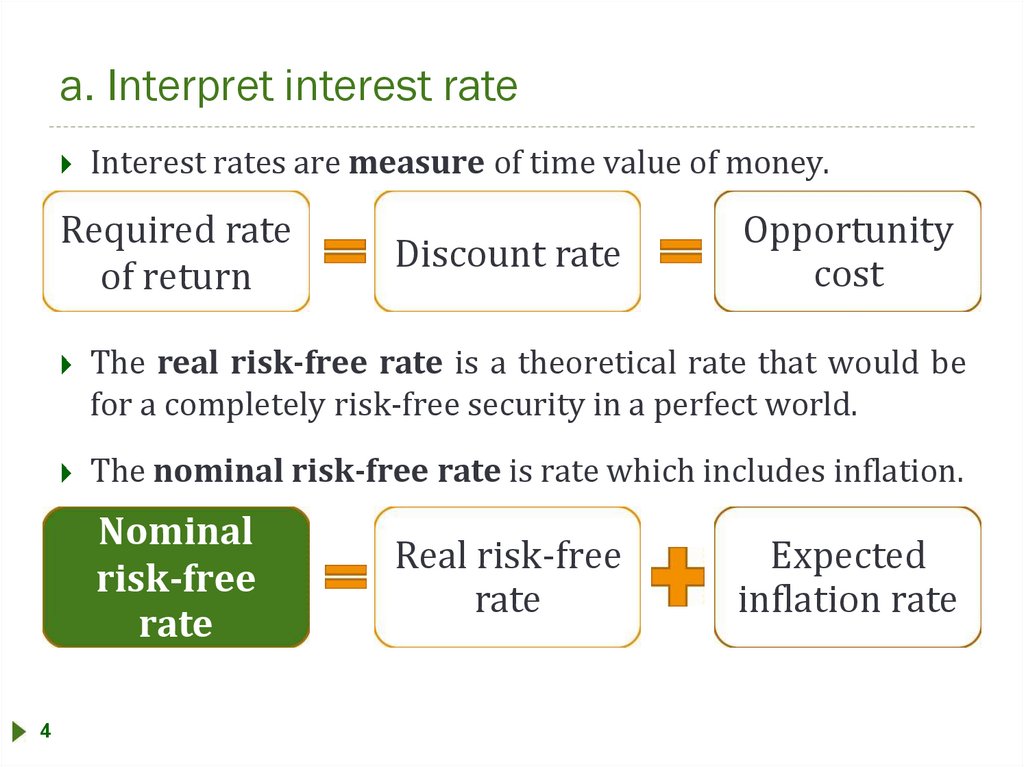
a. Interpret interest rateInterest rates are measure of time value of money.
Required rate
of return
Discount rate
Opportunity
cost
The real risk-free rate is a theoretical rate that would be
for a completely risk-free security in a perfect world.
The nominal risk-free rate is rate which includes inflation.
Nominal
risk-free
rate
4
Real risk-free
rate
Expected
inflation rate
5.
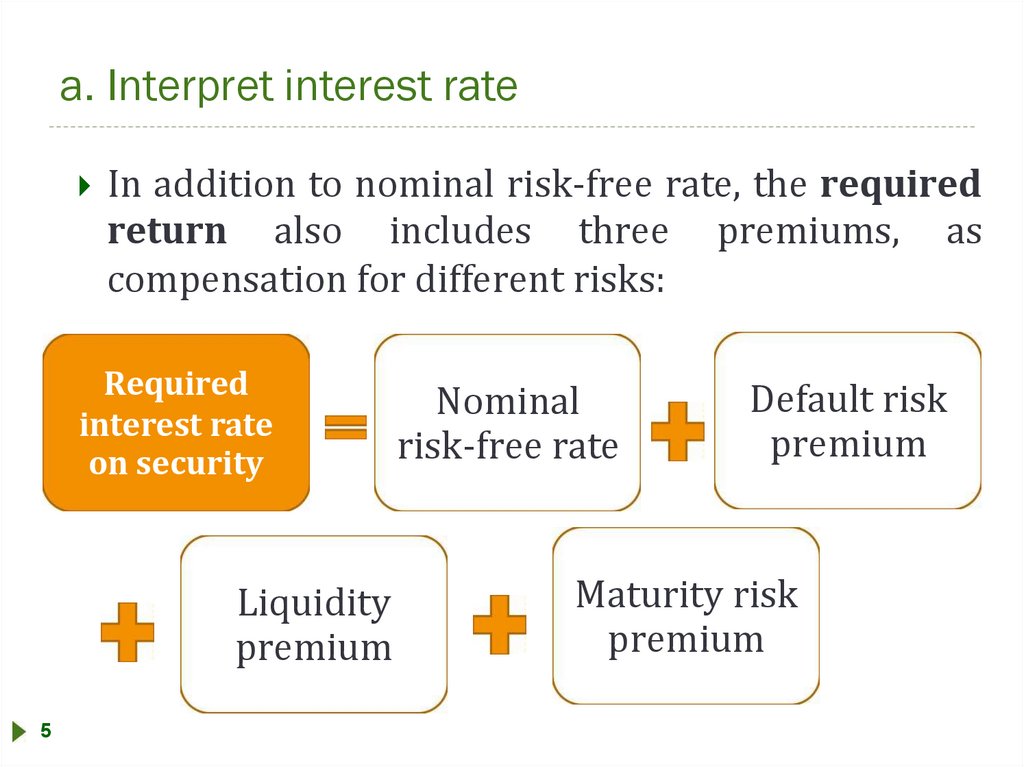
a. Interpret interest rateIn addition to nominal risk-free rate, the required
return also includes three premiums, as
compensation for different risks:
Required
interest rate
on security
Liquidity
premium
5
Nominal
risk-free rate
Default risk
premium
Maturity risk
premium
6.
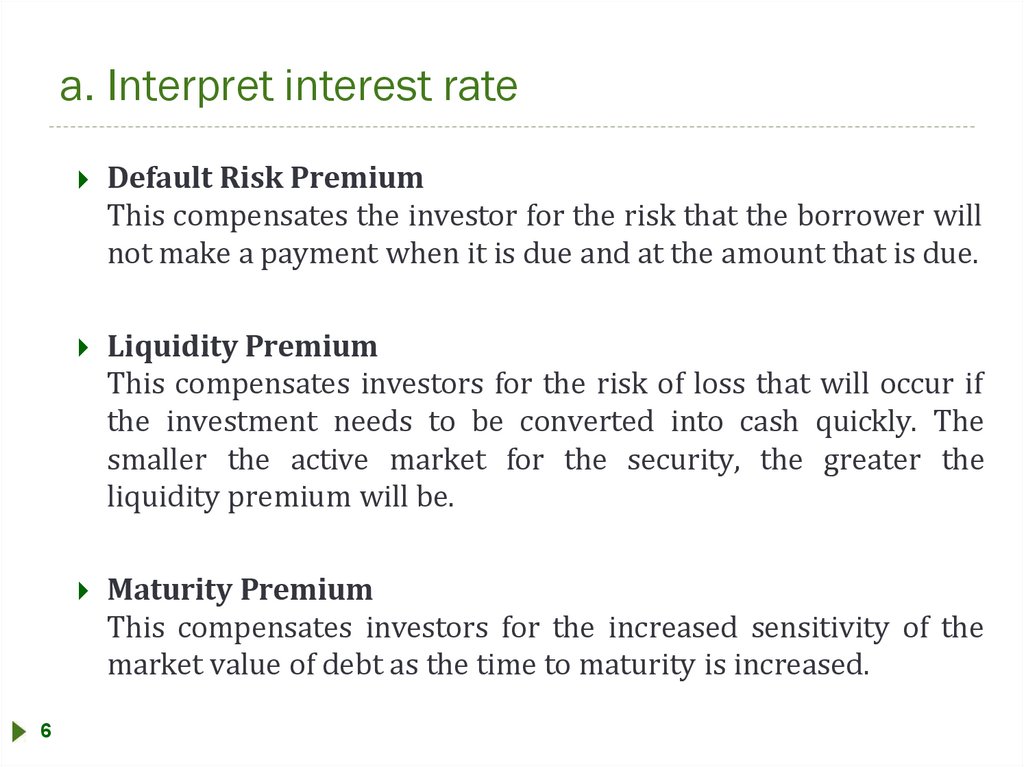
a. Interpret interest rateDefault Risk Premium
This compensates the investor for the risk that the borrower will
not make a payment when it is due and at the amount that is due.
Liquidity Premium
This compensates investors for the risk of loss that will occur if
the investment needs to be converted into cash quickly. The
smaller the active market for the security, the greater the
liquidity premium will be.
Maturity Premium
This compensates investors for the increased sensitivity of the
market value of debt as the time to maturity is increased.
6
7.
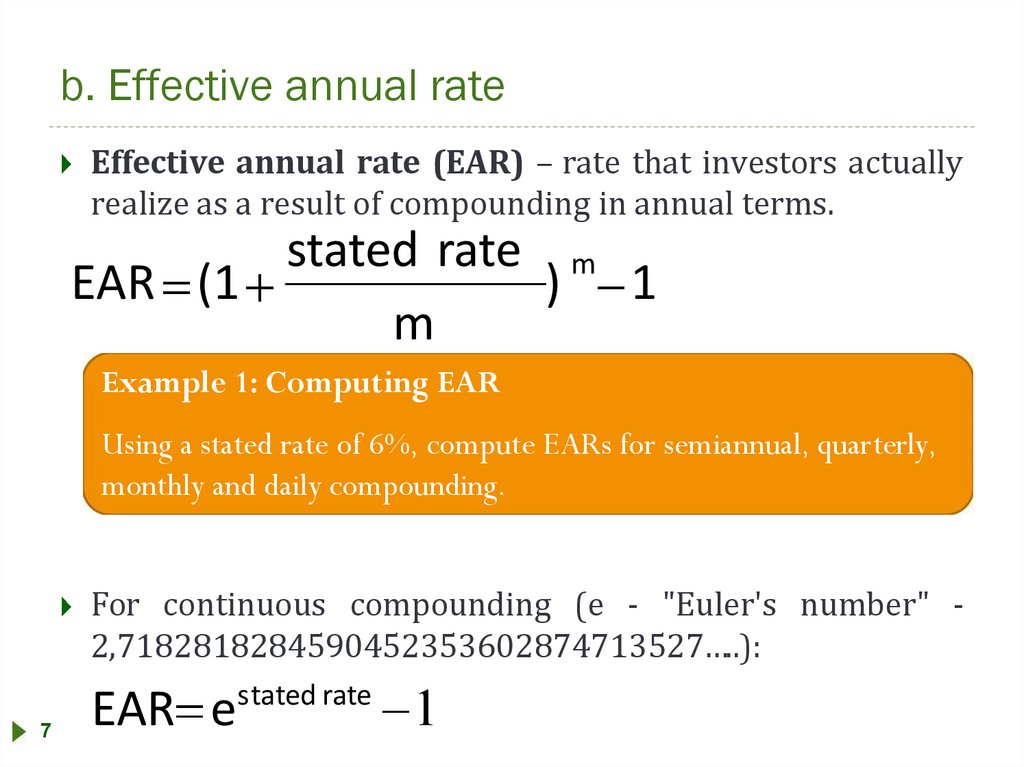
b. Effective annual rateEffective annual rate (EAR) – rate that investors actually
realize as a result of compounding in annual terms.
stated rate m
EAR (1
) 1
m
Example 1: Computing EAR
Using a stated rate of 6%, compute EARs for semiannual, quarterly,
monthly and daily compounding.
For continuous compounding (e - "Euler's number" 2,7182818284590452353602874713527…..):
7
EAR e
stated rate
1
8.
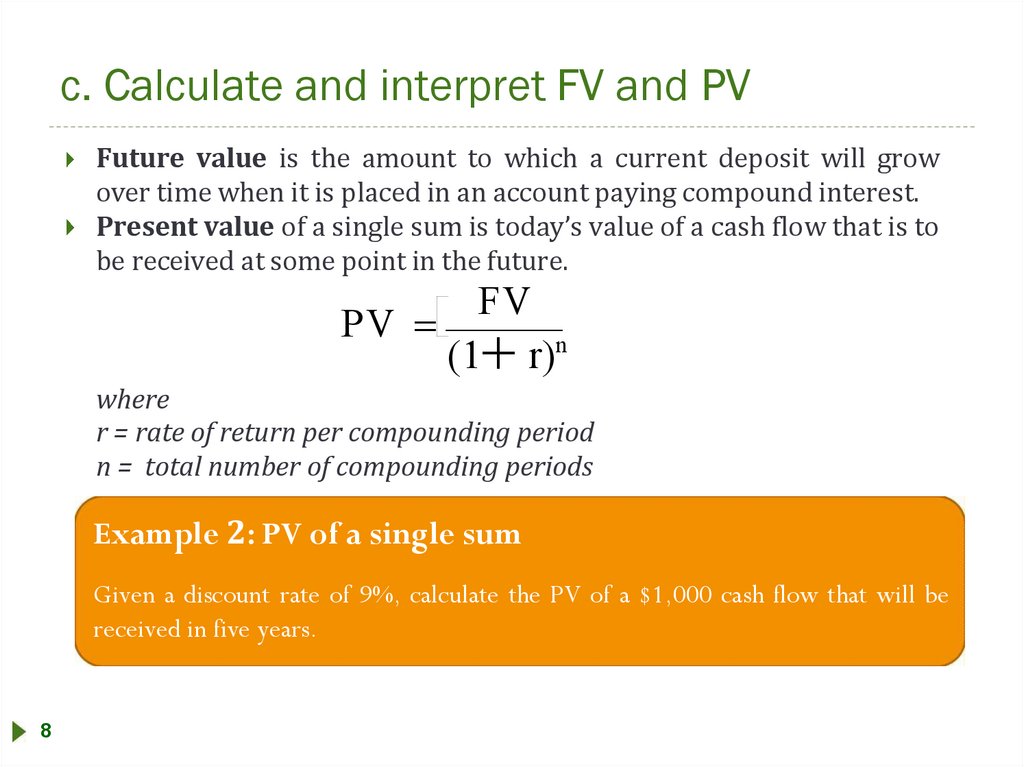
c. Calculate and interpret FV and PVFuture value is the amount to which a current deposit will grow
over time when it is placed in an account paying compound interest.
Present value of a single sum is today’s value of a cash flow that is to
be received at some point in the future.
PV
FV
(1 r)n
where
r = rate of return per compounding period
n = total number of compounding periods
Example 2: PV of a single sum
Given a discount rate of 9%, calculate the PV of a $1,000 cash flow that will be
received in five years.
8
9.
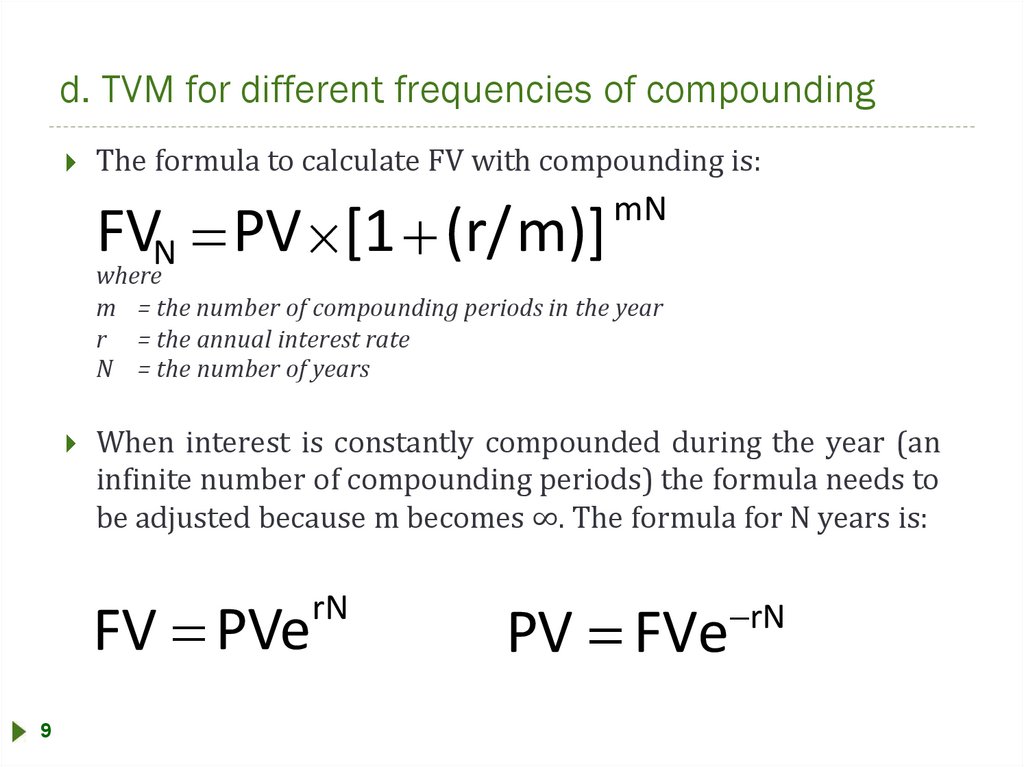
d. TVM for different frequencies of compoundingThe formula to calculate FV with compounding is:
FVN PV [1 (r/ m)]
mN
where
m = the number of compounding periods in the year
r = the annual interest rate
N = the number of years
When interest is constantly compounded during the year (an
infinite number of compounding periods) the formula needs to
be adjusted because m becomes ∞. The formula for N years is:
FV PVe
9
rN
PV FVe
rN
10.
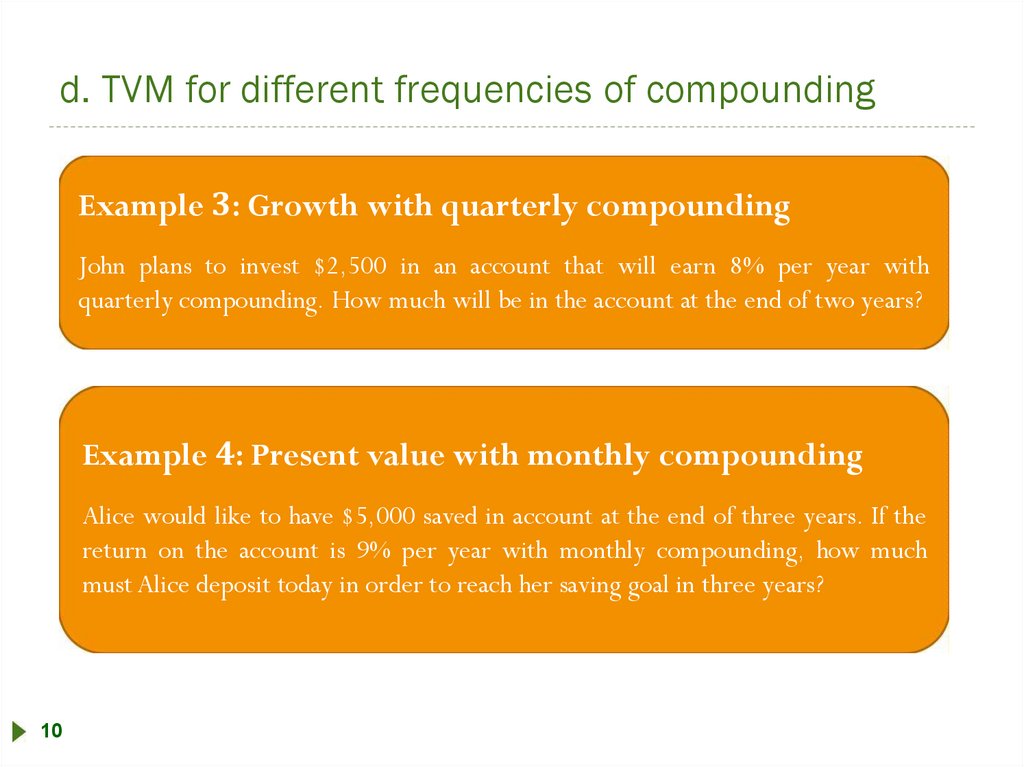
d. TVM for different frequencies of compoundingExample 3: Growth with quarterly compounding
John plans to invest $2,500 in an account that will earn 8% per year with
quarterly compounding. How much will be in the account at the end of two years?
Example 4: Present value with monthly compounding
Alice would like to have $5,000 saved in account at the end of three years. If the
return on the account is 9% per year with monthly compounding, how much
must Alice deposit today in order to reach her saving goal in three years?
10
11.
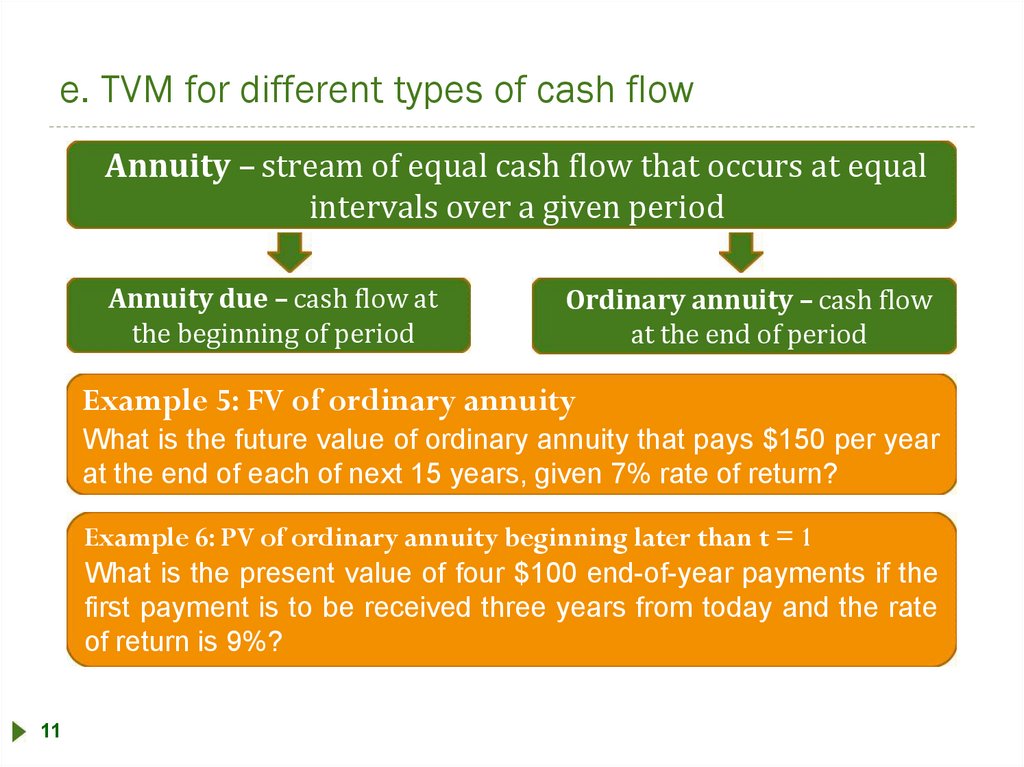
e. TVM for different types of cash flowAnnuity – stream of equal cash flow that occurs at equal
intervals over a given period
Annuity due – cash flow at
the beginning of period
Ordinary annuity – cash flow
at the end of period
Example 5: FV of ordinary annuity
What is the future value of ordinary annuity that pays $150 per year
at the end of each of next 15 years, given 7% rate of return?
Example 6: PV of ordinary annuity beginning later than t = 1
What is the present value of four $100 end-of-year payments if the
first payment is to be received three years from today and the rate
of return is 9%?
11
12.
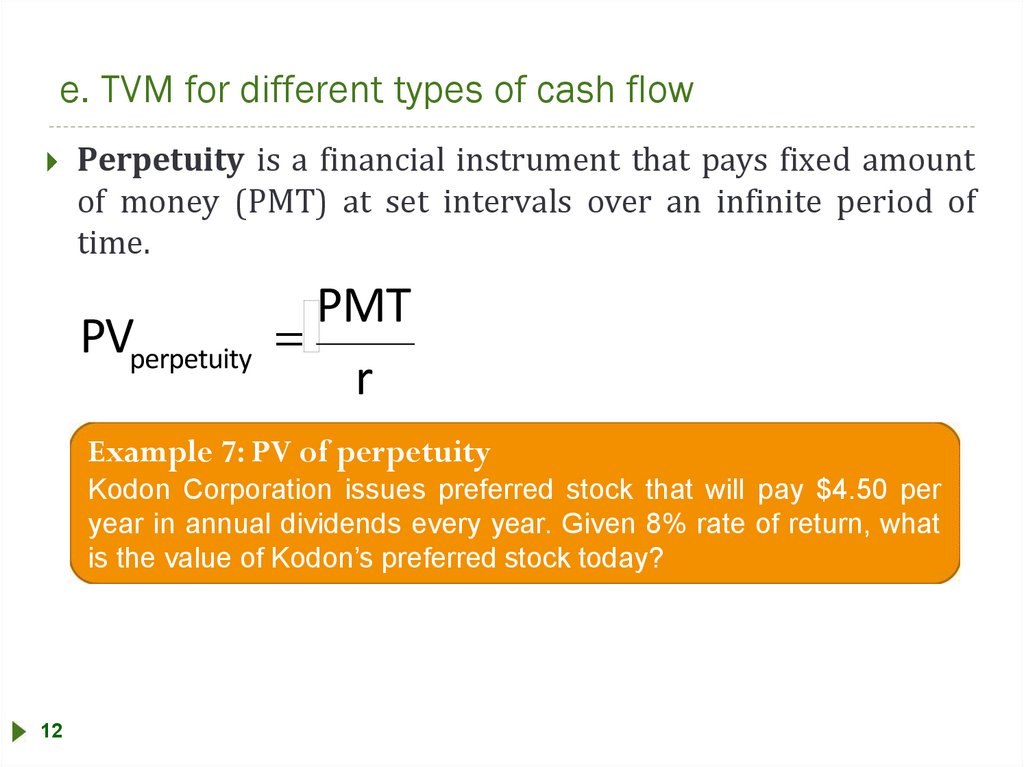
e. TVM for different types of cash flowPerpetuity is a financial instrument that pays fixed amount
of money (PMT) at set intervals over an infinite period of
time.
PVperpetuity
PMT
r
Example 7: PV of perpetuity
Kodon Corporation issues preferred stock that will pay $4.50 per
year in annual dividends every year. Given 8% rate of return, what
is the value of Kodon’s preferred stock today?
12
13.
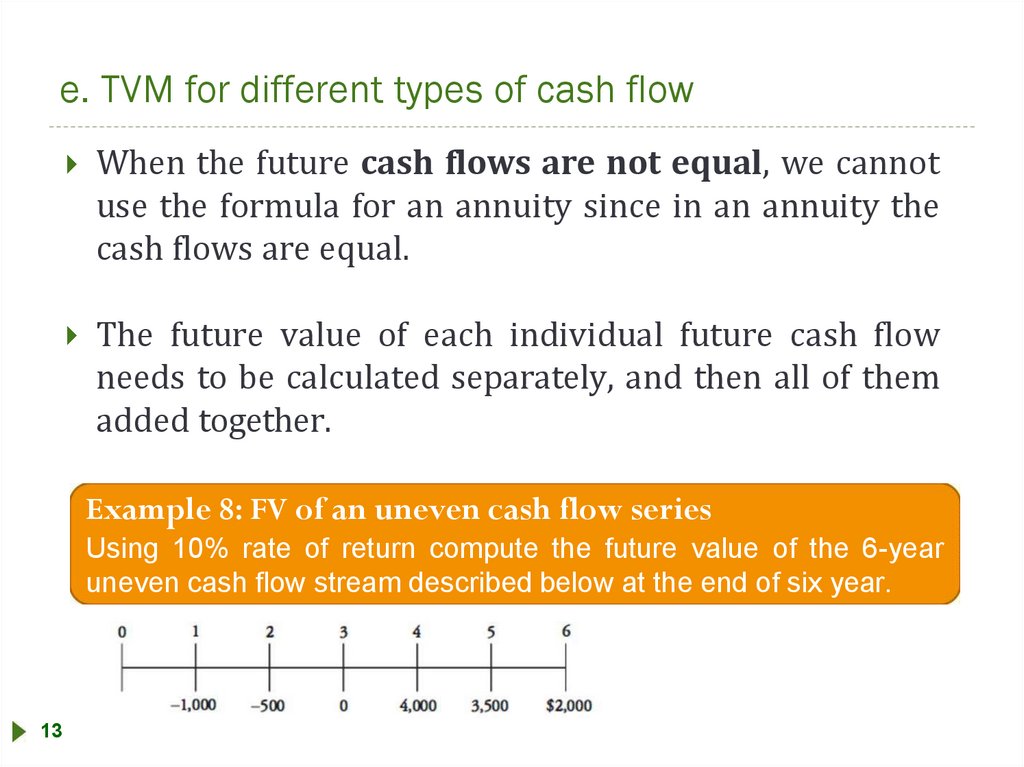
e. TVM for different types of cash flowWhen the future cash flows are not equal, we cannot
use the formula for an annuity since in an annuity the
cash flows are equal.
The future value of each individual future cash flow
needs to be calculated separately, and then all of them
added together.
Example 8: FV of an uneven cash flow series
Using 10% rate of return compute the future value of the 6-year
uneven cash flow stream described below at the end of six year.
13
14.
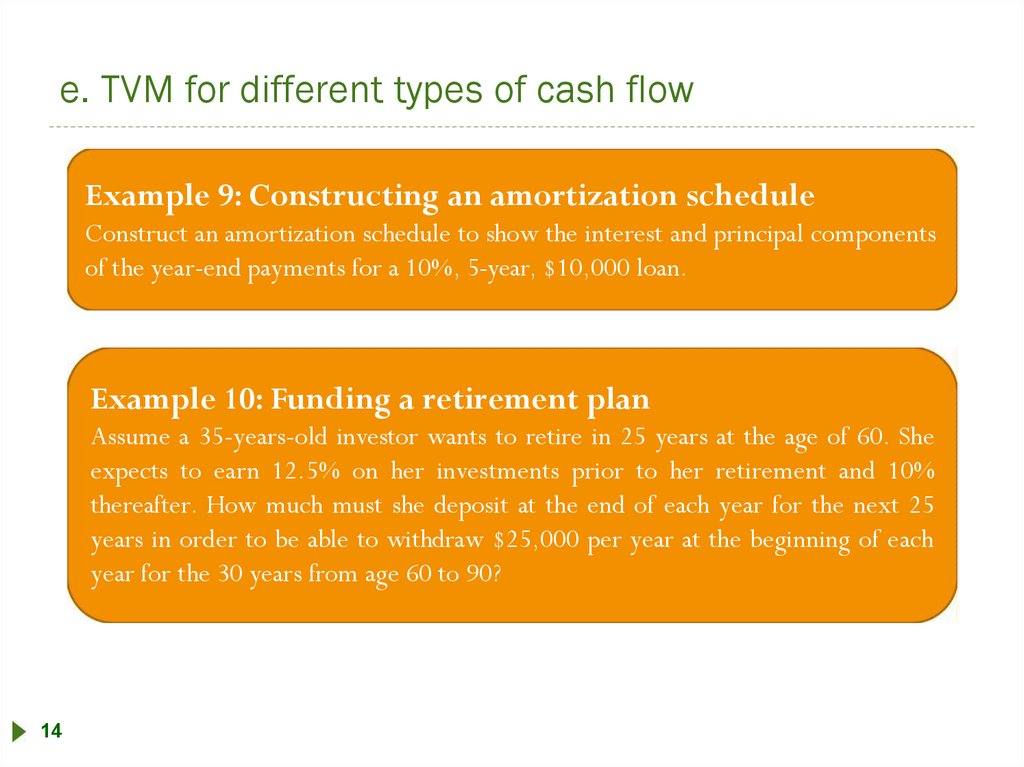
e. TVM for different types of cash flowExample 9: Constructing an amortization schedule
Construct an amortization schedule to show the interest and principal components
of the year-end payments for a 10%, 5-year, $10,000 loan.
Example 10: Funding a retirement plan
Assume a 35-years-old investor wants to retire in 25 years at the age of 60. She
expects to earn 12.5% on her investments prior to her retirement and 10%
thereafter. How much must she deposit at the end of each year for the next 25
years in order to be able to withdraw $25,000 per year at the beginning of each
year for the 30 years from age 60 to 90?
14
15.
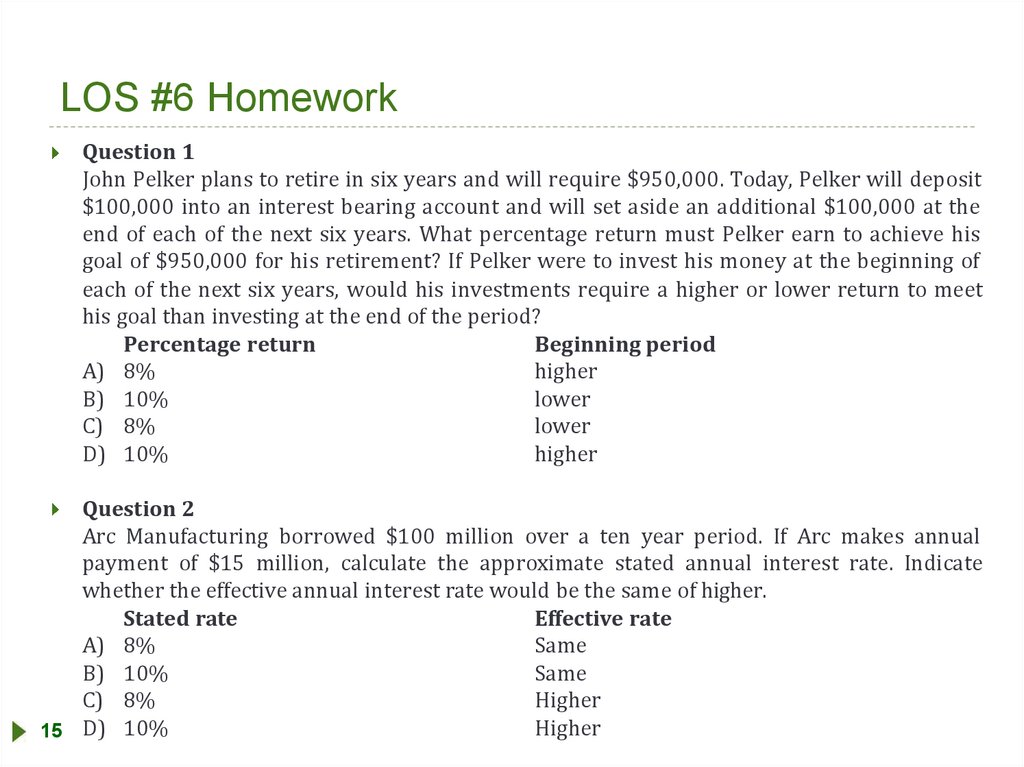
LOS #6 HomeworkQuestion 1
John Pelker plans to retire in six years and will require $950,000. Today, Pelker will deposit
$100,000 into an interest bearing account and will set aside an additional $100,000 at the
end of each of the next six years. What percentage return must Pelker earn to achieve his
goal of $950,000 for his retirement? If Pelker were to invest his money at the beginning of
each of the next six years, would his investments require a higher or lower return to meet
his goal than investing at the end of the period?
Percentage return
Beginning period
A) 8%
higher
B) 10%
lower
C) 8%
lower
D) 10%
higher
Question 2
Arc Manufacturing borrowed $100 million over a ten year period. If Arc makes annual
payment of $15 million, calculate the approximate stated annual interest rate. Indicate
whether the effective annual interest rate would be the same of higher.
Stated rate
Effective rate
A) 8%
Same
B) 10%
Same
C) 8%
Higher
Higher
15 D) 10%
16.
LOS #6 HomeworkQuestion 3
Optimal Insurance is offering a deferred annuity that promises to pay 10 percent per annum
with equal annual payments beginning at the end of 10 years and continuing for a total of 10
annual payments. For an initial investment of $100,000, what will be the amount of the
annual payments?
A) $25,937
B) $42,212
C) $39,416
D) $38,375
Question 4
Marc Schmitz borrows $20,000 to be paid back in four equal annual payments at an interest
rate of 8 percent. The interest amount in the second year’s payment would be:
A)
B)
C)
D)
16
$1 116.90
$1 600.00
$6 038.40
$1 244.90
17.
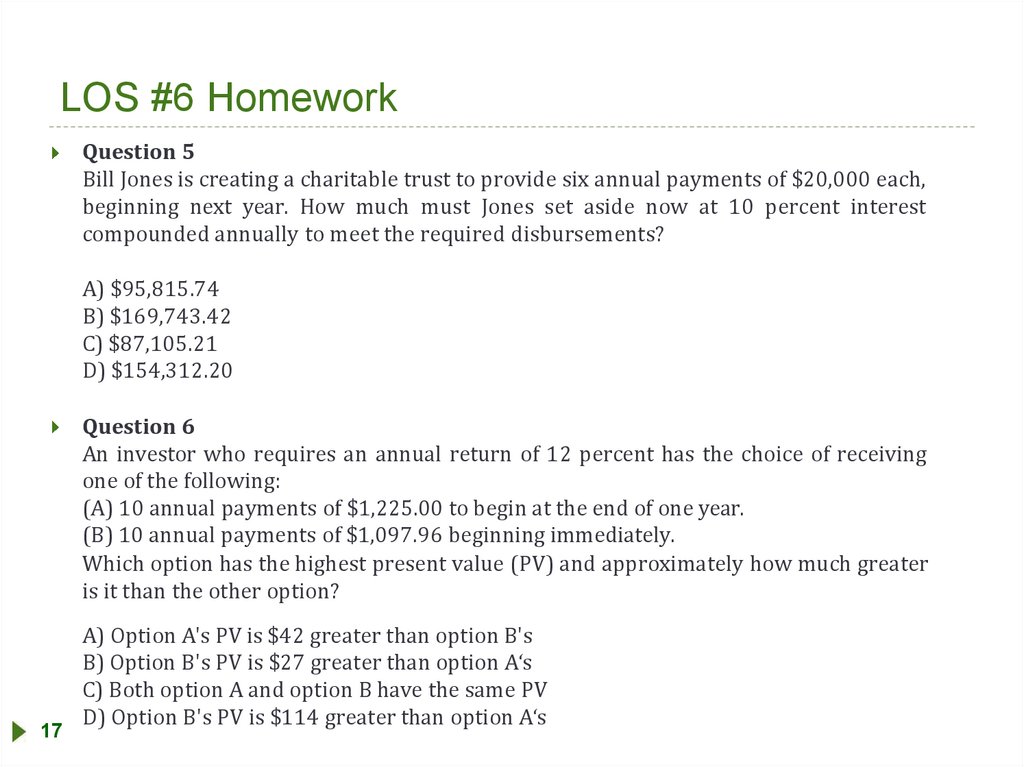
LOS #6 HomeworkQuestion 5
Bill Jones is creating a charitable trust to provide six annual payments of $20,000 each,
beginning next year. How much must Jones set aside now at 10 percent interest
compounded annually to meet the required disbursements?
A) $95,815.74
B) $169,743.42
C) $87,105.21
D) $154,312.20
Question 6
An investor who requires an annual return of 12 percent has the choice of receiving
one of the following:
(A) 10 annual payments of $1,225.00 to begin at the end of one year.
(B) 10 annual payments of $1,097.96 beginning immediately.
Which option has the highest present value (PV) and approximately how much greater
is it than the other option?
17
A) Option A's PV is $42 greater than option B's
B) Option B's PV is $27 greater than option A‘s
C) Both option A and option B have the same PV
D) Option B's PV is $114 greater than option A‘s
18.
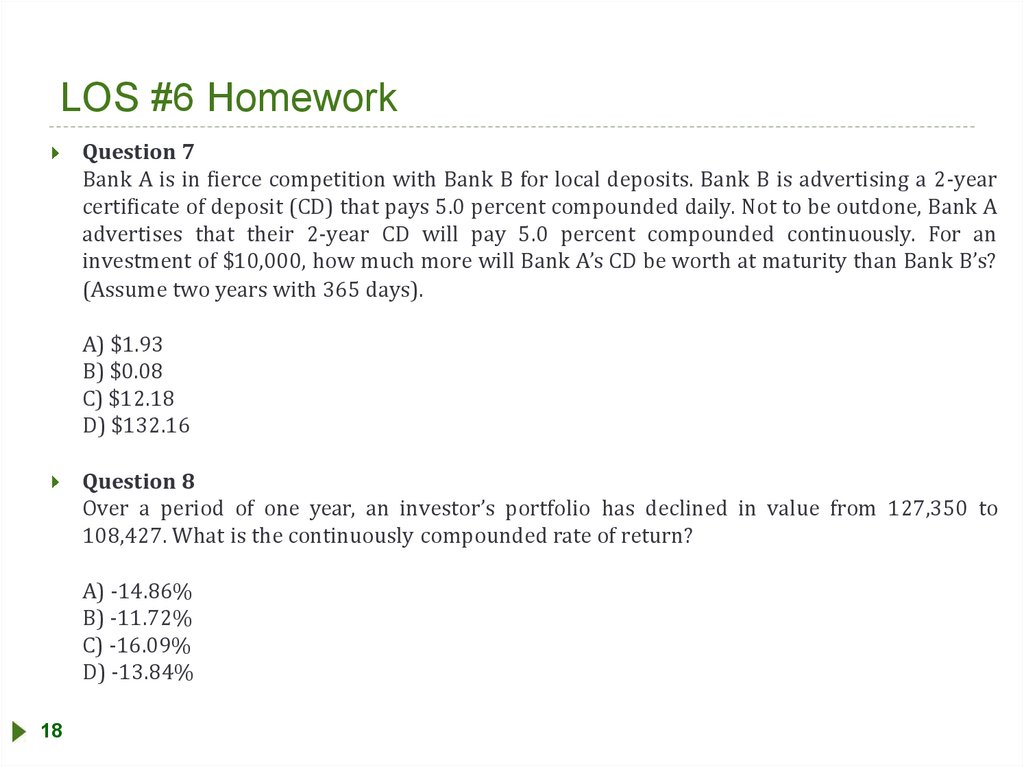
LOS #6 HomeworkQuestion 7
Bank A is in fierce competition with Bank B for local deposits. Bank B is advertising a 2-year
certificate of deposit (CD) that pays 5.0 percent compounded daily. Not to be outdone, Bank A
advertises that their 2-year CD will pay 5.0 percent compounded continuously. For an
investment of $10,000, how much more will Bank A’s CD be worth at maturity than Bank B’s?
(Assume two years with 365 days).
A) $1.93
B) $0.08
C) $12.18
D) $132.16
Question 8
Over a period of one year, an investor’s portfolio has declined in value from 127,350 to
108,427. What is the continuously compounded rate of return?
A) -14.86%
B) -11.72%
C) -16.09%
D) -13.84%
18
19.
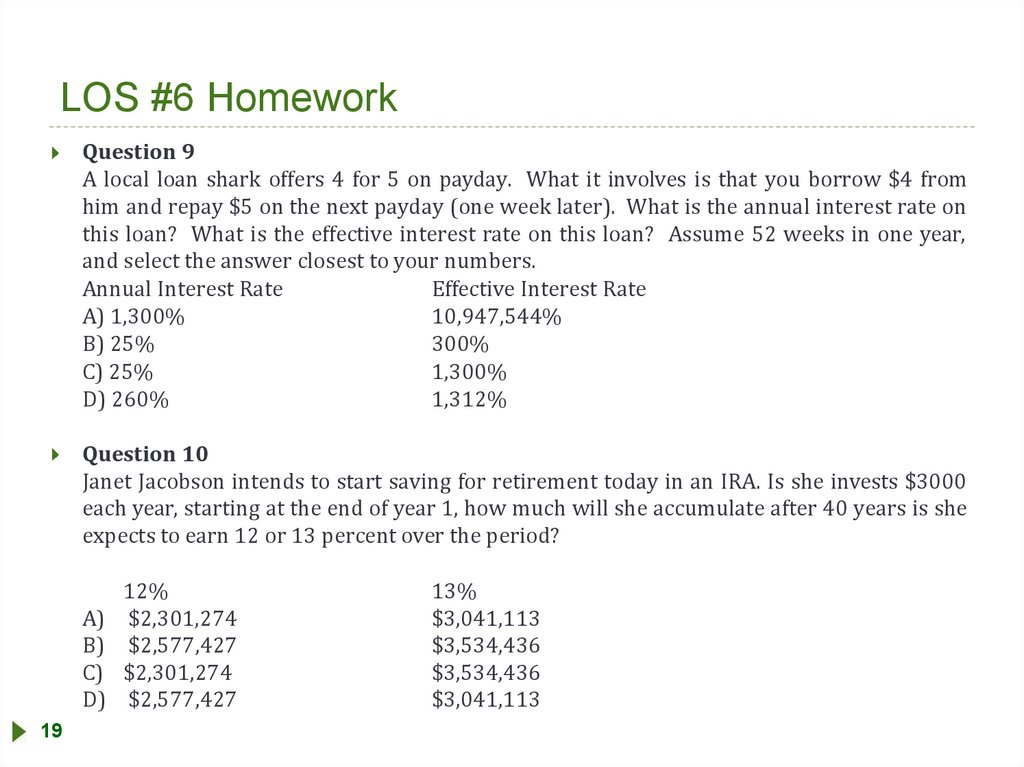
LOS #6 HomeworkQuestion 9
A local loan shark offers 4 for 5 on payday. What it involves is that you borrow $4 from
him and repay $5 on the next payday (one week later). What is the annual interest rate on
this loan? What is the effective interest rate on this loan? Assume 52 weeks in one year,
and select the answer closest to your numbers.
Annual Interest Rate
Effective Interest Rate
A) 1,300%
10,947,544%
B) 25%
300%
C) 25%
1,300%
D) 260%
1,312%
Question 10
Janet Jacobson intends to start saving for retirement today in an IRA. Is she invests $3000
each year, starting at the end of year 1, how much will she accumulate after 40 years is she
expects to earn 12 or 13 percent over the period?
A)
B)
C)
D)
19
12%
$2,301,274
$2,577,427
$2,301,274
$2,577,427
13%
$3,041,113
$3,534,436
$3,534,436
$3,041,113
20.
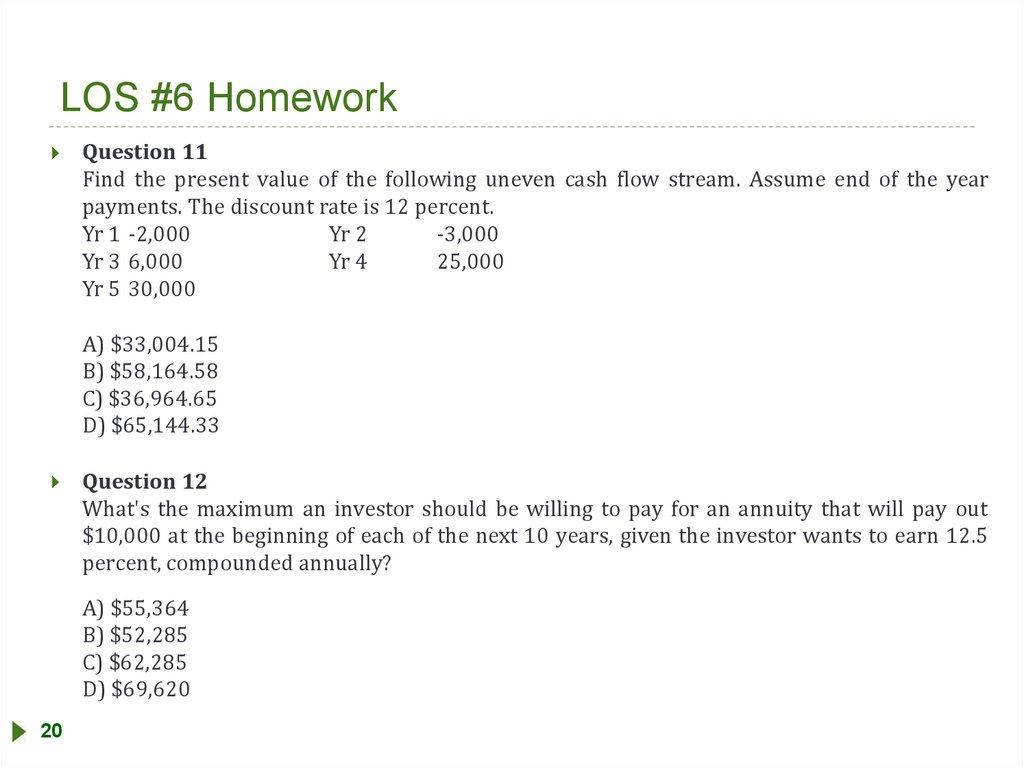
LOS #6 HomeworkQuestion 11
Find the present value of the following uneven cash flow stream. Assume end of the year
payments. The discount rate is 12 percent.
Yr 1 -2,000
Yr 2
-3,000
Yr 3 6,000
Yr 4
25,000
Yr 5 30,000
A) $33,004.15
B) $58,164.58
C) $36,964.65
D) $65,144.33
Question 12
What's the maximum an investor should be willing to pay for an annuity that will pay out
$10,000 at the beginning of each of the next 10 years, given the investor wants to earn 12.5
percent, compounded annually?
A) $55,364
B) $52,285
C) $62,285
D) $69,620
20
21.
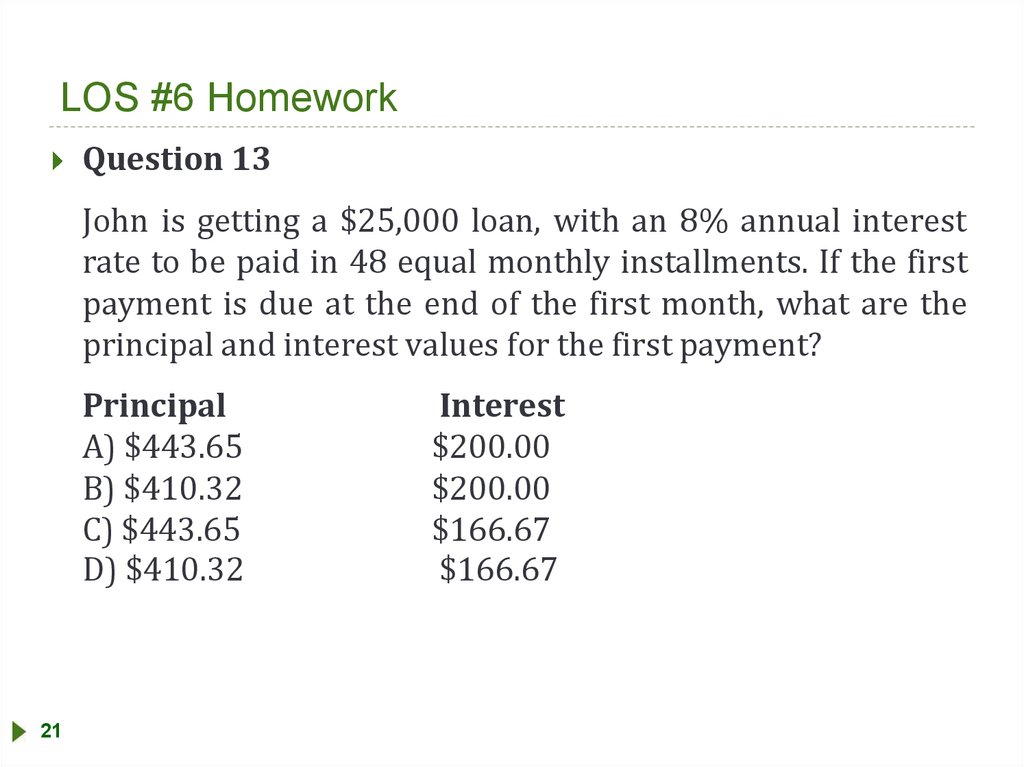
LOS #6 HomeworkQuestion 13
John is getting a $25,000 loan, with an 8% annual interest
rate to be paid in 48 equal monthly installments. If the first
payment is due at the end of the first month, what are the
principal and interest values for the first payment?
Principal
A) $443.65
B) $410.32
C) $443.65
D) $410.32
21
Interest
$200.00
$200.00
$166.67
$166.67
22.
Statistical concepts and marketreturn
LOS #7
22
23.
Statistical concepts and market returnThe candidate should be able to:
a.
Distinguish between descriptive and inferential statistics, population
and a sample, and among the types of measurement scales
b.
Define a parameter, a sample statistic, and a frequency distribution.
c.
Calculate and interpret relative frequencies and cumulative relative
frequencies, given a frequency distribution.
d.
Describe the properties of a data set presented as a histogram or a
frequency polygon
e.
Calculate and interpret measures of central tendency, including
population mean, sample mean, arithmetic mean, weighted average
mean, geometric and harmonic mean, median, and mode.
f.
Calculate and interpret quartiles, quintiles, deciles, and percentiles.
g.
Calculate and interpret 1) a range and a mean absolute deviation and
2) the variance and standard deviation of a population and of a
sample
23
24.
Statistical concepts and market returnThe candidate should be able to:
h.
Calculate and interpret the proportion of observations falling within a
specified number of standard deviations of the mean using
Chebyshev's inequality
i.
Calculate and interpret the coefficient of variation and the Sharpe
ratio
j.
Explain skewness and the meaning of a positively or negatively
skewed return distribution
k.
Describe the relative locations of the mean, median and mode for a
unimodal, nonsymmetrical distribution
l.
Explain measures of sample skewness and kurtosis
m.
Compare the use of arithmetic and geometric means when analyzing
investment returns
24
25.
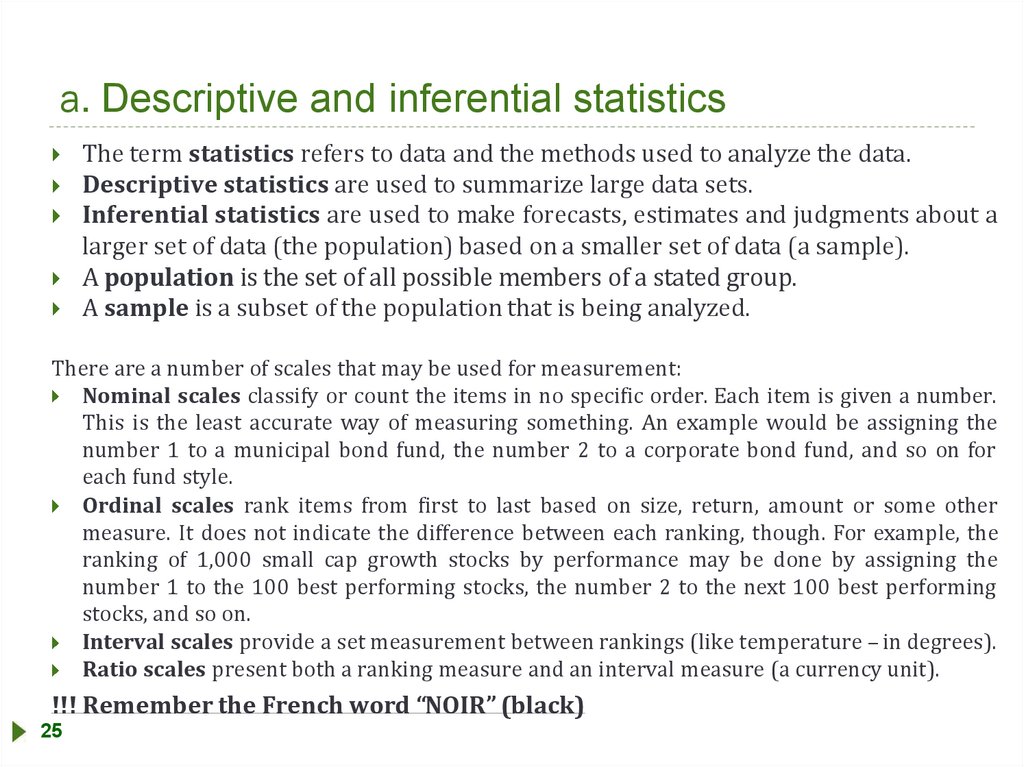
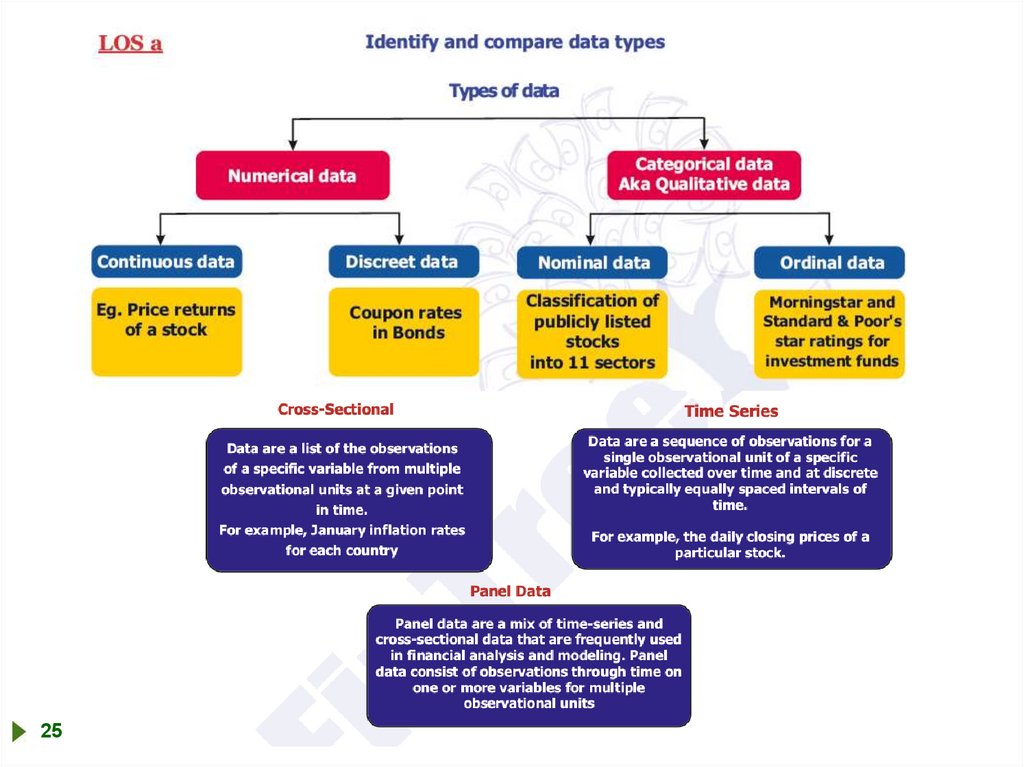
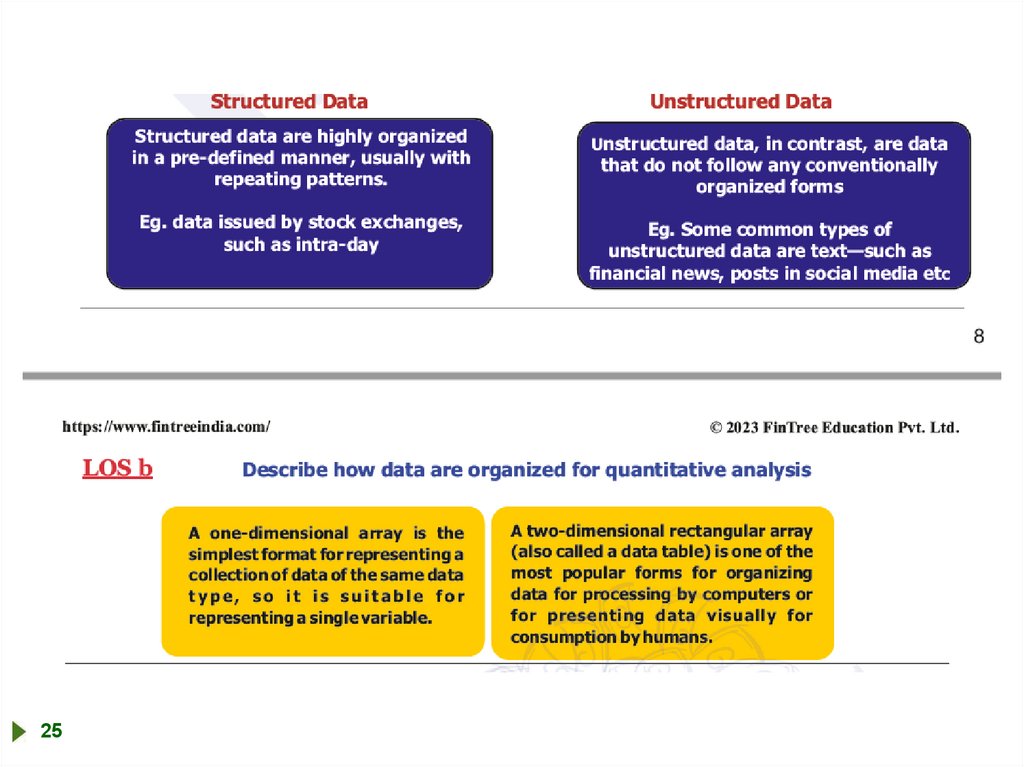
a. Descriptive and inferential statisticsThe term statistics refers to data and the methods used to analyze the data.
Descriptive statistics are used to summarize large data sets.
Inferential statistics are used to make forecasts, estimates and judgments about a
larger set of data (the population) based on a smaller set of data (a sample).
A population is the set of all possible members of a stated group.
A sample is a subset of the population that is being analyzed.
There are a number of scales that may be used for measurement:
Nominal scales classify or count the items in no specific order. Each item is given a number.
This is the least accurate way of measuring something. An example would be assigning the
number 1 to a municipal bond fund, the number 2 to a corporate bond fund, and so on for
each fund style.
Ordinal scales rank items from first to last based on size, return, amount or some other
measure. It does not indicate the difference between each ranking, though. For example, the
ranking of 1,000 small cap growth stocks by performance may be done by assigning the
number 1 to the 100 best performing stocks, the number 2 to the next 100 best performing
stocks, and so on.
Interval scales provide a set measurement between rankings (like temperature – in degrees).
Ratio scales present both a ranking measure and an interval measure (a currency unit).
!!! Remember the French word “NOIR” (black)
25
26.
2527.
2528.
2529.
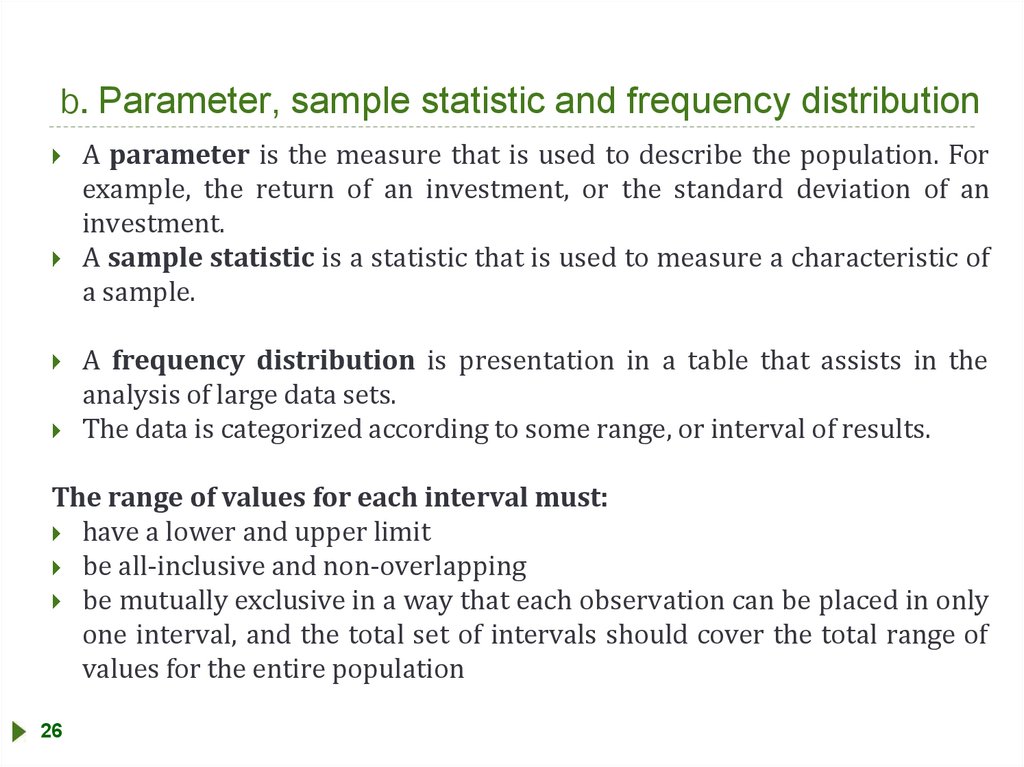
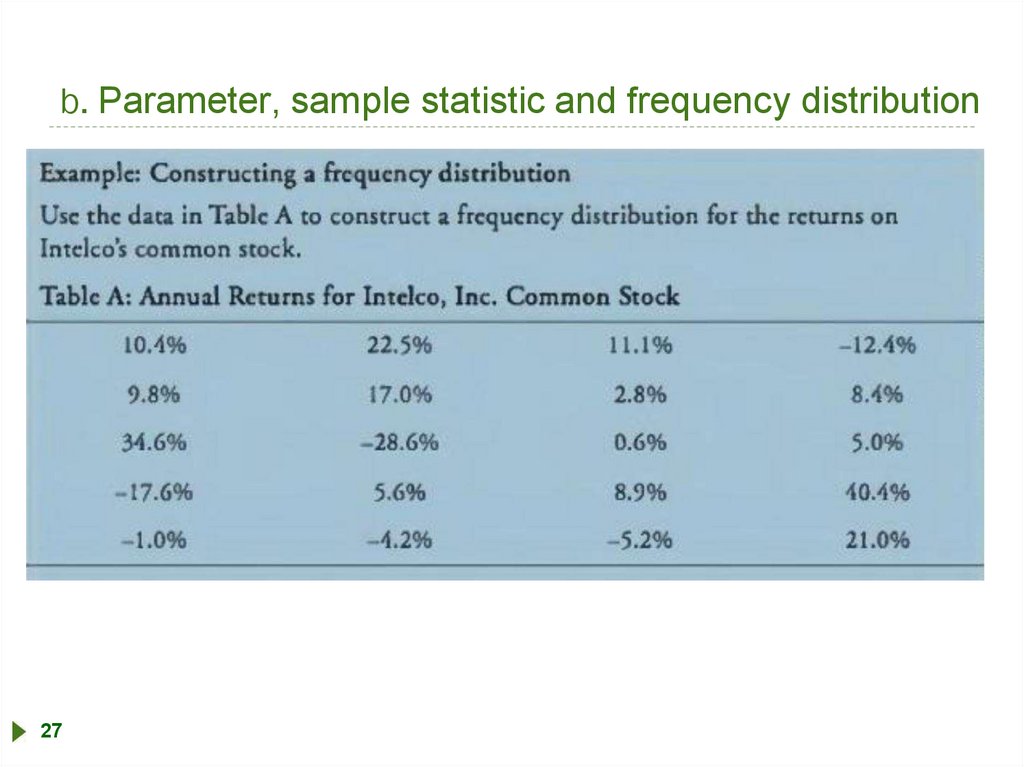
b. Parameter, sample statistic and frequency distributionA parameter is the measure that is used to describe the population. For
example, the return of an investment, or the standard deviation of an
investment.
A sample statistic is a statistic that is used to measure a characteristic of
a sample.
A frequency distribution is presentation in a table that assists in the
analysis of large data sets.
The data is categorized according to some range, or interval of results.
The range of values for each interval must:
have a lower and upper limit
be all-inclusive and non-overlapping
be mutually exclusive in a way that each observation can be placed in only
one interval, and the total set of intervals should cover the total range of
values for the entire population
26
30.
b. Parameter, sample statistic and frequency distribution27
31.
c. Relative frequencies and cumulative relative frequenciesThe relative frequency is a measure of what percentage of
the total results were in a specific range. Or, in other words,
relative frequency is the percentage of total observations
falling within each interval.
The cumulative relative frequency is what % of the
population has accumulated as the results move through
the range.
Example 1: Relative frequency
Calculate relative frequencies and cumulative relative frequencies
from the previous example
28
32.
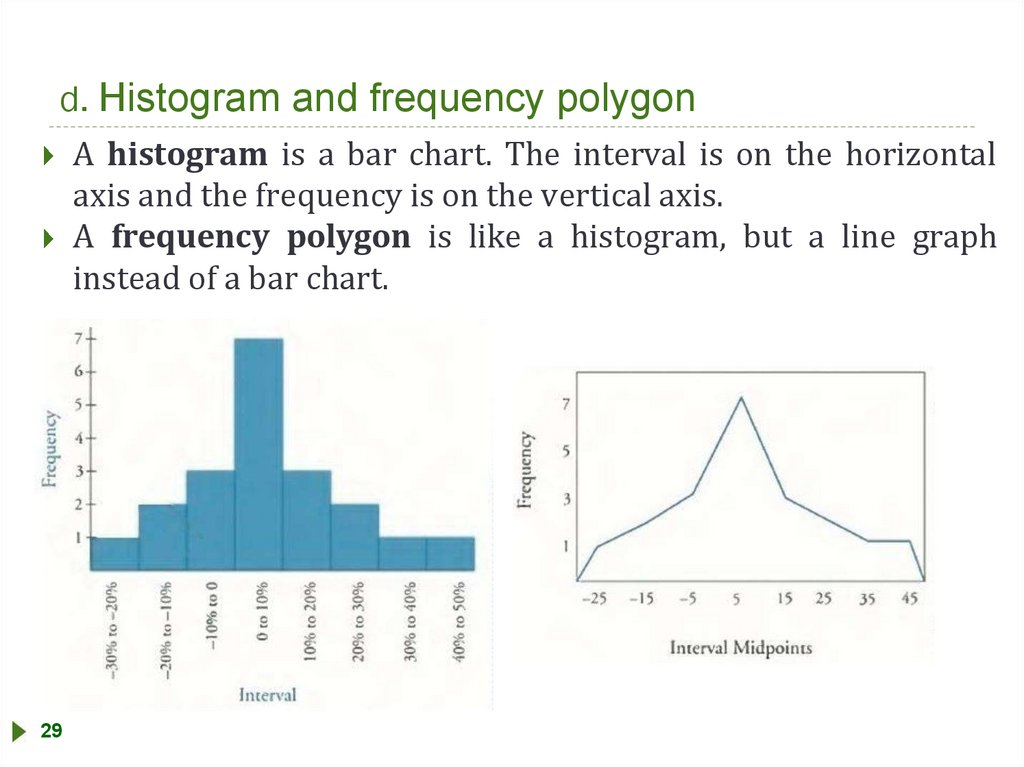
d. Histogram and frequency polygonA histogram is a bar chart. The interval is on the horizontal
axis and the frequency is on the vertical axis.
A frequency polygon is like a histogram, but a line graph
instead of a bar chart.
29
33.
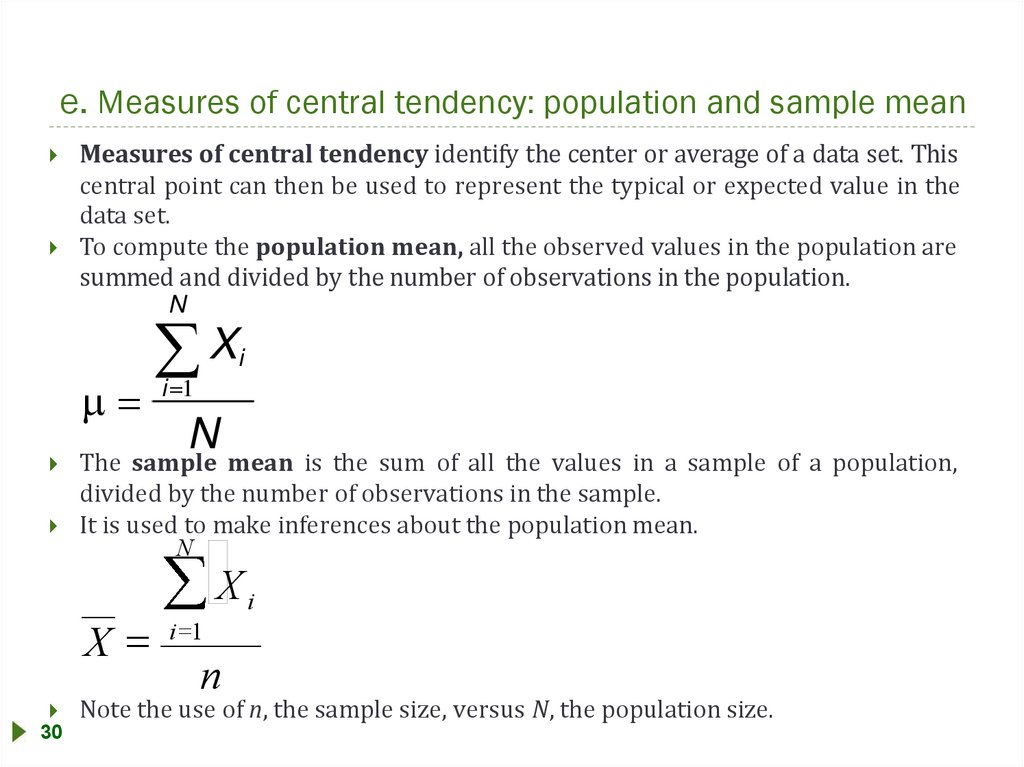
e. Measures of central tendency: population and sample meanMeasures of central tendency identify the center or average of a data set. This
central point can then be used to represent the typical or expected value in the
data set.
To compute the population mean, all the observed values in the population are
summed and divided by the number of observations in the population.
N
X
i
i 1
N
The sample mean is the sum of all the values in a sample of a population,
divided by the number of observations in the sample.
It is used to make inferences about the population mean.
N
Xi
X
30
i 1
n
Note the use of n, the sample size, versus N, the population size.
34.
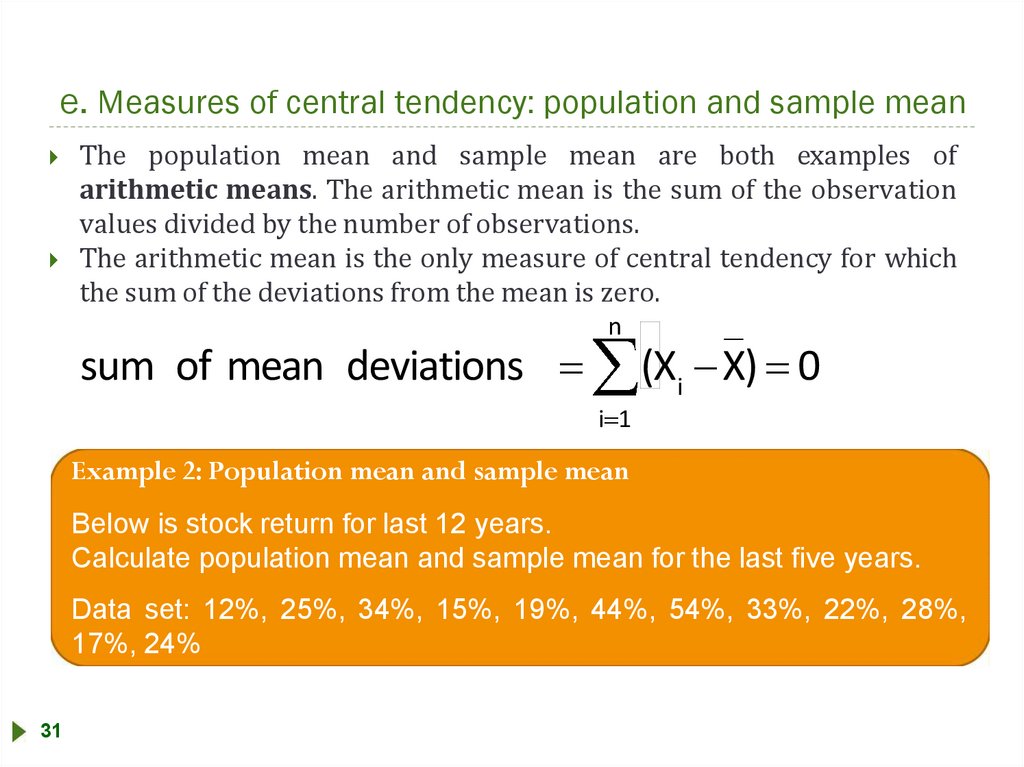
e. Measures of central tendency: population and sample meanThe population mean and sample mean are both examples of
arithmetic means. The arithmetic mean is the sum of the observation
values divided by the number of observations.
The arithmetic mean is the only measure of central tendency for which
the sum of the deviations from the mean is zero.
n
sum of mean deviations
(Xi X) 0
i 1
Example 2: Population mean and sample mean
Below is stock return for last 12 years.
Calculate population mean and sample mean for the last five years.
Data set: 12%, 25%, 34%, 15%, 19%, 44%, 54%, 33%, 22%, 28%,
17%, 24%
31
35.
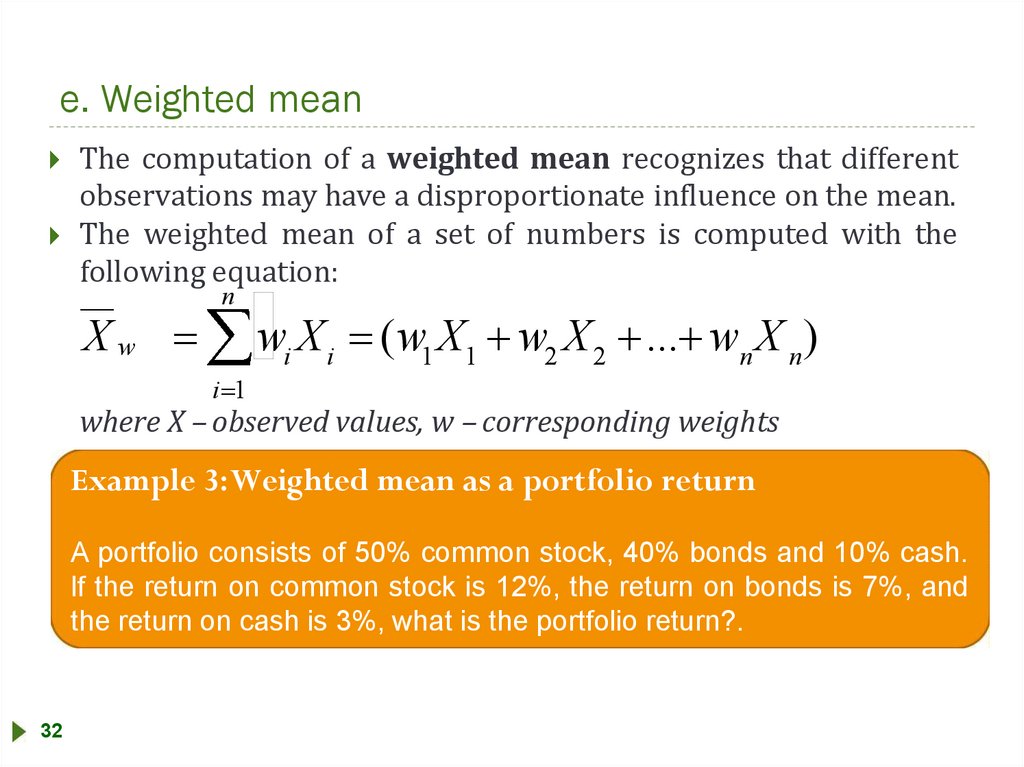
e. Weighted meanThe computation of a weighted mean recognizes that different
observations may have a disproportionate influence on the mean.
The weighted mean of a set of numbers is computed with the
following equation:
n
Xw
wi X i
(w1 X1 w2 X 2 ... wnX n)
i 1
where X – observed values, w – corresponding weights
Example 3:Weighted mean as a portfolio return
A portfolio consists of 50% common stock, 40% bonds and 10% cash.
lf the return on common stock is 12%, the return on bonds is 7%, and
the return on cash is 3%, what is the portfolio return?.
32
36.
e. MedianThe median is the midpoint of a data set when the data is arranged in ascending
or descending order. Half the observations lie above the median and half are
below.
The median is important because the arithmetic mean can be affected by
extremely large or small values (outliers). When this occurs, the median is a better
measure of central tendency than the mean because it is not affected by extreme
values that may actually be the result of errors in the data.
Example 4:The median using an odd number of observations
What is the median return for five portfolio managers with 10-year annualized total returns
record of 30%, 15%, 25%, 21% and 23%?
Example 5:The median using an even number of observations
Suppose we add a sixth manager to the previous example with a return of 28%.What is the
median return?
33
37.
e. ModeThe mode is the value that occurs most frequently in a data
set. A data set may have more than one mode or no mode.
When a distribution has one value that appears most
frequently it is said to be unimodal.
When a set of data has two or three values that occur most
frequently it is said to be bimodal or trimodal,
respectively.
Example 6:The mode
What is the mode of the following data set?
Data Set: 30%, 28%, 25%, 23%, 28%, 15%, 5%
34
38.
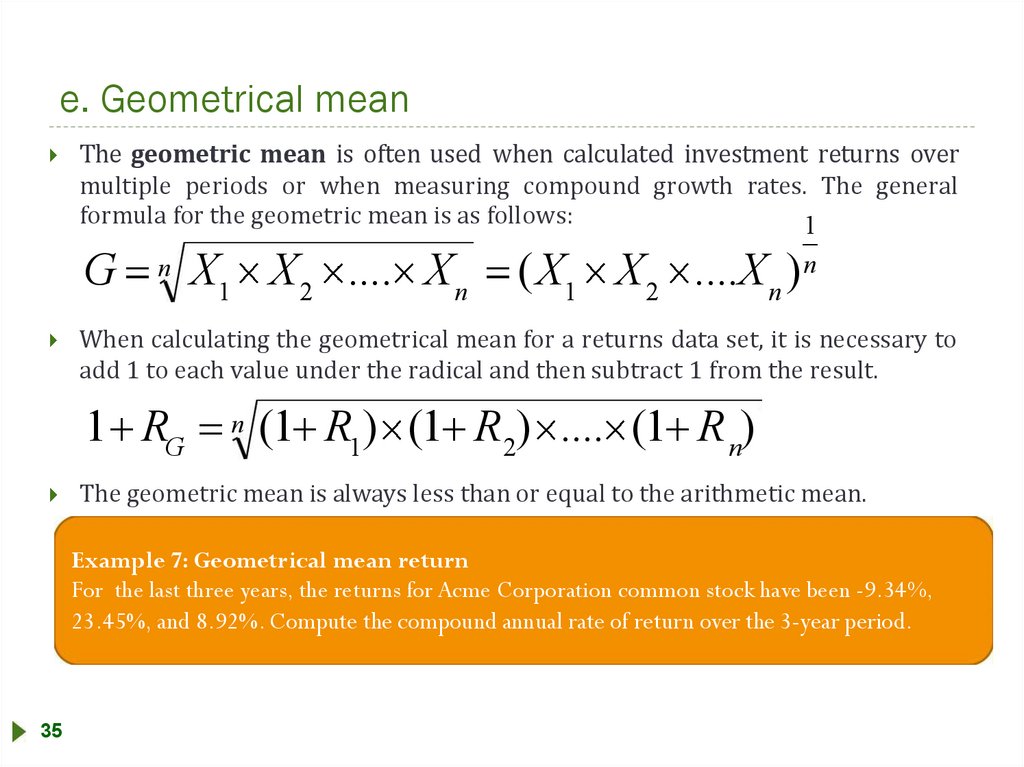
e. Geometrical meanThe geometric mean is often used when calculated investment returns over
multiple periods or when measuring compound growth rates. The general
formula for the geometric mean is as follows:
1
G
n
X1 X 2 .... X n
(X1 X 2 ....X n ) n
When calculating the geometrical mean for a returns data set, it is necessary to
add 1 to each value under the radical and then subtract 1 from the result.
1 RG
n
(1 R1) (1 R 2) .... (1 R n)
The geometric mean is always less than or equal to the arithmetic mean.
Example 7: Geometrical mean return
For the last three years, the returns for Acme Corporation common stock have been -9.34%,
23.45%, and 8.92%. Compute the compound annual rate of return over the 3-year period.
35
39.
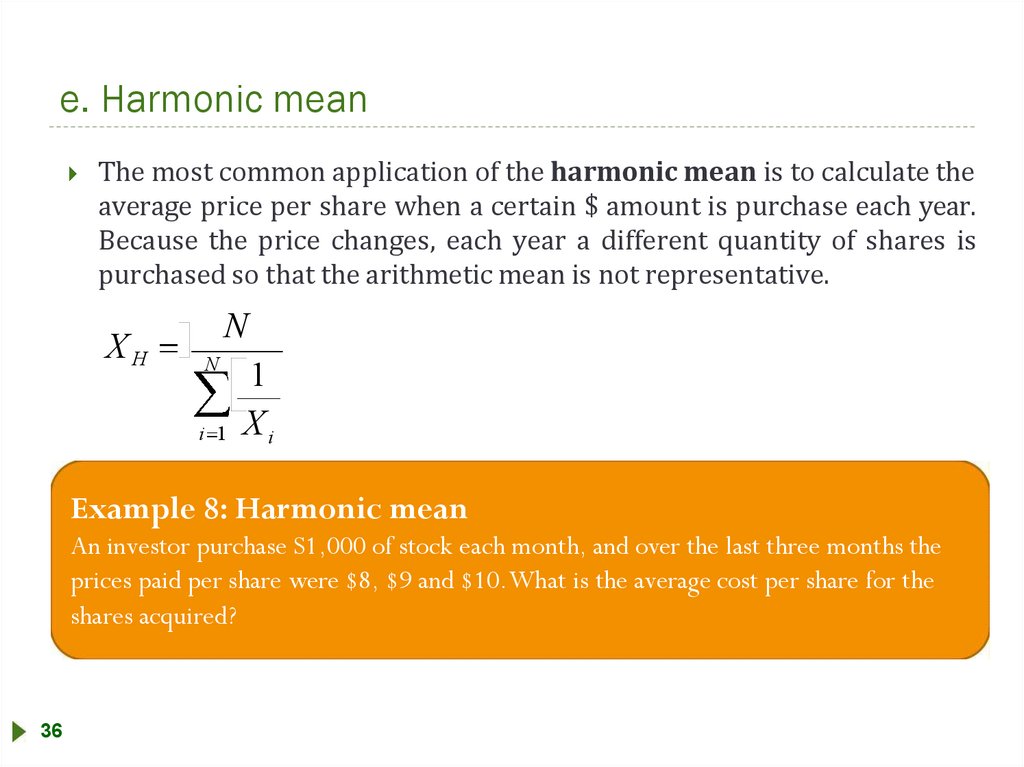
e. Harmonic meanThe most common application of the harmonic mean is to calculate the
average price per share when a certain $ amount is purchase each year.
Because the price changes, each year a different quantity of shares is
purchased so that the arithmetic mean is not representative.
XH
N
N
1
i 1 Xi
Example 8: Harmonic mean
An investor purchase S1,000 of stock each month, and over the last three months the
prices paid per share were $8, $9 and $10.What is the average cost per share for the
shares acquired?
36
40.
2541.
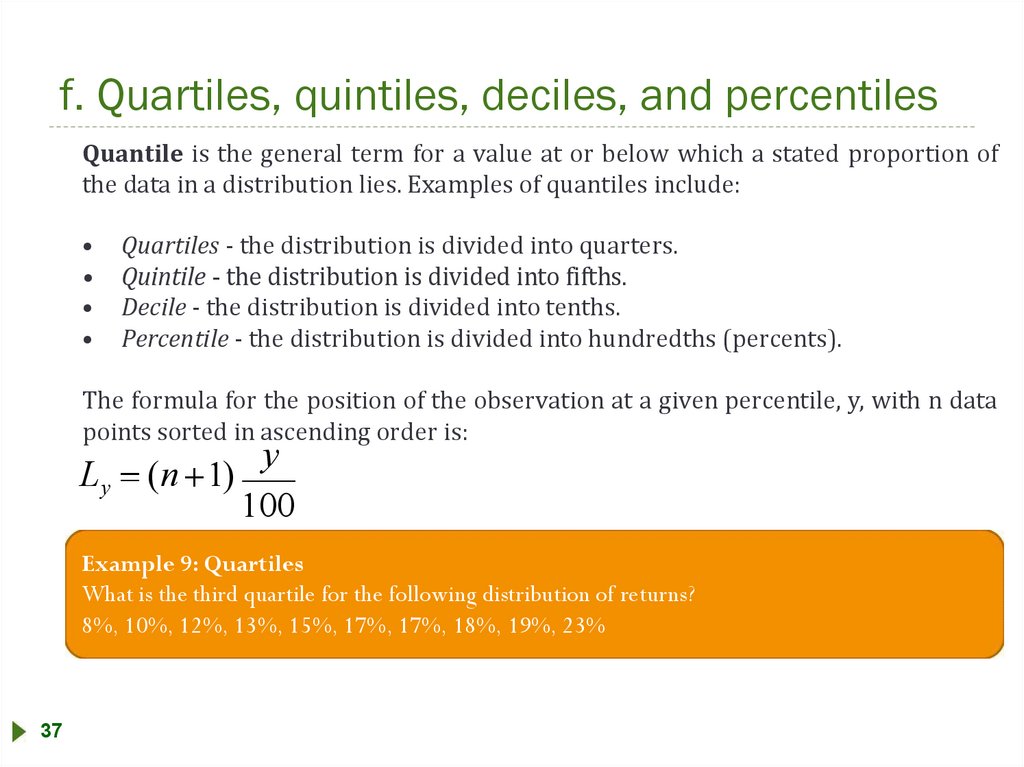
f. Quartiles, quintiles, deciles, and percentilesQuantile is the general term for a value at or below which a stated proportion of
the data in a distribution lies. Examples of quantiles include:
Quartiles - the distribution is divided into quarters.
Quintile - the distribution is divided into fifths.
Decile - the distribution is divided into tenths.
Percentile - the distribution is divided into hundredths (percents).
The formula for the position of the observation at a given percentile, y, with n data
points sorted in ascending order is:
Ly
y
(n 1)
100
Example 9: Quartiles
What is the third quartile for the following distribution of returns?
8%, 10%, 12%, 13%, 15%, 17%, 17%, 18%, 19%, 23%
37
42.
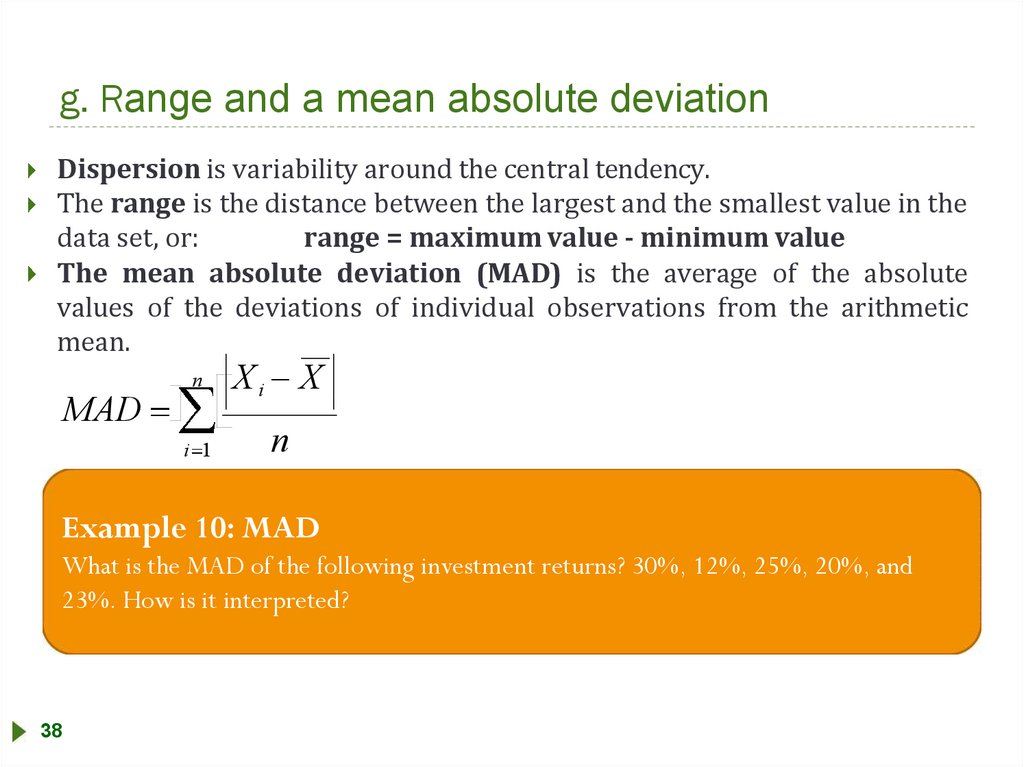
g. Range and a mean absolute deviationDispersion is variability around the central tendency.
The range is the distance between the largest and the smallest value in the
data set, or:
range = maximum value - minimum value
The mean absolute deviation (MAD) is the average of the absolute
values of the deviations of individual observations from the arithmetic
mean.
MAD
n
i 1
Xi
X
n
Example 10: MAD
What is the MAD of the following investment returns? 30%, 12%, 25%, 20%, and
23%. How is it interpreted?
38
43.
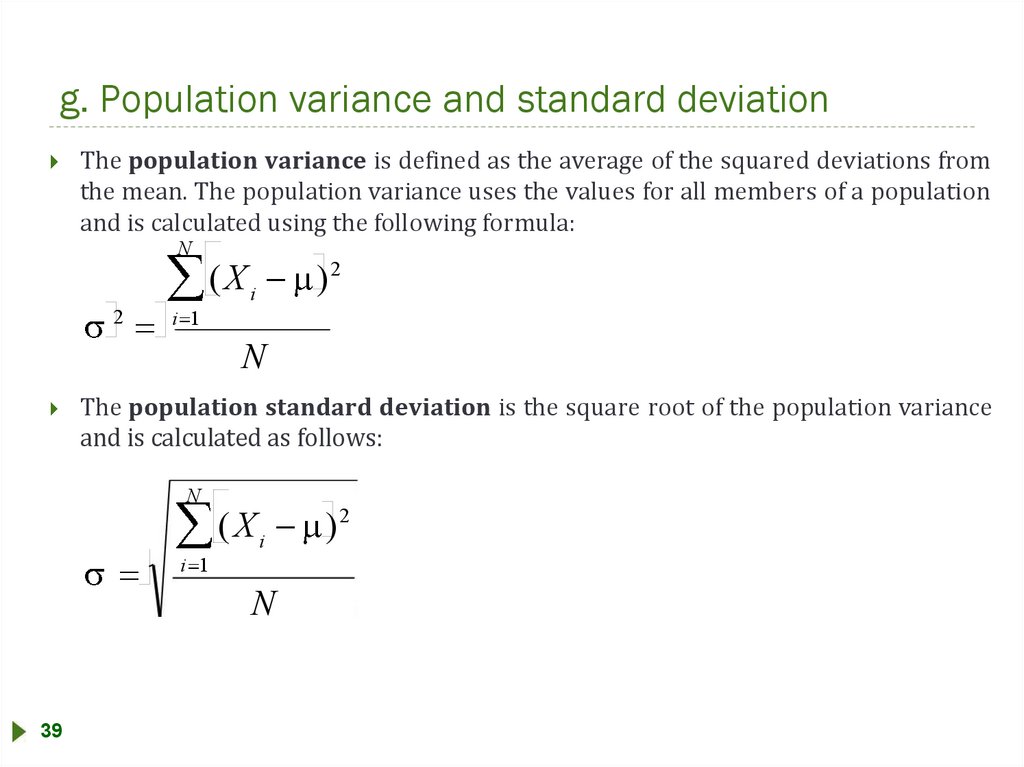
g. Population variance and standard deviationThe population variance is defined as the average of the squared deviations from
the mean. The population variance uses the values for all members of a population
and is calculated using the following formula:
N
2
(Xi
)2
i 1
N
The population standard deviation is the square root of the population variance
and is calculated as follows:
N
(Xi
i 1
N
39
)2
44.
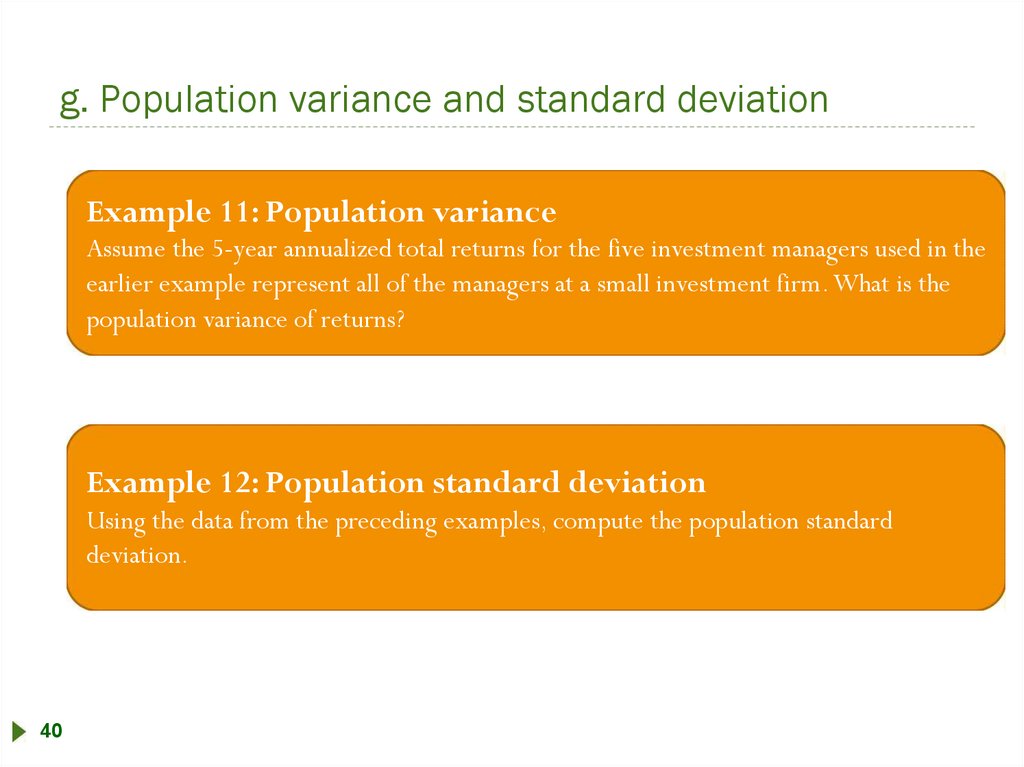
g. Population variance and standard deviationExample 11: Population variance
Assume the 5-year annualized total returns for the five investment managers used in the
earlier example represent all of the managers at a small investment firm.What is the
population variance of returns?
Example 12: Population standard deviation
Using the data from the preceding examples, compute the population standard
deviation.
40
45.
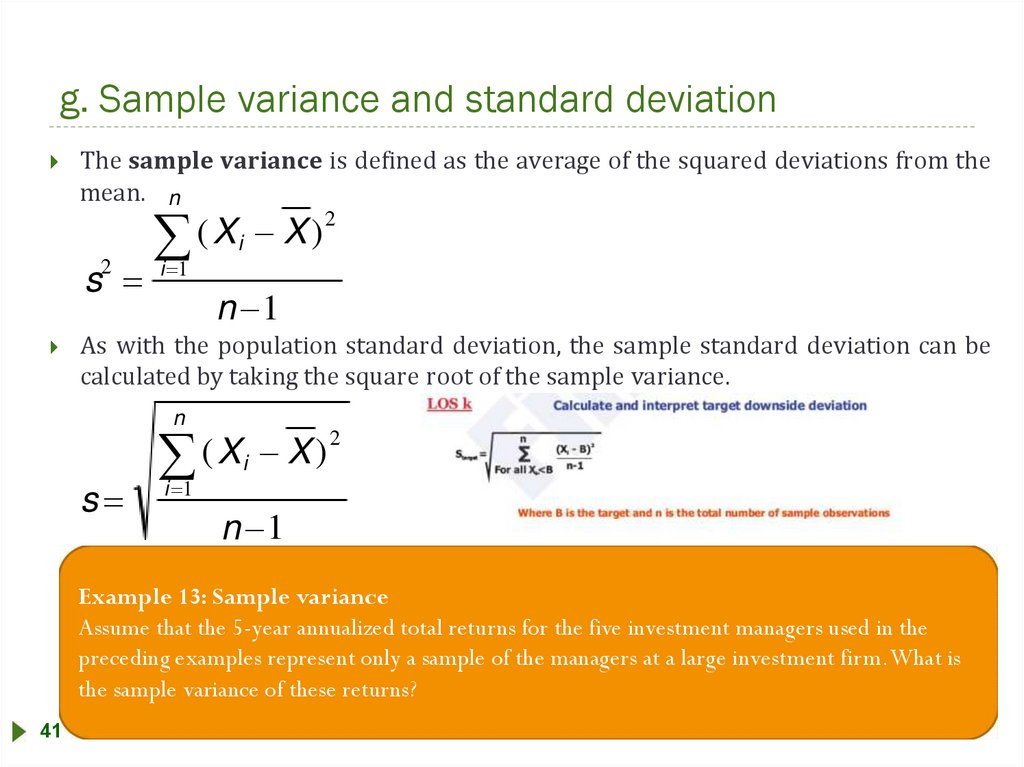
g. Sample variance and standard deviationThe sample variance is defined as the average of the squared deviations from the
mean. n
2
(
)
X
X
i
s i 1
2
n 1
As with the population standard deviation, the sample standard deviation can be
calculated by taking the square root of the sample variance.
n
s
2
(
)
X
X
i
i 1
n 1
Example 13: Sample variance
Assume that the 5-year annualized total returns for the five investment managers used in the
preceding examples represent only a sample of the managers at a large investment firm.What is
the sample variance of these returns?
41
46.
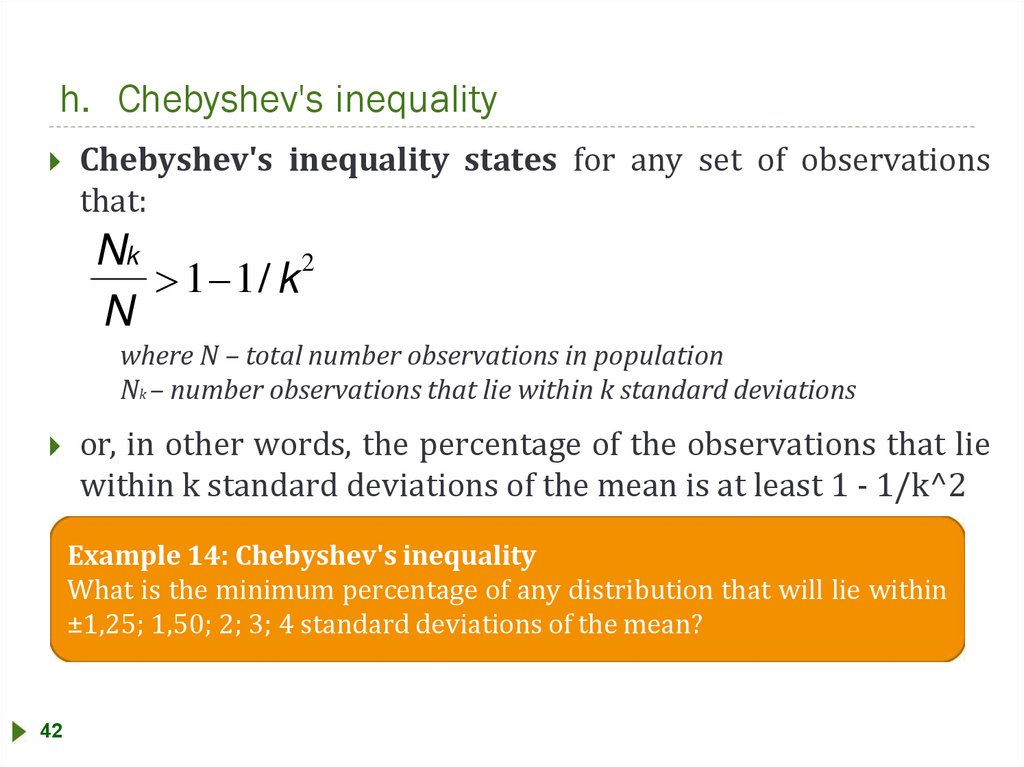
h. Chebyshev's inequalityChebyshev's inequality states for any set of observations
that:
Nk
2
1 1/ k
N
where N – total number observations in population
Nk – number observations that lie within k standard deviations
or, in other words, the percentage of the observations that lie
within k standard deviations of the mean is at least 1 - 1/k^2
Example 14: Chebyshev's inequality
What is the minimum percentage of any distribution that will lie within
±1,25; 1,50; 2; 3; 4 standard deviations of the mean?
42
47.
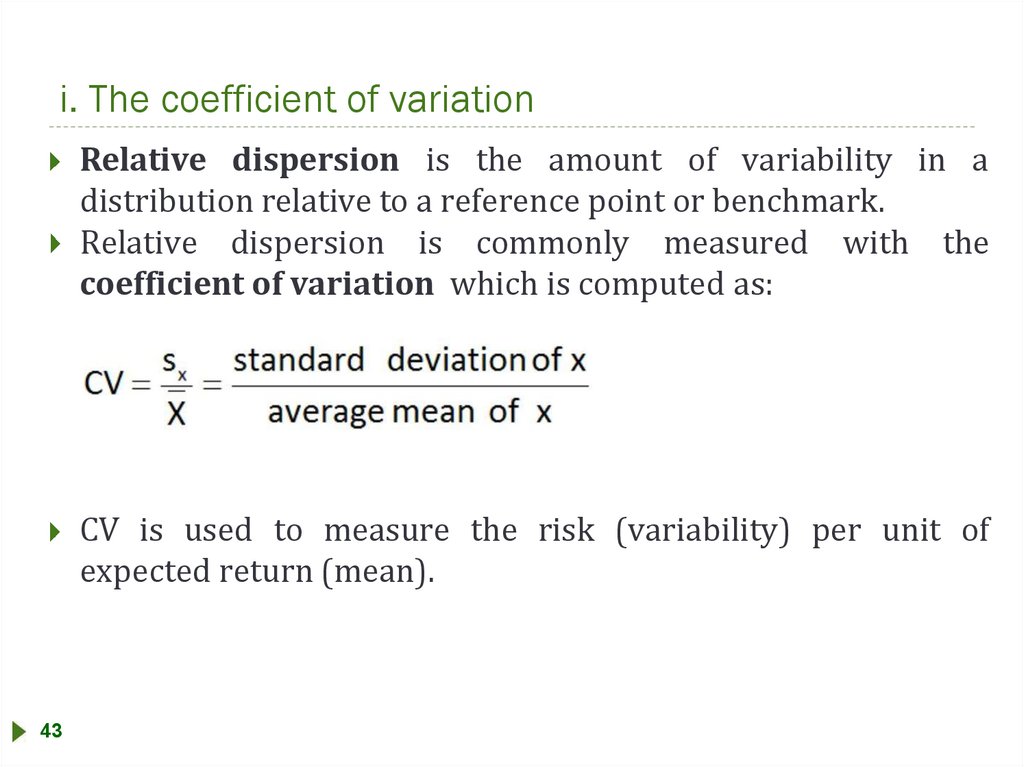
i. The coefficient of variationRelative dispersion is the amount of variability in a
distribution relative to a reference point or benchmark.
Relative dispersion is commonly measured with the
coefficient of variation which is computed as:
CV is used to measure the risk (variability) per unit of
expected return (mean).
43
48.
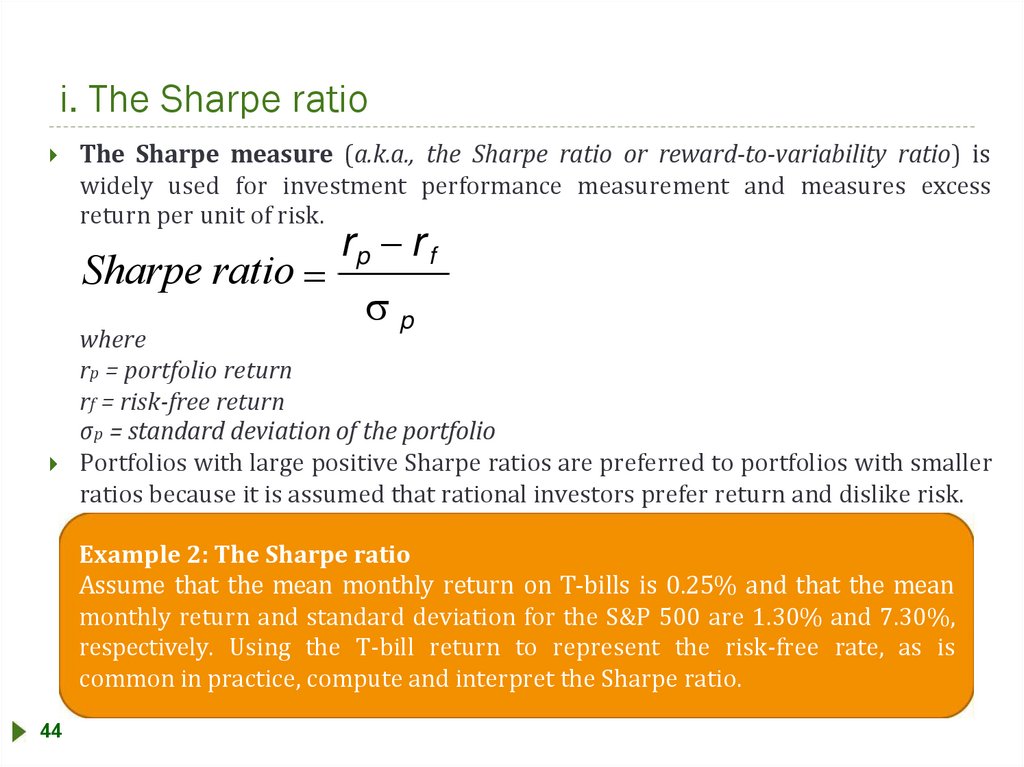
i. The Sharpe ratioThe Sharpe measure (a.k.a., the Sharpe ratio or reward-to-variability ratio) is
widely used for investment performance measurement and measures excess
return per unit of risk.
Sharpe ratio
rp r f
p
where
rp = portfolio return
rf = risk-free return
σp = standard deviation of the portfolio
Portfolios with large positive Sharpe ratios are preferred to portfolios with smaller
ratios because it is assumed that rational investors prefer return and dislike risk.
Example 2: The Sharpe ratio
Assume that the mean monthly return on T-bills is 0.25% and that the mean
monthly return and standard deviation for the S&P 500 are 1.30% and 7.30%,
respectively. Using the T-bill return to represent the risk-free rate, as is
common in practice, compute and interpret the Sharpe ratio.
44
49.
j. Skewness and the meaning of a positively or negativelyskewed return distribution
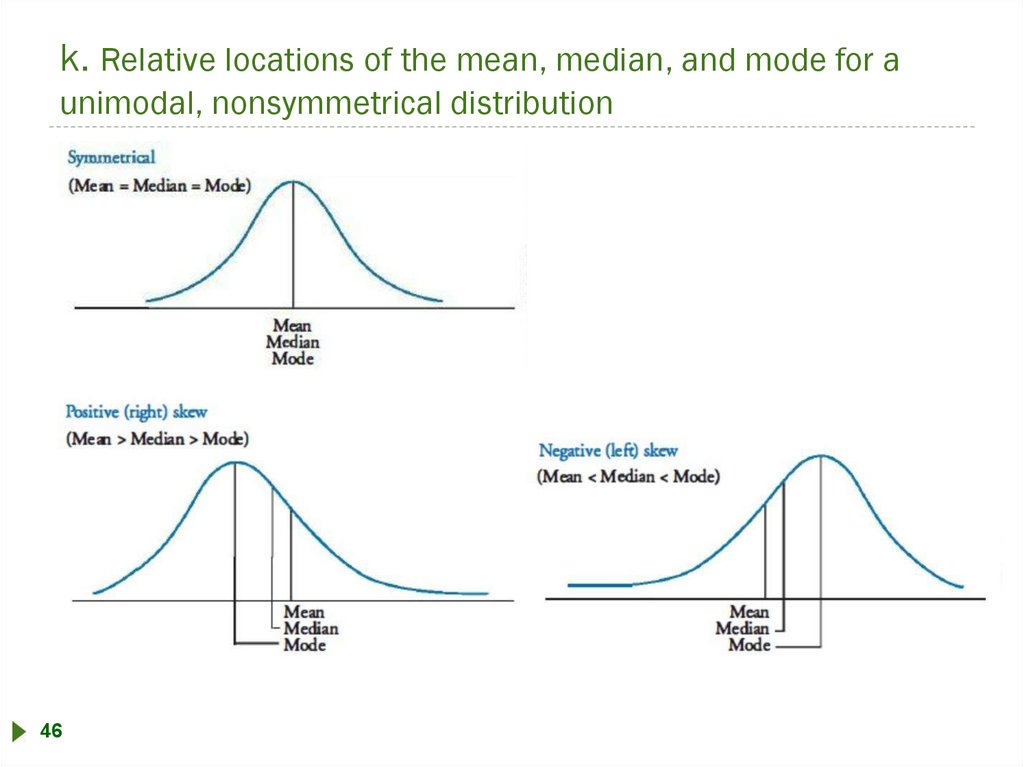
A distribution is symmetrical if it is shaped identically on
both sides of its mean.
Distributional symmetry implies that intervals of losses and
gains will exhibit the same frequency.
Skewness, or skew, refers to the extent to which a
distribution is not symmetrical.
A positively skewed distribution is characterized by many outliers in the
upper region, or right tail. A positively skewed distribution is said to be
skewed right because of its relatively long upper (right) tail.
A negatively skewed distribution has a disproportionately large amount of
outliers that fall within its lower (left) tail. A negatively skewed
distribution is said to be skewed left because of its long lower tail.
45
50.
k. Relative locations of the mean, median, and mode for aunimodal, nonsymmetrical distribution
46
51.
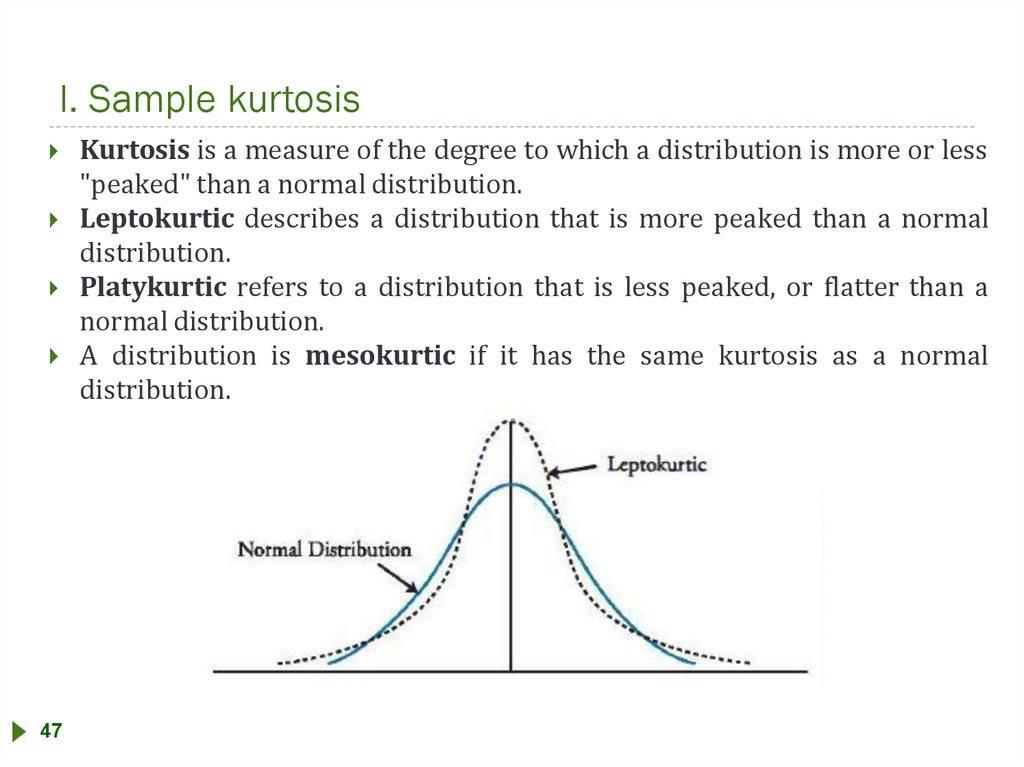
l. Sample kurtosisKurtosis is a measure of the degree to which a distribution is more or less
"peaked" than a normal distribution.
Leptokurtic describes a distribution that is more peaked than a normal
distribution.
Platykurtic refers to a distribution that is less peaked, or flatter than a
normal distribution.
A distribution is mesokurtic if it has the same kurtosis as a normal
distribution.
47
52.
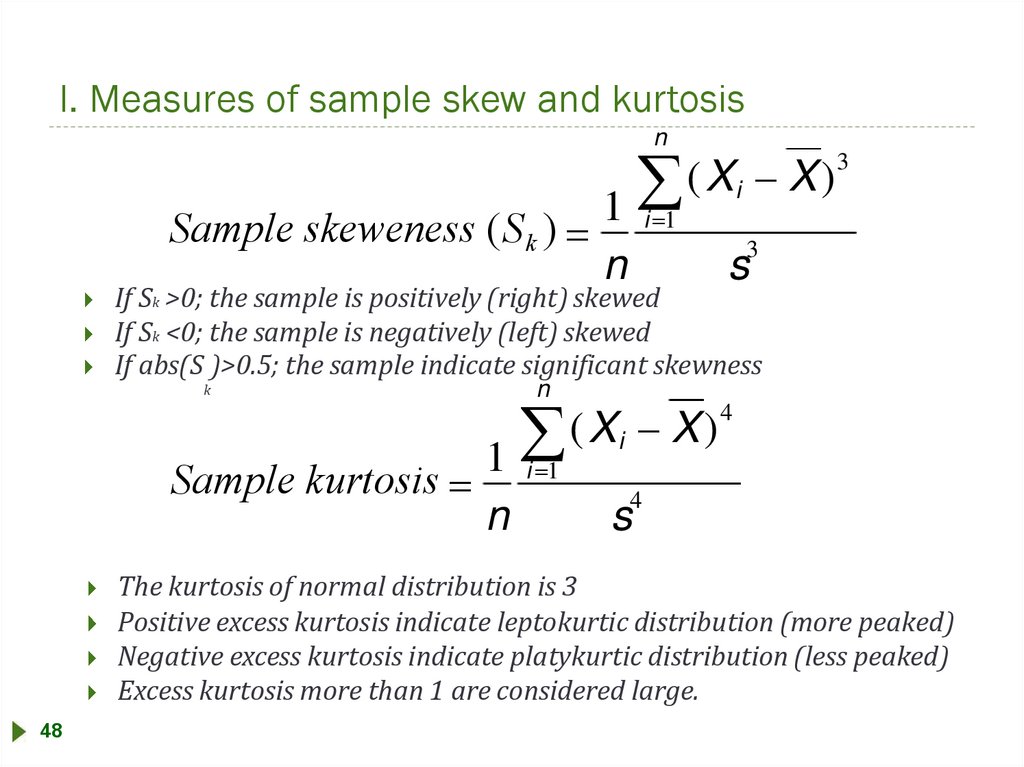
l. Measures of sample skew and kurtosisn
Sample skeweness (S k )
(X X)
1
3
i
i 1
3
n
s
If Sk >0; the sample is positively (right) skewed
If Sk <0; the sample is negatively (left) skewed
If abs(S )>0.5; the sample indicate significant skewness
k
Sample kurtosis
n
(X X)
1
i 1
n
4
i
4
s
The kurtosis of normal distribution is 3
Positive excess kurtosis indicate leptokurtic distribution (more peaked)
Negative excess kurtosis indicate platykurtic distribution (less peaked)
Excess kurtosis more than 1 are considered large.
48
53.
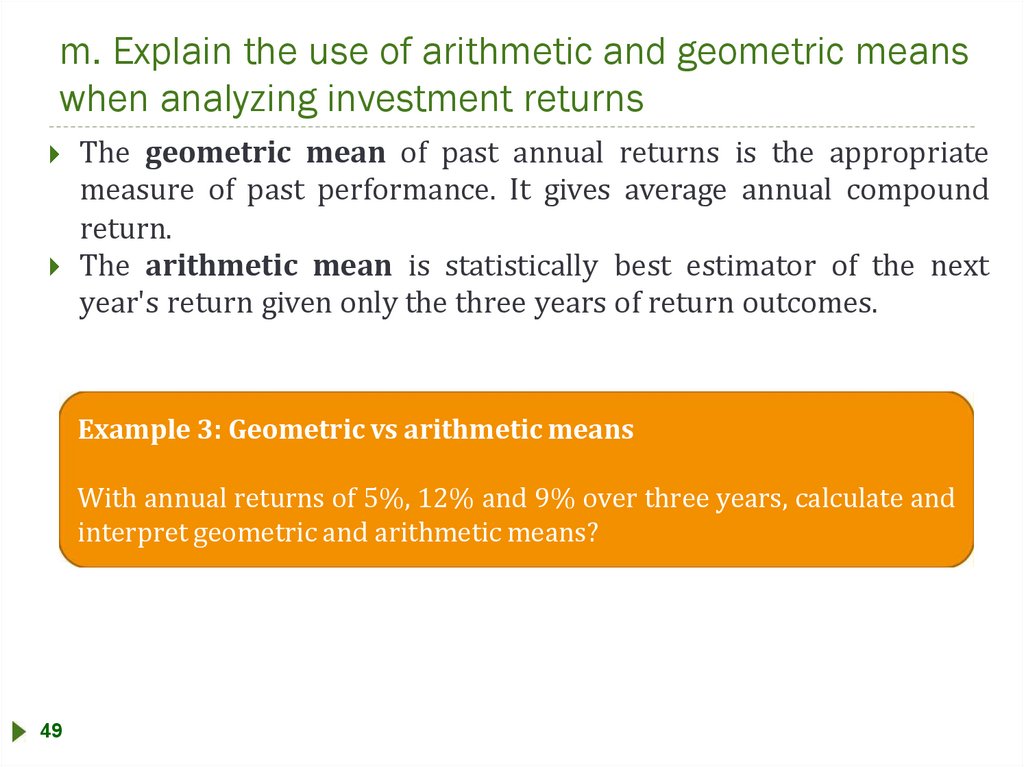
m. Explain the use of arithmetic and geometric meanswhen analyzing investment returns
The geometric mean of past annual returns is the appropriate
measure of past performance. It gives average annual compound
return.
The arithmetic mean is statistically best estimator of the next
year's return given only the three years of return outcomes.
Example 3: Geometric vs arithmetic means
With annual returns of 5%, 12% and 9% over three years, calculate and
interpret geometric and arithmetic means?
49
54.
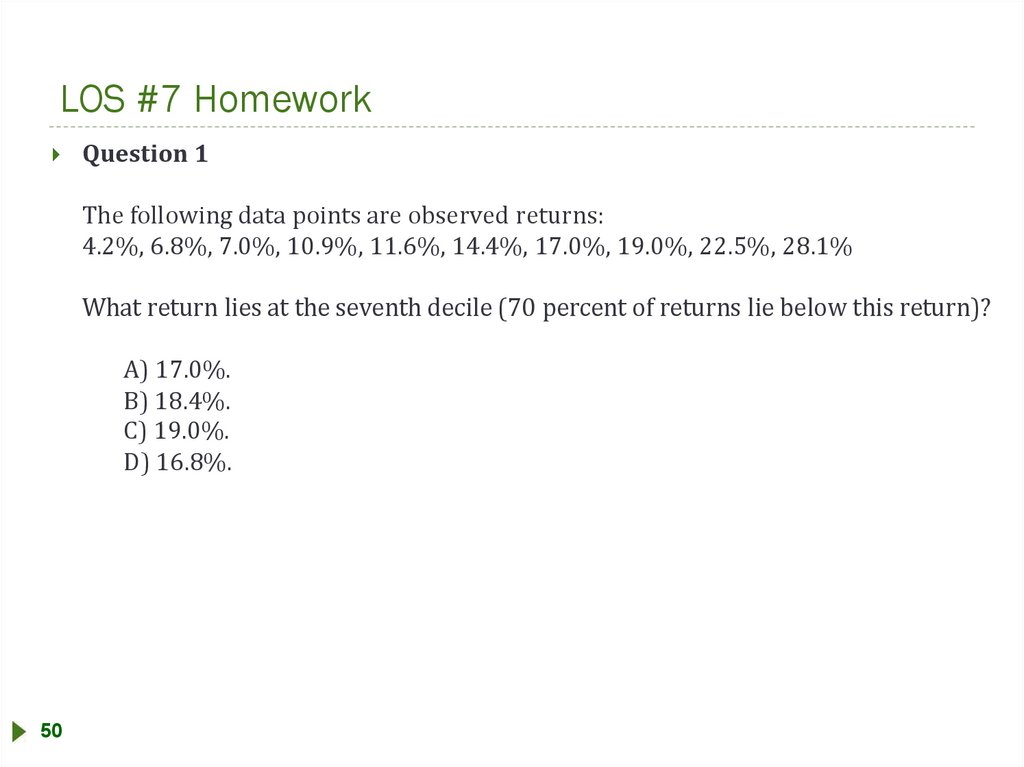
LOS #7 HomeworkQuestion 1
The following data points are observed returns:
4.2%, 6.8%, 7.0%, 10.9%, 11.6%, 14.4%, 17.0%, 19.0%, 22.5%, 28.1%
What return lies at the seventh decile (70 percent of returns lie below this return)?
A) 17.0%.
B) 18.4%.
C) 19.0%.
D) 16.8%.
50
55.
LOS #7 HomeworkQuestion 2
A sample of returns for four randomly selected positions in a
portfolio are shown below:
51
Year 1
Year 2
Year 3
Year 4
14 percent
6 percent
-5 percent
20 percent
Arithmetic Mean
A)8.90 %
B)8.75 %
C)8.90 %
D)8.75 %
Geometric Mean
8.62 %
8.34 %
8.34 %
8.62 %
56.
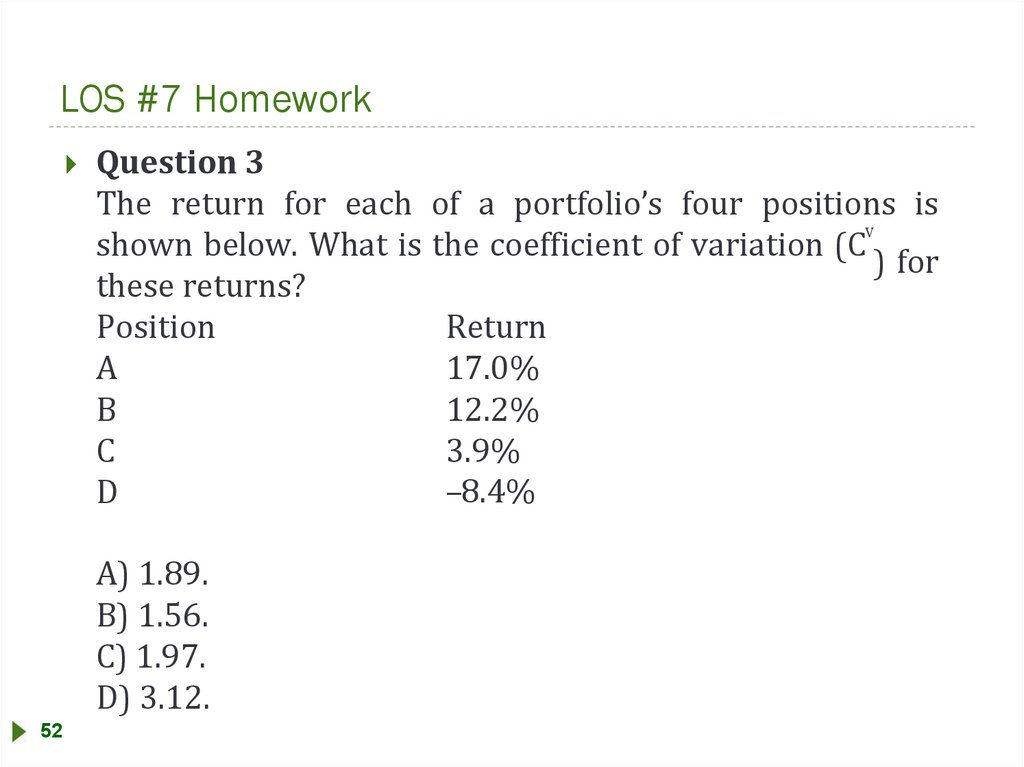
LOS #7 HomeworkQuestion 3
The return for each of a portfolio’s four positions is
V
shown below. What is the coefficient of variation (C ) for
these returns?
Position
Return
A
17.0%
B
12.2%
C
3.9%
–8.4%
D
A) 1.89.
B) 1.56.
C) 1.97.
D) 3.12.
52
57.
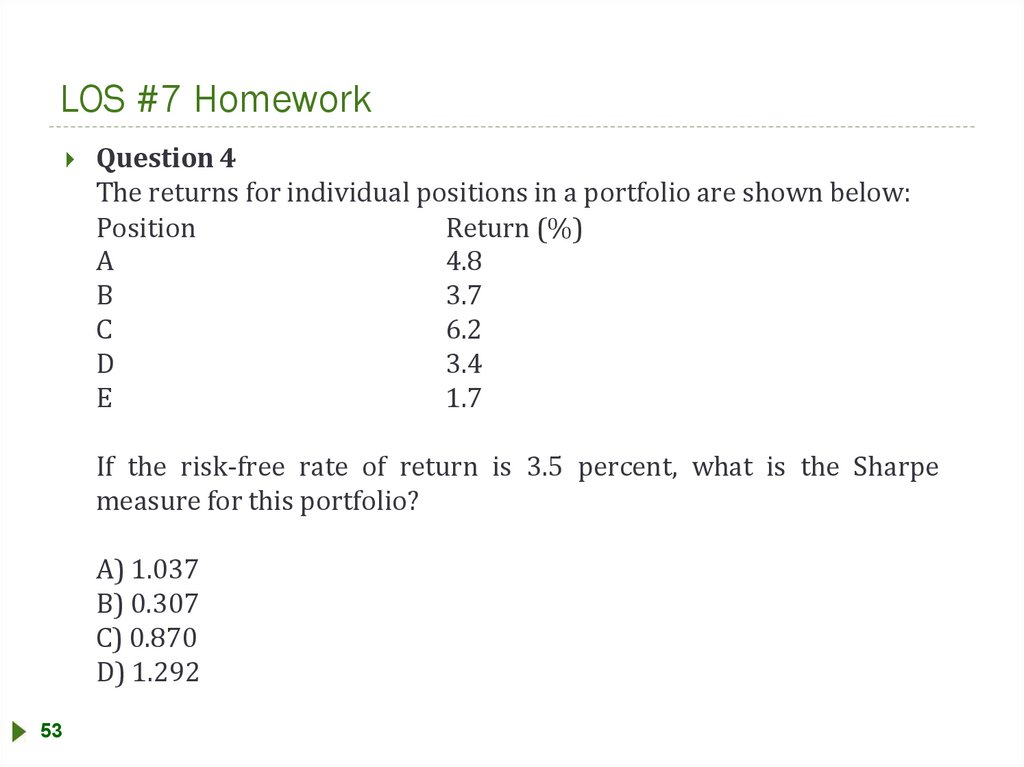
LOS #7 HomeworkQuestion 4
The returns for individual positions in a portfolio are shown below:
Position
Return (%)
A
4.8
B
3.7
C
6.2
D
3.4
E
1.7
If the risk-free rate of return is 3.5 percent, what is the Sharpe
measure for this portfolio?
A) 1.037
B) 0.307
C) 0.870
D) 1.292
53
58.
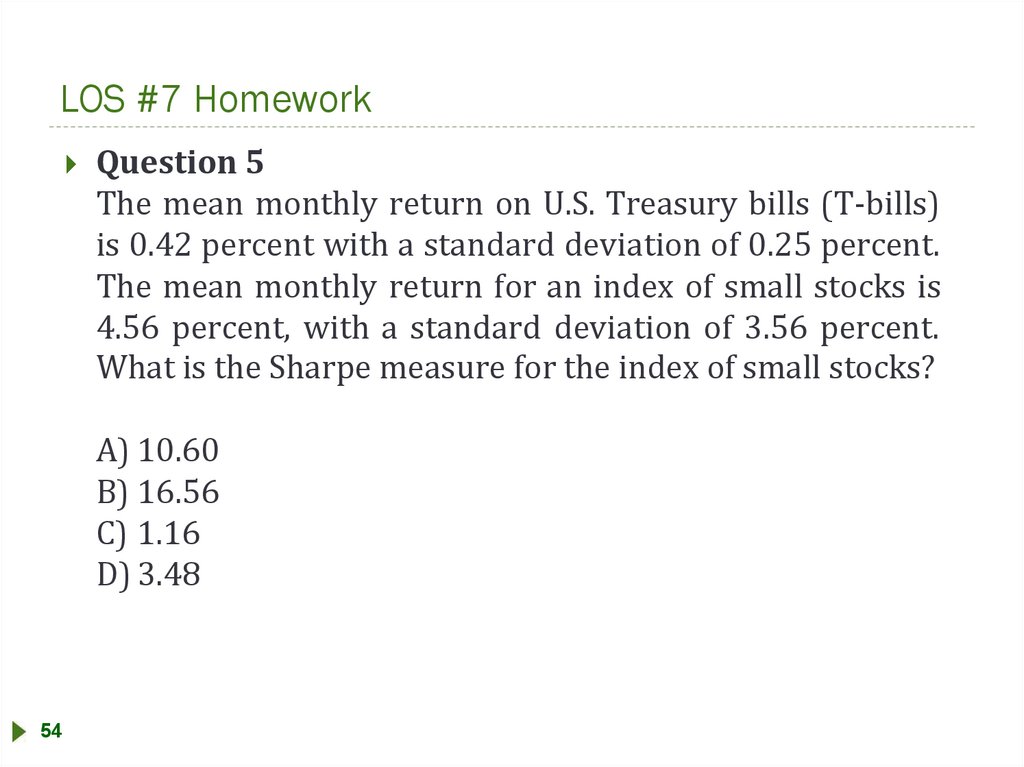
LOS #7 HomeworkQuestion 5
The mean monthly return on U.S. Treasury bills (T-bills)
is 0.42 percent with a standard deviation of 0.25 percent.
The mean monthly return for an index of small stocks is
4.56 percent, with a standard deviation of 3.56 percent.
What is the Sharpe measure for the index of small stocks?
A) 10.60
B) 16.56
C) 1.16
D) 3.48
54
59.
Probability ConceptsLOS #8
55
60.
Probability ConceptsThe candidate should be able to:
a.
define a random variable, an outcome, an event, mutually exclusive
events, and exhaustive events
b.
state the two defining properties of probability and distinguish
among empirical, subjective and a priori probabilities
c.
state the probability of an event in terms of odds
d. distinguish between unconditional and conditional probabilities
e.
explain the multiplication, addition, and total probability rules
f.
calculate and interpret 1) the joint probability of two events 2) the
probability that at least one of two events will occur, given the
probability of each and the joint probability of the two events, and 3)
a joint probability of any number of independent events
g.
distinguish between dependent and independent events
h.
calculate and interpret an unconditional probability using the total
probability rule
56
61.
Probability ConceptsThe candidate should be able to:
i.
explain the use of conditional expectation in investment
applications
j.
explain the use of a tree diagram to represent an investment
problem
k.
calculate and interpret covariance and correlation
l.
calculate and interpret the expected value, variance, and standard
deviation of a random variable and of returns on a portfolio
m.
calculate and interpret covariance given a joint probability function
n.
calculate and interpret an updated probability using Bayes' formula
o.
identify the most appropriate method to solve a particular counting
problem, and solve counting problems using factorial, combination,
and permutation concepts
57
62.
a. Random variable, an outcome, an event, mutuallyexclusive events, and exhaustive events
A random variable is an uncertain quantity/number.
An outcome is an observed value of a random variable.
An event is a single outcome or a set of outcomes.
Mutually exclusive events are events that cannot both
happen at the same time.
Exhaustive events are those that include all possible
outcomes.
58
63.
b. Properties of probabilityThere are two defining properties of probability:
The probability of occurrence of any event is between 0 and 1;
If a set of events is mutually exclusive and exhaustive, the probabilities
of those events sum to 1.
An empirical probability is established by analyzing past
data.
An a priori probability is determined using a formal
reasoning and inspection process.
Empirical and a priori probabilities are objective
probabilities.
A subjective probability involves the use of personal
judgment.
59
64.
c. Probability of an event in terms of odds.Stating the odds that an event will or will not occur is an
alternative way of expressing probabilities.
Consider an event that has a probability of occurrence of
0.125, which is one-eighth.
The odds that the event will occur are 0.125/(10.125)=1/7 which we state "the odds for the event
occurring are one-to-seven”.
60
65.
d. Unconditional and conditional probabilitiesUnconditional probability (a.k.a. marginal probability)
refers to the probability of an event regardless of the past
or future occurrence of other events.
A conditional probability is one where the occurrence of
one event affects the probability of the occurrence of
another event.
Example: we might be concerned with the probability of a recession
given that the monetary authority increases interest rates. The key word
to watch for here is "given.“
Using probability notation "the probability of A given the
occurrence of B“ is expressed as P(A|B), where the vertical
bar ( | ) indicates "given”.
61
66.
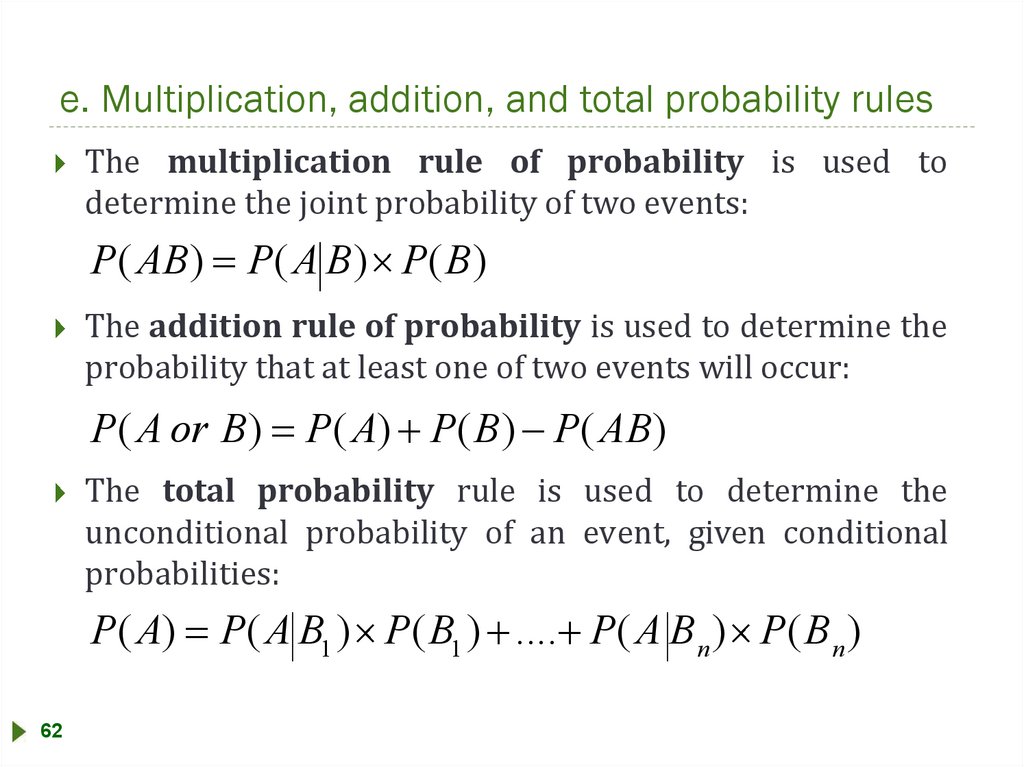
e. Multiplication, addition, and total probability rulesThe multiplication rule of probability is used to
determine the joint probability of two events:
P( AB)
P( A B) P(B)
The addition rule of probability is used to determine the
probability that at least one of two events will occur:
P( A or B)
P( A) P(B) P( AB)
The total probability rule is used to determine the
unconditional probability of an event, given conditional
probabilities:
P( A)
62
P( A B1 ) P(B1 ) .... P( A B n) P(B n )
67.
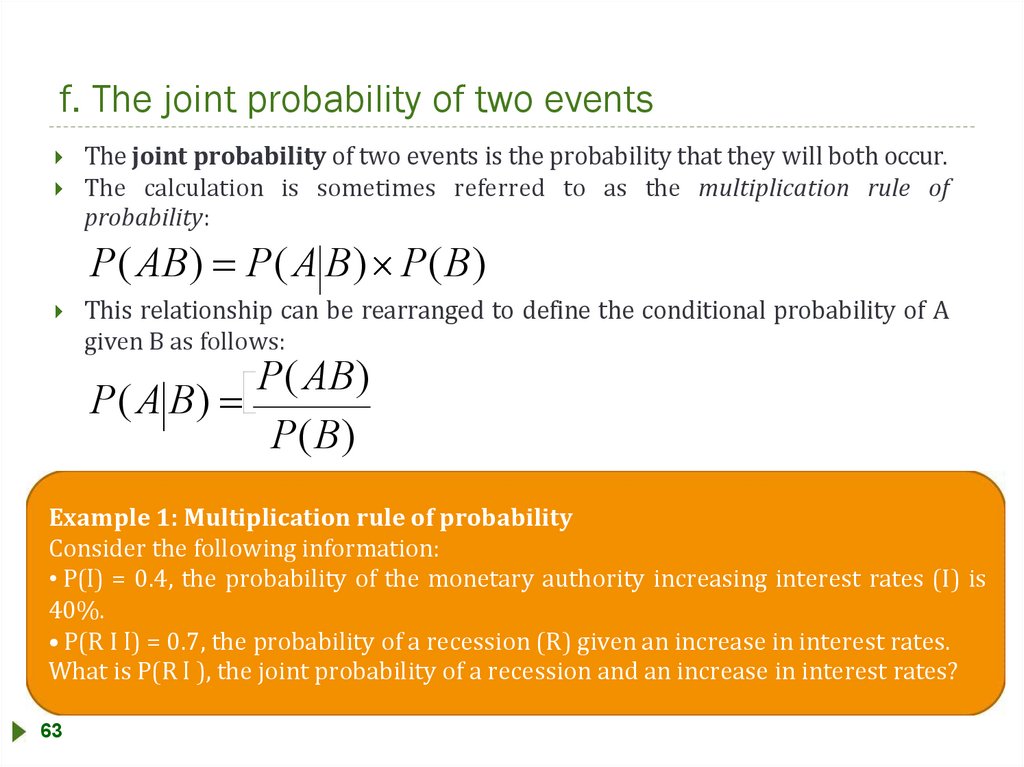
f. The joint probability of two eventsThe joint probability of two events is the probability that they will both occur.
The calculation is sometimes referred to as the multiplication rule of
probability:
P( AB)
P( A B) P(B)
This relationship can be rearranged to define the conditional probability of A
given B as follows:
P( A B)
P( AB)
P(B)
Example 1: Multiplication rule of probability
Consider the following information:
• P(ӏ) = 0.4, the probability of the monetary authority increasing interest rates (I) is
40%.
• P(R I ӏ) = 0.7, the probability of a recession (R) given an increase in interest rates.
What is P(R ӏ ), the joint probability of a recession and an increase in interest rates?
63
68.
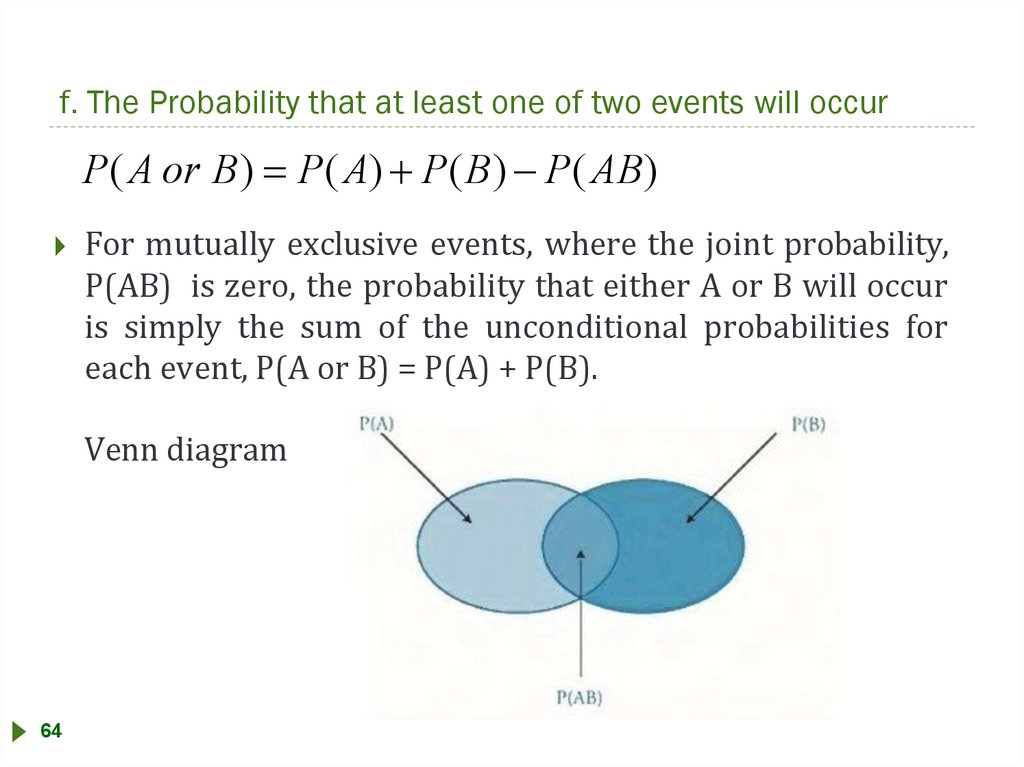
f. The Probability that at least one of two events will occurP( A or B)
P( A) P(B) P( AB)
For mutually exclusive events, where the joint probability,
P(AB) is zero, the probability that either A or B will occur
is simply the sum of the unconditional probabilities for
each event, P(A or B) = P(A) + P(B).
Venn diagram
64
69.
f. The Probability that at least one of two events will occurExample 2: Addition rule of probability
Using the information in our previous interest rate and recession
example and the fact that the unconditional probability of a recession,
P(R) is 34%, determine the probability that either interest rates will
increase or a recession will occur.
When dealing with independent events, the word and indicates
multiplication, and the word or indicates addition.
Example 3: Joint probability for more than two independent events
Using empirical probabilities, suppose we observe that me DJIA has closed
higher on two-thirds of all days in the past few decades. Furthermore, it has
been determined that up and down days are independent. Based on this
information, compute the probability of the DJIA closing higher for five
consequent years.
65
70.
g. Dependent and independent eventsIndependent events refer to events for which the
occurrence of one has no influence on the occurrence of
the others.
Events A and B are independent if and only if:
P( A B)
P( A)
If this condition is not satisfied, the events are dependent.
66
71.
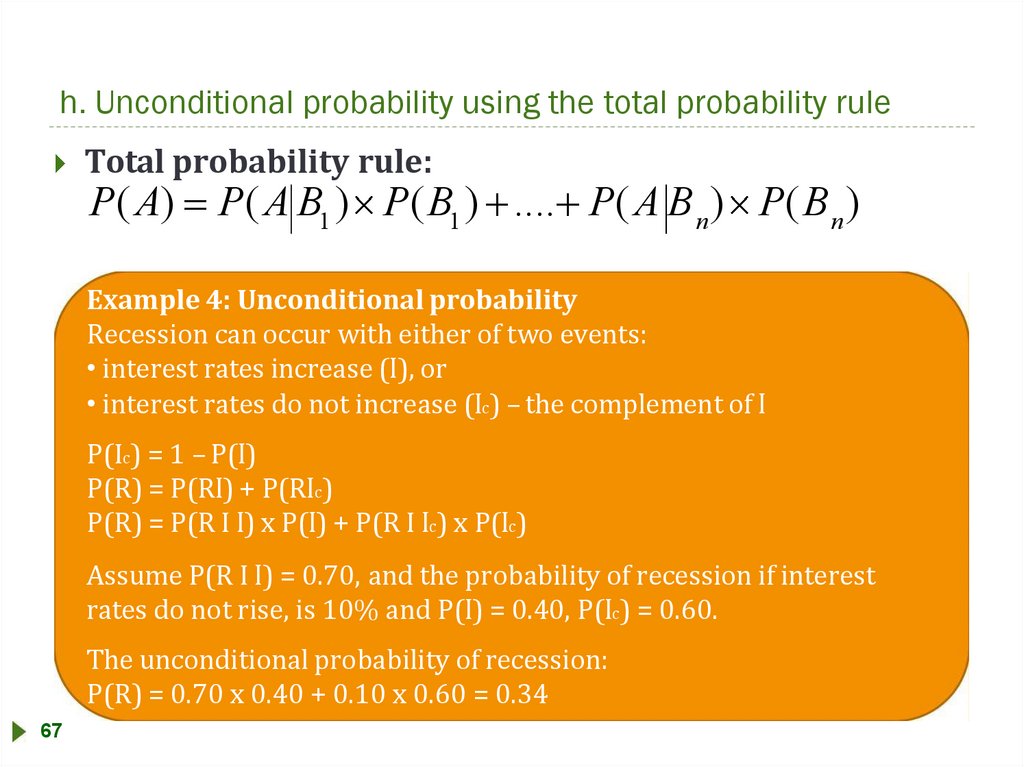
h. Unconditional probability using the total probability ruleTotal probability rule:
P( A)
P( A B1 ) P(B1 ) .... P( A B n) P(B n )
Example 4: Unconditional probability
Recession can occur with either of two events:
• interest rates increase (ӏ), or
• interest rates do not increase (ӏc) – the complement of ӏ
P(Ic) = 1 – P(ӏ)
P(R) = P(Rӏ) + P(Rӏc)
P(R) = P(R I ӏ) x P(ӏ) + P(R I ӏc) x P(ӏc)
Assume P(R I ӏ) = 0.70, and the probability of recession if interest
rates do not rise, is 10% and P(ӏ) = 0.40, P(ӏc) = 0.60.
The unconditional probability of recession:
P(R) = 0.70 x 0.40 + 0.10 x 0.60 = 0.34
67
72.
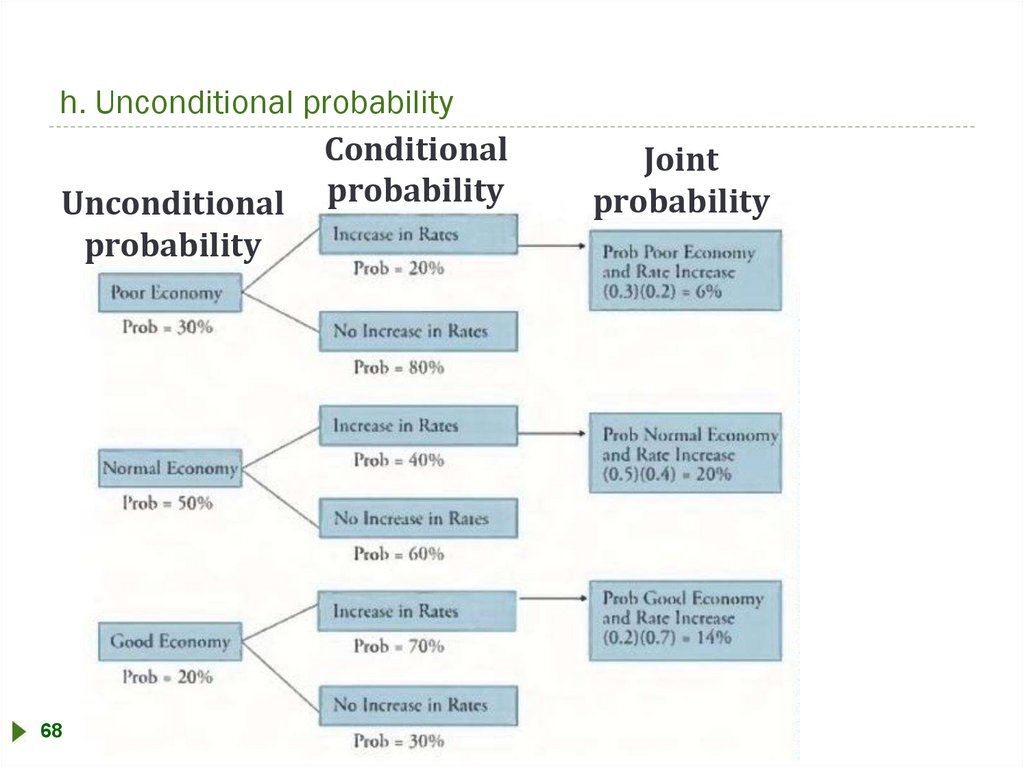
h. Unconditional probabilityConditional
Unconditional probability
probability
68
Joint
probability
73.
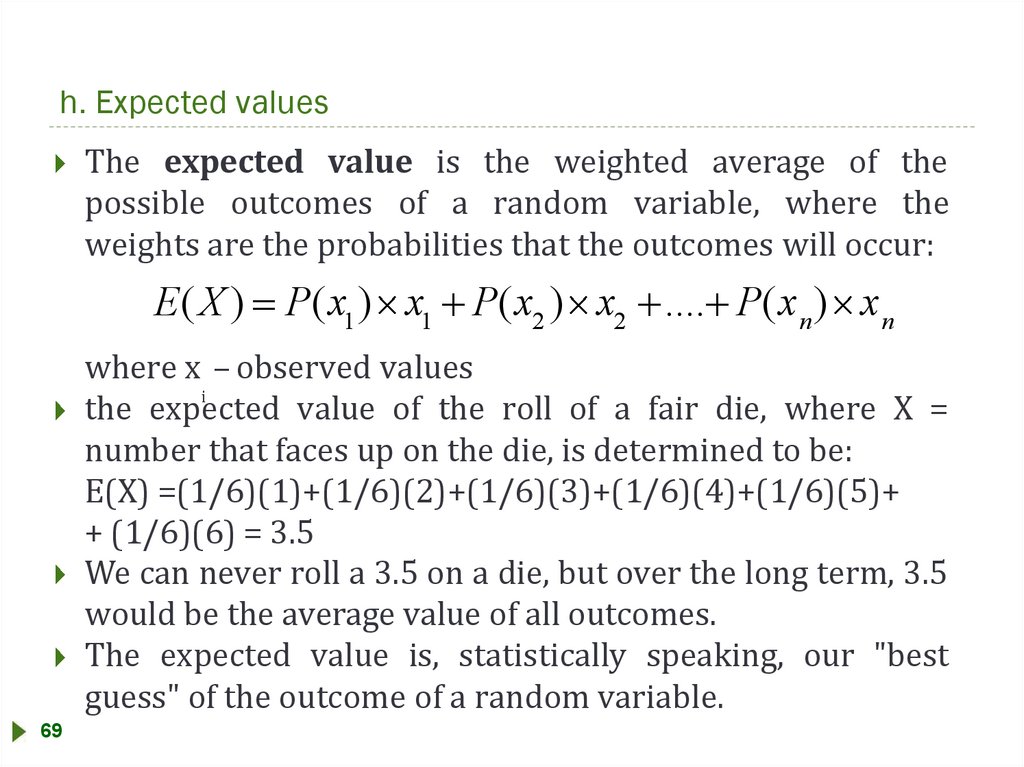
h. Expected valuesThe expected value is the weighted average of the
possible outcomes of a random variable, where the
weights are the probabilities that the outcomes will occur:
E(X ) P(x1 ) x1 P(x2 ) x2 .... P(x n ) x n
where x – observed values
i
the expected value of the roll of a fair die, where X =
number that faces up on the die, is determined to be:
E(X) =(1/6)(1)+(1/6)(2)+(1/6)(3)+(1/6)(4)+(1/6)(5)+
+ (1/6)(6) = 3.5
We can never roll a 3.5 on a die, but over the long term, 3.5
would be the average value of all outcomes.
The expected value is, statistically speaking, our "best
guess" of the outcome of a random variable.
69
74.
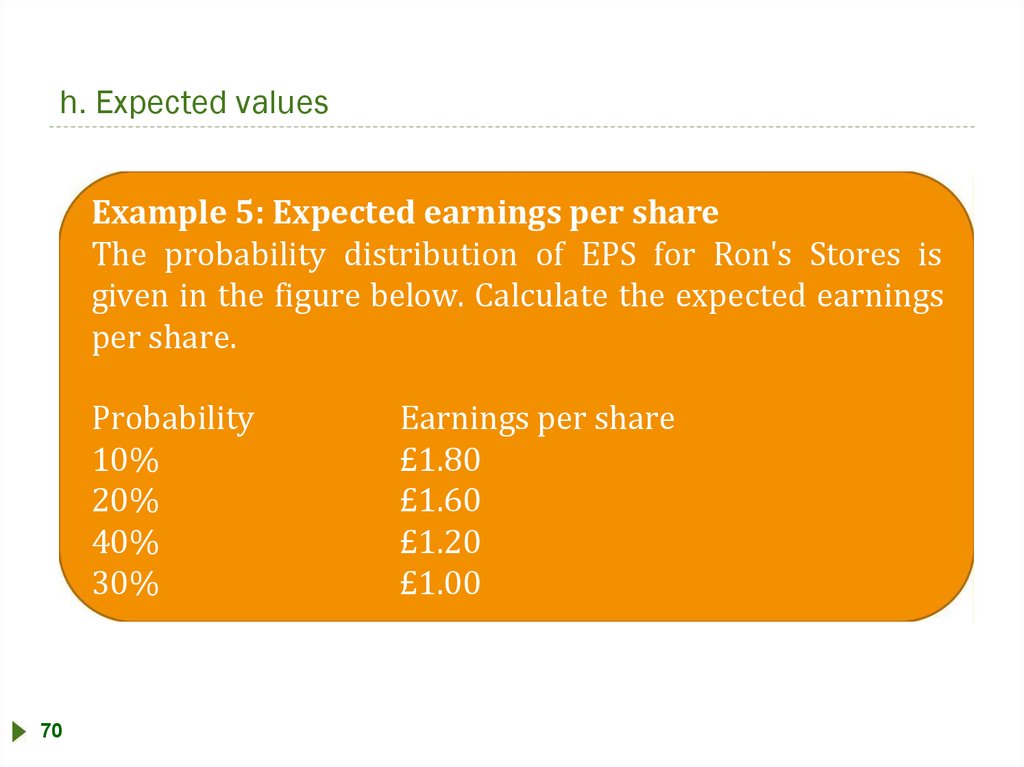
h. Expected valuesExample 5: Expected earnings per share
The probability distribution of EPS for Ron's Stores is
given in the figure below. Calculate the expected earnings
per share.
Probability
10%
20%
40%
30%
70
Earnings per share
£1.80
£1.60
£1.20
£1.00
75.
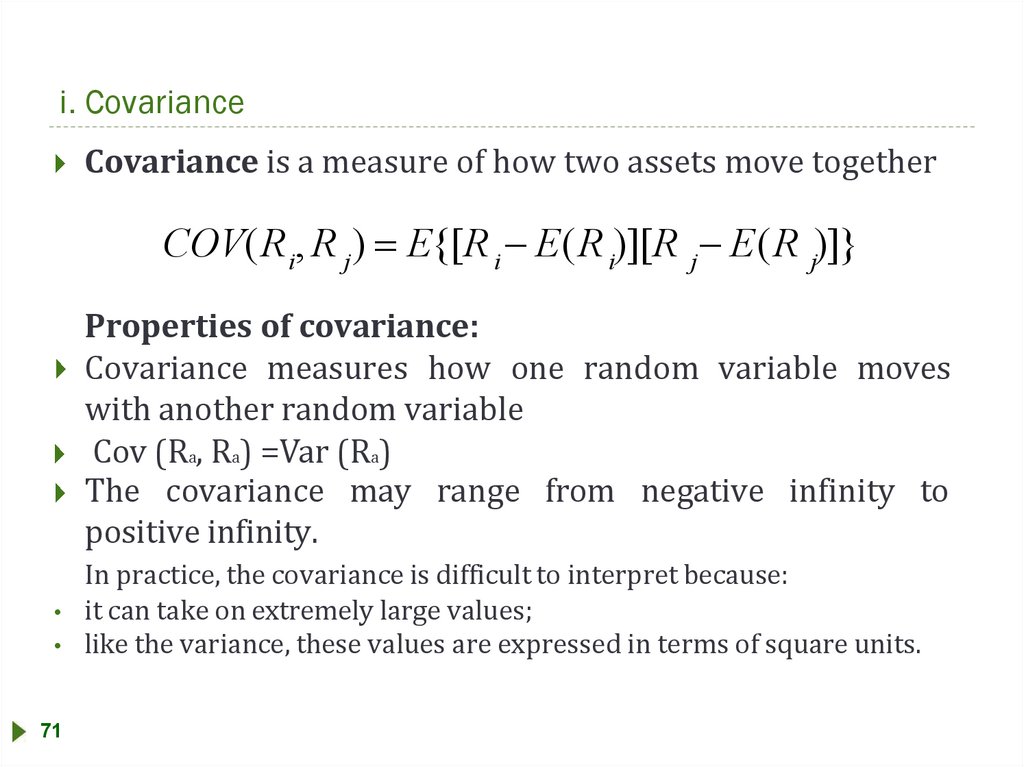
i. CovarianceCovariance is a measure of how two assets move together
COV(R i, R j)
E{[R i E(R i)][R j E(R j)]}
Properties of covariance:
Covariance measures how one random variable moves
with another random variable
Cov (Ra, Ra) =Var (Ra)
The covariance may range from negative infinity to
positive infinity.
71
In practice, the covariance is difficult to interpret because:
it can take on extremely large values;
like the variance, these values are expressed in terms of square units.
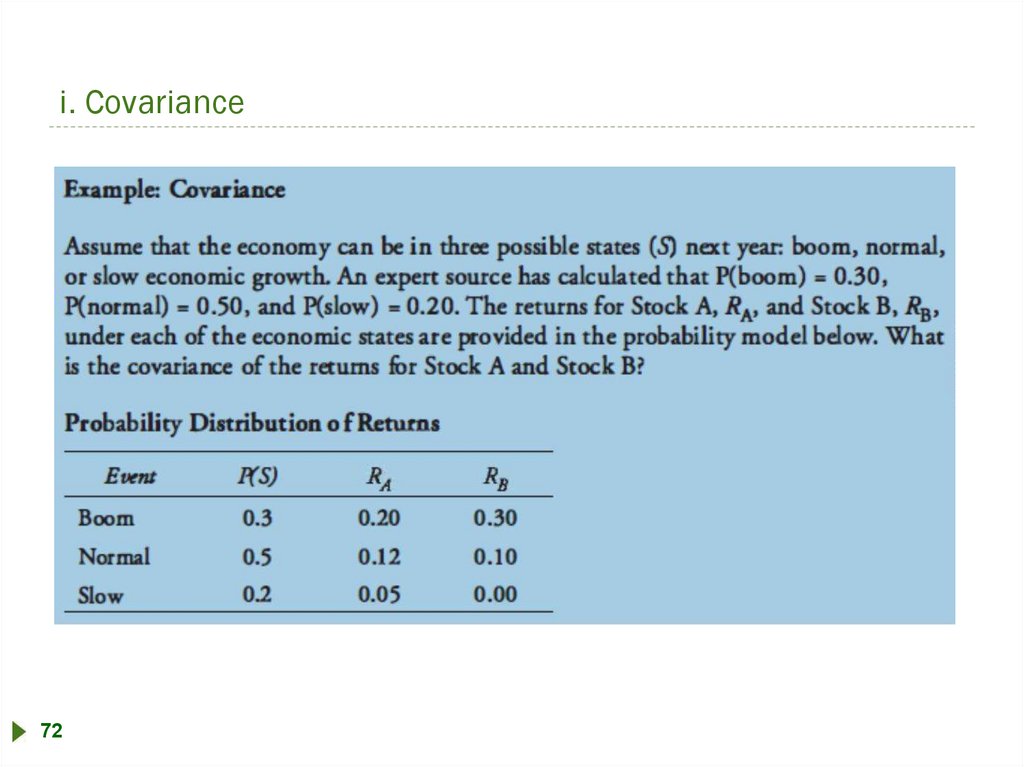
76.
i. Covariance72
77.
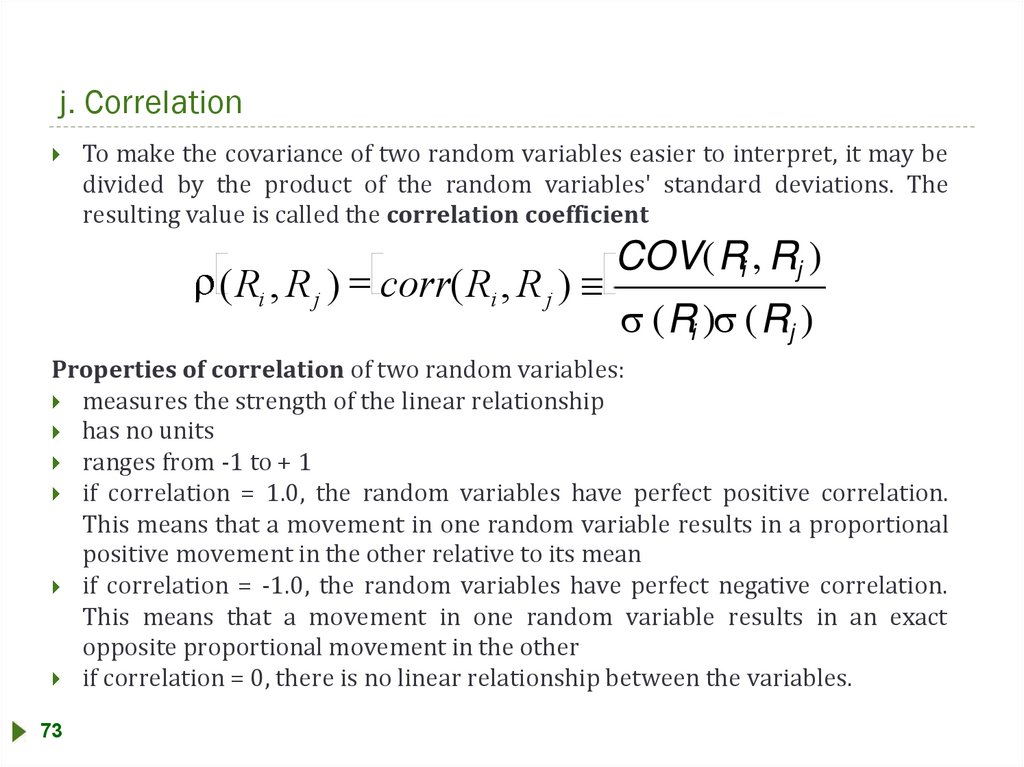
j. CorrelationTo make the covariance of two random variables easier to interpret, it may be
divided by the product of the random variables' standard deviations. The
resulting value is called the correlation coefficient
(Ri , R j ) corr(Ri , R j )
COV( Ri , Rj )
( Ri ) ( Rj )
Properties of correlation of two random variables:
measures the strength of the linear relationship
has no units
ranges from -1 to + 1
if correlation = 1.0, the random variables have perfect positive correlation.
This means that a movement in one random variable results in a proportional
positive movement in the other relative to its mean
if correlation = -1.0, the random variables have perfect negative correlation.
This means that a movement in one random variable results in an exact
opposite proportional movement in the other
if correlation = 0, there is no linear relationship between the variables.
73
78.
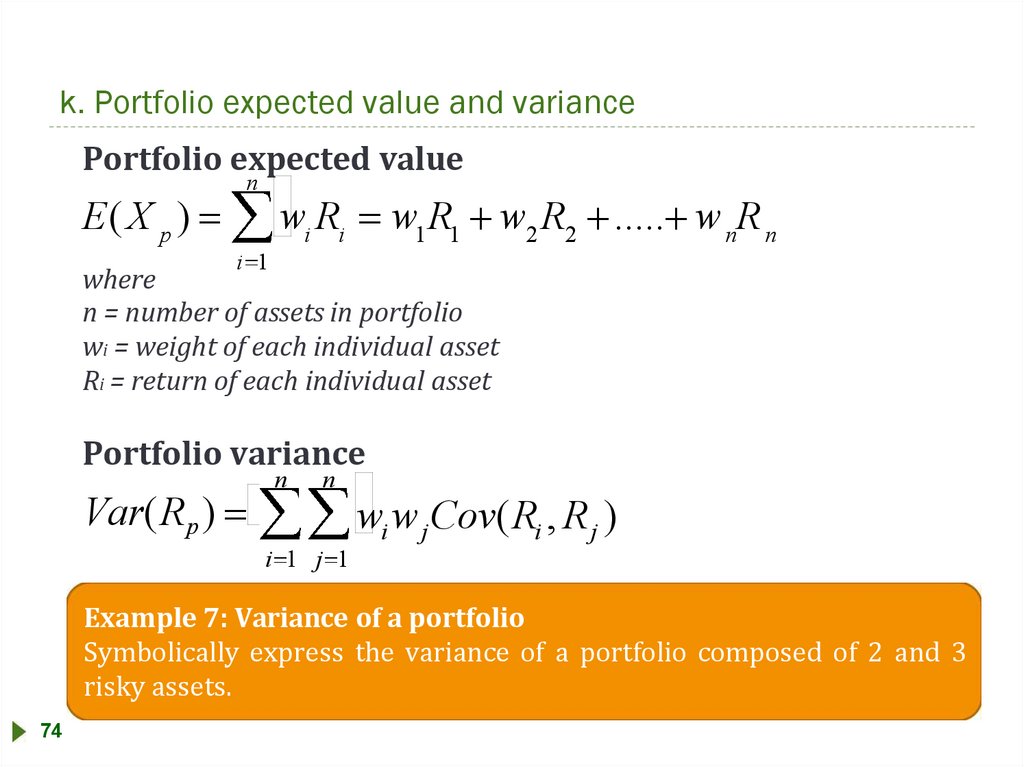
k. Portfolio expected value and variancePortfolio expected value
E(X p )
n
wi Ri
w1 R1 w2 R2 ..... w nR n
i 1
where
n = number of assets in portfolio
wi = weight of each individual asset
Ri = return of each individual asset
Portfolio variance
Var(R p )
n
n
wi w j Cov(Ri , R j )
i 1 j 1
Example 7: Variance of a portfolio
Symbolically express the variance of a portfolio composed of 2 and 3
risky assets.
74
79.
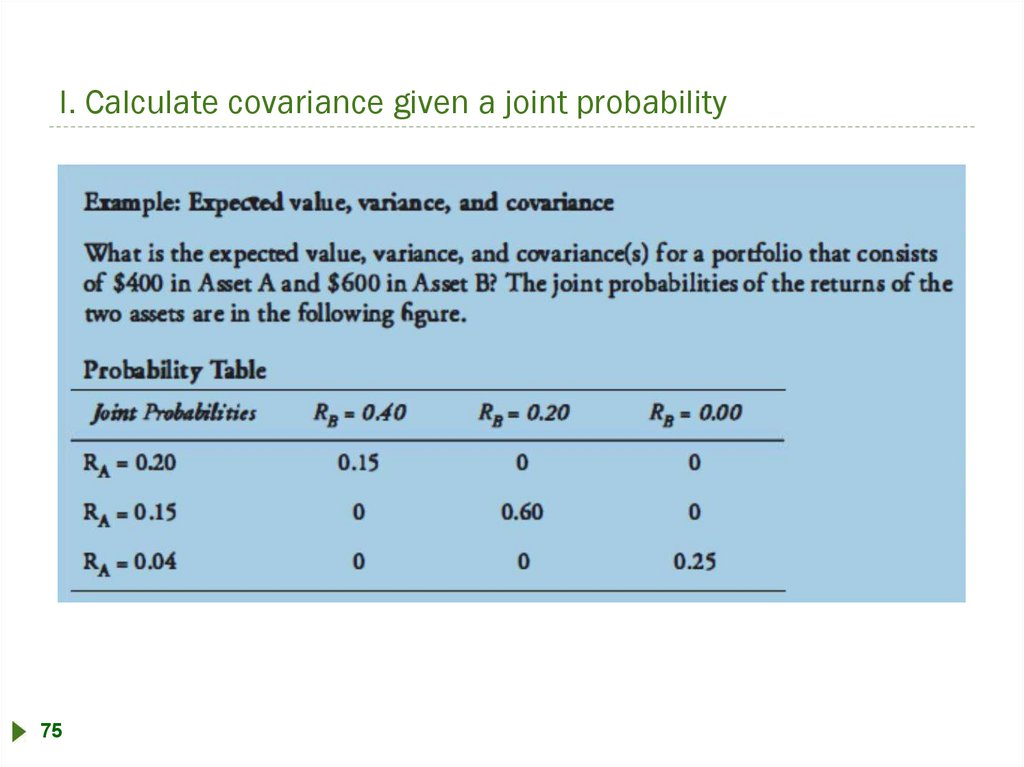
l. Calculate covariance given a joint probability75
80.
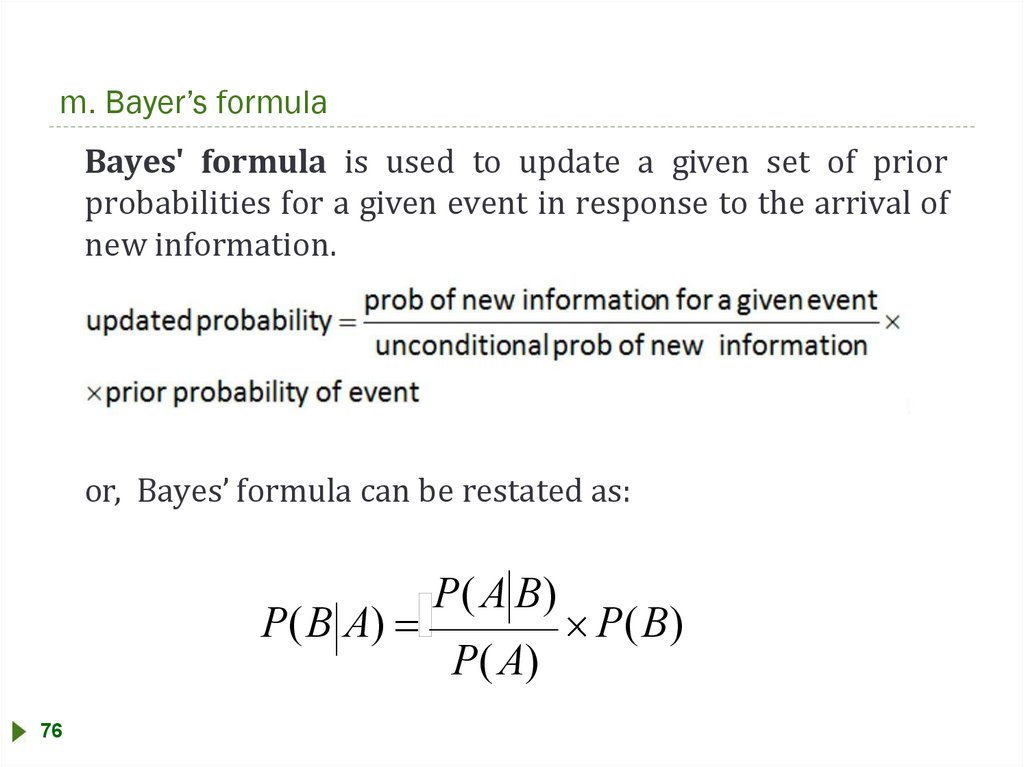
m. Bayer’s formulaBayes' formula is used to update a given set of prior
probabilities for a given event in response to the arrival of
new information.
or, Bayes’ formula can be restated as:
P(B A)
76
P(A B)
P(A)
P(B)
81.
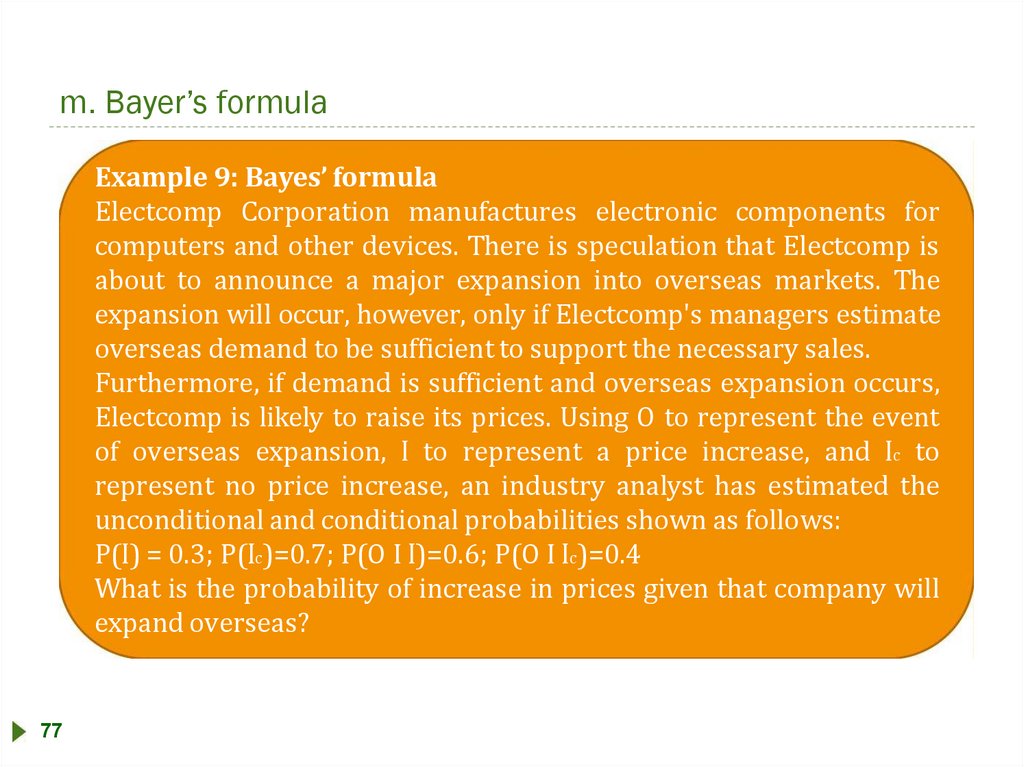
m. Bayer’s formulaExample 9: Bayes’ formula
Electcomp Corporation manufactures electronic components for
computers and other devices. There is speculation that Electcomp is
about to announce a major expansion into overseas markets. The
expansion will occur, however, only if Electcomp's managers estimate
overseas demand to be sufficient to support the necessary sales.
Furthermore, if demand is sufficient and overseas expansion occurs,
Electcomp is likely to raise its prices. Using O to represent the event
of overseas expansion, ӏ to represent a price increase, and ӏc to
represent no price increase, an industry analyst has estimated the
unconditional and conditional probabilities shown as follows:
P(ӏ) = 0.3; P(ӏc)=0.7; P(O I ӏ)=0.6; P(O I ӏc)=0.4
What is the probability of increase in prices given that company will
expand overseas?
77
82.
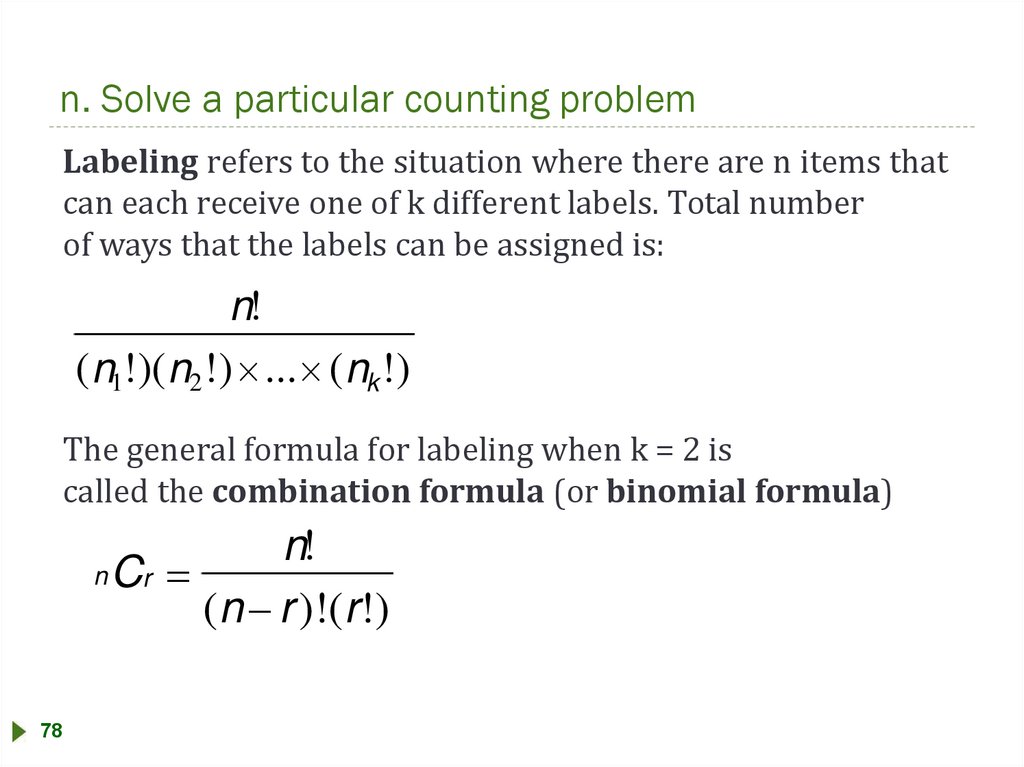
n. Solve a particular counting problemLabeling refers to the situation where there are n items that
can each receive one of k different labels. Total number
of ways that the labels can be assigned is:
n!
( n1!)( n2 !) ... ( nk !)
The general formula for labeling when k = 2 is
called the combination formula (or binomial formula)
n!
n Cr
(n r )!(r !)
78
83.
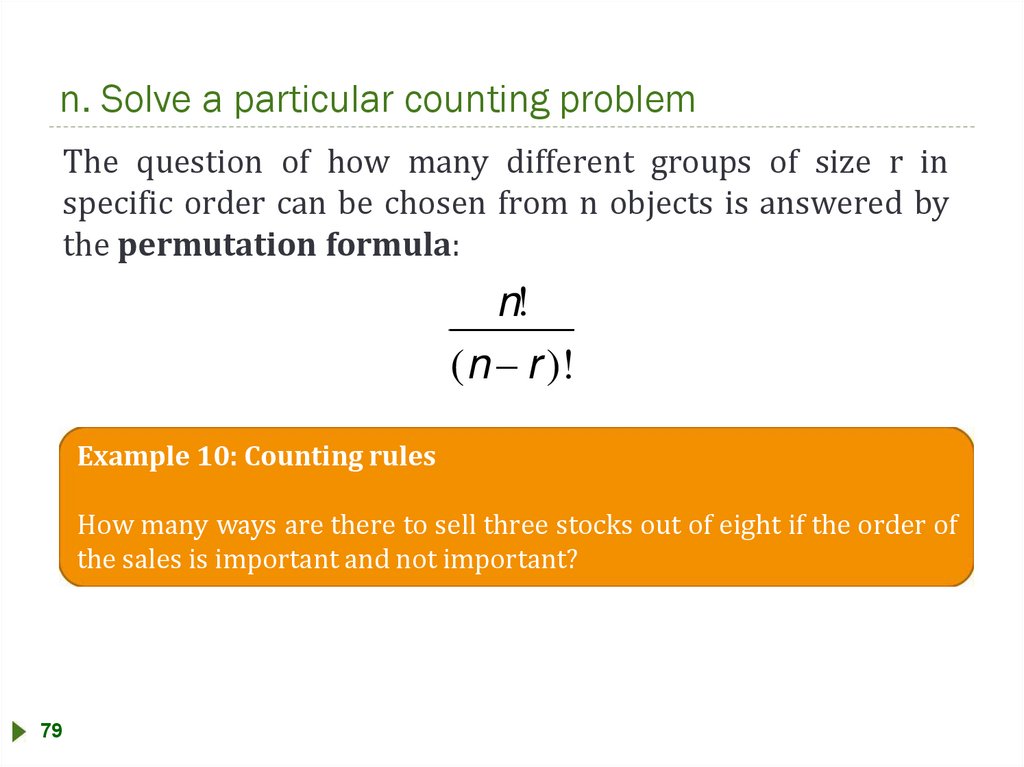
n. Solve a particular counting problemThe question of how many different groups of size r in
specific order can be chosen from n objects is answered by
the permutation formula:
n!
( n r )!
Example 10: Counting rules
How many ways are there to sell three stocks out of eight if the order of
the sales is important and not important?
79
84.
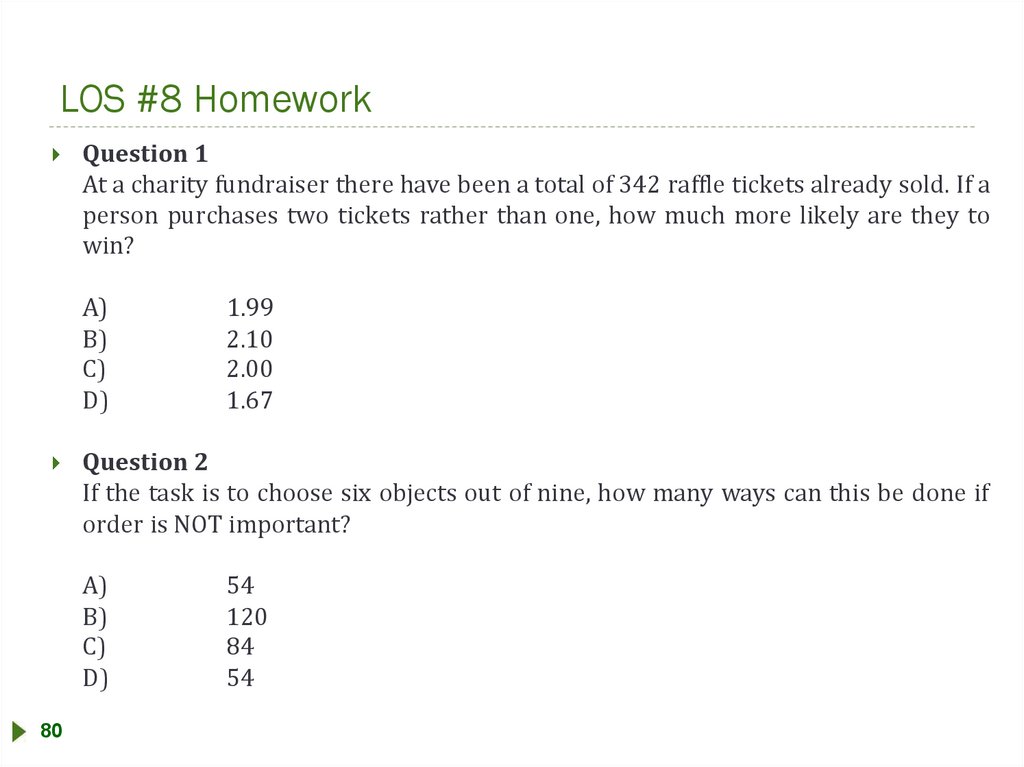
LOS #8 HomeworkQuestion 1
At a charity fundraiser there have been a total of 342 raffle tickets already sold. If a
person purchases two tickets rather than one, how much more likely are they to
win?
A)
B)
C)
D)
1.99
2.10
2.00
1.67
Question 2
If the task is to choose six objects out of nine, how many ways can this be done if
order is NOT important?
A)
B)
C)
D)
80
54
120
84
54
85.
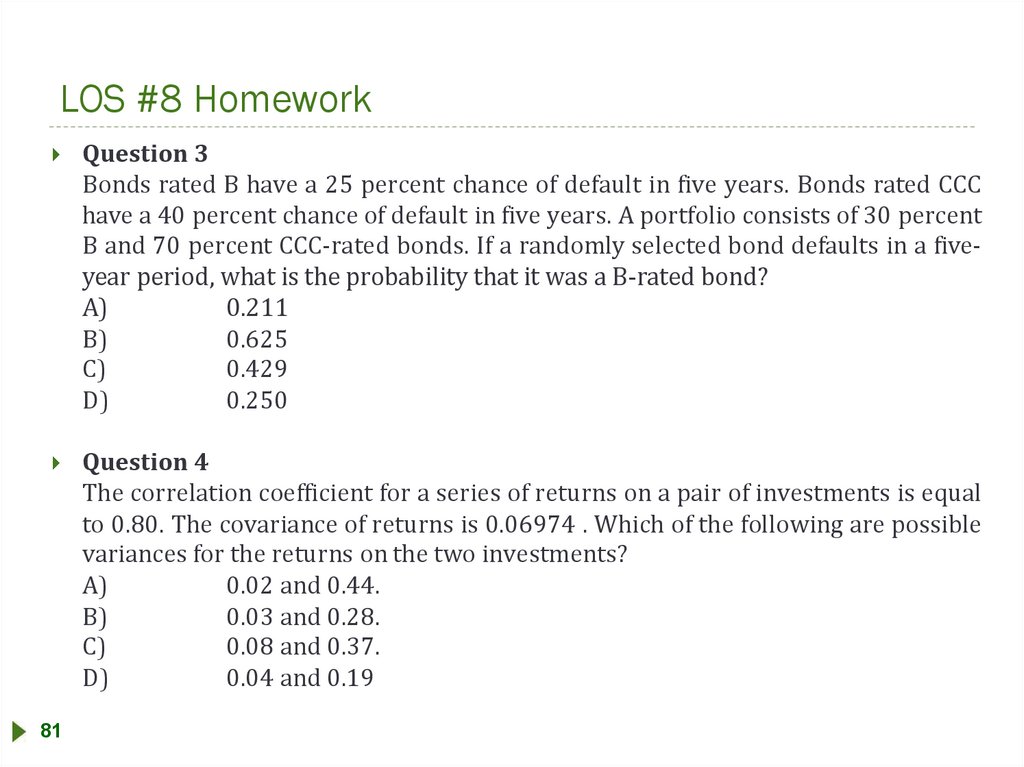
LOS #8 HomeworkQuestion 3
Bonds rated B have a 25 percent chance of default in five years. Bonds rated CCC
have a 40 percent chance of default in five years. A portfolio consists of 30 percent
B and 70 percent CCC-rated bonds. If a randomly selected bond defaults in a fiveyear period, what is the probability that it was a B-rated bond?
A)
0.211
B)
0.625
C)
0.429
D)
0.250
Question 4
The correlation coefficient for a series of returns on a pair of investments is equal
to 0.80. The covariance of returns is 0.06974 . Which of the following are possible
variances for the returns on the two investments?
A)
0.02 and 0.44.
B)
0.03 and 0.28.
C)
0.08 and 0.37.
D)
0.04 and 0.19
81
86.
LOS #8 HomeworkQuestion 5
For assets A and B we know the following: E(Ra)=0.10, E(Ra)=0.20, V(Ra)=0.25,
V(Ra)=0.36 and the correlation of the returns is 0.6. What is the variance of the
return of a portfolio that is equally invested in the two assets?
A) 0.3050.
B) 0.1500.
C) 0.2425.
D) 0.2275.
Question 6
The probability of A is 0.4. The probability of Ac is 0.6. The probability of (B|A) is
0.5, and the probability of (B|Ac) is 0.2. Using Bayes’ formula, what is the
probability of (A|B)?
82
A) 0.875
B) 0.125
C) 0.625
D) 0.375
87.
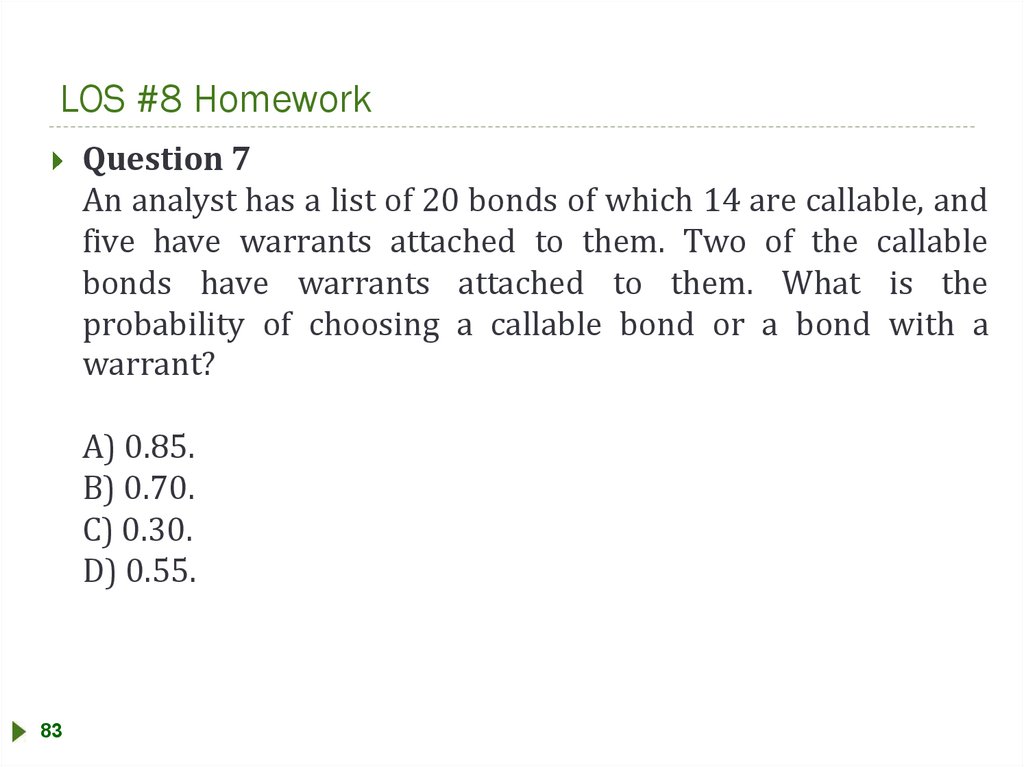
LOS #8 HomeworkQuestion 7
An analyst has a list of 20 bonds of which 14 are callable, and
five have warrants attached to them. Two of the callable
bonds have warrants attached to them. What is the
probability of choosing a callable bond or a bond with a
warrant?
A) 0.85.
B) 0.70.
C) 0.30.
D) 0.55.
83
88.
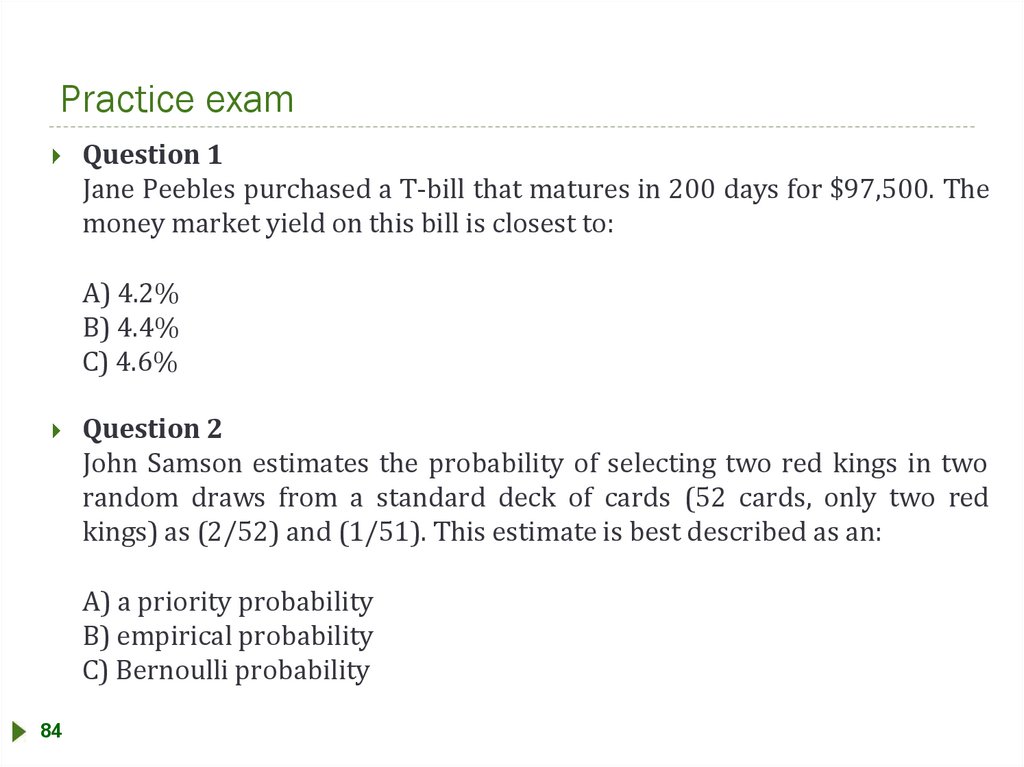
Practice examQuestion 1
Jane Peebles purchased a T-bill that matures in 200 days for $97,500. The
money market yield on this bill is closest to:
A) 4.2%
B) 4.4%
C) 4.6%
Question 2
John Samson estimates the probability of selecting two red kings in two
random draws from a standard deck of cards (52 cards, only two red
kings) as (2/52) and (1/51). This estimate is best described as an:
A) a priority probability
B) empirical probability
C) Bernoulli probability
84
89.
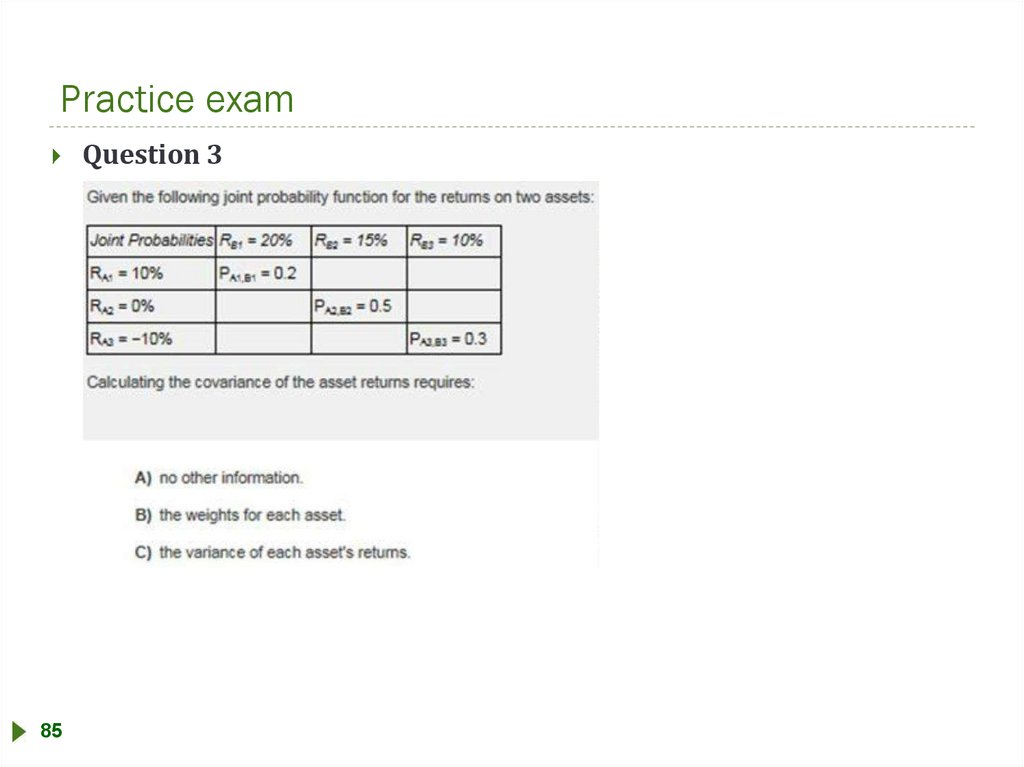
Practice examQuestion 3
85
90.
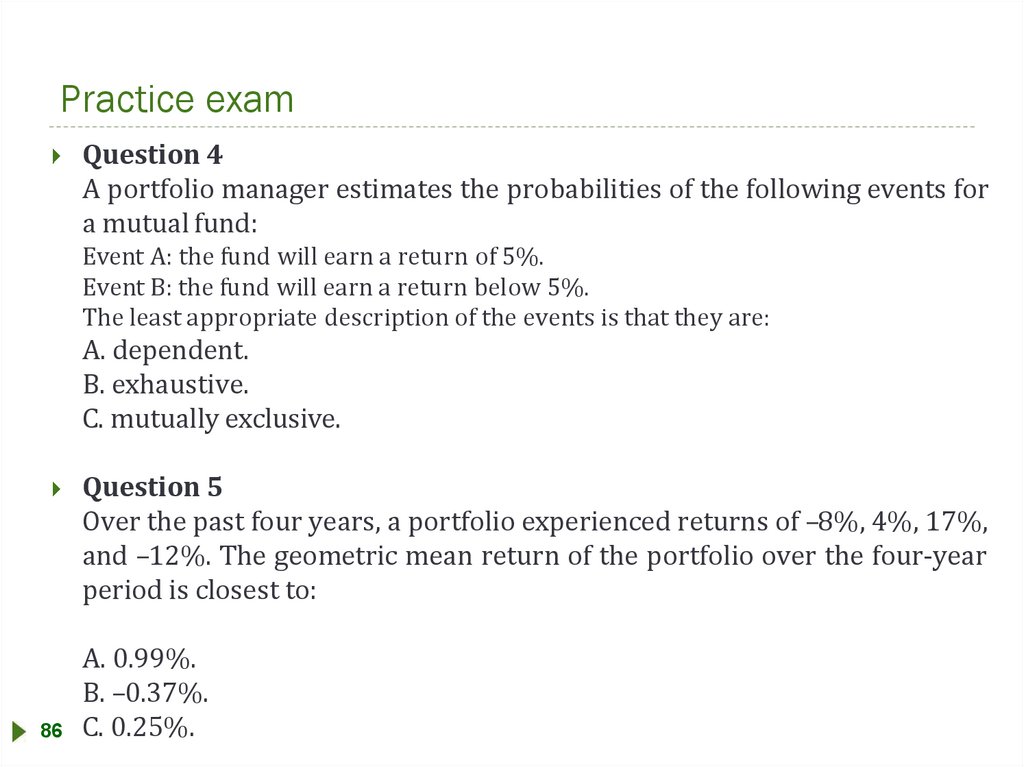
Practice examQuestion 4
A portfolio manager estimates the probabilities of the following events for
a mutual fund:
Event A: the fund will earn a return of 5%.
Event B: the fund will earn a return below 5%.
The least appropriate description of the events is that they are:
A. dependent.
B. exhaustive.
C. mutually exclusive.
Question 5
Over the past four years, a portfolio experienced returns of –8%, 4%, 17%,
and –12%. The geometric mean return of the portfolio over the four-year
period is closest to:
A. 0.99%.
B. –0.37%.
86 C. 0.25%.
91.
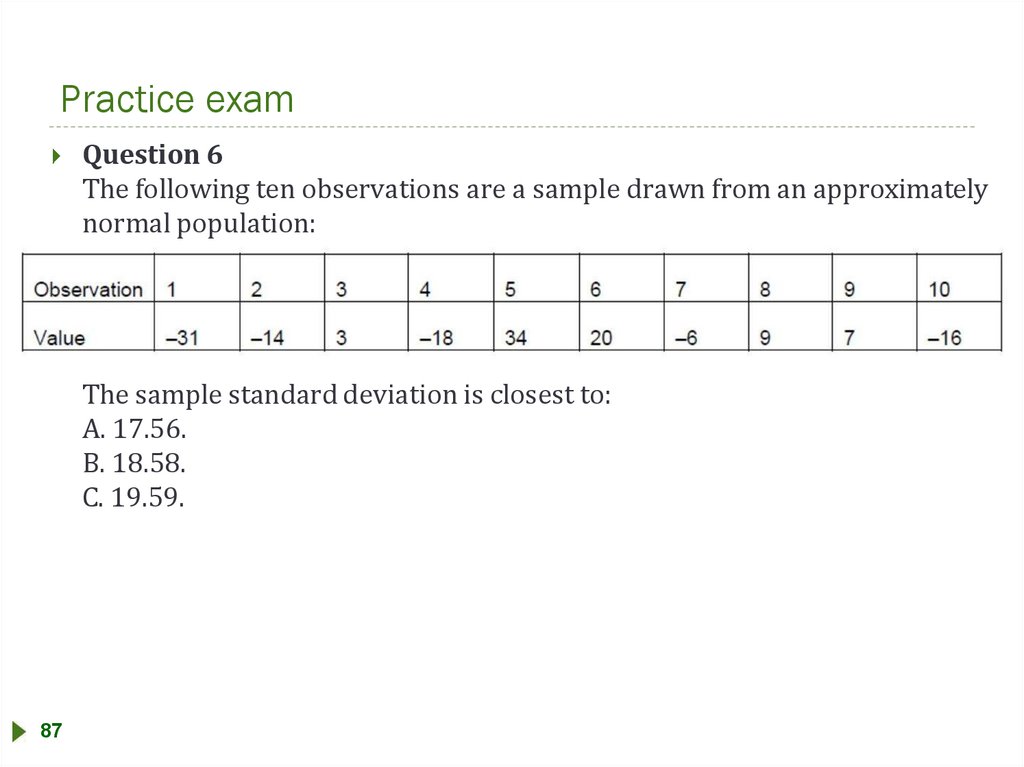
Practice examQuestion 6
The following ten observations are a sample drawn from an approximately
normal population:
The sample standard deviation is closest to:
A. 17.56.
B. 18.58.
C. 19.59.
87