


 Экономика
 География
Похожие презентации:


Regional summary — Otago
1.
Regional summary — OtagoRegional summary - Otago
This is a summary of data relevant to transportation in the Otago region, viewed from a New Zealand
Transport Agency perspective. The purpose of this document is to inform the New Zealand Transport
Agency and its sector partners about the current transport system, regional issues, plans and initiatives
in the Otago region that will have an impact on regional transport into the future.
The data have been grouped in a way that aligns with the objectives of the New Zealand Transport
Strategy, as follows:
1.
Overview
2.
Economy and Land Use
3.
Assets
4.
Access and Mobility
5.
Safety
6.
Health and Environment
Regional indicators are generally presented with a comparison to national data. Where possible, a
differentiation has been made between the Territorial Authorities; Dunedin City, Central Otago District,
Clutha District, Queenstown Lakes District and Waitaki District.
Key regional indicators
Summary
The Otago region has a population of approximately
202,000 (nearly 5% of the national total), of which 61%
live in the urban Dunedin area. The average population
densities are low with 36 people per km² in the urban
Dunedin area and 6.2 people per km² in the overall
region.
Current
(2008)
Population
Otago has a total road length of 7,804 km, 12% of the
national total. The region has two railway lines; the
Taieri Gorge Railway and the Seasider, from Dunedin to
Palmerston. Both of which have become primarily tourist
railways.
VKT
Road assets (especially the rural network) are
maintained at a condition considerably below the
national average. Concern for network deterioration
might arise if the drop in structural maintenance
expenditure in the previous year (-11.2%) proves to
become a trend.
Public
Although public transport boarding has seen a sharp
increase over the last year (+10%), the vast majority
(86%) still commute to work by car or motorbike. Road
safety issues therefore revolve around these road users,
with a relatively high number of crashes involving car
drivers and occupants.
Light vehicle
A decline since 2001 in net outflow of 25-29 year olds
out of the region may indicate that growing economic
opportunities have encouraged more people to remain
beyond the completion of their studies.
GDP
Average
annual
change
(20042008)
Annual
change
(2007 2008)
201,700
1.2%
1.0%
(2007)
(2003-2007)
(2006-2007)
2,177 million
km
3.0%
2.1%
$6,931 million
1.2%
-2.6%
(in current prices—
(95/96 prices,
(95/96 prices,
2007)
estimated—
estimated—
2003-2007)
2006-2007)
1.44 million
1.0%
10.0%
$42.5 million
3.4%
-11.2%
transport
boardings
Structural
maintenance
costs for roads
registrations
Heavy vehicle
registrations
Fatal and
serious crashes
Regional fuel
sales (diesel
plus petrol)
134,135
2.8%
(2006)
(2003—2006)
6,060
5.1%
(2006)
(2003—2006)
196
-8.3%
(2006)
(2003—2006)
Not
Not
Not
Available
Available
Available
No data
available
yet
June 2009
2.
2Regional summary — Otago
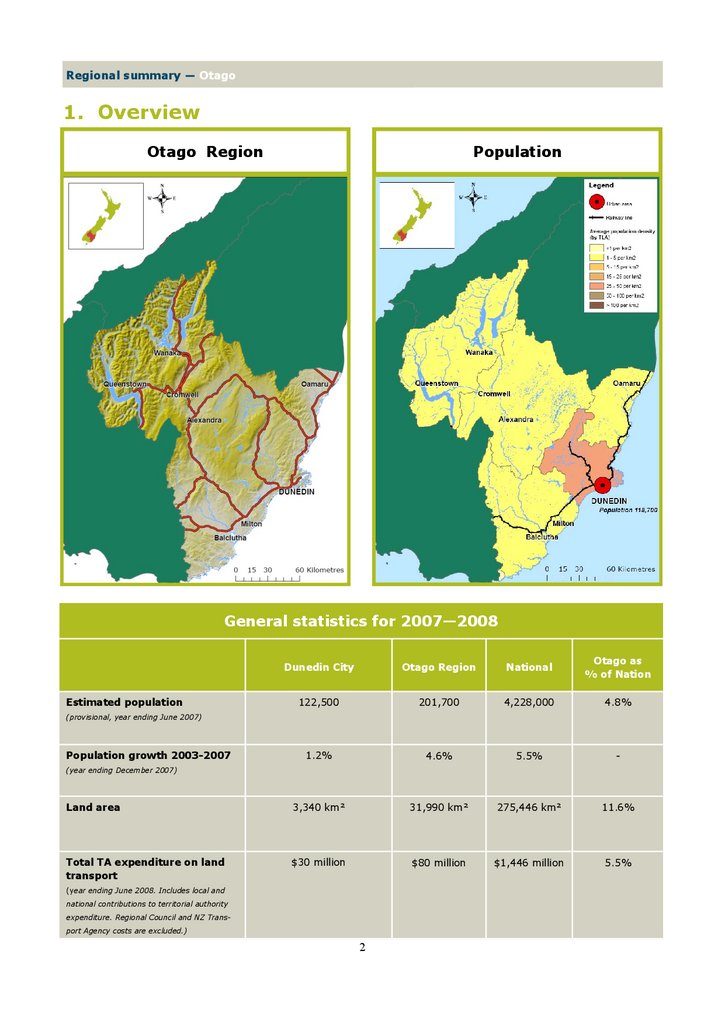
1. Overview
Otago Region
Population
General statistics for 2007—2008
Dunedin City
Otago Region
National
Otago as
% of Nation
122,500
201,700
4,228,000
4.8%
1.2%
4.6%
5.5%
-
Land area
3,340 km²
31,990 km²
275,446 km²
11.6%
Total TA expenditure on land
transport
$30 million
$80 million
$1,446 million
5.5%
Estimated population
(provisional, year ending June 2007)
Population growth 2003-2007
(year ending December 2007)
(year ending June 2008. Includes local and
national contributions to territorial authority
expenditure. Regional Council and NZ Transport Agency costs are excluded.)
2
3.
Regional summary — OtagoGeneral statistics for 2007—2008 - continued
VKT
Dunedin City
Otago Region
National
Otago as
% of Nation
446 million km
2,177 million km
40,692 million km
5.3%
(2007)
(2008)
(2008)
(2008)
1,753 km
10,564 km
93,805 km
11.3%
-
$6,931 million
$163,390 million
4.2%
-
$43,363
$38,645
-
(year ending June 2008)
Total road length
(year ending June 2008)
GDP (2007 prices)
(year ending March 2007)
GDP per capita (2007 prices)
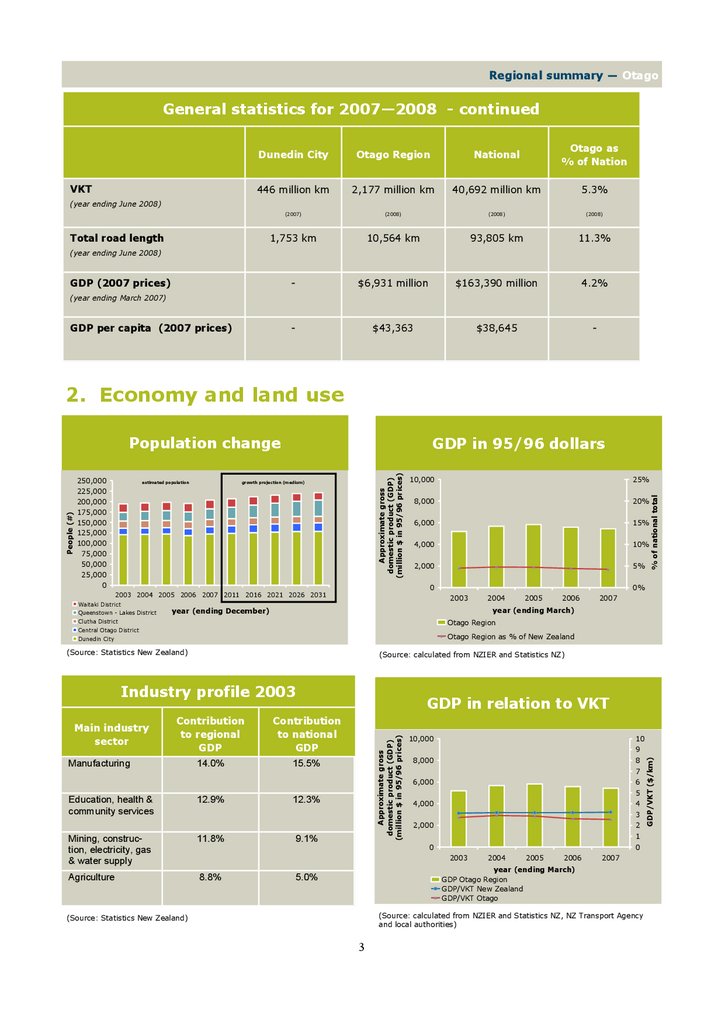
2. Economy and land use
estimated population
growth projection (medium)
Queenstown - Lakes District
25%
8,000
20%
6,000
15%
4,000
10%
2,000
5%
0
2003 2004 2005 2006 2007 2011 2016 2021 2026 2031
Waitaki District
10,000
% of national total
250,000
225,000
200,000
175,000
150,000
125,000
100,000
75,000
50,000
25,000
0
GDP in 95/96 dollars
Approximate gross
domestic product (GDP)
(million $ in 95/96 prices)
0%
2003
2004
2005
2006
2007
year (ending March)
year (ending December)
Otago Region
Clutha District
Central Otago District
Otago Region as % of New Zealand
Dunedin City
(Source: Statistics New Zealand)
(Source: calculated from NZIER and Statistics NZ)
Industry profile 2003
Contribution
to national
GDP
14.0%
15.5%
Manufacturing
Education, health &
community services
12.9%
Mining, construction, electricity, gas
& water supply
11.8%
Agriculture
8.8%
GDP in relation to VKT
Approximate gross
domestic product (GDP)
(million $ in 95/96 prices)
Main industry
sector
Contribution
to regional
GDP
12.3%
9.1%
10,000
10
9
8,000
8
7
6,000
6
5
4,000
4
3
2,000
2
1
0
0
2003
2004
2005
2006
2007
year (ending March)
GDP Otago Region
GDP/VKT New Zealand
GDP/VKT Otago
5.0%
(Source: calculated from NZIER and Statistics NZ, NZ Transport Agency
and local authorities)
(Source: Statistics New Zealand)
3
GDP/VKT ($/km)
People (#)
Population change
3
4.
4Regional summary — Otago
Economy and land use
—continued
The major contributors to the regions GDP
are manufacturing (14%), education, health
and community services (13%), mining,
construction, and electricity, gas and water
supply (11%) and agriculture (9%). The
sector contributions have remained
relatively constant over the last five years.
Tourism’s contribution to the regions GDP
is growing through industries such as retail
trade, accommodation, restaurants & bars
and cultural & recreational services; which
provide approximately 13% of the regions
GDP collectively.
Otago’s economy is strongly reliant on key
regional gateways that enable the flow of
freight, goods, services and visitors. These
are the state highway and railway networks
connecting to the north and south, to Port
Chalmers, and the international airports of
Queenstown and Dunedin.
2,000,000
8%
1,500,000
6%
1,000,000
4%
500,000
2%
0
% of national total
International freight
imports/exports
(tonnes)
International imports / exports
(Otago)
0%
2003
2004
2005
year
2006
2007
Imports
Exports
Otago Imports as % of New Zealand Imports
Otago Exports as % of New Zealand Exports
(Source: Statistics NZ )
(ORLTS)
Land use
The Otago Region occupies 12% of New Zealand’s
land mass and has 4.8% of the nation’s
population. This creates sparsely populated
stretches between the urban centres, on which
the fourth largest GDP contributor agriculture
(8.8%) dominates.
Urban land use, which is constrained by
topography and geography within the two main
centres of Dunedin and Queenstown, must be
strategically developed to enhance the main GDP
contributors of manufacturing (14%) and
education, health & community services (12.9%).
Comments
In 2007, Otago’s regional GDP ($6,931 M)
made up 4.2% of New Zealand’s total GDP.
The annual increase in GDP has been
slightly below the national average since
2003. In 2006-2007 Otago only
experienced a 0.6% GDP increase,
compared to 4.6% nationally.
4
Otago’s VKT are a relatively small share
(5.3%) of the national vehicle kilometres
travelled compared to its share of road
length. This low use may contribute to
reasons why the rural road network is being
maintained at a condition considerably
below the national average.
The regions GDP depends heavily on the
ability to transport goods and services from
industries between the urban centres and
regional gateways.
The GDP/VKT ratio was below the national
average due to a relatively low GDP and an
increased VKT. This low road efficiency is
partially related to the large amount of
tourist traffic and the large distances
between urban centres.
International freight exports remained
steady over the 2003-2005 period before
beginning a steady increase through the
2006-2007 period, finishing with 6.7% of
the total national freight exports.
The Otago region’s population has increased
4.6% over the 2003-2007 period. This is
slightly less then the national average.
Growth was centred in the Dunedin City and
Queenstown regions.
5.
Regional summary — OtagoEconomy and land use
—continued
Emerging Issues
Otago’s economy is dependant on an
efficient rural and urban transport system
to transfer freight and goods. Predicted
increases in freight, in line with national
trends, will place emphasis on an optimised
inter-modal integration of the road, rail and
air networks to maintain a buoyant
economy.
(ORLTS)
(ORLTS)
Significant volumes of freight are currently
trans-shipped to Christchurch due to the
availability of flights. Increased access to
airfreight would increase economic viability
for some businesses.
(ORLTS)
The regions population is predicted to
increase, especially in Dunedin and
Queenstown Lakes districts. This will
increase congestion throughout urban
centres as the public, tourist traffic and
freight compete for the same road spaces
and corridors.
Particular consideration must be paid to the
Caversham Valley corridor in Dunedin City,
which will have increased peak time
congestion in line with the increasing
population and transportation trends.
Continued dairy conversion of farms in
Otago, particularly in South Otago, and
forecast efficiency gains will increase the
amount of milk tanker traffic on rural and
regional roads.
(ORLTS)
An extended and integrated rail system
would benefit the growing dairy and
forestry industries. Consideration has been
given to transporting logs to Port Chalmers
for export, and dairy products to
Clandeboye, via rail.
The Otago RLTS has identified rail as an
important method to minimise congestion
within the Dunedin City area, due to the
increasing number of heavy vehicles
travelling through the urban area.
5
Tourism is a major growth driver and will
have a pronounced effect on traffic on
tourist routes throughout the region due to
increased bus, campervan, car and
recreational cyclist numbers. Measures such
as adequate passing lanes, rest stops and
signage have been identified by the Otago
RLTS as measures to provide adequate
service for the increasing demand.
5
6.
6Regional summary — Otago
3. Assets
Structural maintenance costs—
network
Transport Network
50
25%
40
20%
30
15%
20
10%
10
5%
0
% of national total
Structural maintenance costs
( $ million)
(NZTA and approved organisation share for
programmes funded through NZTA only)
0%
2004
2005
2006
2007
2008
year (ending June)
Otago - local roads
Otago - SH
Otago network as % of national total
(Source: NZ Transport Agency )
Structural maintenance costs
by road asset and vehicle use
25
18
16
Structural maintenance costs by
vehicle use (VKT)
($ / 1000 km)
Structural maintenance costs by
road asset ($000/km)
20
20
14
12
15
10
8
10
6
4
5
2
0
0
2004
2005
2006
2007
year (ending June)
Otago - per km
NZ - per km
Otago - per VKT
NZ - per VKT
2008
(Source: NZ Transport Agency )
Road length 2008
Dunedin City
Otago Region
National
Otago as %
of Nation
Urban
691 km
1,332 km
17,298 km
7.7%
Rural
1,062 km
7.804 km
65,088 km
12.0%
Special
purpose
No data
124 km
513 km
24.2%
Local roads - total
1,753 km
9,260 km
82,899 km
11.0%
State Highways
No data
1,304 km
10,906 km
12.0%
-
10,564km
93,805 km
11.3%
Local
roads
All roads
6
7.
Regional summary — OtagoAssets — continued
Smooth travel exposure (STE) region
Smooth travel exposure (STE)
local roads - Otago TAs
Note: The higher the smooth travel exposure (STE) % the
smoother the network.
100%
STE - smooth travel exposure (%)
STE - smooth travel exposure (%)
100%
95%
90%
85%
80%
75%
70%
2004
2005
2006
2007
2008
Year ending June
Otago Region - Urban
Otago Region - Rural
New Zealand - Urban
New Zealand - Rural
95%
90%
85%
80%
75%
70%
2004
Central Otago District
Dunedin City
Waitaki District
100 — Condition index - region
99
98
97
96
95
2007
2008
Year ending June
Otago Region - Urban
Otago Region - Rural
New Zealand - Urban
New Zealand - Rural
94
92
90
2004
2005
2006
2007
2008
Year ending June
100
100 - pavement integrity index
(100 - PII)
100 - pavement integrity index
(100 - PII)
96
Clutha District
Queenstown - Lakes District
New Zealand
100 — Pavement integrity index
local roads— Otago TAs
Note: The higher the 100-pavement integrity index (PII) value
the better the pavement structural condition.
98
96
94
92
90
2006
98
(Source: Local Authorities)
100 — Pavement integrity index
2005
Clutha District
Queenstown - Lakes District
New Zealand
Central Otago District
Dunedin City
Waitaki District
(Source: Local Authorities, NZ Transport Agency)
2004
2008
100
100 - condition index (100 - CI)
100 - condition index (100 - CI)
100
2006
2007
100 — Condition index
local roads - Otago TAs
Note: The higher the 100-condition index (CI) value the fewer
the defects in the sealed road surface.
2005
2006
Year ending June
(Source: Local Authorities)
(Source: Local Authorities, NZ Transport Agency )
2004
2005
2007
2008
Year ending June
Otago Region - Urban
Otago Region - Rural
New Zealand - Urban
New Zealand - Rural
100
98
96
94
92
90
88
86
84
82
80
2004
2005
Central Otago District
Dunedin City
Waitaki District
(Source: Local Authorities, NZ Transport Agency )
(Source: Local Authorities)
7
2006
2007
2008
Note: The higher the
100-condition index
(CI) value the fewer
Clutha District
the defects in the
sealed
roadDistrict
surface.
Queenstown
- Lakes
Year ending June
New Zealand
7
8.
8Regional summary — Otago
Assets — continued
Comments
Emerging Issues
Local pavement conditions in Otago are
comparable to the national average. An
exception is pavement in Dunedin City,
which is in a considerably worse condition.
The Otago region contains 290km of
existing railway lines consisting of the main
north-south rail link near the East Coast
and the Taieri tourist rail link which travels
into central Otago.
In 2008, Otago received 6.5% of the
national expenditure on structural
maintenance of roads. This was a 11%
reduction in Otago’s total structural
maintenance expenditure compared to the
previous year. Spending increased 16.7%
on state highways compared to a 21%
decrease in expenditure on local roads,
which was in line with national trends.
Throughout Otago there are 9,190 km of
local roads (of which 65% are unsealed).
Some of these routes are increasingly being
used for tourist traffic. There is also
potential for land use conversion to relieve
localised traffic pressures.
(ORLTS)
Otago contains two international airports,
situated in Dunedin and Queenstown, both
of which receive direct flights from
Australia. Wanaka is now a designated
passenger airport and its role will likely
continue to grow over time as an
alternative to Queenstown in adverse
weather conditions. In turn this will also
increase the importance of the Crown
Range link.
(ORLTS)
(ORLTS)
Port Chalmers is a major international port
situated in Dunedin City, and has excellent
rail links.
8
9.
Regional summary — Otago4. Access and mobility
Travel mode share 2003—2007
(travel to work)
Vehicle use (VKT)
Walk/ Drive, 2%
2,500
10%
2,000
8%
1,500
6%
1,000
4%
500
2%
Cycle, 2%
Bus/ Train, 1%
Walk/ Public
Transport, 1%
0
0%
2004
2005
2006
2007
year (ending June)
Otago Region - SH
Passenger, 7%
% of national total
Otago & Southland
2003 - 2007
Driver, 79%
2008
Walk/ Passenger,
1%
Bus/ Train, 1%
Otago Region - local roads
Otago Region as % of NZ total
Walk/ Drive, 3%
(Source: Local Authorities, NZ Transport Agency)
Walk/ Public
Transport, 4%
Walk, 4%
160,000
New Zealand
2003 - 2007
Passenger, 7%
10%
140,000
8%
120,000
100,000
6%
80,000
4%
60,000
40,000
2%
20,000
0
% of national total
Driver, 77%
(Source: Ministry of Transport Household Travel Survey)
0%
2003
2004
year
2005
Passenger transport
boarding numbers
2006
Motorcycle or moped
Heavy Vehicles
Light vehicles
Total as % of New Zealand
5
PT boardings (million #)
Registered vehicles (#)
Vehicle fleet - numbers
(Source: Motor Vehicle Register)
Vehicle fleet - age
Average age of vehicle fleet
(years)
Cycle, 2%
Walk/Car/Public
Transport, 1%
Drive/Passenger,
0%
Other, 1%
20
10%
9%
4
8%
7%
3
6%
5%
2
4%
3%
1
2%
1%
0
0%
2004
15
2005
2006
year
2007
2008
Ferry
Rail
Bus
Auckland total PT as % of New Zealand
10
% of national total PT boardings
Vehicle kilometres travelled
(VKT) (million km)
Walk, 8%
(Source: Otago Regional Council)
5
0
2003
2004
2005
year
2006
Otago - Motorcycle
NZ - Motorcycle
Otago - Car
NZ - Car
Otago - Truck
NZ - Truck
Otago - Bus
NZ - Bus
Distance to bus routes
2007
97% of the target community in the Otago
region lives within 500m of a bus route.
(Source: Motor Vehicle Register)
(Source: LTP Online Returns)
9
9
10.
10Regional summary — Otago
Access and mobility
—continued
Total mobility scheme
boarding numbers
10%
100,000
8%
80,000
6%
60,000
4%
40,000
2%
20,000
0
0%
2004
2005
2006
year
2007
2008
% of national total mobility
scheme boardings
Total mobility scheme boardings
(#)
120,000
Total mobility scheme boardings
An aging population will increase reliance on
modes of transportation other than private
car use in the future.
The Otago vehicle fleet has remained a
constant size and comprises approximately
5% of the national fleet. The total fleet
increase over the 2003-2006 period was
driven by a 19.2% increase in moped /
motorcycle and a 5.2% increase in heavy
vehicle fleet.
Currently, no passenger rail service is
available in the Otago region. The Taieri rail
link provides an alternative to SH87 for
tourists travelling into Central Otago.
Otago as % of New Zealand
(Source: Otago Regional Council)
Emerging Issues
Comments
Public passenger transport operates at
different scales around Otago, from fully
commercial regular shuttle and bus services
linking communities, to the integrated
services provided in Dunedin. This reflects
the varying densities of population and
distances between urban areas in the
region.
There is an opportunity for continued
improvements in provision and quality of
public transport to respond to rising
demand. Real time information in Dunedin
and Queenstown has been considered.
For the research period 2003—2007, all
categories in Otago’s vehicle fleet were
above national average age. This is not a
desirable trend on environment and safety
grounds.
The predicted increase in private car use
should not adversely affect other modes
such as walking, cycling and public
transport. The Otago RLTS has recognised
the need for particular attention to be given
to footpath and crossing quality along urban
regional routes, public transport availability
and quality, and mobility assistance.
The Otago Regional Council has identified
the need to address mobility, accessibility,
economic and safety outcomes through a
review of the total mobility programme and
updating the current Regional Passenger
Transport Plan. Simple measures such as
increased low floor bus access and improved
infrastructure, e.g. bus shelters and seating,
have been identified.
(ORLTS)
Buses within Dunedin travel on mainly
historic routes, as the topography of the
area restrains movements to the current
road network. This topography also ensures
that bus-use is an important tool to reduce
congestion in the CBD.
(ORLTS)
The majority of Otago’s requirements for
urban passenger services are provided by
commercial operators without public
subsidy. This has been a conscious policy
decision.
(ORLTS)
The total mobility scheme operates in
Queenstown, Wanaka, Alexandra,
Cromwell, Balclutha and the Dunedin area.
Otago’s total mobility boardings made up
6.7% of national mobility boardings in
2008.
10
11.
Regional summary — Otago5. Safety
Comments
The predicted increase in tourism and
freight movement in Otago has raised
concerns over road safety. The RLTS has
identified the need for increased passing
lanes on tourist and freight routes, greater
frequency of rest areas and greater signage
in rural areas, especially on tourist routes.
The region has a high social cost of crashes
due to several factors; winter driving
conditions, high presence of tourist traffic
and a high proportion of young people
interacting with the state highway network.
300
12%
250
10%
200
8%
150
6%
100
4%
50
2%
0
% of national total
Fatal and serious motor vehicle
crashes (#)
Fatal and serious vehicle crashes
0%
2003
2004
2005
2006
2007
(ORLTS)
Year
Otago
Vehicle crashes Otago as % of New Zealand
VKT Otago as % of New Zealand
(Source: NZ Transport Agency, CAS Database)
Fatal and serious vehicle crashes
involving cyclists and pedestrians
40%
60
30%
50
40
20%
30
20
10%
10
0
% of vehicle crashes
Fatal and serious motor vehicle
crashes (#)
70
(ORLTS)
Emerging Issues
0%
2003
2004
2005
2006
Otago has several major fault lines running
through the region and a variable
topography. When natural disaster occurs,
these characteristics have the potential to
isolate areas. It is essential to have
alternative access to the urban centres and
to have measures in place to mitigate the
risk.
2007
Year
Otago cyclists
Otago pedestrians
Walking and cycling as % of total crashes - Otago
Walking and cycling as % of total crashes - New Zealand
A number of high profile seal extensions
have been carried out in recent years to
address tourist safety issues e.g. Chaslands
Highway and Crown Range Road.
(Source: NZ Transport Agency, CAS Database)
25%
300
20%
250
200
15%
150
10%
100
5%
50
0
Casualties (#)
350
% of national total
Casualties (#)
Fatal and serious road casualties
0%
2003
2004
2005
2006
2007
1,200
25%
1,000
20%
800
600
400
15%
10%
200
5%
0
0%
Year
Otago - serious
Otago - fatal
Otago - fatal % of NZ fatal
Otago - fatal & serious injuries
(Source: NZ Transport Agency)
(Source: NZ Transport Agency)
11
Otago - fatal & serious injuries as % of NZ
% of national total
Fatal & serious road casualties
per road user group
Annual rates 2003—2007
11
12.
12Regional summary — Otago
6. Health and
Environment
Changes in travel mode share
1996 –2001 (travel to work)
PM10 air pollution —
mortality per 1000 population
Selected urban area
Oamaru
1
Central Otago
-4%
-3%
-2%
-1%
0%
1%
2%
3%
4%
Bus/train
Walk/cycle
1
Passenger
Mosgiel
0.69
Milton
0.59
Dunedin
0.46
Cromwell
0.72
Balclutha
0.50
Arrowtown
0.60
Alexandra
0.81
Drove
Clutha
No travel
0.00
Other, not elsewhere included
-4%
0.67
-3%
-2%
-1%
0%
1%
2%
3%
0.20
4%
0.40
0.60
0.80
1.00
PM 10 mortality per 1000 population (#)
(Source: Health and air pollution in NZ, 2007 - research funded by Health
Research Council of NZ, MfE, MoT)
Bus/train
Walk/cycle
1
Passenger
Dunedin
-4%
Drove
-3%
-2%
-1%
No travel
0%
1%
2%
3%
4%
other, not elsewhere
included
Sources of PM10 mortality
Bus/train
Walk/cycle
Passenger
1
Dunedin
16.4%
Oamaru
16.2%
Drove
Selected urban area
No-travel
Queenstown
Lakes
other, not elsewhere included
-4%
-3%
-2%
-1%
0%
1%
Waitaki
-3%
3%
4%
Bus/train
Walk/cycle
Passenger
Drove
No travel
other, not elsewhere included
1
-4%
2%
Mosgiel
Milton
Cromwell
Balclutha
-1%
0%
1%
2%
3%
Alexandra
11.1%
Napier
Hamilton
Vehicle
Domestic
Industrial
1
New Zealand
-4%
-3%
-2%
-1%
Background
Bus/train
Walk/cycle
Passenger
Drove
No travel
other, not elsewhere included
0%
1%
2%
3%
20.0%
10.0%
Auckland City
4%
18.2%
10.5%
Arrowtown
Palmerston North
-2%
9.3%
48.4%
43.3%
30.9%
47.1%
0%
20%
40%
60%
80%
100%
Percentage of total PM 10 mortality by source (%)
(Source: Health and air pollution in NZ, 2007 - research funded by Health
Research Council of NZ, MfE, MoT)
4%
Bus/train
Walk/cycle
Passenger
Drove
No travel
other, not elsewhere included
(Source: Statistics NZ)
Note: The NZ Transport Agency has significant concerns
about data contained in the report Health and air
pollution in New Zealand. However, for the
completeness of this document the data in the graphs
below was sourced from that report.
12
13.
Regional summary — OtagoHealth and Environment
— continued
Emerging Issues
Comments
Walking is the second most popular mode of
transport to work within Dunedin City
(12%). Cycling follows with 4%. The main
factors restricting active modes of transport
are perceptions of safety, topography,
weather, and footpath/roadway quality and/
or design.
The Otago RLTS identified the need for
promotion of walking and cycling for short
trips through land use planning, urban
design, direct investment in quality
footpaths, walkways & cycle ways, and
marketing of ‘healthy transport
alternatives’.
There is an ongoing high social cost of
Otago road crashes (over $150M per year,
of which just under a third occurred on the
State Highway network). Preventative
measures to improve the functioning of the
regional network need to remain a high
priority.
(ORLTS)
The ORLTS aims to reduce harmful
emissions from road vehicles through
advocacy and potentially direct investment
in vehicle testing (including standard setting
and enforcement). CO2 emissions will be
reduced through implementation of central
government national policy directives.
Transportation planning considerations
should be integrated with land use
development (including subdivision) to
ensure that the existing and future
functionality of the roading network is
protected from the adverse effects of
intensification of land use development.
(ORLTS)
Commuting as a passenger, and the active
modes of transport (walking / cycling) have
seen a negative change since 1996 in all
TAs. Driving to work, and working from
home, have gained popularity. This reflects
the changes in travel to work modes that
were observed on a national scale.
13
13