


Principals for QI:-")


) ((( Ishikawa Diagram )))")


 Менеджмент
Похожие презентации:
")


")

")


Improvement of organizational performance
1. Improvement Of Organizational Performance
Prepared byDr. Marwa Dewidar
Manager of quality administration –Gharbia Directorate for
health affairs
Associated trainer –IBCT
TQM- AUC
Master Degree in family medicine
Hospital management fellowship
2. Definition:-
Definition:Quality management “QM” / QI:QM / QI is defined as a planned, systematic, Organization
wide, approach to the monitoring, analysis and improvement
of organization performance, thereby continually improving
the quality of patient care and services provided and the
likelihood of desired patient outcomes.
3. Juran Trilogy of QM
• Quality management employs three basicactivities “ Juran trialogy of QM”:
• Quality Planning
• Quality Control
• Quality Improvement
4. Juran Trilogy
QualityPlanning
Quality
Improvement
Quality
Control
The three components work together to provide QM Process
that function like a loop. There is no starting point or end
point, put all components work together in a continuous way
5. Juran Trilogy
• Quality PlanningIt is a structured process designed to create
services that meet the customer’s needs. It
involves six logical steps.
6. Quality Planning
Establish the project
Identify customers
Discover customer’s needs
Develop service features
Develop detailed process
Develop process control / transfer to operation
7. Juran Trilogy
QualityPlanning
Quality
Improvement
Quality
Control
8. Quality Control/Measurement
• Quality control process helps health teams tounderstand and control their every day work
processes, and establish a basis for improvement of
these processes.
• It helps assure that routine activities and
responsibilities are performed correctly and
consistently.
• It involves the following steps:
9. Quality Control/Measurement
• Step 1: Measure actual performance• Step 2: Compare the results with
established standards
• Step 3: Act on the difference
10. Juran Trilogy
QualityPlanning
Quality
Improvement
Quality
Control
11. Quality Improvement
• This process is the means of raising qualityperformance to unprecedented levels
(breakthrough). It involves the following
steps:
12. Problem solving cycle
1- Identifying problems/ opportunities for improvement.2- Defining the problem operationally
3- Selecting the team
4- Analysing and studying the problem to identify its root
causes
5- Developing solutions and actions for improvement
6- Implementing and evaluating quality improvement
efforts
13. The JC (joint commission )Principals for QI:-
The JC (joint commission )Principals for QI:1. Organization wide dedication. تفانى2. Leadership commitment and active
participation.
3. Work on vital processes, i.e., those
processes which have a direct impact on
patient outcomes.
4. Reduction of barriers and conflicts that
may hinder QI in the organization.
5. Use feedback from all customers.
14. The ISO 9000-2000 QM Principals
Principle 1: Customer focused organization.Principle 2: Leadership.
Principle 3: Involvement of people.
Principle 4: Process approach.
Principle 5: System approach to management.
Principle 6: Continual improvement.
Principle 7: Factual approach to decision making.
Principle 8: Mutually beneficial supplier relationships.
15. QI Process Approaches
Plan-Test-Act-Check Approach
FOCUS-PDCA
IMPROVE
FADE cycle
Juran’s Quality Improvement Process (QIP)
Xerox TEN Step benchmarking
16. QI Process Approaches
Process Improvement Model
Decision Making Cycle/ PI Approach (APIE)
“IDEA” Approach
Six Sigma “DMAIC”
Lean Thinking Approach
Kizen QI Process
17.
• SHEWHART (PDCA )AND DEMING MODEL (PDSA)• P = PLAN
• D = DO (PILOT )
• CHECK OR STUDY
• ACT
18.
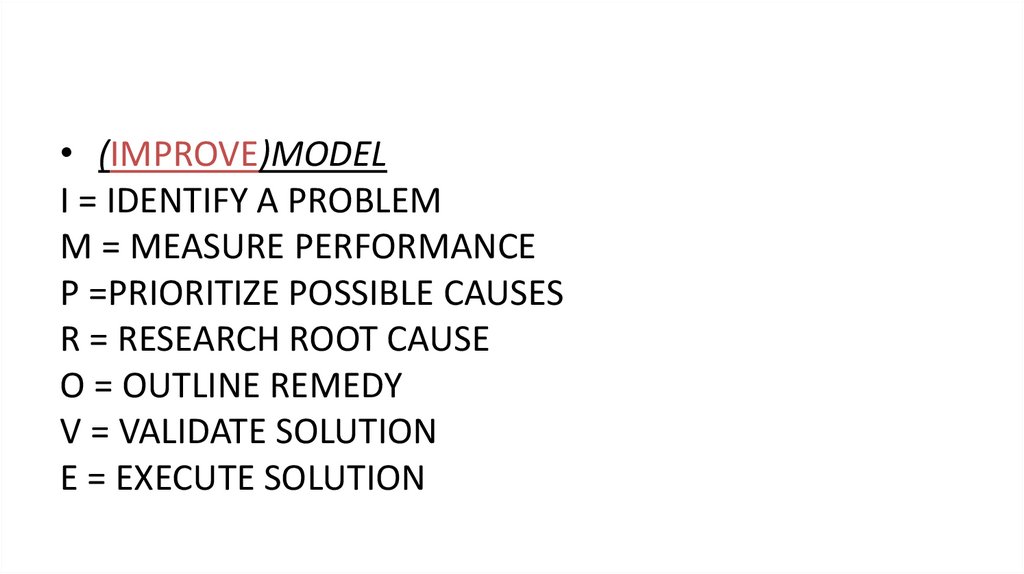
• (IMPROVE)MODELI = IDENTIFY A PROBLEM
M = MEASURE PERFORMANCE
P =PRIORITIZE POSSIBLE CAUSES
R = RESEARCH ROOT CAUSE
O = OUTLINE REMEDY
V = VALIDATE SOLUTION
E = EXECUTE SOLUTION
19.
• XEROX FOR BENCHMARK1.
2.
3.
4.
5.
6.
7.
8.
9.
10.
WHAT TO BE BENCHMARKED
WHO IS THE COMPARATIVE
DATA COLLECTION
CURRENT LEVEL
FUTURE LEVEL
COMMUNICATE
FUNCTIONAL GOALS
ACTION PLAN
IMPLEMENT
RECALIBRATE
20.
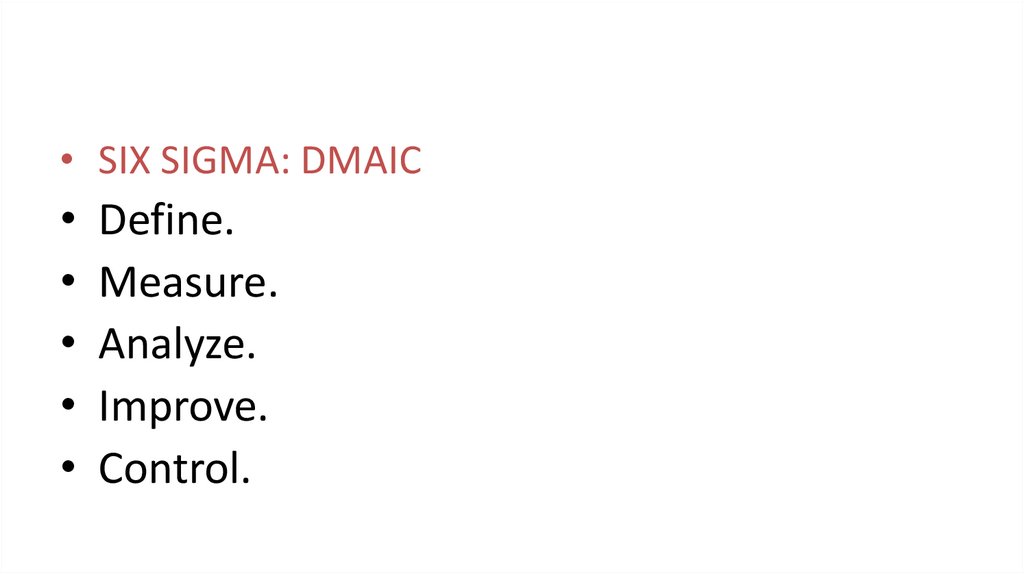
• SIX SIGMA: DMAICDefine.
Measure.
Analyze.
Improve.
Control.
21.
Lean pioneered by Toyota, focuses on the efficient
operation of the entire value chain.
• Focus areas:
– Remove non-value added steps to:
» Reduce cycle time
» Improve quality
– Align production with demand. توافق االنتاج مع المطلوب
– Reduce inventory. خفض المخزون
– Improve process safety and efficiency تحسين كفاءة
وسالمة العملية
22.
23. F-O-C-U-S
Find a process that needs improvementOrganize a team who is knowledgeable in the
process
Clarify the current knowledge of the process
Understand the causes of variation
Select the potential process improvement
24.
Plan the improvement/data collectionDo the improvement/data collection/data
analysis
Check the data for process improvement
Act to hold the gain/continue improvement
25. Find
• What are the process problems?26. Priority matrix
Problem Frequency Importance FeasibilityTotal Ranking
Points
27.
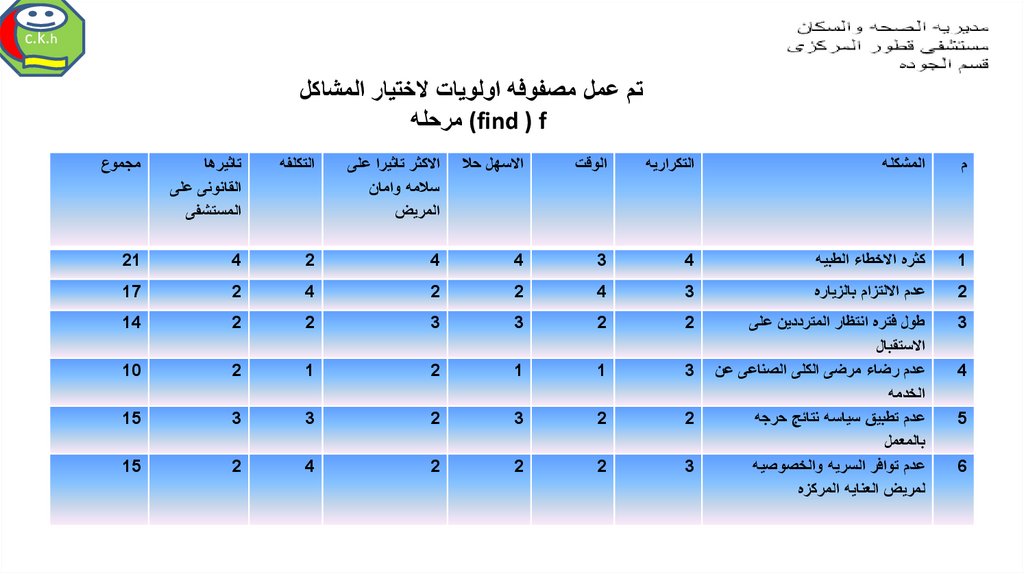
c.k.hتم عمل مصفوفه اولويات الختيار المشاكل
(find ) fمرحله
م
المشكله
التكراريه
الوقت
االسهل حال
االكثر تاثيرا على
سالمه وامان
المريض
التكلفه
تاثيرها
القانونى على
المستشفى
مجموع
1
كثره االخطاء الطبيه
4
3
4
4
2
4
21
2
عدم االلتزام بالزياره
3
4
2
2
4
2
17
3
طول فتره انتظار المترددين على
االستقبال
عدم رضاء مرضى الكلى الصناعى عن
الخدمه
عدم تطبيق سياسه نتائج حرجه
بالمعمل
عدم توافر السريه والخصوصيه
لمريض العنايه المركزه
2
2
3
3
2
2
14
3
1
1
2
1
2
10
2
2
3
2
3
3
15
3
2
2
2
4
2
15
4
5
6
28. Organize
• Representatives from various levels inthe organization.
• Select members who know and work
with this process.
29. Clarify
• What is the actual flow of the process?30. FLOWCHARTS
startFlowcharts tend to
use simple and easily
recognizable symbols.
Activity
The basic symbols :
A Circle (start/end)
A rectangle (activity)
A diamond (decision)
An arrow (direction).
30
–
–
–
–
NO
Decision
Yes
End
31. Fishbone Diagram (( Cause-and-Effect Diagram)) ((( Ishikawa Diagram )))
• Cause-and-Effect diagram is a visual display ofthe suggested causal relationship between a
quality problem and all possible variables related
to that problem
32. Basic Layout of Cause and Effect Diagrams
Manpower(People)
Methods
(Procedures)
EFFECT
Materials
(Policies)
32
Environment
Machines
(Plant)
33. Understand
• What are the major causes of variation?• What.. Who.. Where.. When.. How will data
be collected?
34.
• To confirm the reasons and collect data thefollowing techniques are used:
-Personal Interview
- Observation
35.
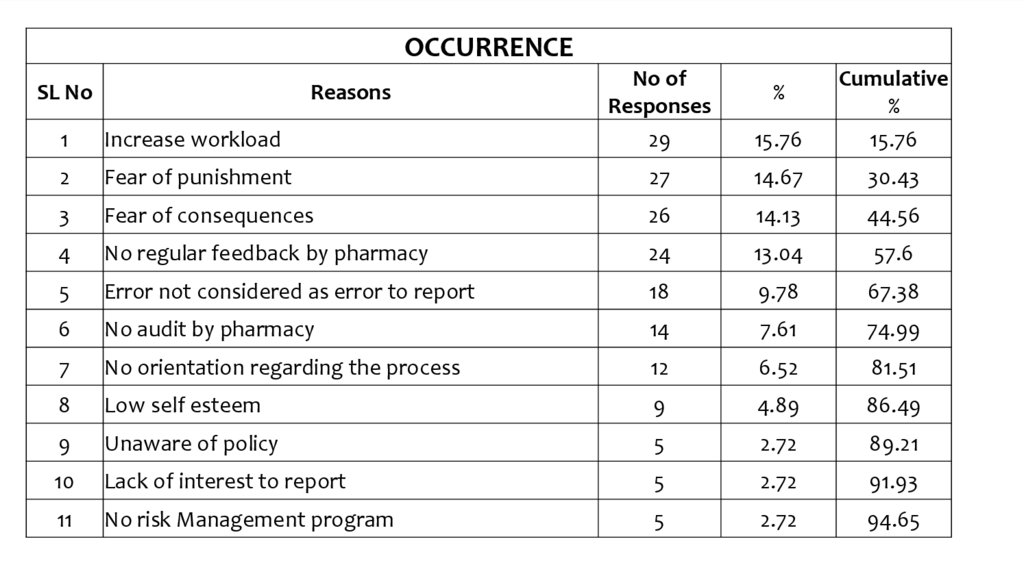
OCCURRENCE1
Increase workload
No of
Responses
29
2
Fear of punishment
27
14.67
30.43
3
Fear of consequences
26
14.13
44.56
4
No regular feedback by pharmacy
24
13.04
57.6
5
Error not considered as error to report
18
9.78
67.38
6
No audit by pharmacy
14
7.61
74.99
7
No orientation regarding the process
12
6.52
81.51
8
Low self esteem
9
4.89
86.49
9
Unaware of policy
5
2.72
89.21
10
Lack of interest to report
5
2.72
91.93
11
No risk Management program
5
2.72
94.65
SL No
Reasons
15.76
Cumulative
%
15.76
%
36.
reas
ew
No
or
kl
of
oa
p
d
u
F
ea
re
ni
gu
sh
Er
ro
m
ro
la
fc
en
rf
rn
on
ee
t
ot
se
db
co
q
ac
ue
ns
kb
nc
id
er
es
yp
ed
ha
as
r
m
No
er
ac
ro
or
y
No
rt
ie
o
nt
a
r
ud
at
ep
io
it
or
n
by
t
re
ph
ga
ar
rd
m
in
ac
g
y
th
ep
ro
Lo
ce
w
ss
se
l
f
-e
Un
st
aw
ee
La
ar
ck
m
e
of
No
o
f
i
nt
po
ris
er
lic
kM
es
y
t
an
to
ag
r
e
em
po
en
rt
La
t
pr
ck
N
o
o
of
gr
No
sy
aw
am
st
re
ar
e
in
m
en
fo
in
es
rc
pl
sf
em
ac
or
en
e
M
tb
ed
y
ic a
HO
lE
D
rro
rr
ep
...
Fe
ar
In
c
Number of Responses
35
30
25
74.99
20
15
10
5
81.51
91.93
86.49 89.21
REASONS
99
94.65 97.37
67.38
57.6
44.56
30.43
15.76
0
100 100
90
80
70
60
50
40
30
20
10
0
Series1
Series2
37. Select
• Select a portion of the process to improve.• Determine the needed actions.
38. NEXT STAGE ……
39.
خطوة :6تطبيق الحلولخطط
PDCA
)(Plan
الغايات
األهداف
………
……….
أفعل
)(DO
a pilot study
افحص
)(Check
نفذ
)(Act