


")


 Экономика
Похожие презентации:


")

(ge) and World Economic Relations (WER)")

Capacity and Demand (Lecture # 10)
1. Capacity and Demand
IE3501
2. A problem
• AUA average power consumptionrate is:
75 kW.
• Large Auditorium Lighting ONLY
takes:
120 kW.
• Size a gas driven generator.
2
3. Solution
•Answer:75 kW?
120 kW?
195 kW?
Or?
•Answer: Solve an optimization
problem.
3
4. Capacity & Demand
Capacity & Demand•Investment is needed to
add the physical Stock of
Capital.
Capital Stock =
= Installed Capacity =
= Size = Power, In …
4
5. Capacity & Demand
Capacity & Demand• Power shortage means:
Peak demand > Installed
capacity
• Energy shortage means:
Not enough fuel to generate
power.
5
6. Load curves
• Electric power demand = load• Load curves, regular (periodic):
Daily
Weekly
Seasonal
Per shift, other…?
• Plus a stochastic component.
6
7. Seasonal
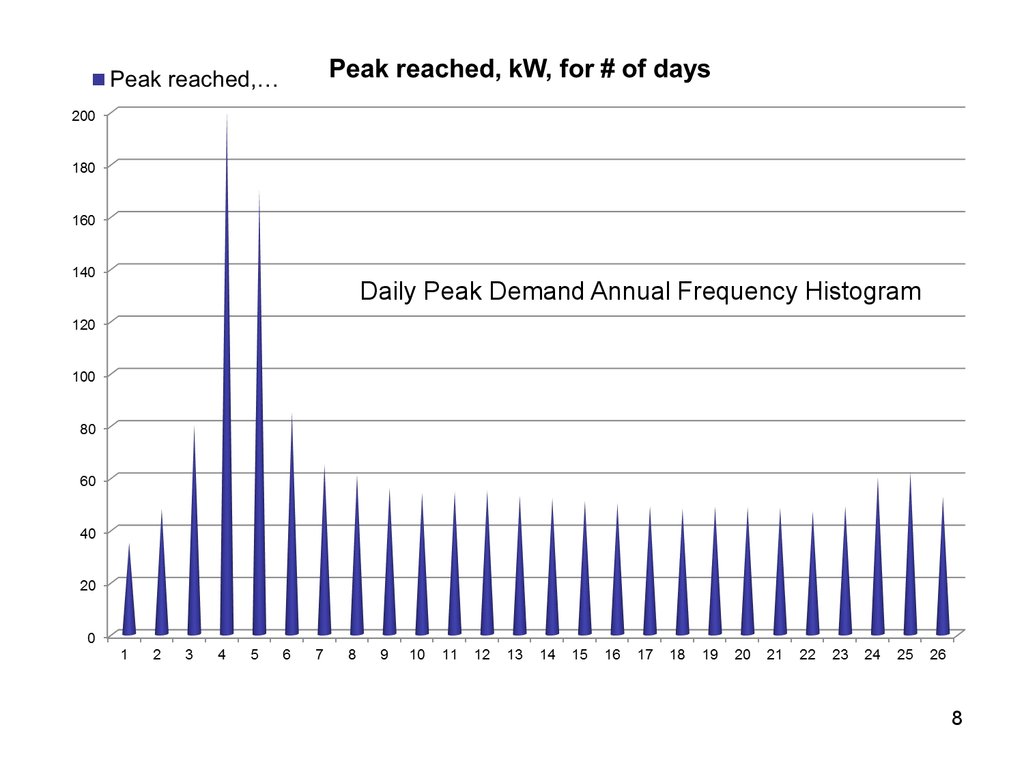
78.
Daily Peak Demand Annual Frequency Histogram8
9. Daily
910. Capacity factor (CF)
Actual Generated EnergyCF =
Energy Generated @ 100%
Is it constant?
It is different for different types of
powerplants.
10
11. Hydropower
PowerplantCapacity, GW
Production,
TWh/year
Capacity
Factor
Three Gorges Dam (China)
18.3 (22.5)
80 (368)
50%
Itaipu Dam (Brazil, Peru)
14
91.6
74.6%
11
12. Comparison
TypeHydro
Wind
PV
Solar thermal
Nuclear
Geothermal
Fossil
Capacity
factor, %
Category
20-80% (100%)
25-35%
20%
15%
90%
90%
90%
Seasonal
Intermittent
Intermittent
Intermittent
Base
Base
Base-Peak
12
13. PV capacity factor
• 1kW of PV produces always annualamount kWhs equal to the monitoring
amount:
• … e.g. in Yerevan we have 1720kWh/m 2
annually.
• 1720/8760 = 19.63% - capacity factor for
PV.
• For 3 kW system we would get 5160 kWh
13
14. Energy Shortage: Two Approaches
1. Construction of newcapacities - supply side.
2. Conservation, Load leveling
– demand side.
14
15. Peak vs. Average vs. Base
•AUA peak is:75 kW?
120 kW?
195 kW?
Or?
•Average is another number…
15
16. Countrywise
•Peak•Average
•Base
16
17. Peak
• All powerplants, all generation capacitiesare operating.
• We are going to extreme measures:
ALLOWING TO LOWER SEVAN LEVEL!
• We are buying power from other countries
• And the power is not enough:
in some places power is cut.
17
18. Base
• Consumption never goes below certainamount
• Metsamor NPP is providing the base
power.
18
19.
1920.
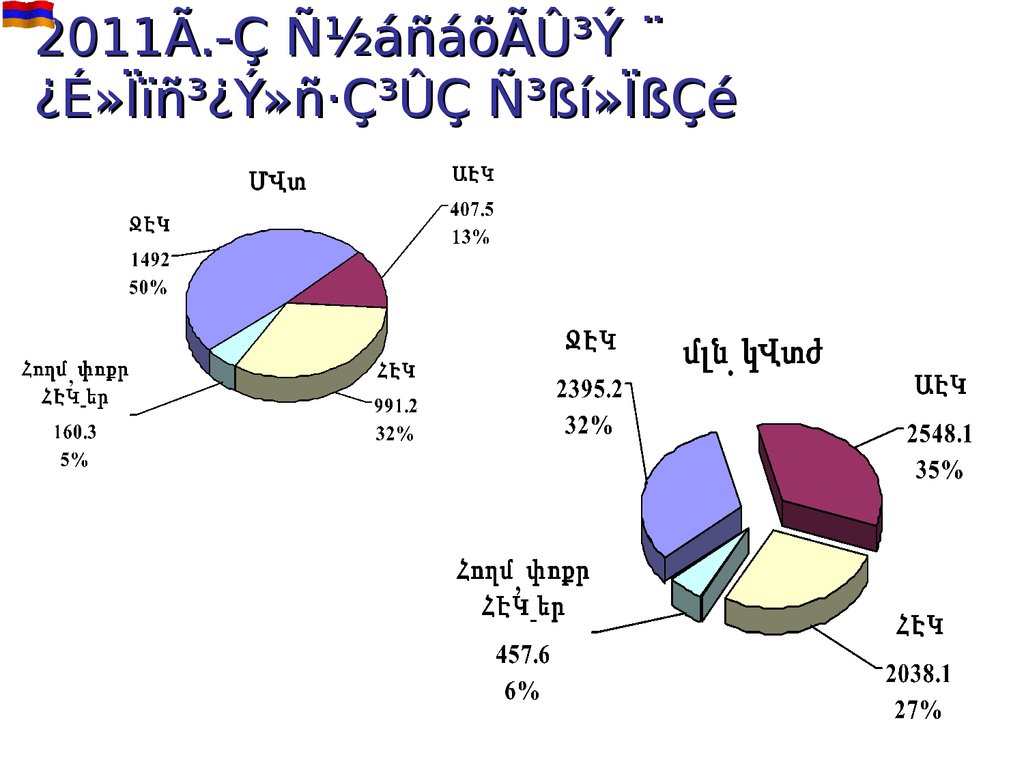
2011Ã.-Ç Ñ½áñáõÃÛ³Ý ¨¿É»Ïïñ³¿Ý»ñ·Ç³ÛÇ Ñ³ßí»ÏßÇé
21.
¾É»Ïïñ³¿Ý»ñ·Ç³ÛÇ Ñ³ßí»ÏßÇé22. Average is in Between!
• Thus one needs:• BASE, stabile, powerplants, e.g. Nuclear,
Coal. CF > 90%;
• PEAKING, a powerplant that has relatively
small capital (fixed) cost, although the
operational (variable) cost is high.
Gas-turbine. CF ~ 5%
• INTERMEDIATE, that can output variable
power. Combined cycle natural gas.
CF ~ 30% ÷ 80%.
22
23.
2324. Renewable
•Wind (CF <35%)•Solar (CF <25%)
24
25.
2526. Load leveling
• is a method for reducing largefluctuations in power demand
26
27. Load Leveling - DSM
• Demand Side Management, the task is todecrease the demand at PEAK TIMES.
• Tariff regulations:
- tariffs’ non-linear dependency on power
consumed.
- time dependency of tariffs
• Deciding the hours of operation, Chasing the
load, Real-time pricing based on forecasts
• Overall Energy Efficiency measures – wide
use of LEDs, ventilation and insulation, etc.
27
28. Elasticity
% Demand ChangeE(d) =
% of Price Change
28
29. Load Leveling - SSM
• Supply Side Management, the task is toorganize capacities to meet the demand at
PEAK TIMES.
• Need in energy generation market existence
with advanced dispatching capability.
• Deciding the hours of generation, Chasing the
load, Real-time pricing based on forecasts
• Renewable energy generation
encouragement policies.
29
30. European policy
• In 2007, the EU was importing 82% of its oil and 57% ofits gas, which then made it the world's leading importer
of these fuels.
• Only 3% of the uranium used in European nuclear
reactors has been mined in Europe. Russia, Canada,
Australia, Niger and Kazakhstan were the five largest
suppliers of nuclear materials to the EU, supplying more
than 75% of the total needs in 2009.
• In 2015, the EU imports 53% of the energy it consumes.
In January 2014, the EU agreed to a 40% emissions
reduction by 2030, compared to 1990 levels, and a 27%
renewable energy target.
30
31. Energy Market
3132. Dispatching
3233. Storage
• Hydro-Pump• Natural gas
• Thermal
• Hydrogen
33
34. Storage
3435. Load levelling – pumped hydro storage
3536. Load levelling – pumped hydro storage
3637.
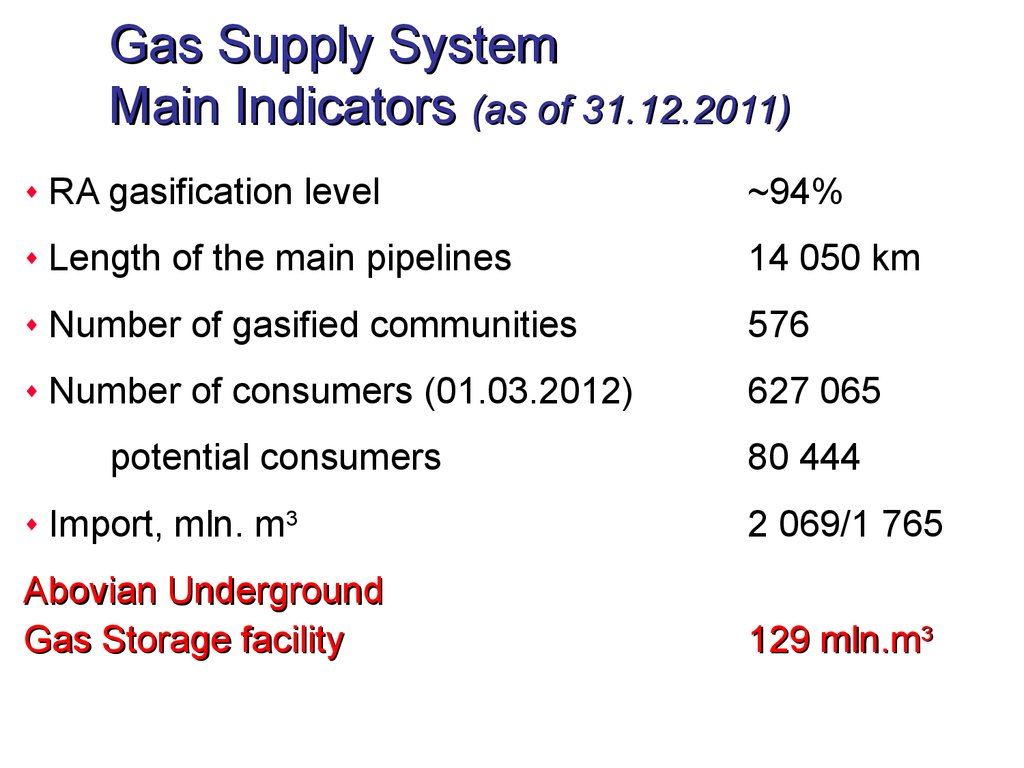
Gas Supply SystemMain Indicators (as of 31.12.2011)
RA gasification level
~94%
Length of the main pipelines
14 050 km
Number of gasified communities
576
Number of consumers (01.03.2012)
627 065
potential consumers
Import, mln. m3
Abovian Underground
Gas Storage facility
80 444
2 069/1 765
129 mln.m3
38. Load levelling – EV fleet
3839. Homework
• Problem #1, page 94 of the Shaten WB.39