


")


")
")


")


")
")


 Экономика
Похожие презентации:


")

(ge) and World Economic Relations (WER)")


")


Identity Economics….. and Inequality
1. Identity Economics….. and Inequality
Rachel E. KrantonHCEO – NES – CREC Summer School
July 2021
2. Introduction – Identity and …. Inequality
• Inequality – some people have more, some people have less.• Why do we care?
• As social scientists, we want to describe such patterns.
• But why do we concentrate on inequality as a pattern of interest?
• Maybe bad for growth, development overall.
• Maybe its unfair, unjust.
• Particularly unjust: inequality associated with social difference
• Systematic – certain social groups have more and others have less.
• Inequality is not randomly distributed.
US – blacks, Hispanics,
• Europe – North Africans, Africans, Roma
• Many parts of the world – women
3. Introduction – Social Categories
• Identity –• At a minimum a designator of a social group.
• How does identity figure into inequality??
Mere descriptors?
Part of processes and structures that create and sustain inequality?
4. Introduction – Preferences & “Identity”
Introduction – Preferences & “Identity”• What is “identity?”
• A person’s sense of self; a person’s self-image.
• How a person views him/herself and/or others view him/her.
• Note “identity” is used as a descriptor: “I am Hispanic.”
• And “identity” is used as way of feelings/emotions
“I have a strong sense of identity; I feel good about myself.”
• Judgment depends on ideals, norms a person holds for onself and
others hold for that person – depends on social norms for who you are
“I am proud to be Hispanic”
• This judgment depends on how “Hispanic” one feels, and whether
you and other Hispanics are living up to norms and ideals.
5. Introduction - “Identity”
• Identity-contingent utility/payoff function.Individuals have preferences over own and others’ actions, depending
on identity and norms
• Social categories & norms for categories
• Individuals care about own actions, depending on identity.
• Utility enhanced when abide by norms for own category.
• Individual care about others’ actions - externalities
Externality: Others suffer a utility loss (offended?) when norms are
violated.
• Externality: Others retaliate against those who break the norms – incur
a cost but restore utility loss from offense.
6. Introduction - “Identity”
• Why do we want a model with identity?• Add identity to economic framework:
Individuals make choices, interact strategically when utility
depends on identities and norms for categories
patterns of behavior
• Identity model can explain patterns that cannot be explained
(or uncomfortably explained) with standard model
• Add a new understanding to phenomena and policy
7. Outline of Lecture
•Identity & Inequality – Part 1 – Theory• Overview theoretical approaches to social norms/social differences
* Standard Models: Preferences & Constraints
* Strategic Interaction
* “Identity Economics” as a new approach
* Human capital acquisition (schooling) as an example
* Identity and Redistribution as an example
•Identity & Inequality – Part 2 – Experiments
• Experimental evidence for impact of identity on behavior
• Experiments with identity variation
• Do people have preferences for “inequality”? YES
8. Identity and Inequality Part 1 Economic Theory
Rachel E. KrantonHCEO Summer School
2021
9. Introduction – Why theory?
• Putting identity/social category markers is standard practice inempirical study of socioeconomic outcomes.
• (Dummy) variables: black, female, ethnicity, region, state
• Interaction effects: black, female, etc.
• To fix ideas – consider education
child or adolescent “underachieves” in school; does not get the
education that would be predicted by benefits and costs
• Black children in the United States
• Roma children in Hungary
• Girls in a developing country
• What can account for the dummy variables, the interaction effects?
• Unpack the black box of these effects.
10. General Overview of Theoretical Approaches
• Basic Economic Model• Individuals have utility from own choices/actions
• Idiosyncratic preferences, which are exogenous
• Technology (constraints)
choices lead to patterns of behavior
• Strategic Interaction
• Individuals have payoffs from own and others’ actions
• Idiosyncratic costs/benefits, which are exogenous
• Game form (institutions), specifying information asymmetries etc.
equilibria give patterns of behavior
• Preferences determine utilities and payoffs
• Preferences – what a person “likes” or “doesn’t like” (Becker)
• Preferences – what a person “should” or “shouldn’t do” (A&K)
• Combine with technology & constraints, strategic interaction
choices & equilibria give patterns of behavior
11. General Overview: Basic Economic Model
• Utility Function: individual w/exogenous, idiosyncratic preferences• Makes choice given technology and constraints.
• Child likes or not school (or is more or less talented at schoolwork)
• Weighs costs and benefits of schooling, given school quality and
opportunity cost of attending school, job networks,
discrimination.
• Pattern: Blacks have lower levels of academic achievement
because they attend worse schools, have worse job networks.
• Pattern: Girls have lower levels of academic achievement
because they have high opportunity cost of time (household).
• Useful, because there could be such technology, constraints.
• Begs the question why blacks attend worse schools, why women
“should” attend to household chores, why there is discrimination.
• Pushes the inequality question up one level, to what is behind the
assumptions in our models.
12. General Overview: Strategic Interaction
• Strategic Interaction:• Individual payoffs depend on own preferences and others’ actions.
• Makes choices strategically, taking into account how others’react.
• Equilibria social pattern
• Repeated game, punish those who violate the equilibrium action
• Equilibrium can be a “bad social norm”
• Signaling game, actions indicate underlying unobserved attribute
• Equilibrium is a social norm – but notice signaling costs
• Add labels – and then have a theory of an outcome
• Girls invest less in school to not have bad marriage prospects.
• Black children achieve less in school to signal more “sociable” type
(Austen-Smith & Fryer 2009)
• Blacks are not hired by firms to avoid boycott by consumers.
13. General Overview: Strategic Interaction
• Inequality is the capricious outcome of strategic interaction –• Has no social context per
• There is nothing particularly meaningful about being black, female,
North African, etc.
• This view is useful. Social norms may indeed be “bad
equilibria.” Intervention needed to change the equilibrium.
• United States civil rights law.
• But consider three basic points:
Theoretical requirements to sustain equilibria are very strong
There is much social context associated with norms –
discussions in literature, press, law, activists, etc.
People die over these issues
14. General Overview – Preferences and “Identity”
• Preferences and norms are a possible source of inequalities.• Becker: a taste-based theory of discrimination
• In the same way some people like apples and others like oranges, some people
may not want to work with Black co-workers or women.
• Workers with these tastes would require a wage premium.
• Blacks/women then have lower benefits of education
• But competition could eliminate such high-cost firms.
• Point: maybe preferences per se matter.
• Akerlof & Kranton: preferences both “likes;” and “shoulds”
• Preferences are not all idiosyncratic, rather socially derived
• Depend on peoples’ social identities
• Identity-based preferences are contested
15. Akerlof & Kranton – Identity & Preferences (Norms)
Akerlof & Kranton – Identity & Preferences (Norms)• Build a model where individuals think of themselves and other (more
or less consciously) in terms of social categories.
• People have tastes, but also norms for how people should behave.
• People have utility from own actions, and others’ actions
• people internalize norms
• punish others who violate “social code”
• Use this utility function to study schooling and minority poverty.
16. Identity – General Framework
• Start with a standard model of utility.• The utility of person j is represented as
Wj = Wj (aj, a-j)
where aj are j’s actions, a-j are others’ actions.
• The inclusion of a-j captures the possibility of externalities or
strategic interaction.
• For example:
• aj is the effort of j in school, and a-j is the effort of others in
school, which may hurt or help j’s academic achievement
17. Identity - General Framework: Utility & Identity
Identity - General Framework: Utility & Identity• Add identity ingredients
• Set of Social Categories: C.
• Individual j’s assignment of self and others to categories: cj.
• Norms, N, give appropriate behavior, ideal attributes of each
social category.
• Utility Function
Uj = Uj (aj, a-j, Ij)
aj are j’s actions, a-j are others’ actions, Ij is j’s self-image:
Ij = Ij (aj, a-j ; cj , εj , N)
where εj are j’s given attributes.
18. Identity - General Framework: Utility & Identity
Identity - General Framework: Utility & IdentityUj = Uj (aj, a-j, Ij)
Ij = Ij (aj, a-j ; cj , εj , N )
• Overall utility depends on how actions aj , a-j affect
“economic utility,” and how they affect self-image, Ij.
• Self-image (identity, Ij) depends on
• Acting as should: match between actions and category norms N
• Fitting in: match between εj and ideal of category specified by N
• Status: status of assigned category, given by Ij()
• In basic case, person j chooses aj to max utility, taking as
given category assignment (cj) own attributes (εj) norms (N).
• In general, a person could act to change own category, own
attributes, and societal norms. Third parties have incentives.
19. Example of Identity Model – Education & Schooling Akerlof & Kranton (2002)
Example of Identity Model – Education & SchoolingAkerlof & Kranton (2002)
• Basic model of education = investment in human capital
• Large population of individuals
• Each individual ni = “ability”
• Marketable Skills/Payoffs from effort choice ei and ability:
vi = ni ei – k(ei)
• Optimal effort (schooling level) balances benefits and effort costs
• Not a good model of children or adolescents
• Identity model makes the child/adolescent the decision-maker
• Considers their motives and interactions – US high school
20. Example of Identity Model – Education & Schooling Akerlof & Kranton (2002)
Example of Identity Model – Education & SchoolingAkerlof & Kranton (2002)
• Large population of individuals
• Each individual exogenously given ni = “ability”
• Marketable Skills/Payoffs from ability and effort choice ei :
vi = ni ei – k(ei)
• Each individual has a second exogenously given characteristic
• li = “looks” ;
i.i.d. uniform on [0,1]
• Social Categories: C = {Leading Crowd, Nerds, Burnouts}
• Norms/Ideals: l=1 for Leading Crowd, n =1 for Nerds
• Norms/Ideals: e(N) > e(L) > e(B)
• Identity utilities depend on category, effort, and fit with Ideal
• Ic – t (1 – εi(c)) – ½ (ei – e (c))2
• I L > IN > IB
21.
Example of Identity Model – Education & SchoolingAkerlof & Kranton (2002)
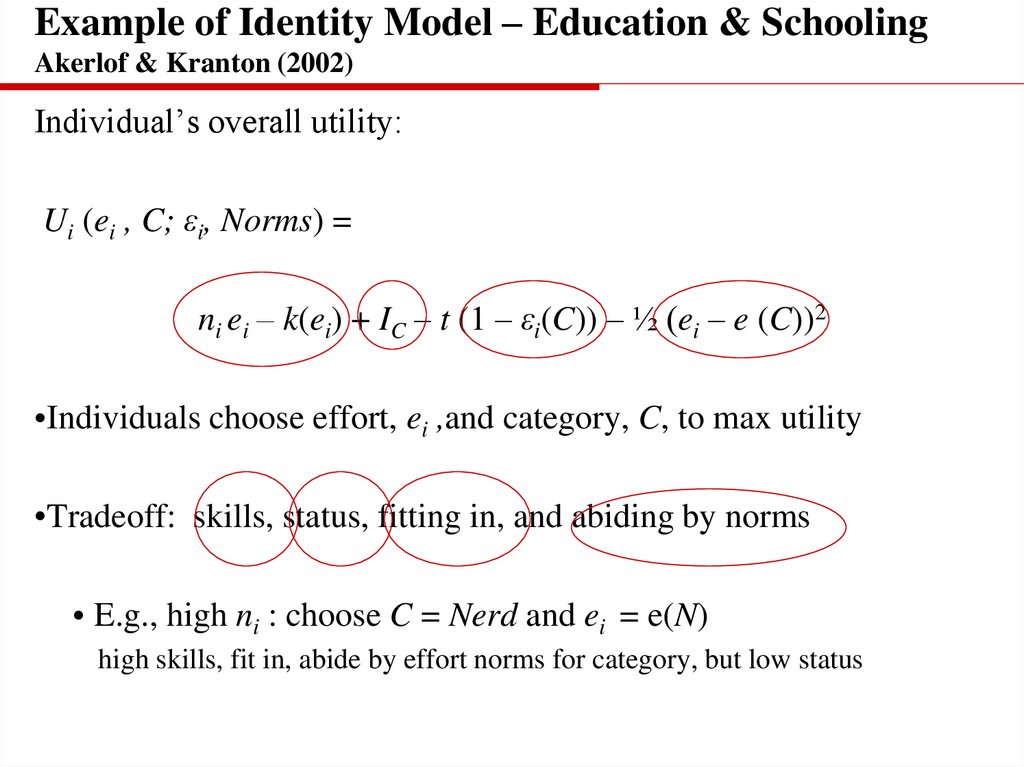
Individual’s overall utility:
Ui (ei , C; εi, Norms) =
ni ei – k(ei) + IC – t (1 – εi(C)) – ½ (ei – e (C))2
•Individuals choose effort, ei ,and category, C, to max utility
•Tradeoff: skills, status, fitting in, and abiding by norms
• E.g., high ni : choose C = Nerd and ei = e(N)
high skills, fit in, abide by effort norms for category, but low status
22.
Example of Identity Model – Education & SchoolingAkerlof & Kranton (2002)
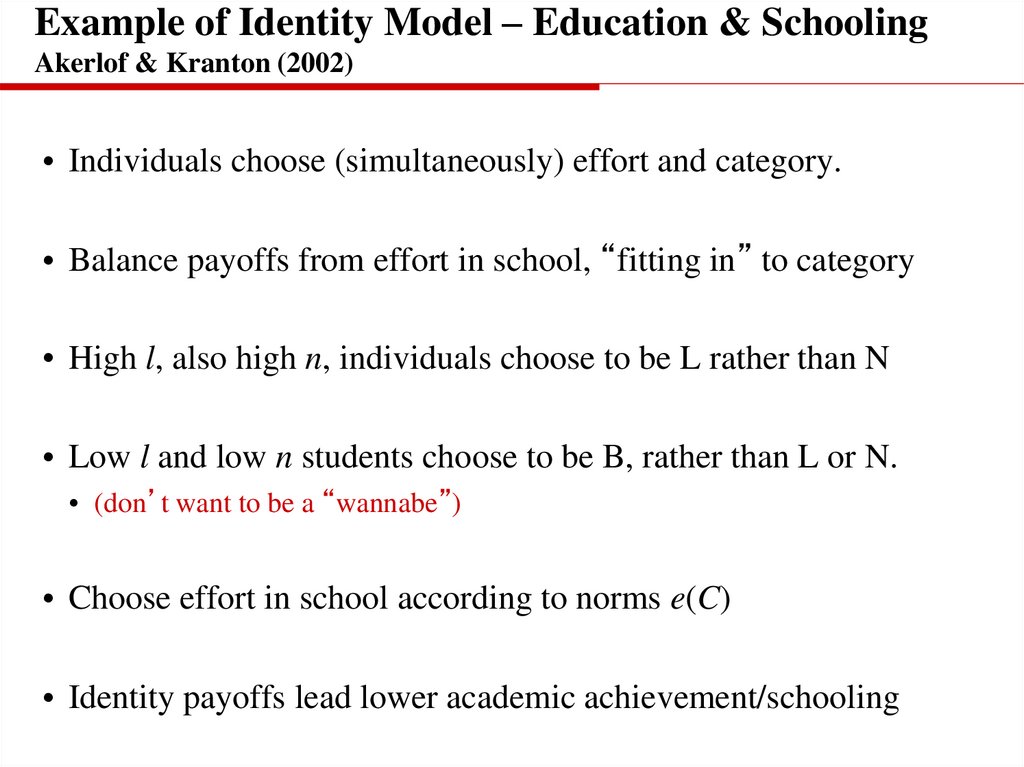
• Individuals choose (simultaneously) effort and category.
• Balance payoffs from effort in school, “fitting in” to category
• High l, also high n, individuals choose to be L rather than N
• Low l and low n students choose to be B, rather than L or N.
• (don’t want to be a “wannabe”)
• Choose effort in school according to norms e(C)
• Identity payoffs lead lower academic achievement/schooling
23.
Example of Identity Model – Education & SchoolingAkerlof & Kranton (2002)
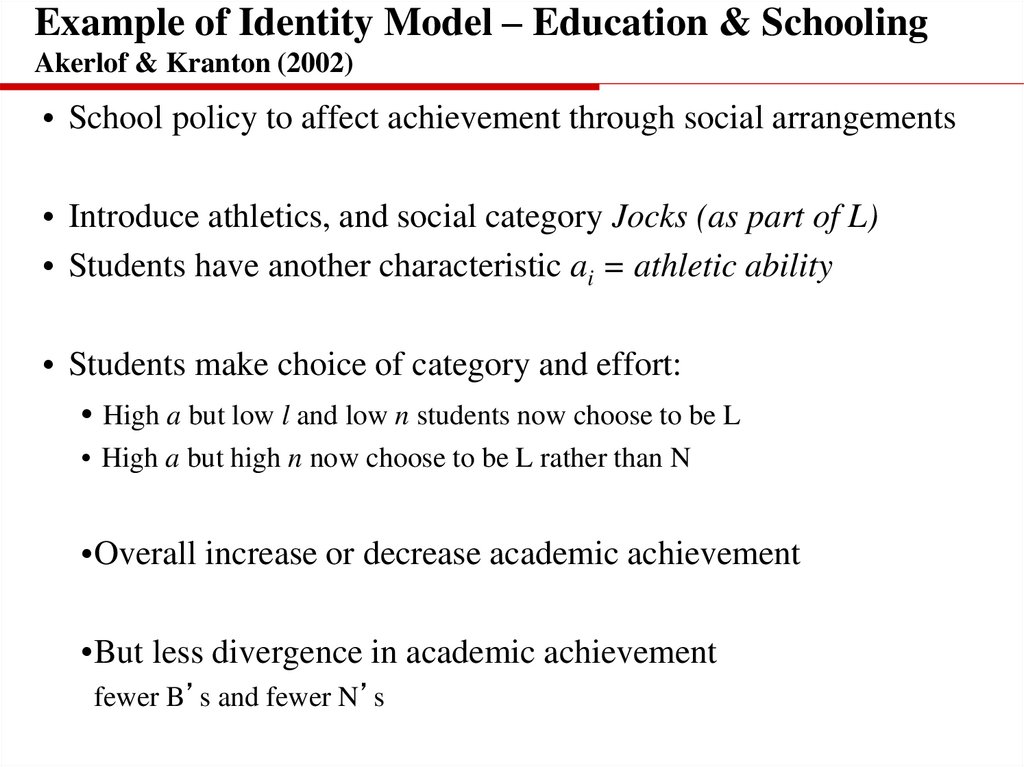
• School policy to affect achievement through social arrangements
• Introduce athletics, and social category Jocks (as part of L)
• Students have another characteristic ai = athletic ability
• Students make choice of category and effort:
• High a but low l and low n students now choose to be L
• High a but high n now choose to be L rather than N
•Overall increase or decrease academic achievement
•But less divergence in academic achievement
fewer B’s and fewer N’s
24.
Example of Identity Model – Education & SchoolingAkerlof & Kranton (2002)
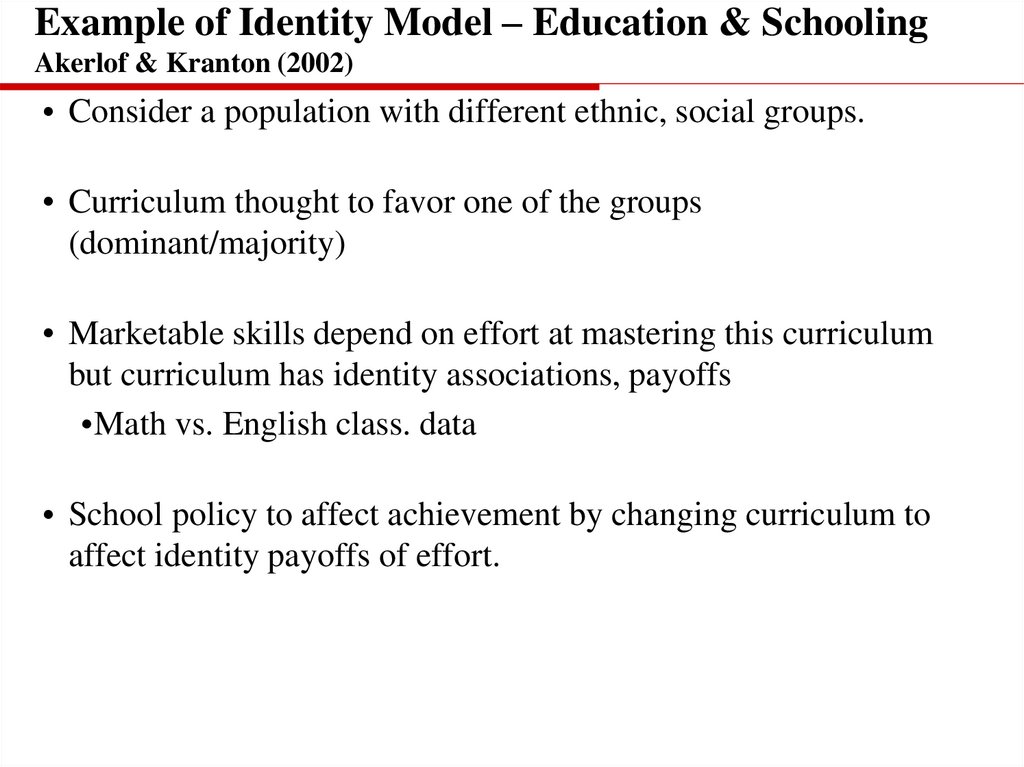
• Consider a population with different ethnic, social groups.
• Curriculum thought to favor one of the groups
(dominant/majority)
• Marketable skills depend on effort at mastering this curriculum
but curriculum has identity associations, payoffs
•Math vs. English class. data
• School policy to affect achievement by changing curriculum to
affect identity payoffs of effort.
25.
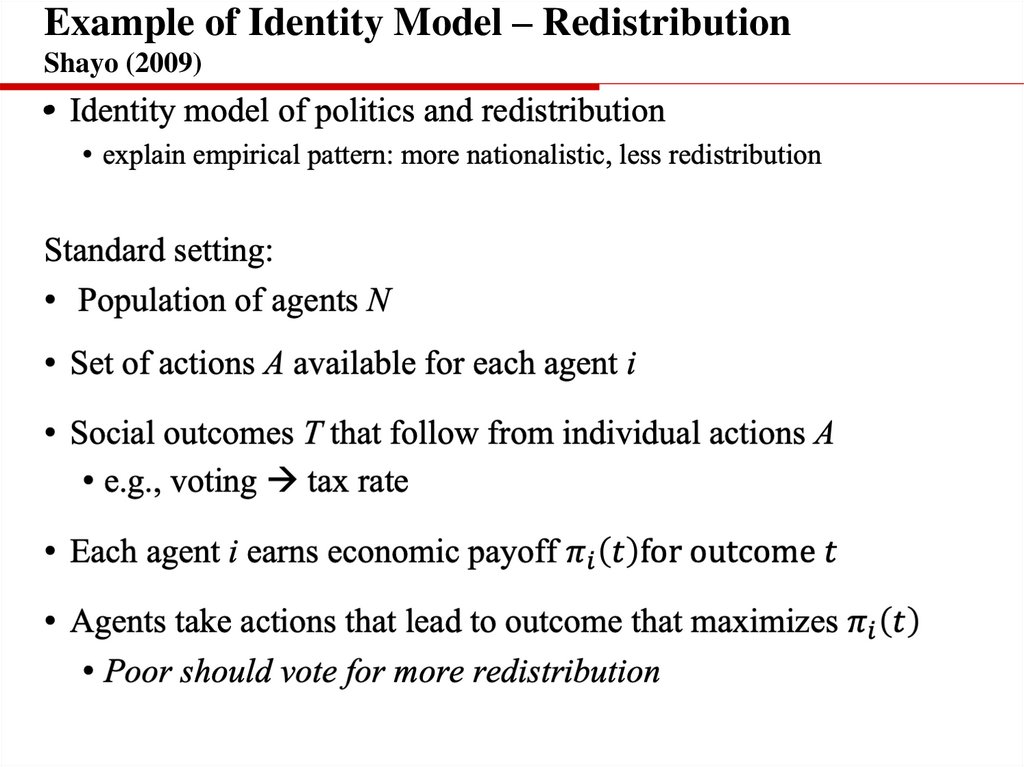
Example of Identity Model – RedistributionShayo (2009)
26.
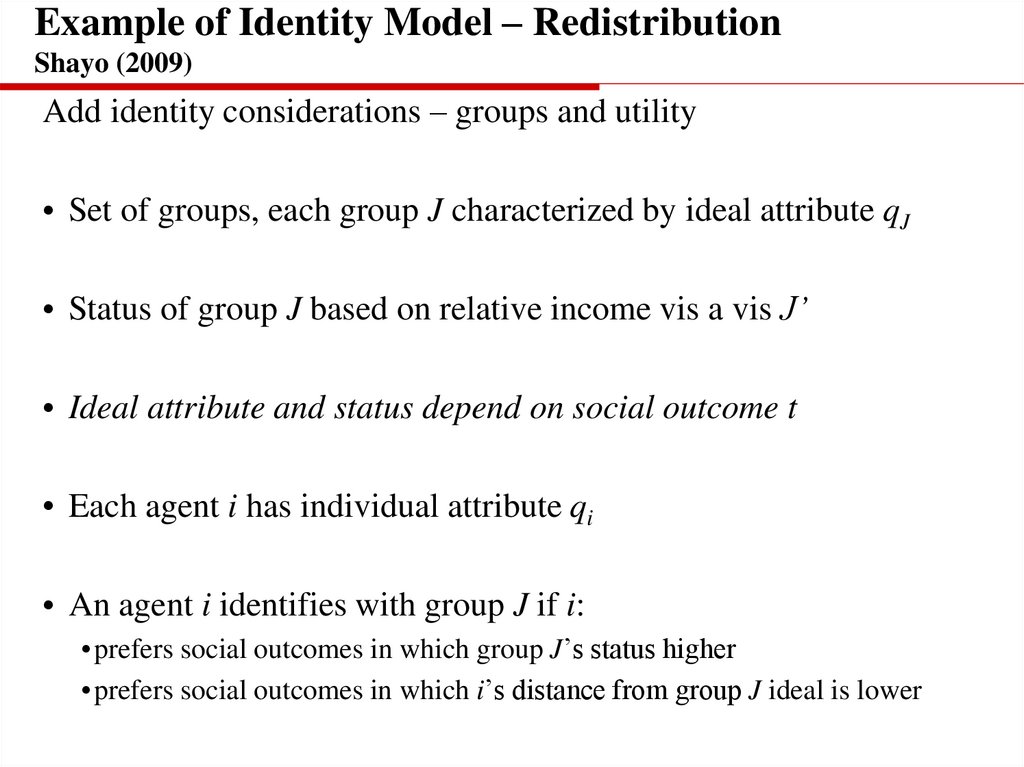
Example of Identity Model – RedistributionShayo (2009)
Add identity considerations – groups and utility
• Set of groups, each group J characterized by ideal attribute qJ
• Status of group J based on relative income vis a vis J’
• Ideal attribute and status depend on social outcome t
• Each agent i has individual attribute qi
• An agent i identifies with group J if i:
• prefers social outcomes in which group J’s status higher
• prefers social outcomes in which i’s distance from group J ideal is lower
27.
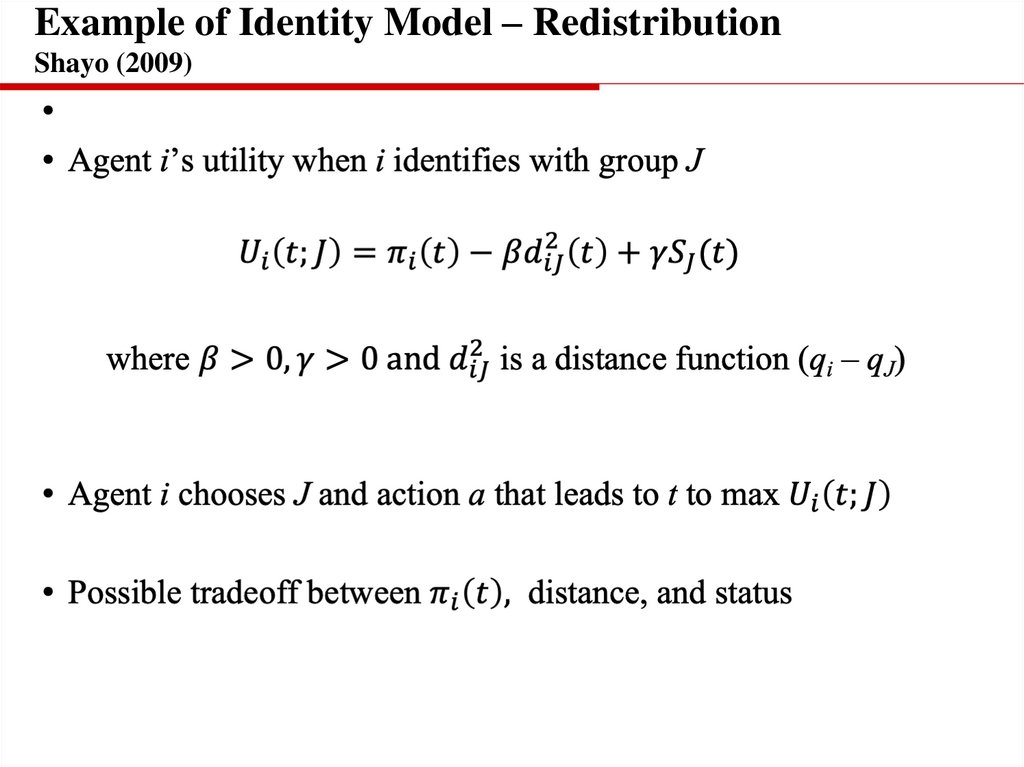
Example of Identity Model – RedistributionShayo (2009)
28.
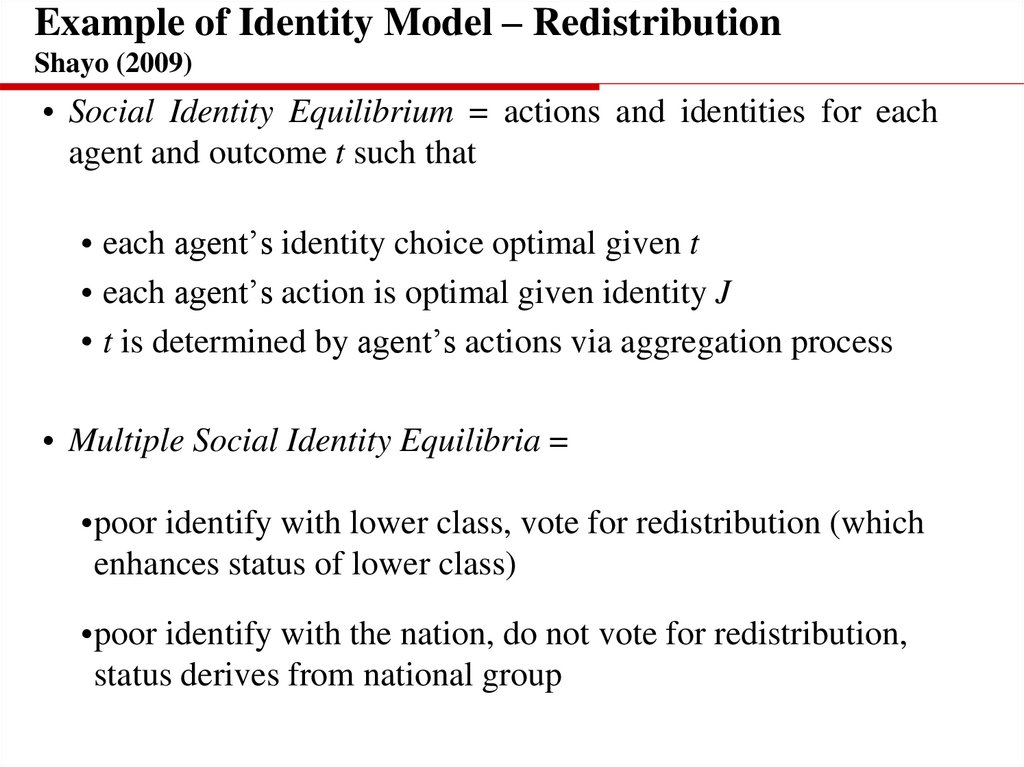
Example of Identity Model – RedistributionShayo (2009)
• Social Identity Equilibrium = actions and identities for each
agent and outcome t such that
• each agent’s identity choice optimal given t
• each agent’s action is optimal given identity J
• t is determined by agent’s actions via aggregation process
• Multiple Social Identity Equilibria =
•poor identify with lower class, vote for redistribution (which
enhances status of lower class)
•poor identify with the nation, do not vote for redistribution,
status derives from national group
29. Identity and Inequality Part 2 Economic Experiments
Rachel E. KrantonHCEO Summer School
2021
30. Experiments with Social Groups, Identity
• Do people behave differently (towards others) depending onidentity/social group?
• Experiments where social category/identity is research objective
• Own Actions – do people have different behavior when
identity is “salient”
• Strategic Play – do people play differently depending on
identity/social group?
Social Preferences (fairness, inequity aversion)
Do people have preferences for inequality? YES
• Challenge is to design experiments with social group variation.
• Real-world groups – different ethnicity, club membership
• Preserve anonymity to avoid repeated game effect
• Create groups in the lab.
31. Experiments: Own Behavior
• “Stereotype Threat”• Steele & Aronson (1995)
• Incentives and Stereotype Threat?
• “Discrimination, Social Identity and Durable Inequality
Hoff & Pandey (2006)
• Children in India, paid to solve mazes – piece rate
• Three conditions –
anonymous, caste revealed integrated, caste revealed segregated
• Lower caste subjects completed fewer mazes in both caste
revealed conditions relative to control
32. Experiments: Strategic Games
“Discrimination in a Segmented Society” Fershtman & Gneezy (2001)•Objective: test for “taste for discrimination” vs. “stereotypes”
•Do people discriminate per se or are they concerned about actions
others will stereotypically take?
•Israeli Jewish students – European vs. Eastern origin (last name)
•Trust game – sent less to Eastern (though return about the same)
•Dictator game – sent about the same to both types
•Ultimatum game – sent more to Eastern (“concern for respect”?)
•Trust result only for males.
33. Experiments: Social Preferences
• Social Preferences = value placed on other’s incomeMany experiments where subjects allocate income to self
and to others. E.g., i chooses top or bottom row
Show inequity aversion, social welfare max.
People not only self-interested.
Fehr & Schmidt (1999), Bolton & Ockenfels (2000), Andreoni & Miller
(2002), Charness & Rabin (2002)
34. Reality Check on Social Preference Experiments
• Group conflict feature of human history• Groups defined on religion, “race,” nationality, culture
• NOT inequity averse: Forcibly extract labor, resources from others
• Country and regional borders, civil wars, alternative identities
35. Experiments: Group Conflict, Identity, Social Prefer
• Social Psychology Experiments (1950’s – 1970’s)Robbers Cave (Sharif & Sharif)
Minimal Group Experiments (Tajfel & Turner)
• Social Preferences and Groups – Chen & Li (2009)
• Minimal Groups
•Allocate income to self and others
• in-group vs. out-group
• Results: less inequality averse to those in other group
36. Social Preferences Estimation
• Ui( i, j) = i i + i( i j)r + i( j i)s• i weight on own income
• i weight on income difference for i > j (r = 1; s = 0)
• i weight on income difference for i ≤ j (r = 0; s = 1)
37. But what about ubiquitous group conflict??
• Group conflict feature of human history• Groups defined on religion, “race,” nationality, culture
• NOT inequity averse: Forcibly extract labor, resources from others
• Country and regional borders, civil wars, alternative identities
38. “Deconstructing bias in social preferences reveals groupy and not-groupy behavior”
Rachel Kranton, Matthew Pease, Seth Sanders, Scott HuettelPNAS (2021)
39. “Deconstructing Bias” – Introduction
• Maybe stronger identification with group ?• Do people who identify more with a group engage in
discriminatory behavior?
• Findings: No ..... but
• Groupy vs. Non-Groupy Individuals
Some people have no ingroup bias – same towards everyone
Some people have strong ingroup bias - destructive
(consistent with average of “inequity averse”)
tendency for ingroup bias could be individual tendency
…..Individual correlates of groupy/not groupy ?
…. Settings/information change behavior towards others?
40. “Deconstructing Bias” – Introduction
• Two conditions: minimal group, political group – w/i subject• Individuals: more or less identify with assigned group
• Replicate ingroup bias on average, but large heterogeneity
Groupy vs. Not Groupy individuals
41. “Deconstructing Bias” – Overview of Experiment
• Duke University subject pool - no deception lab• Schematic of experimental session:
Instructions
3-5 minutes
Asocial Control
52 Choices
12 minutes
Minimal or Political Group
Treatment
Survey
2-5 minutes
78 Choices
17 minutes
Minimal or Political Group
Treatment
Survey
2-5 minutes
78 Choices
17 minutes
Post-experiment
Survey
10 minutes
• Paid for one choice in each – control, MG, POL group
42. “Deconstructing Bias” – Overview of Political Treatment
• Political Group: participants self-identified asDemocrat
Republican
Independent None of the Above
closer to Dem
closer to Rep
Democrats
Republicans
D-Leaning Ind
R-Leaning Ind
43. “Deconstructing Bias” – Details of Experimental Task
• Allocation choices, timed as follows:YOU
+
1-10 sec
OTHER
140
40
120
120
2 sec
YOU
OTHER
140
40
120
120
up to 10
sec
• 26 matrices, 26x7 = 208 decisions per subject
• Top, bottom, green, blue, left, right: all randomized
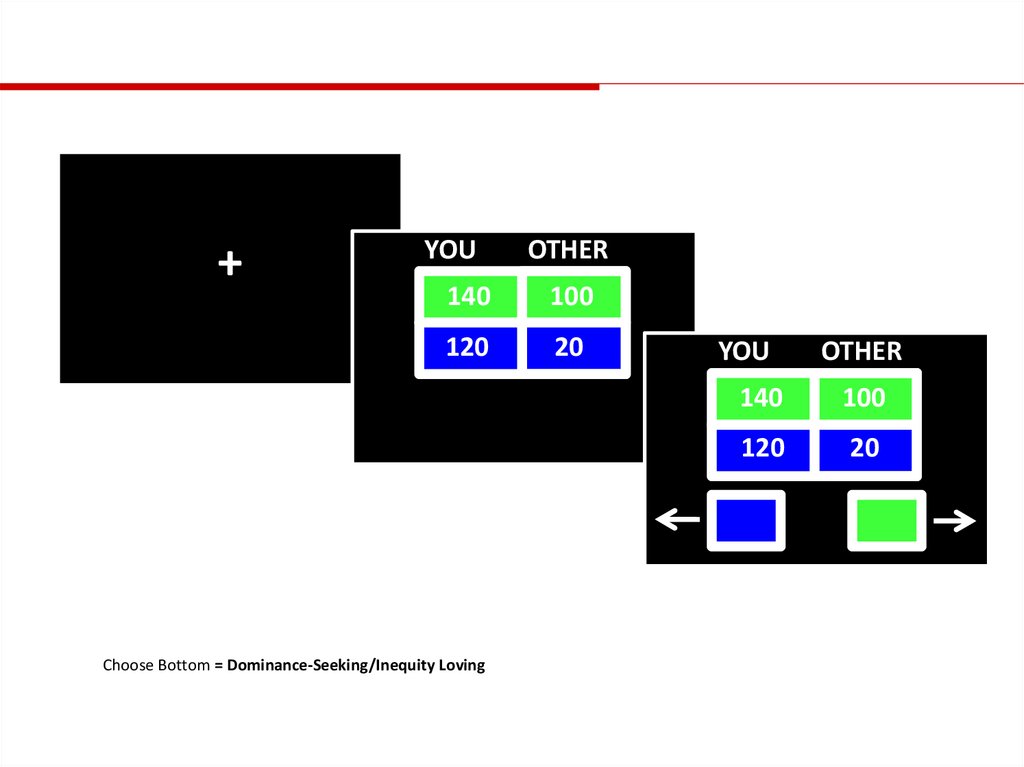
44.
+YOU
OTHER
140
100
120
20
Choose Bottom = Dominance-Seeking/Inequity Loving
YOU
OTHER
140
100
120
20
45. “Deconstructing Bias” – Basic Results - Favoritism
• Consider individual “favoritism” in allocating incomeFor an individual i in condition g, for a given matrix m:
YOU
OWN
YOU
140
100
140
100
120
20
120
20
OTHER
yes
Income given to own –
E.g., (100 –
Income given to other
20)
Average across m gives “favoritism” for individual i in g
i’s favoritism in g = MG, and i’s favoritism in g = POL
46. “Deconstructing Bias” – Basic Results - Favoritism
Favoritism towards IngroupDifferences in Points Given
Minimal Group
Minimal Group (Ingroup minus Outgroup)
Favoritism
Ingroup
Differencestowards
in Points Given
Political Political
Group (IngroupGroup
minus Outgroup)
60
60
40
40
20
20
0
0
-20
-20
-40
Overall
Democrats
D-Independents
Note: Median is white line; Mean is white diamond; 95% CI around mean is dashed wiskers
All
Democrats
13.19
(1.89)
△: 7.36
(3.08)
D-Indep
yes
-40
Overall
Democrats
D-Independents
Note: Median is white line; Mean is white diamond; 95% CI around mean is dashed wiskers
All
5.83
(2.15)
Democrats
8.14
(1.85)
△ △ : 0.6
(2.6)
△: 6.76
(2.81)
D-Indep
1.38
(1.39)
47. “Deconstructing Bias” – Basic Results - Favoritism
450 POL= MGGroupy
Not Groupy:
Correlation 0.63
Linear Regression R2 = 0.4
48. “Deconstructing Bias” – Social Preferences (replication)
• Ui( i, j) = i i + i( i j)r + i( j i)s• i weight on own income
• i weight on income difference for i > j (r = 1; s = 0)
• i weight on income difference for i ≤ j (r = 0; s = 1)
49. “Deconstructing Bias” – Individual Social Preferences
• Individual Estimates – Mixing Model• estimate ( t , t , t ) for given number of “types” t = 1, … n.
• estimate for t = 4
• (just enough, 5 does not give much more precision)
•*data* gives parameters of “types” & % of pop of each type
• Given “types,” categorize each individual as a type
• each individual has a type in each treatment and for each pairing
• Identify groupy vs. non-groupy individuals –
• not groupy = same utility type own v.s other
• groupy = different utility type own vs. other
50. “Deconstructing Bias” – Groupy/Non-groupy Individuals
Cross Tabulations of Subjects’ Types• Diagonal = non-groupy – same preferences toward in and outgroup
• Off – diagonal = groupy – distinguish between in and outgroup
• Dominance seeking vis a vis Other
51. “Deconstructing Bias” – Groupy/Non-groupy Individuals
Figure 9: Response Time Selfish Type POL You-Other1.5
Seconds
2
2.5
3
3.5
Groupy vs. Not Groupy
0
5
Utility Utility
Difference
10
Not Groupy
Groupy
15
52. “Deconstructing Bias” – Groupy/Non-groupy Correlates
Groupy(N=85)
Not Groupy
(N=48)
P-Val
Female
African American
Born in United States
65%
19%
85%
65%
19%
78%
0.98
0.99
0.32
Mostly Distrust Strangers
No Religious Attendance
Political Party
Republican
Democrat
Political Independent *
68%
23%
69%
29%
0.95
0.42
14%
54%
32%
13%
40%
48%
0.44
0.11
0.06
Lived with Both Parents
Mother Advanced Degree
Father Advanced Degree **
74%
35%
48%
83%
46%
69%
0.22
0.24
0.02
53. “Deconstructing Bias” – Groupy/Non-groupy Correlates
• Groupiness correlated “real-world” behavior/demog• Political affiliation
• In the main study and in follow up M-Turk study
• Regional differences (Mturk)
• Republicans in Deep South
• Decline in jobs from manufacturing (selection?)
54. “Social contagion of ethnic hostility” (PNAS, Bauer et. al. 2018)
• PNAS, Bauer et. al. 2018• Study of destructive behavior “Joy of Destruction” game
• Two counterparts each receive €2.
• Simultaneously choose to pay €0.20 to reduce other’s income by €1.
• Comparison of behavior towards majority or minority co-ethnic
counterpart
• Slovak vs. Roma counterpart
• Slovak high school student participants
• Counterpart was Same (Slovak) or Other (Roma)
(distant school, last name indicator)
• Comparison of behavior when others’ choices observed or not
• Three participants, decisions made sequentially vis à vis counterparts
• One of three decisions was implemented
55. “Social contagion of ethnic hostility” (PNAS, Bauer et. al. 2018)
• Results – large influence of peers’ behavior• First movers Destructive or Peaceful uncorrelated with observable charact.
• First and second movers greatly influenced later choices
• Influence more than double when counterpart was Roma
56. Empirical work on identity
• What “identity effects” can we observe in data?• With emphasis on inequality…..
•Two studies – gender, ethnic/religious conflict
•Research innovatively exploiting data sets.
57. Empirical work on the identity
“Gender Identity and Relative Income within Households”Bertrand, Kamenica & Pan (2013)
•Gender norms in US = women shouldn’t earn more than men
•US administrative data, US Census data
•Distribution of share of household income earned by wife
exhibits a discontinuity at ½.
•When a randomly chosen woman becomes more likely to earn
more than a randomly chosen man, marriage rates decline.
58. Empirical work on the identity
“Persistent Antimarket Culture: A Legacy of the Pale ofSettlement after the Holocaust” Grosfeld, Rodnyansky &
Zhuravskaya (2013)
•Voting patterns, attitudes towards markets relate to pre-WWII
Jewish population in area in Russia.
•People who lived in separated communities developed
animosities toward each other, and opposite values.
•Region = either side of Pale of Settlement
•Jews deported/killed during WWII – no Jews left
•Difference in attitudes on different sides of the border
59. Summary & Directions for Future Research
Summary & Directions for Future Research• Social groupings are important features of patterns of inequality.
• Theories give different implications for policy.
• In a model of individual choice, people from different groups face different
constraints, technology. Necessarily have worse outcomes.
• Policies- remove constraints, improve technology.
• In a model of strategic interaction, there can be equilibria where people from
different groups have worse outcomes.
• Policies – law, collective action to change equilibrium.
• In a model where preferences and identity norms are key, people from
different groups may have different outcomes due to norms, preferences,
social exclusion, social/strategic interactions.
• Policies – change social arrangements, social meanings of action, categories
and norms . .
60. Summary & Directions for Future Research
Summary & Directions for Future Research• Social groupings are important features of patterns of inequality.
• Theory: Develop deeper theory as to how norms, categories
emerge and evolve.
• Experiments: field studies/geographic variation – how do different
norms/identity play out in different places ?
• Empirics: use of “natural experiments” to find “exogenous”
variation - also possible interplay between experiments and survey
data?