


 Политика
Похожие презентации:


")


Brexit, what Brexit? Euro area portfolio exposures to the United Kingdom since the Brexit referendum
1.
Working Paper SeriesDaniel Carvalho, Martin Schmitz
Brexit, what Brexit? Euro area
portfolio exposures to the United
Kingdom since the Brexit referendum
No 2734 / September 2022
Disclaimer: This paper should not be reported as representing the views of the European Central Bank
(ECB). The views expressed are those of the authors and do not necessarily reflect those of the ECB.
2.
AbstractWe study euro area investors’ portfolio adjustment since the Brexit referendum in terms of securities issued in the UK or denominated in pound sterling, in the context of heightened policy uncertainty
surrounding the exit process of the UK from the EU. Our sector-level analysis “looks-through” holdings of investment fund shares to gauge euro area sectors’ full exposures to debt securities and listed
shares. Our key finding is the absence of a negative “Brexit-effect” for euro area investors, which
would have rendered UK-issued and pound-denominated securities generally less attractive. Instead,
we observe that euro area investors increased their absolute and relative exposures to UK-issued and
pound-denominated debt securities since the Brexit referendum. The analysis also reveals an increase
in the euro area’s exposure to listed shares issued by UK non-financial corporations, while the exposures to shares issued by UK banks declined. These findings should be seen against the backdrop
of low yields on euro area debt securities and a strong recovery in UK share prices since the Brexit
referendum, which appear to have largely outweighed the uncertainties associated with Brexit.
Keywords: Bilateral portfolio holdings, investment funds, cross-border investment, sovereign debt
JEL Classification: F30, F41, G15
ECB Working Paper Series No 2734 / September 2022
1
3.
Non-technical summaryThis paper analyses euro area investors’ portfolio adjustment since the Brexit referendum in terms of
securities issued in the United Kingdom (UK) or denominated in pound sterling (GBP), in the context
of heightened policy uncertainty surrounding the exit process of the UK from the EU. Our sector-level
analysis “looks-through” holdings of investment fund shares to gauge euro area investors’ full exposures
to debt securities and listed shares, while also accounting for heterogeneity across euro area investor
sectors. Such granularity is pivotal, for instance, due to the differentiated behaviour that sectors show in
response to returns.
Our key finding is the absence of a negative “Brexit-effect” for euro area investors, which would
have rendered UK-issued and GBP-denominated securities generally less attractive. In fact, quite to
the contrary – and in contrast to developments in trade between the two economic areas – euro area
investors have increased their exposures since 2016. In terms of direct financial transactions, the picture
is dominated by euro area investment funds, which recorded large net purchases of UK-issued and GBPdenominated debt securities and listed shares since the Brexit referendum. This highlights the usefulness
of determining the indirect holdings via investment funds of the other euro area investor sectors, in order
to have a comprehensive view on their exposures to the UK or to the GBP.
Descriptively, we observe that euro area investors increased their exposures to UK debt securities and
listed shares since the Brexit referendum (often through indirect holdings via investment funds), which is
line with the overall cumulated net current account deficit the UK recorded in the period, mostly financed
by portfolio investment. These findings are, to a large extent, corroborated by our regression framework,
which analyses how euro area exposures to UK-issued securities and GBP-denominated securities evolved
in comparison to the rest of the securities portfolio. As regards debt securities issued by UK residents,
we find that all euro area sectors increased their relative exposures vis-à-vis the UK, both for securities
denominated in pound sterling and euro. For households in particular, this is driven by indirect holdings
via investment funds. The increase in holdings of UK-issued and GBP-denominated debt securities by euro
area investors may have been driven by the very low yields on euro area-issued and euro-denominated debt
since the Brexit referendum, as well as the increasing spread between UK-issued and GBP-denominated
debt, in the context of the Eurosystem’s asset purchase programme.
Our regression analysis also reveals an increase in the euro area’s relative exposure to UK-issued and
GBP-denominated listed shares – in particular for those issued by UK non-financial corporations – which
was likely supported by the recovery in UK share prices following the initial drop after the referendum.
ECB Working Paper Series No 2734 / September 2022
2
4.
On the other hand, there has been for most euro area sectors a significant reduction in exposures to UKbank shares since the Brexit referendum.
ECB Working Paper Series No 2734 / September 2022
3
5.
1Introduction
Roughly three and a half years since, in June 2016, British voters voted for the UK to leave the European
Union, Brexit finally took place. And yet, a number of areas of the future relationship between London
and Brussels remain to be properly addressed, including the legal aspects that regulate the operations
of the financial industry – see, for instance, Armour (2017) on the different legal options associated with
a soft and a hard Brexit, and the likely consequences to the UK’s financial services industry, as well as
to the remaining 27 members of the EU. In the meantime, the press reports about relocation efforts of
some financial corporations from the UK to mainland Europe, and that a number of cities, such as Paris,
Frankfurt and Amsterdam, have been fighting for the spoils (Stafford, Khan, and Keohane, Stafford
et al.).
The main goal of this paper is to study how euro area investors adjusted their portfolio holdings since
the Brexit referendum until end 2020. Specifically, it seeks to determine whether euro area investors
rebalanced their portfolios away from securities issued in the UK or denominated in pound sterling, in
the context of heightened policy uncertainty surrounding the process of the UK leaving the EU, which
translated into volatility in financial markets. Using a novel approach developed by Carvalho (2022) and
Carvalho and Schmitz (2021), the analysis “looks-through” holdings of investment fund shares to gauge
euro area sectors’ full exposures to securities issued by UK entities, as well as securities issued in pound
sterling, splitting euro area holdings between direct and indirect (via investment funds) exposures to debt
securities and listed shares. Our analysis also accounts for heterogeneity across euro area investor sectors.
Such granularity is pivotal due to the differentiated behaviour that sectors have in response to returns
– see, for instance, Adrian and Shin (2010), Adrian and Shin (2013), Timmer (2018) and Bergant and
Schmitz (2020) – as well as the different needs to comply with certain regulatory requirements.1 Moreover,
there is a high heterogeneity across sectors regarding their direct and indirect exposures to securities. For
instance, a significant share of pension funds’, insurance companies’ and households’ overall exposures is
attained via investment fund shares, while banks’ exposures are mostly via direct holdings.
Our study contributes to the specific strand of the literature dedicated to the assessment of the
impact of Brexit on the UK and European economies, which encompasses several different approaches
and perspectives.2 A number of contributions have resorted to dynamic general equilibrium models to
gauge the welfare costs of exiting the EU. Writing not long after the referendum, Van Reenen (2016)
focuses mainly on the likely adverse effects of Brexit on trade, due to higher trading costs with European
1 For other studies, which explore sectoral patterns, see, for instance, Bergant et al. (2020), Giofré (2013), Roque and
Cortez (2014), Galstyan et al. (2016), Boermans and Vermeulen (2019) and Galstyan and Velic (2018).
2 See Sampson (2017) for a survey of this literature.
ECB Working Paper Series No 2734 / September 2022
4
6.
partner countries, which amount to about half of the UK’s trade, but also on foreign direct investment(FDI), immigration and regulation, and estimates welfare losses in a range of 1.3 to 2.6%.3 Bruno et al.
(2017) focused specifically on the consequences of Brexit for FDI and estimate that Brexit would lead to
a drop of 22% in the UK’s inward FDI (see also Dhingra et al. (2016)). Finally, focusing on the financial
market reactions to Brexit, Belke et al. (2018) investigate the interaction between UK policy uncertainty
and UK financial market volatility in a time-varying framework as well as spillover-effects to European
financial markets.
Our study also contributes to a broader literature that has analysed bilateral portfolio investment
exposures and portfolio shifts. Earlier studies documented the existence of home bias – for instance,
Sørensen et al. (2007), Bertaut and Kole (2004) and Ahearne et al. (2004). Subsequent studies – such as
Portes et al. (2001), Portes and Rey (2005), Lane and Milesi-Ferretti (2008) and Okawa and Van Wincoop
(2012) – showed that, similarly to trade in goods, gravity effects are determinants of international finance.
These factors also helped to explain the adjustment patterns in bilateral portfolio investment positions
during the global financial crisis (Galstyan and Lane, 2013). Of particular importance to our paper is that
this literature has established that political and economic integration among economies is an important
determinant of bilateral exposures, contributing to higher levels of financial integration – see, among
others, Lane and Milesi-Ferretti (2008), Galstyan et al. (2016) and, in the euro area’s case, Lane (2006)
and Lane and Milesi-Ferretti (2005). Along these lines, Brexit provides for an interesting case-study of
the reverse situation, i.e. of potential disintegration dynamics.
Our key finding is the absence of a negative “Brexit-effect” for euro area investors, which would have
rendered UK-issued and GBP-denominated securities generally less attractive. In terms of direct financial
transactions, the picture is dominated by euro area investment funds, which recorded large net purchases
of UK-issued and GBP-denominated debt securities and listed shares since the Brexit referendum. This
highlights the usefulness of determining the indirect holdings via investment funds of the other euro area
investor sectors, in order to have a comprehensive view on the exposures to the UK.
Descriptively, we observe that euro area investors increased their exposures to UK debt securities and
listed shares since the Brexit referendum (often through indirect holdings via investment funds), which is
3 Steinberg (2019) finds that the total consumption-equivalent welfare cost of Brexit for UK households is between 0.4
and 1.2%, of which less than a quarter of a percent of this cost is due to uncertainty. In their baseline scenario, which
contemplates the UK and the EU raising both trade and FDI costs by 5 percentage points, McGrattan and Waddle (2020)
find welfare losses of 1.4 and 2.3 percent for UK and EU citizens, respectively. Using a trade model with 31 industries and
35 countries, Dhingra et al. (2017) conclude that the efficiency losses associated with higher trade barriers (including tariff,
nontariff and potential future reductions in trade costs among EU countries) surpass the UK’s net fiscal contribution to the
EU’s budget. What is more, they find that leaving the EU will lead to a 1.3% permanent drop in consumption per capita
in an optimistic scenario – in which the UK maintains access to the Single Market – and 2.7% in an adverse scenario – in
which it follows general World Trade Organization rules. In turn, Born et al. (2019) resort to synthetic control methods to
show that the decision to leave the EU has cost the UK an output loss of 1.7% to 2.5% by year-end 2018.
ECB Working Paper Series No 2734 / September 2022
5
7.
line with the overall cumulated net current account deficit the UK recorded in the period, mostly financedby portfolio investment. These findings are, to a large extent, corroborated by our regression framework,
which analyses how euro area exposures to UK-issued securities and GBP-denominated securities evolved
in comparison to the rest of the securities portfolio. As regards debt securities issued by UK residents,
we find that all euro area sectors increased their relative exposures vis-à-vis the UK, both for securities
denominated in pound sterling and euro. For households in particular, this is driven by indirect holdings
via investment funds. The increase in holdings of UK-issued and GBP-denominated debt securities by euro
area investors may have been driven by the very low yields on euro area-issued and euro-denominated debt
since the Brexit referendum, as well as the increasing spread between UK-issued and GBP-denominated
debt, in the context of the Eurosystem’s asset purchase programme. Our regression analysis also reveals
an increase in the euro area’s relative exposure to UK-issued and GBP-denominated listed shares – in
particular for those issued by UK non-financial corporations – which was likely supported by the recovery
in UK share prices following the initial drop after the referendum. On the other hand, there has been,
for most euro area sectors, a significant reduction in exposures to UK bank shares since the Brexit
referendum.
The results of this paper are consistent with the perspective that, in relation to Brexit, euro area
investors displayed a momentum-investment and return-chasing behaviour. At the same time, it is also
in line with the uncovered equity parity hypothesis, as there was an increased investment in assets that, in
euro terms, had underperformed. From this perspective, the patterns of euro area investors may reflect
the intention of further investing in a market with relatively strong returns, together with keeping a
constant currency exposure to the pound sterling. In turn, our results are at odds with the literature
that has established that country-specific uncertainty is associated with a general investor retrenchment.
What is more, the results also pose an interesting puzzle, in that the trade disintegration dynamics
generated by Brexit went hand in hand with stronger financial integration.
The remainder of the paper is organised as follows: Section 2 provides a brief overview of Brexit and
its impact on financial markets; Section 3 shows descriptively how the exposures of euro area investors to
securities issued by residents of the UK and/or denominated in pound sterling evolved since the Brexit
referendum; Section 4 lays out the empirical approach used, while Section 5 discusses the results; finally,
Section 6 concludes.
ECB Working Paper Series No 2734 / September 2022
6
8.
2The long and winding road: a brief summary of Brexit (thus
far)
The unexpected outcome of the UK referendum on EU membership, held on 23 June 2016, sparked a
complex process, resulting in a prolonged period of uncertainty. While the initial process of withdrawing
from the EU was completed by February 2020, many aspects regarding the future of the relationship
between the UK and the EU are still to be properly defined. In the political scene, the first consequence
of the referendum’s result was the end of David Cameron’s government, who resigned the day after it
took place, after having campaigned to remain in the EU.
Under the new Prime Minister Theresa May, the UK invoked, on 29 March 2017, the now-famous
Article 50 of the Treaty of the European Union, formally notifying the EU of its intention to leave. The
same article set forth a two-year period for both parties to reach an agreement on the withdrawal process,
thus setting 29 March 2019 as the day in which the UK would leave the EU. With that goal in mind,
the initial negotiation rounds between Brussels and London would kick off a few months later, in June,
roughly a year after the referendum. Before that, however, Prime Minister May called for a snap election,
hoping to secure a larger majority. The elections, held in 8 June 2017, resulted in the opposite outcome:
although still the largest party in the House of Commons, the Conservative Party lost its small overall
majority and formed a minority government under its leadership.
After the initial shock, in the aftermath of the referendum, tensions would flare up again in late-2018
and early-2019, as the deadline for Brexit approached and parliamentary approval of a deal was not
in sight, sparking fears of a “hard Brexit”, whereby trade with the EU Member States would follow
general WTO rules. While, in late November 2018, the remaining 27 EU member states endorsed May’s
Withdrawal Agreement, it was vehemently rejected in the House of Commons by 432 votes to 202, the
largest majority ever against a UK government. The agreement would be submitted once more for vote
on 12 March and again rejected, albeit this time by a smaller margin. Unable to get the Withdrawal
Agreement approved and just a few days shy of the deadline, May requested an extension to Article 50
to the European Council; European Leaders extended the deadline to 31 October 2019 on 10 April.
On 24 May, Theresa May announced her resignation, carrying on as caretaker until 24 of July, when
Boris Johnson, the new leader of the Conservative Party, was invited by the Queen to form a new
government and become Prime Minister. Johnson, however, initially endured the same difficulties as
May: unsuccessful in passing the Brexit deal in Parliament by October, he was also forced to request
yet another extension to Article 50, which was granted until 31 January 2020, and call for a new snap
ECB Working Paper Series No 2734 / September 2022
7
9.
election. The latter took place on 12 December 2019 and, in contrast to the 2017 election, resulted ina landslide 80-seat majority for the Conservatives, which allowed Johnson, only a few days later on 20
December 2019, to finally pass the Withdrawal Agreement in the House of Commons, with a comfortable
358-234 vote. Accordingly, on the first day of February 2020, the UK formally left the EU and the
transition period began, during which EU rights and obligations still applied. Little more than a month
later, the formal negotiations for a future agreement between the EU and the UK began. A deal on this
agreement would be struck on Christmas Eve of 2020, just a few days before the end of the transition
period.
However, a number of issues still remain to be agreed upon and it is, at this stage, unclear how
they will unfold. In particular, in the context of finance, the so-called passporting rights, which allow
a financial firm, once it has established itself in the European Economic Area (EEA), to carry out its
activities in any other member state – either by also moving its operations there or cross-border – without
the need for further authorisation from any of the remaining countries.
Figure 1 displays the UK monthly Economic Policy Uncertainty (EPU) index, which highlights the
volatility induced by the Brexit referendum. The most striking element is the outstanding spike in June
and July 2016, against the backdrop of the referendum. While the index receded afterwards, it still
recorded high levels throughout the remainder of 2016, as well as in most of 2019 and 2020. In fact,
even excluding the outlier observations of June and July 2016, the index average almost doubled from
the pre-Brexit to the post-Brexit period.
Figure 2 displays the sterling nominal effective exchange rate, as well as the bilateral exchange rate visà-vis the euro. While the pound sterling was appreciating in the years before, partially due to the weaker
euro, on the back of the expectation and the announcement of the ECB’s Asset Purchase Programme, the
British currency strongly depreciated immediately following the outcome of the referendum: on the close
of the day after the referendum, it had lost more than 5% to the euro and 6% in nominal effective terms
and, by the first days of July, those figures had roughly doubled. What is more, the currency has since
not recovered. In turn, Figure 3 displays the implicit volatility of the EUR/GBP and the EUR/USD
exchange rate crosses. It not only highlights the extreme levels of volatility attained immediately after
the Brexit referendum (and which did not affect the EUR/USD exchange rate), but also bouts of higher
volatility mostly during 2019 and in end-2020. In particular, a second spike in volatility is also visible in
March 2020, associated to the Covid shock. However, in that case, the implied volatility of the EUR/USD
also substantially increased, in line with a shock which was not specific to the UK.
Taken together, these developments substantiate the relevance of this paper’s research question: as-
ECB Working Paper Series No 2734 / September 2022
8
10.
sessing to which extent euro area investors might have readjusted their exposures to UK-issued or GBPdenominated securities in the aftermath of the Brexit referendum. The latter is further reinforced by thefact that the UK and the euro area economies are highly integrated. The interconnections among the
two economic blocks are particularly relevant in the case of financial integration, due to the role the UK
– and in particular the City of London – plays in global and European finance, oftentimes acting as a
platform between euro area and foreign investors.
3
Descriptive evidence on shifts in euro area investors’ exposures to UK and GBP securities since the Brexit referendum
In this section, we first review the direct financial transactions (i.e. net purchases/sales) of euro area
investors in securities issued by UK residents or denominated in pound sterling (GBP) since the Brexit
referendum until the end of our sample period (2020Q4). In a second subsection, we extend the analysis
by looking at the developments in euro area exposures – both direct and indirect (i.e. via investment
funds) – to those securities.
3.1
Direct transactions
We start the analysis by considering euro area investors’ cumulated direct net transactions (i.e. net
purchases and sales) since 2016Q2 (i.e. the quarter in which the Brexit referendum took place) in debt
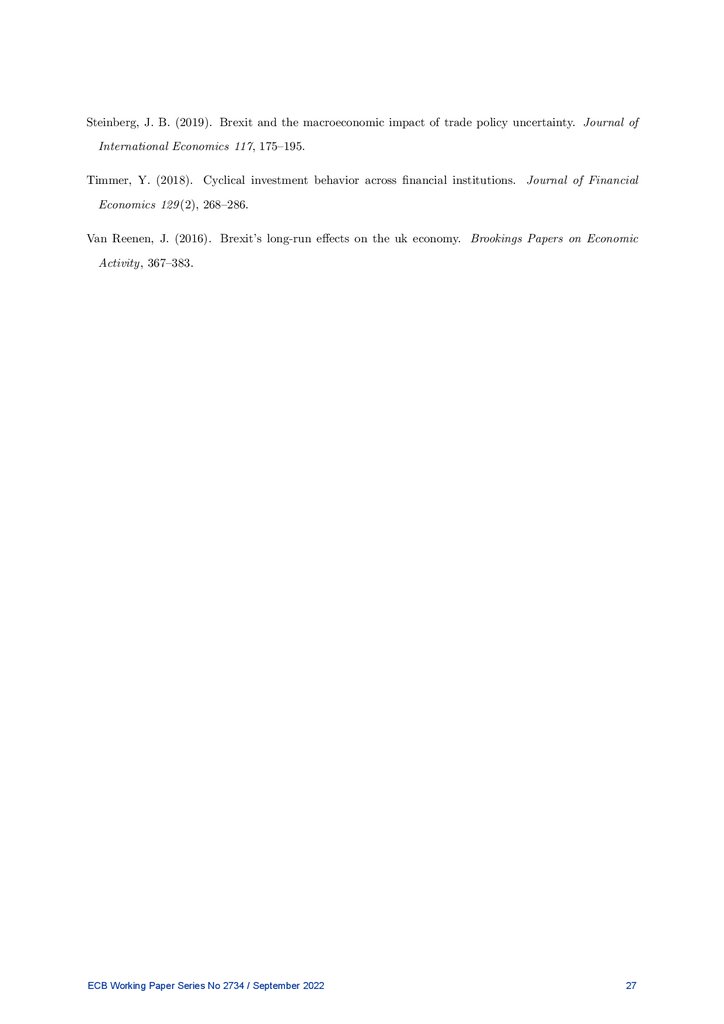
securities (Figure 4) and listed shares (Figure 5).
Several interesting patterns emerge with regard to debt securities: first, the overall picture is dominated by the investment fund (IF) sector that has recorded net purchases of around 200bn EUR – both
in terms of UK-issued and GBP-denominated debt securities – since the Brexit referendum, followed
by the other financial institutions (OFI) sector with considerably smaller net purchases of 20bn EUR.
The large role played by euro area IFs highlights the usefulness to determine the indirect exposures via
investment funds of the other euro area investor sectors, in order to have a comprehensive view of how
euro area investors’ exposures to the UK or to GBP-denominated securities have evolved since the Brexit
referendum. Accordingly, we consider both the direct and indirect exposures in the next sub-section and
the regression-based analysis.
Second, there is substantial heterogeneity across the different euro area sectors as IFs, OFIs and
pension funds (PFs) were net buyers of UK debt securities, while banks, non-financial corporations
ECB Working Paper Series No 2734 / September 2022
9
11.
(NFCs) and households (HHs) sold UK-issued securities since 2016Q2, albeit on a much smaller scale.Thus, there is overall no evidence of a negative ”Brexit-effect” for euro area investors, which would have
rendered UK-issued and GBP-denominated securities less attractive.
Third, a number of sectors display a disconnect in terms of financial transactions between UK-issued
and GBP-denominated debt securities. In particular, this is worth highlighting for banks and, to a
lesser extent, insurance corporations (ICs), which were net buyers of GBP securities, but net sellers of
UK-issued securities, while HHs reduced their exposure to UK-issued securities but kept the exposure
to GBP-denominated securities almost constant. In turn, for IFs and PFs currency and geography were
closely aligned.
As regards listed shares (Figure 5), there is no evidence of a Brexit effect either, while the picture is
more homogeneous as all sectors were net buyers of UK-issued listed shares since 2016Q2, with GBPdenominated listed shares following a very similar pattern (with the exceptions of OFIs and NFCs).
Again, the largest net purchases were due to IFs (around 50bn EUR), followed by banks with around
12bn EUR. It is also worth noting that there seems to have been a Covid-19 recovery effect at the end
of 2020, with strong net purchases of UK-issued and GBP-denominated listed shares by IFs, ICs, PFs,
NFCs and HHs.
Having established that euro area residents were net investors in UK-issued securities since the Brexit
referendum, we put these developments into the context of the UK’s overall balance of payments developments during this time period, displayed in Figure 6. We observe that the UK recorded a cumulated
current account deficit of around 400bn EUR between 2016Q2 and 2020Q4, which was financed by net
financial inflows, mostly in the form of portfolio investment. Specifically, foreign investors’ net purchases
of UK portfolio debt amounted to around 500bn EUR since the referendum, of which 40% came from euro
area investors. Thus, the investment behaviour of euro area residents with regard to UK debt over this
period appears to have been consistent with that of other foreign investors. For listed shares however, net
inflows of around 60bn EUR can be largely attributed to euro area investors, revealing that other foreign
investors had less of a preference for UK equity – in particular in the first quarters after the referendum
when policy uncertainty was highest (Figure 1).
3.2
Direct and indirect exposures
Next, in light of the important role of euro area investment funds, we employ a look-through method,
that allows not only to assess the direct exposures of euro area investors – i.e. the exposures that the
different sectors hold directly in their portfolios – but also their indirect exposures – i.e. the exposures
ECB Working Paper Series No 2734 / September 2022
10
12.
they have via their holdings of investment fund shares. In particular, pension funds, insurance companiesand households are the euro area sectors with the highest allocation in investment fund shares (Carvalho
and Schmitz, 2021).4 Total exposures of euro area sectors are therefore the sum of direct and indirect
exposures. Details of how indirect exposures of euro area investors are determined and computed are
provided in the Appendix.
Figure 7a shows the direct and indirect exposures of euro area investors (by sector) to UK debt
securities just before the Brexit referendum (i.e. at the end of 2016Q1) and at the end of our sample
period (2020Q4). Comparing these two data points, it stands out that only the euro area banking sector
has reduced its exposure to UK debt securities. In line with what was observed for transactions (Figure
4), this is driven by banks’ direct holdings. All other sectors increased their exposures to UK debt since
the Brexit referendum. For ICs (the sector with by far the largest exposure to the UK), HHs and NFCs
this is largely driven by the indirect holdings via investment funds, while for PFs and OFIs also the direct
holdings contributed.
In terms of listed shares (Figure 7b), all euro area sectors have increased their exposures to UK issued
shares (with the exception of a small reduction for OFIs) and for most sectors this reflects an increase
both in terms of direct holdings – in line with what was observed for transactions (Figure 5) – and indirect
exposures.
In Figures 8a and 8b we further drill down by also considering the currency of denomination of
UK-issued securities. A striking feature of the euro area’s direct debt holdings is the large proportion
of euro-denominated UK-issued securities (in particular for banks, OFIs and ICs). Since the Brexit
referendum, this component has further increased for OFIs, while it declined for euro area households and
banks. For the latter, this component drove the overall decrease in banks’ exposure to UK debt securities.
Remarkably, the direct holdings of GBP-denominated UK debt have been low throughout (and even close
to zero for NFCs and HHs), albeit increasing somewhat for banks and PFs since 2016Q1. On the other
hand, indirect holdings of GBP-denominated UK debt securities are of much higher importance for ICs,
PFs, HHs and NFCs and have increased considerably since the referendum.
For listed shares the connection between UK issuance and GBP-denomination is much stronger than
for debt (Figure 8b), both for the direct and indirect holdings, leading to higher GBP exposures since
the referendum, while the role of the other currencies in UK listed shares has generally declined.
Finally, Figures 9a and 9b present the euro area’s global exposure to the GBP, broken down by
4 As pointed out in Carvalho and Schmitz (2021), those sectors with higher proportions of investment fund shares in
their total portfolio have, mechanically, higher shares of indirect exposures.
ECB Working Paper Series No 2734 / September 2022
11
13.
country groups of issuance. Overall, and not surprisingly following the evidence presented above, thegeographic exposures to the UK are larger than to the GBP, especially for debt securities. Having
said this, GBP exposures have increased for all sectors since the referendum which, for most sectors, is
driven by indirect holdings of UK-issued GBP-denominated debt (in line with the evidence presented
in Figure 8a). Exposures to GBP-denominated debt issued outside the UK (i.e. in the euro area and
other countries) have remained relatively stable since 2016Q1 and are somewhat relevant in the indirect
holdings of ICs, PFs and HHs. For listed shares the strong connection between UK issuance and GBPdenomination is once more visible, as euro area holdings of GBP-denominated listed shares issued outside
the UK are relatively small. The largest (indirect) exposures to GBP listed shares are again recorded for
ICs, PFs and HH and mainly relate to shares issued in non-euro area countries.
4
Regression analysis - empirical approach
While the descriptive evidence presented above showed the euro area investment patterns vis-à-vis the
UK and the GBP since the Brexit referendum in absolute terms, our regression-based analysis provides
an encompassing framework, which assesses how euro area exposures to the UK and the GBP fared over
this period in comparison to the other securities held by euro area investors.
Accordingly, we use the following empirical approach, inspired by Galstyan and Lane (2013), but in
a more dis-aggregated fashion over time, and estimated separately for the different euro area holding
sectors, namely, Banks, OFIs, ICs, PFs, NFCs and HHs:
ic,a,is,c
1
2
3
1
2
∆ln(hic,a,is,c
hc,hs,t ) = ln(hhc,hs,t−1 ) + αhc + αic,is,c + αt + β γhc,ic + β ηhi + εhi,t
(1)
where ∆ln(hic,a,is,c
hc,hs,t ) is the quarterly change in the log of the direct, indirect or total exposures (i.e. the
percentage difference) of holder country hc and holder sector hs to asset class a, of issuer country ic,
issued by sector is and denominated in currency c.
We consider quarterly data for the period from 2016Q2 to 2020Q4, i.e. from the quarter of the
Brexit referendum until the end of the transition period. To gauge the relative demand for UK and GBP
securities by euro area investors, we control for host country, source (euro area) country, issuer sectors and
1
2
currency of denomination: holder country (αhc
) and issuer country/sector/currency (αic,is,c
) dummies
are included (except for UK-issued and GBP-denominated securities, as outlined below), in order to
control for any time-invariant factors along these dimensions. In addition, we employ time fixed effects
ECB Working Paper Series No 2734 / September 2022
12
14.
(αt3 ) to remove any quarter-specific global factors.5 In addition, three types of variables are included inthe regressions:
• a key set of dummy variables ηhi to assess
1. exposures vis-à-vis the UK (U Kcis ), where c is the currency – GBP, EUR or, in the case of
debt securities, also any other currency (OTH) – and is, the issuer sector – B, NFC, OFI or
GG, the latter in the case of debt securities only. These variables provide insights on how euro
area exposures to UK issued securities – broken down by currency and issuing sector – evolved
in comparison to the rest of the portfolio;
is
2. exposures to the pound sterling (GBPic
), where ic is the issuer country – the UK, the euro
area (EA) or any other country (OTH) –, and is denotes the issuer sector as above. These
variables provide insights on how euro area exposures to GBP denominated securities – broken
down by issuing country and sector – evolved in comparison to the rest of the portfolio.
• ln(hic,a,is,c
hc,hs,t−1 ) is the log of the outstanding direct, indirect or total exposure in the previous quarter,
to control for the pre-existing level of a sector’s investment.
• a set of gravity variables γhi , including the logarithms of bilateral distance and bilateral imports,
as well as dummies for shared language (definitions and sources of these data are described in the
appendix).6
5
Regression analysis - results
We start by discussing the main results regarding debt securities, and then move on to listed shares,
before performing several robustness exercises.7
5.1
Debt securities
As regards debt securities issued by UK residents, we find that all euro area sectors increased their
exposures vis-à-vis the UK, both for securities denominated in pound sterling and euro (Table 1). For
5 In order to focus only on non-trivial holdings, as well as to avoid potential bias, exposures smaller than e1 million were
excluded.
6 Due to the lack of gravity variables, the portfolio exposures to some territories were reclassified and included within
larger ones – the list of reclassifications is also provided in the appendix – and, for the same reason, exposures to debt issued
by international organisations were excluded.
7 While not the focus of this paper, our findings for the gravity control variables are in line with the literature. In general,
there is a “reversion to the mean” effect across almost all exposures and investor sectors, implying that larger positions in
the previous quarter tend to be reduced during the next quarter; moreover, there is strong evidence that distance matters,
both for direct and indirect holdings as quarterly net purchases (sales) are smaller (larger) for securities issued in more
distant locations.
ECB Working Paper Series No 2734 / September 2022
13
15.
HHs in particular, this is largely driven by indirect holdings via investment funds, while for the othersectors also the direct exposures increased. The rise in exposures vis-à-vis the UK is strongest for those
issued by the government, while for the other sectors an increase is also recorded, especially for eurodenominated securities.
Table 2 focuses on debt securities denominated in GBP and shows that all euro area sectors increased
their exposure vis-à-vis the GBP, in particular if the securities are issued in the UK, which is in some
cases driven by indirect holdings (across the board for HHs).
These findings show that the broad patterns revealed by the descriptive analysis in Section 3.2 also
hold in relative terms, i.e. when analysing how euro area exposures to UK-issued securities and GBPdenominated securities evolved in comparison to the rest of the securities portfolio. In the case of banks,
the evidence underscores that the deleveraging process focused proportionally less on securities issued in
the UK or denominated in GBP, thus leading to an overall higher exposure to the latter securities.8 The
increase in holdings of UK-issued and GBP-denominated securities by euro area investors may have been
largely driven by the low (or even negative) yields on euro area-issued and euro-denominated debt since
the Brexit referendum, as well as the increasing spread between the yields of UK and euro area securities
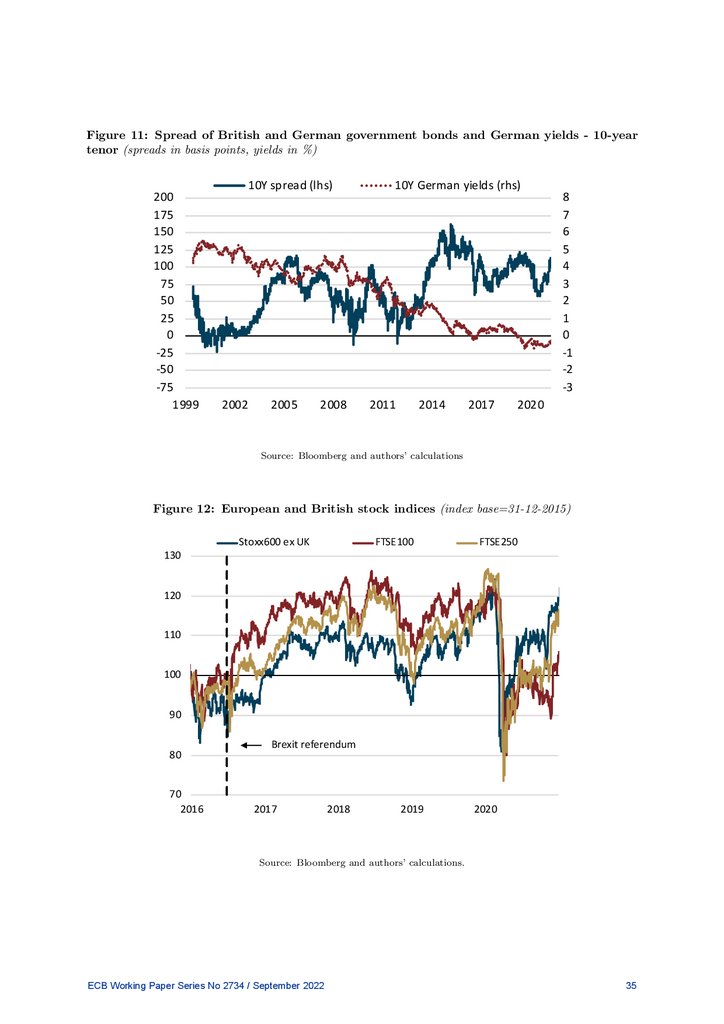
(Figures 10 and 11). Importantly, while spreads between UK and euro area government securities had
previously attained similar magnitudes, especially in the 5-year tenor, the combination of both large
spreads and low/negative euro area yields is a novel feature of the more recent period.
These shifts in holdings should also be seen against the backdrop of the Eurosystem’s Asset Purchase
Programme (APP). This programme – which had been in place since March 2015 – led to a broad-based
portfolio rebalancing by euro area investors towards foreign debt securities, including ‘closest substitutes’
to the euro area public sector debt securities eligible to be purchased by the Eurosystem (Bergant et al.
(2020)). UK government debt securities also fall under the category of highly rated ‘closest substitutes’,
while offering a substantial yield differential vis-à-vis euro area debt. In line with our findings, Carvalho
and Schmitz (2021) show that part of the euro area rebalancing induced by the APP was driven by
indirect holdings via investment funds.
8 The descriptive analysis had revealed some decline in banks’ absolute holdings of euro-denominated UK-issued debt
securities, while the regression analysis showed a positive sign on these securities. This divergence can be explained by
the euro area banking sector’s persistent deleveraging process since the global financial crisis – and in particular shedding
extra-euro area assets (Emter et al. (2019)).
ECB Working Paper Series No 2734 / September 2022
14
16.
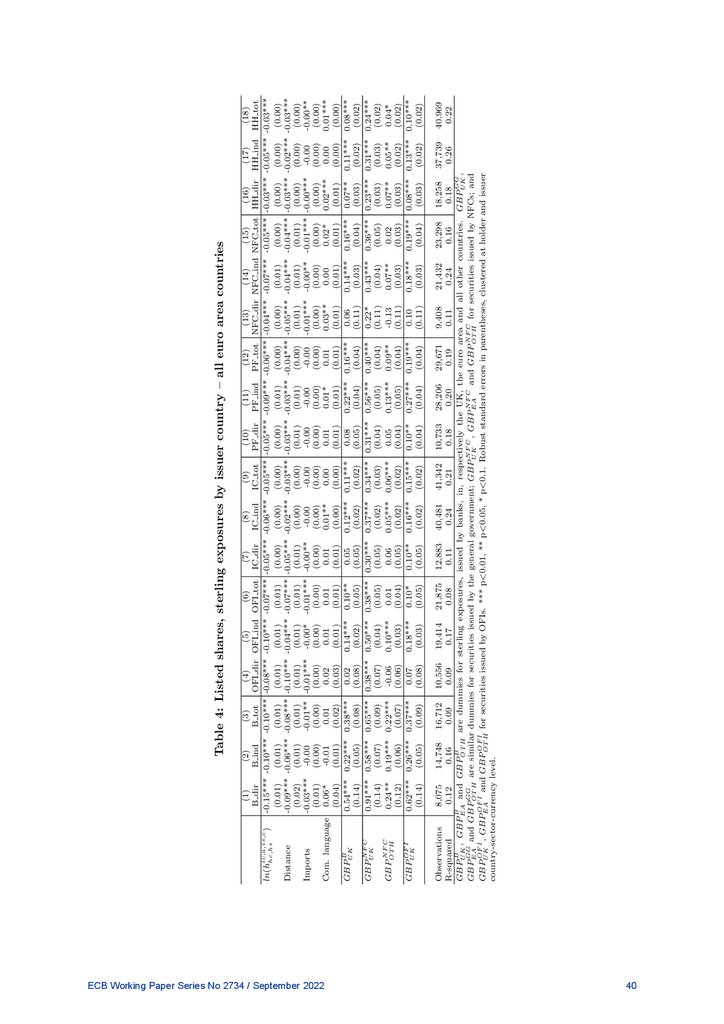
5.2Listed shares
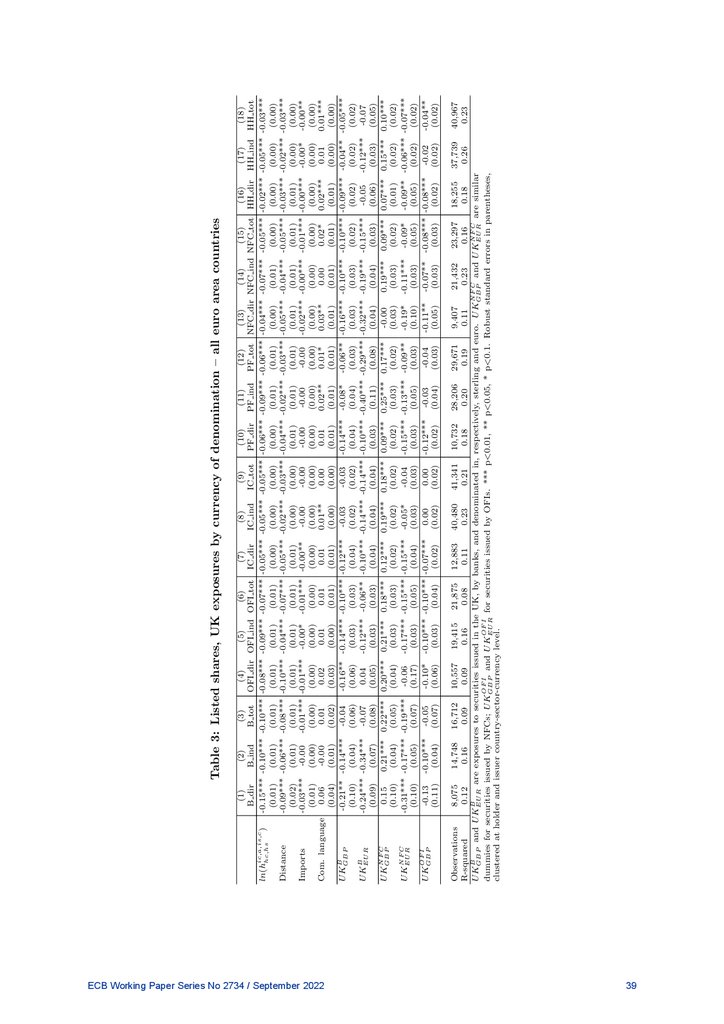
Focusing on listed shares issued by UK residents, we observe a heterogeneous picture across issuance
sectors (Table 3). All euro area sectors increased their relative exposures to UK listed shares issued
by NFCs – both in terms of indirect and total holdings, if denominated in GBP (which is the case for
the majority of UK-issued shares, see Figure 8b). In terms of shares issued by UK banks, there is a
significant reduction in exposures by euro area investors (with the exception of banks and ICs) since the
Brexit referendum (for GBP-denominated and largely for euro-denominated as well). Euro area OFIs,
NFCs and HHs also reduced their exposures to listed shares issued by UK OFIs.
GBP issuance of listed shares outside the UK is only observed on a significant scale for NFCs.9 For
NFC listed shares, the picture is mixed across euro area sectors, with banks, ICs, PFs and HHs increasing
their exposures to GBP-denominated listed shares issued outside the UK (Table 4), which is driven by
indirect holdings for ICs and PFs.
Overall, in line with the evidence presented in Figure 7b, the regression analysis reveals an increase
in the euro area’s relative exposure to UK-issued and GBP-denominated listed shares – in particular for
those issued by UK NFCs – since the Brexit referendum. This rebalancing was likely supported by the
increase in UK share prices following the initial drop after the referendum (Figure 12). In contrast, the
underperformance of the UK’s banking sector (see Figure 13) may well justify the decrease in exposure
to banks.
5.3
Discussion
How do our results square with the literature on cross-border portfolios and foreign currency movements?
Studies of the determinants of portfolio flows have arrived at the conclusion that country-specific uncertainty is associated with a retrenchment from the relevant market – see Fratzscher (2012); Caporale et al.
(2015); Sarno et al. (2016); Schmidt and Zwick (2015) – see also Choi and Furceri (2019), in the case of
bilateral banking flows, and Julio and Yook (2016) for foreign direct investment. Notwithstanding, these
studies generally use push and pull frameworks, controlling for both, respectively, global and countryspecific determinants of bilateral flows. In particular, Sarno et al. (2016) find that global push factors play
a much larger role in explaining portfolio flows than domestic pull factors. These findings reverberate
with the global liquidity literature, which argues that global financial conditions are highly synchronised
and that measures of US financial conditions explain a substantial amount of the movements in capital
9 Issuance by GBP-denominated listed shares outside the UK is mainly done by entities resident in offshore centres with
close links to the UK, such as Jersey, Gibraltar, etc.
ECB Working Paper Series No 2734 / September 2022
15
17.
flows (Rey, 2015; Miranda-Agrippino and Rey, 2015).In contrast, existing literature in international economics predicts that investors target an optimal
currency exposure, in order to keep a given level of foreign currency risk (Hau and Rey, 2004; Camanho
et al., 2020). For that reason, investors rebalance their portfolios by decreasing (increasing) their exposure
to markets/currencies which have outperformed (underperformed). This is in line with the broader
concept of Uncovered Equity Parity (UEP), which predicts that when foreign equity holdings outperform
domestic holdings, domestic investors are exposed to higher relative exchange rate exposure and decide to
repatriate some of the foreign equity to decrease exchange rate risk (Cappiello and De Santis, 2007; Kim,
2011; Curcuru et al., 2014). Furthermore, empirical and theoretical work from the finance literature shows
that investors often adjust their targets pro-cyclically and buy more of assets that are increasing in value
(e.g. Bohn and Tesar (1996) for international investment in the US, or Becker and Ivashina (2015) for
insurance companies). These investment patterns are better known as “momentum investment” or “return
chasing”. More recently, Ammer et al. (2018) present empirical evidence that investors shift their portfolio
into riskier US corporate bonds in response to low interest rates in their domestic markets. Similarly,
Bergant and Schmitz (2020) find evidence for “momentum investment” among euro area investors that
show larger net purchases of foreign securities which experience relatively higher valuation gains.
The results of this paper can be seen to lend support to both of the latter views. On the one hand, they
are in line with UEP, as the initial negative returns (in euro terms) of British equities and bonds, brought
about by the stark depreciation of the Pound sterling, was met with increased investment of euro area
investors in those assets. On the other hand, these investment patterns are also in line with momentum
investment and return-chasing motives, as euro area investors increased their exposures towards a market,
which delivered a relatively stronger performance, since the initial Brexit shock. Hence, the observed
investment patterns of euro area investors – increasing their exposure to UK and GBP-denominated
securities – may reflect both the objective to maintain a given level of currency risk, as well as to increase
the exposure to a market which recorded relatively strong returns.10
5.4
Extensions and robustness
We run several extensions and robustness checks (all results are available upon request).
First, we distinguish between euro area investors resident in financial centres and the rest of the euro
10 It should, notwithstanding, be noted that currently available datasets do not allow to assess the extent to which these
exposures are hedged. Thus, it is not possible to determine if euro area investors hedged their foreign exchange risk to the
Pound sterling. However, survey evidence indicates that hedging is more common in foreign currency fixed income positions
than in equity positions.
ECB Working Paper Series No 2734 / September 2022
16
18.
area.11 The results are overall consistent between these two groups of euro area countries, both for debtand listed shares. The disinvestment from listed shares issued by UK banks is slightly less pronounced
for the euro area financial centres (in particular by PFs and HHs).
Second, we exclude intra-euro holdings (for the residency-based regressions) and euro holdings (for the
currency-based regressions) from the analysis, in order to take a purely international perspective of euro
area investments. Again, all main results hold. Interestingly, the rebalancing into GBP-denominated debt
becomes slightly stronger in the specification when euro-denominated debt is not included, suggesting
that the GBP has been among the most attractive international currencies for euro area investors during
our sample period.
Third, we test if our results are different when focusing on the immediate Brexit “shock period”, i.e.
when we consider the difference in holdings between two time periods, namely between the first quarter
of 2016 (“pre-Brexit”) and the third quarter of 2016 (“immediate post-Brexit”). This approach, inspired
by Galstyan and Lane (2013), was also followed by Carvalho and Schmitz (2021) to analyse the impact
of the COVID-19 shock on euro area portfolio holdings. In general, there is no evidence of a negative
“immediate Brexit-effect” either. For debt, there is also, in this time period, some rebalancing by most
euro area sectors into UK sovereign and bank securities, mainly driven by indirect holdings via investment
funds. As regards listed shares, there is some indication of disinvestment from securities issued by banks
and increased exposure to those issued by NFCs, however in both cases not as strong as over the whole
sample period.
Fourth, we distinguish the euro area investment into UK-issued and GBP-denominated securities
according to the quarters with “high uncertainty” and “calm” time periods. In doing so, we investigate
if in the high uncertainty quarters – i.e. those with spikes in the UK Economic Policy Uncertainty
Index (Figure 1) – euro area investors show different investment patterns with regard to UK-issued and
GBP-denominated securities than in the calmer periods.12 Our analysis reveals – perhaps somewhat
surprisingly – that for both debt and equity securities there are no significant differences between these
two types of time periods. This may indicate that euro area investors’ portfolio decisions with regard
to UK issued and GBP-denominated were not significantly influenced by the turns and noise during the
Brexit negotiations, but rather driven by the return-considerations outlined above.
11 We follow the definition proposed by Lane and Milesi-Ferretti (2018), which is based on the financial openness of countries. Accordingly, the euro area financial centres are Belgium, Cyprus, Ireland, Luxembourg, Malta, and the Netherlands.
12 We consider quarters with uncertainly levels of two standard deviations above the long-term average as ”high uncertainty” periods. These are from 2016Q1 to 2017Q2; 2018Q4 and 2019Q1 and 2019Q3 to 2020Q4, with the exception of
2020Q3.
ECB Working Paper Series No 2734 / September 2022
17
19.
6Conclusion
This paper’s main finding is that euro area investors have not shifted their holdings away from either
securities issued in the UK or denominated in pound sterling on account of the market tensions and
uncertainty following the outcome of the Brexit referendum. In fact, quite to the contrary – and in
contrast to developments in trade between the two economic areas – euro area investors have increased
their exposures since 2016.
These developments should be seen against the backdrop of prevailing market conditions in the euro
area. Arguably, with the current low and/or negative interest rates of euro area bonds, UK bonds may
provide a (much) higher-yielding alternative – in particular, in the case of UK government bonds, a
highly-rated asset that may substitute core euro area government bonds; accordingly, this effect may
dominate other negative effects associated to Brexit. What is more, the relatively contained impact of
the Brexit referendum on British stock indices, as well as the swift recovery thereafter, may well have
supported the continued investment of euro area investors in UK listed shares, with the exception of UK
bank shares. Furthermore, to the extent that the FTSE100 is composed of the UK’s largest companies
that have a significant international focus, it may have been particularly insulated from domestic political
tensions.
ECB Working Paper Series No 2734 / September 2022
18
20.
AEstimation of indirect portfolio exposures
The method to look through investment fund holdings of euro area investors broadly follows Carvalho
(2022) and Carvalho and Schmitz (2021). For that purpose, the Eurosystem’s Securities Holdings Statistics (SHS) by sector are used, which contain highly granular security-level information on the holdings,
valued at market prices, of debt securities, listed shares and investment fund shares of euro area investors,
aggregated by institutional sectors.13 It should be noted that this dataset represents a subset of euro
area sectors’ complete portfolio, to the extent that it does not include unlisted shares – in this sense,
listed shares are taken as a proxy for the whole of the equity instrument class.14
The following sectors are considered and their holdings are accordingly aggregated at the euro area
country-sector level: deposit taking corporations except central banks, which corresponds to banks (B);
money market and non-money market investment funds (IF); insurance corporations (IC); pension funds
(PF); other financial institutions excluding financial vehicle corporations (OFI); non-financial corporations (NFC) and households (HH).
The first step towards “looking-through” is to compute the distribution of holdings by investment
funds. Money-market and non-money market funds are pooled together into a single investment fund
sector.15
ic,a,is,c
This is done for the holdings of each instrument class and gives whc,IF,t
, i.e., the weight of asset class
a, denominated in currency c, issued by issuer sector is of issuer country ic, in total investment fund
(IF ) holdings resident in euro area country hc, in period t. It should be noted that investment funds
also hold investment fund shares (funds of funds) and therefore, in this step, these weights are computed
for debt securities, listed shares, and also investment fund shares.
The second step is to compute the IF share holdings of each sector, in each euro area country and
S,IF,c
in each period of time. These are given by hic,IF
, where hs stands for holder sector, the asset is
hc,hs,t
investment fund shares (IF S), and the remaining super- and subscripts have the same interpretation as
before. There is, however, one element which is unknown: the holdings of investment funds which are
resident outside the euro area. In order to allocate these amounts, it is assumed that the distribution
of these holdings corresponds to the average of that of Luxembourgian and Irish resident investment
funds, which tend to be representative of global investment funds. Accordingly, that average is given by
13 Data for other EU countries that do not belong to the euro area are also available; however, these countries participate
only on a voluntary basis, as opposed to euro area countries, for which the collection of this data is compulsory. In practical
terms, the availability of data for the EU countries not belonging to the euro area is more restricted and, in general, of
inferior quality.
14 For more information on the SHS, see ECB (2015)
15 In this pooled investment fund sector non-money market investment funds accounted for 92% of the overall holdings at
end-2019.
ECB Working Paper Series No 2734 / September 2022
19
21.
ic,IF S,IF,cw̄hc,IF,t
, where hc includes Luxembourg and Ireland.16
For this reason, one needs to separate the investment fund share holdings of a euro area country-sector
S,IF,c
vis-à-vis other euro area countries — hic=EA,IF
, which we allocate on a issuer-country by country
hc,hs,t
X ic,IF S,IF,c
=EA,IF S,IF,c
basis — and non-euro area countries — hic6
=
hhc,hs,t
, which we allocate as a single
hc,hs,t
ic∈EA
/
block of non-euro area issuer countries.
With all these elements, the estimated holdings of a given holder country hc of asset class a, denominated in currency c, issued by issuer sector is, vis-à-vis issuer country ic, in period t, are given
by:
ic=EA,IF S,IF,c
ic,a,is,c
=EA,IF S,IF,c
ic,IF S,IF,c
ĥic,a,is,c
× whc,IF,t
+ hic6
× w̄hc,IF,t
hc,hs,t,1 = hhc,hs,t
hc,hs,t
(2)
Due to the existence of funds of funds, this process is not able to distribute the whole investment fund
shares holdings of a given country-sector pair in a single go. Therefore, a residual is attained, which is
the difference between the observed holdings of investment fund shares per holding country-sector pair
X ic,a,is,c
ic,IF S,IF,c
[ hc,hs,t,1 =
and the estimated figures, i.e. RES
hhc,hs,t − ĥic,a,is,c
hc,hs,t,1 . For this reason, the procedure
is repeated, this time allocating only the residual:
ic=EA,IF S,IF,c
[
ĥic,a,is,c
hc,hs,t,2 = RES hc,hs,t,1
ic
ic6=EA,IF S,IF,c
ic,a,is,c
[ hc,hs,t,1
× whc,IF,t
+ RES
ic,IF S,IF,c
× w̄hc,IF,t
(3)
This process is repeated until the residual is minimal — in practice, five rounds are sufficient to arrive
at a residual which is about 0.1% of the original investment fund share holdings of each country-sector
pair. Finally, the total estimated figures for debt instruments and listed shares are given by
ic,a,is,c
ic,a,is,c
ic,a,is,c
ĥic,a,is,c
hc,hs,t = hhc,hs,t + ĥhc,hs,t,1 + ... + ĥhc,hs,t,5
(4)
We refer to hic,a,is,c
hc,hs,t as the direct component of the investment of a given holding country-sector pair
ic,a,is,c
in asset class a (i.e., excluding the exposures held via investment funds) and ĥic,a,is,c
hc,hs,t,1 + ... + ĥhc,hs,t,5 as
the indirect component (i.e., the exposures held via investment funds).
There are two caveats to our approach: the first is that the information in SHS data does not
cover all investment fund assets, but only their portfolio investment holdings. For instance, SHS has no
16 The potential bias introduced by this assumption is deemed not to be significant since the vast majority of investment
fund shares held by euro area sectors is issued by investment funds resident in the euro area, for which the distribution is
known. In fact, at end-2019, the average non-euro area share in total investment fund share holdings of euro area countrysectors was under 11%. For a subsample of the largest euro area countries – Austria, Belgium, Finland, France, Germany,
the Netherlands, Greece, Italy, Portugal and Spain – the share was even smaller, of less than 6%.
ECB Working Paper Series No 2734 / September 2022
20
22.
information on non-financial assets (such as real estate) held by euro area investment funds. Nevertheless,the instrument classes that are covered by the SHS make up for the bulk of the assets held by investment
funds. In fact, according to the ECB’s investment fund statistics, at the end of 2019, the share of debt
securities, equities and investment fund shares in the aggregate balance sheet of euro area investment
funds was slightly above 85%, with loans and deposits, non-financial assets and other assets accounting
for the remainder.
The second caveat relates to the assumption that investors across euro area countries have the same
preferences across issuing countries of investment fund shares, in terms of those funds’ portfolio allocations. In practice this means that for investment fund shares issued by investment funds resident in
Luxembourg, we need to assume that German investors hold fund shares issued by investment funds with
the same asset composition as those held by French residents. The same applies for the different sectors, i.e., banks may invest predominantly in certain Irish investment funds, which are distinct from the
choices of Irish investment funds made by pension funds. The concerns raised by these assumptions are
partially alleviated by the findings in Monti and Felettigh (2008), who report that estimates of indirect
holdings are not significantly affected by the assumption that they follow the overall distribution of Irish
and Luxembourgian investment funds, compared to a more detailed estimation, where the investment
strategy of the individual investment funds in which Italian residents invest is known.
ECB Working Paper Series No 2734 / September 2022
21
23.
BData Appendix
B.1
Sources of gravity variables
• Bilateral distance and shared language – Data are taken from the GeoDist database, compiled
by the Centre d’Études Prospectives et d’Informations Internationales (CEPII) – see Mayer and
Zignago (2011) for details
• Bilateral imports – Data are from Eurostat and are four-quarter moving sums.
B.2
Issuer country reclassifications due to the lack of gravity variables
• Switzerland – includes Liechtenstein
• United States – includes Puerto Rico, Guam, American Samoa, the US Virgin Islands and Minor
Outlying Islands
B.3
Gravity variables of British offshores
• Guernsey, Jersey, Isle of Man, Gibraltar and the Virgin Islands – to the extent that these
territories may have an added relevance to the purpose of this paper, we opted not to reclassify
these country codes as the UK and keep them individually. Whenever not available in the CEPII
database, distance and common language were assumed to the be the same as that of the UK. In
all cases, however, imports are not available and were set to zero.
ECB Working Paper Series No 2734 / September 2022
22
24.
ReferencesAdrian, T. and H. S. Shin (2010). Liquidity and leverage. Journal of financial intermediation 19 (3),
418–437.
Adrian, T. and H. S. Shin (2013). Procyclical leverage and value-at-risk. The Review of Financial
Studies 27 (2), 373–403.
Ahearne, A. G., W. L. Griever, and F. E. Warnock (2004). Information costs and home bias: an analysis
of us holdings of foreign equities. Journal of international economics 62 (2), 313–336.
Ammer, J., S. Claessens, A. M. Tabova, and C. Wroblewski (2018, March). Searching for Yield Abroad
: Risk-Taking Through Foreign Investment in U.S. Bonds. International Finance Discussion Papers
1224, Board of Governors of the Federal Reserve System (U.S.).
Armour, J. (2017). Brexit and financial services. Oxford Review of Economic Policy 33 (suppl 1), S54–
S69.
Becker, B. and V. Ivashina (2015, October). Reaching for Yield in the Bond Market. Journal of Finance 70 (5), 1863–1902.
Belke, A., I. Dubova, and T. Osowski (2018). Policy uncertainty and international financial markets: the
case of brexit. Applied Economics 50 (34-35), 3752–3770.
Bergant, K., M. Fidora, and M. Schmitz (2020). International Capital Flows at the Security Level –
Evidence from the ECB’s Asset Purchase Programme. IMF Working Papers 20/46, International
Monetary Fund.
Bergant, K. and M. Schmitz (2020). Valuation Effects and International Capital Flows - Security-Level
Evidence from Euro Area Investors. mimeo, European Central Bank and International Monetary Fund.
Bertaut, C. C. and L. Kole (2004). What makes investors over or underweight? explaining international
appetites for foreign equities. Explaining International Appetites for Foreign Equities (September 2004).
FRB International Finance Discussion Paper (819).
Boermans, M. A. and R. Vermeulen (2019). International investment positions revisited: Investor heterogeneity and individual security characteristics. Review of International Economics 28 (2), 466–496.
Bohn, H. and L. L. Tesar (1996). U.s. equity investment in foreign markets: Portfolio rebalancing or
return chasing? The American Economic Review 86 (2), 77–81.
ECB Working Paper Series No 2734 / September 2022
23
25.
Born, B., G. J. Müller, M. Schularick, and P. Sedláček (2019). The costs of economic nationalism:evidence from the brexit experiment. The Economic Journal 129 (623), 2722–2744.
Bruno, R. L., N. F. Campos, S. Estrin, and M. Tian (2017). Foreign direct investment and the relationship
between the united kingdom and the european union. In The Economics of UK-EU Relations, pp. 139–
173. Springer.
Camanho, N., H. Hau, and H. Rey (2020). Global portfolio rebalancing and exchange rates. CEPR
Discussion Paper 15617, Centre for Economic Policy Research.
Caporale, G. M., F. M. Ali, and N. Spagnolo (2015). Exchange rate uncertainty and international portfolio
flows: A multivariate garch-in-mean approach. Journal of International Money and Finance 54, 70–92.
Cappiello, L. and R. A. De Santis (2007, September). The uncovered return parity condition. Working
Paper Series 812, European Central Bank.
Carvalho, D. (2022). The portfolio holdings of euro area investors - looking through investment funds.
Journal of International Money and Finance 120, 102519.
Carvalho, D. and M. Schmitz (2021). Shifts in the portfolio holdings of euro area investors in the midst
of covid-19: looking-through investment funds. ECB Working Paper 2526, European Central Bank.
Choi, S. and D. Furceri (2019). Uncertainty and cross-border banking flows. Journal of international
money and finance 93, 260–274.
Curcuru, S. E., C. P. Thomas, F. E. Warnock, and J. Wongswan (2014). Uncovered equity parity and
rebalancing in international portfolios. Journal of International Money and Finance 47, 86–99.
Dhingra, S., H. Huang, G. Ottaviano, J. Paulo Pessoa, T. Sampson, and J. Van Reenen (2017). The
costs and benefits of leaving the eu: trade effects. Economic Policy 32 (92), 651–705.
Dhingra, S., G. Ottaviano, T. Sampson, and J. Van Reenen (2016). The impact of brexit on foreign
investment in the uk. CEP Brexit Analysis (3).
ECB (2015). Who holds what? new information on securities holdings. Economic Bulletin 2, 72–84.
Emter, L., M. Schmitz, and M. Tirpák (2019, May). Cross-border banking in the EU since the crisis: What
is driving the great retrenchment? Review of World Economics (Weltwirtschaftliches Archiv) 155 (2),
287–326.
ECB Working Paper Series No 2734 / September 2022
24
26.
Fratzscher, M. (2012). Capital flows, push versus pull factors and the global financial crisis. Journal ofInternational Economics 88 (2), 341–356.
Galstyan, V. and P. Lane (2013). Bilateral portfolio dynamics during the global financial crisis. European
Economic Review 57 (C), 63–74.
Galstyan, V., P. R. Lane, C. Mehigan, and R. Mercado (2016). The holders and issuers of international
portfolio securities. Journal of the Japanese and International Economies 42, 100–108.
Galstyan, V. and A. Velic (2018). International investment patterns: the case of german sectors. Open
Economies Review 29 (3), 665–685.
Giofré, M. (2013). International diversification: Households versus institutional investors. The North
American Journal of Economics and Finance 26, 145–176.
Hau, H. and H. Rey (2004). Can portfolio rebalancing explain the dynamics of equity returns, equity
flows, and exchange rates? American Economic Review 94 (2), 126–133.
Julio, B. and Y. Yook (2016). Policy uncertainty, irreversibility, and cross-border flows of capital. Journal
of International Economics 103, 13–26.
Kim, H. (2011). The risk adjusted uncovered equity parity. Journal of International Money and Finance 30 (7), 1491–1505.
Lane, P. R. (2006). Global bond portfolios and emu. International Journal of Central Banking 2 (2),
1–23.
Lane, P. R. and G. M. Milesi-Ferretti (2005). The international equity holdings of euro area investors.
Discussion paper, IIIS.
Lane, P. R. and G. M. Milesi-Ferretti (2008). International investment patterns. The Review of Economics
and Statistics 90 (3), 538–549.
Lane, P. R. and G. M. Milesi-Ferretti (2018). The external wealth of nations revisited: international
financial integration in the aftermath of the global financial crisis. IMF Economic Review 66 (1),
189–222.
Mayer, T. and S. Zignago (2011). Notes on cepii’s distances measures: The geodist database. Working
Papers 2011-25, CEPII.
ECB Working Paper Series No 2734 / September 2022
25
27.
McGrattan, E. R. and A. Waddle (2020). The impact of brexit on foreign investment and production.American Economic Journal: Macroeconomics 12 (1), 76–103.
Miranda-Agrippino, S. and H. Rey (2015). US monetary policy and the global financial cycle. NBER
Working Paper 21722, National Bureau of Economic Research.
Monti, P. and A. Felettigh (2008). How to interpret the cpis data on the distribution of foreign portfolio
assets in the presence of sizeable cross-border positions in mutual funds-evidence for italy and the main
euro-area countries. Bank of Italy Occasional Paper (16).
Okawa, Y. and E. Van Wincoop (2012). Gravity in international finance. Journal of international
Economics 87 (2), 205–215.
Portes, R. and H. Rey (2005). The determinants of cross-border equity flows. Journal of international
Economics 65 (2), 269–296.
Portes, R., H. Rey, and Y. Oh (2001). Information and capital flows: The determinants of transactions
in financial assets. European economic review 45 (4-6), 783–796.
Rey, H. (2015). Dilemma not trilemma: the global financial cycle and monetary policy independence.
NBER working paper 21162, National Bureau of Economic Research.
Roque, V. and M. C. Cortez (2014). The determinants of international equity investment: Do they differ
between institutional and noninstitutional investors? Journal of Banking & Finance 49, 469–482.
Sampson, T. (2017). Brexit: the economics of international disintegration. Journal of Economic perspectives 31 (4), 163–84.
Sarno, L., I. Tsiakas, and B. Ulloa (2016). What drives international portfolio flows?
Journal of
International Money and Finance 60, 53–72.
Schmidt, T. and L. Zwick (2015). Uncertainty and episodes of extreme capital flows in the euro area.
Economic Modelling 48, 343–356.
Sørensen, B. E., Y.-T. Wu, O. Yosha, and Y. Zhu (2007). Home bias and international risk sharing: Twin
puzzles separated at birth. Journal of international money and finance 26 (4), 587–605.
Stafford, P., M. Khan, and D. Keohane. Amsterdam: Europe’s surprise early winner as brexit shakes up
the city. Financial Times.
ECB Working Paper Series No 2734 / September 2022
26
28.
Steinberg, J. B. (2019). Brexit and the macroeconomic impact of trade policy uncertainty. Journal ofInternational Economics 117, 175–195.
Timmer, Y. (2018). Cyclical investment behavior across financial institutions. Journal of Financial
Economics 129 (2), 268–286.
Van Reenen, J. (2016). Brexit’s long-run effects on the uk economy. Brookings Papers on Economic
Activity, 367–383.
ECB Working Paper Series No 2734 / September 2022
27
29.
Figure 1: UK Economic Policy Uncertainty Index600
Brexit referendum
500
400
300
200
100
0
1998
2001
2004
2007
2010
2013
2016
2019
Source: Economic Policy Uncertainty. The index is constructed based on news articles containing the terms uncertain or
uncertainty, economic or economy, as well as policy relevant terms (scaled by the smoothed total number of articles). Policy
relevant terms include: ’policy’, ’tax’, ’spending’, ’regulation’, ’Bank of England’, ’budget’, and ’deficit’.newspaper articles.
The newspapers included are: The FT, The Times and Sunday Times, The Telegraph, The Daily Mail, The Daily Express,
The Guardian, The Mirror, The Northern Echo, The Evening Standard, and The Sun. Last observation: December 2020
ECB Working Paper Series No 2734 / September 2022
28
30.
Figure 2: Sterling exchange rateGBP/EUR cross (lhs)
NEER (rhs)
1.5
95
Brexit referendum
1.4
90
1.3
85
1.2
80
1.1
75
1.0
2013
70
2014
2015
2016
2017
2018
2019
2020
Source: Bloomberg and Bank of England. The nominal effective exchange rate is calculated using trade flows of both goods
and services and is rebased to Jan 2005 = 100.
Figure 3: Sterling exchange rate implied volatility
EUR/GBP
28
24
EUR/USD
Brexit referendum
20
16
12
8
4
0
2013
2014
2015
2016
2017
2018
2019
2020
Source: Bloomberg. Implied volatility of one-month at the money options.
ECB Working Paper Series No 2734 / September 2022
29
31.
Figure 4: Euro area net purchases of debt securities by sector (cumulated quarterly flows since2016Q2 in EUR bn)
IF
OFI
4
6
15
8
20
IC
0
5
2016q3 2017q3 2018q3 2019q3 2020q3
UK
2016q3 2017q3 2018q3 2019q3 2020q3
GBP
UK
2016q3 2017q3 2018q3 2019q3 2020q3
GBP
UK
NFC
GBP
2016q3 2017q3 2018q3 2019q3 2020q3
UK
GBP
HH
2016q3 2017q3 2018q3 2019q3 2020q3
UK
GBP
-8
0
-2
-6
-1
5
0
-4
10
-2
1
0
2
15
PF
-2
0
0
-20
50
-10
2
10
0
100
10
150
20
200
B
2016q3 2017q3 2018q3 2019q3 2020q3
UK
GBP
2016q3 2017q3 2018q3 2019q3 2020q3
UK
GBP
Source: ECB. Note: “UK” refers to securities issued by residents of the United Kingdom; “GBP” refers to securities
denominated in British pound. “B” are deposit-taking corporation; “IF” are investment and money market funds; “OFI” are
other financial intermediaries; “IC” are insurance companies; “PF” are pension funds; “NFC” are non-financial corporations;
“HH” are households.
ECB Working Paper Series No 2734 / September 2022
30
32.
Figure 5: Euro area net purchases of listed shares by sector (cumulated quarterly flows since2016Q2 in EUR bn)
IC
2
1
5
2016q3 2017q3 2018q3 2019q3 2020q3
UK
2016q3 2017q3 2018q3 2019q3 2020q3
GBP
-1
0
-20
0
0
0
5
20
10
40
3
10
OFI
60
IF
15
B
UK
UK
GBP
2016q3 2017q3 2018q3 2019q3 2020q3
UK
GBP
2016q3 2017q3 2018q3 2019q3 2020q3
UK
GBP
4
2
0
-2
-2
-1
-.5
0
0
2
.5
4
1
6
HH
6
NFC
1.5
PF
2016q3 2017q3 2018q3 2019q3 2020q3
GBP
2016q3 2017q3 2018q3 2019q3 2020q3
UK
GBP
2016q3 2017q3 2018q3 2019q3 2020q3
UK
GBP
Source: ECB. Note: “UK” refers to securities issued by residents of the United Kingdom; “GBP” refers to securities
denominated in British pound. “B” are deposit-taking corporation; “IF” are investment and money market funds; “OFI” are
other financial intermediaries; “IC” are insurance companies; “PF” are pension funds; “NFC” are non-financial corporations;
“HH” are households.
ECB Working Paper Series No 2734 / September 2022
31
33.
Figure 6: United Kingdom: selected balance of payments developments (cumulated quarterlyflows since 2016Q2 in EUR bn)
Current account deficit
Port. equity inflows
Port. debt inflows
Port. equity inflows (from EA)
Port. debt inflows (from EA)
600
500
400
300
200
100
0
-100
16Q2 16Q4 17Q2 17Q4 18Q2 18Q4 19Q2 19Q4 20Q2 20Q4
Source: Office for National Statistics and ECB.
ECB Working Paper Series No 2734 / September 2022
32
34.
1016Q1 20Q4 16Q1 20Q4 16Q1 20Q4 16Q1 20Q4 16Q1 20Q4 16Q1 20Q4
B
OFI
IC
PF
Direct
NFC
0
0
50
100
Debt
150
Listed shares
20
30
40
200
50
250
Figure 7: Direct and indirect exposures of euro area investors to UK securities in 2016Q1
and 2020Q4 (EUR bn)
HH
16Q1 20Q4 16Q1 20Q4 16Q1 20Q4 16Q1 20Q4 16Q1 20Q4 16Q1 20Q4
B
OFI
Indirect
IC
PF
Direct
(a) Debt securities
NFC
HH
Indirect
(b) Listed shares
Source: ECB. Note: “Direct” refers to securities held by euro area investors in their own portfolio; “Indirect” refers to
securities held by euro area investors via holdings of investment fund shares. “B” are deposit-taking corporation; “IF” are
investment and money market funds; “OFI” are other financial intermediaries; “IC” are insurance companies; “PF” are
pension funds; “NFC” are non-financial corporations; “HH” are households.
10
16Q1 20Q4 16Q1 20Q4 16Q1 20Q4 16Q1 20Q4 16Q1 20Q4 16Q1 20Q4
B
OFI
IC
PF
Direct GBP
Direct EUR
Direct OTH
NFC
Indirect GBP
Indirect EUR
Indirect OTH
(a) Debt securities
HH
0
0
50
100
Debt
150
Listed shares
20
30
40
200
50
250
Figure 8: Direct and indirect exposures of euro area investors to UK securities by currency
in 2016Q1 and 2020Q4 (EUR bn)
16Q1 20Q4 16Q1 20Q4 16Q1 20Q4 16Q1 20Q4 16Q1 20Q4 16Q1 20Q4
B
OFI
IC
PF
Direct GBP
Direct EUR
Direct OTH
NFC
HH
Indirect GBP
Indirect EUR
Indirect OTH
(b) Listed shares
Source: ECB. Note: “Direct” refers to securities held by euro area investors in their own portfolio; “Indirect” refers
to securities held by euro area investors via holdings of investment fund shares. ”GBP”, ”EUR” and ”OTH” refer to
securities denominated in British pound, euro and other currencies, respectively. “B” are deposit-taking corporation; “IF”
are investment and money market funds; “OFI” are other financial intermediaries; “IC” are insurance companies; “PF” are
pension funds; “NFC” are non-financial corporations; “HH” are households.
ECB Working Paper Series No 2734 / September 2022
33
35.
16Q1 20Q4 16Q1 20Q4 16Q1 20Q4 16Q1 20Q4 16Q1 20Q4 16Q1 20Q4B
OFI
IC
PF
Direct UK
Direct EA
Direct OTH
NFC
0
0
10
50
Debt
Listed shares
20
30
100
40
50
150
Figure 9: Direct and indirect exposures of euro area investors to GBP-denominated securities by issuer geography in 2016Q1 and 2020Q4 (EUR bn)
HH
16Q1 20Q4 16Q1 20Q4 16Q1 20Q4 16Q1 20Q4 16Q1 20Q4 16Q1 20Q4
B
OFI
Indirect UK
Indirect EA
Indirect OTH
IC
PF
Direct UK
Direct EA
Direct OTH
(a) Debt securities
NFC
HH
Indirect UK
Indirect EA
Indirect OTH
(b) Listed shares
Source: ECB. Note: “Direct” refers to securities held by euro area investors in their own portfolio; “Indirect” refers to
securities held by euro area investors via holdings of investment fund shares. ”UK”, ”EA” and ”OTH” refer to securities
issued by residents of the United Kingdomw, the euro area and other countries, respectively. “B” are deposit-taking
corporation; “IF” are investment and money market funds; “OFI” are other financial intermediaries; “IC” are insurance
companies; “PF” are pension funds; “NFC” are non-financial corporations; “HH” are households.
Figure 10: Spread of British and German government bonds and German yields - 5-year
tenor (spreads in basis points, yields in %)
200
175
150
125
100
75
50
25
0
-25
-50
-75
1999
5Y spread (lhs)
2002
2005
2008
5y German yields (rhs)
2011
2014
2017
8
7
6
5
4
3
2
1
0
-1
-2
-3
2020
Source: Bloomberg and authors’ calculations
ECB Working Paper Series No 2734 / September 2022
34
36.
Figure 11: Spread of British and German government bonds and German yields - 10-yeartenor (spreads in basis points, yields in %)
200
175
150
125
100
75
50
25
0
-25
-50
-75
1999
10Y spread (lhs)
2002
2005
2008
10Y German yields (rhs)
2011
2014
2017
8
7
6
5
4
3
2
1
0
-1
-2
-3
2020
Source: Bloomberg and authors’ calculations
Figure 12: European and British stock indices (index base=31-12-2015)
130
Stoxx600 ex UK
FTSE100
FTSE250
120
110
100
90
80
70
2016
Brexit referendum
2017
2018
2019
2020
Source: Bloomberg and authors’ calculations.
ECB Working Paper Series No 2734 / September 2022
35
37.
Figure 13: British FTSE stock index - headline and bank subsector (index base=31-12-2015)130
FTSE350
FTSE350 BANKS
120
110
100
90
80
70
60
Brexit referendum
50
40
2016
2017
2018
2019
2020
Source: Bloomberg and authors’ calculations.
ECB Working Paper Series No 2734 / September 2022
36
38.
ECB Working Paper Series No 2734 / September 202237
Observations
49,763
39,670
67,332
26,011
52,432
61,065
64,931 117,601 131,105 31,280
77,083
83,911
22,017
59,082
65,301
36,358 107,126 115,707
0.06
0.09
0.05
0.06
0.11
0.07
0.05
0.10
0.08
0.06
0.10
0.09
0.07
0.10
0.08
0.06
0.10
0.09
R-squared
B
B
NF C
B
U KGBP
, U KEU
R and U KOT H are exposures to securities issued in the UK, by banks, and denominated in, respectively, sterling, euro and other currencies. U KGBP ,
NF C
NF C
OF I
OF I
OF I
GG
U KEU
R and U KOT H are similar dummies for securities issued by NFCs; U KGBP , U KEU R and U KOT H for securities issued by OFIs; U KGBP for securities issued
by the general government. *** p<0.01, ** p<0.05, * p<0.1. Robust standard errors in parentheses, clustered at holder and issuer country-sector-currency level.
(1)
(2)
(3)
(4)
(5)
(6)
(7)
(8)
(9)
(10)
(11)
(12)
(13)
(14)
(15)
(16)
(17)
(18)
B dir
B ind
B tot OFI dir OFI ind OFI tot IC dir
IC ind
IC tot PF dir PF ind PF tot NFC dir NFC ind NFC tot HH dir HH ind HH tot
)
ln(hic,a,is,c
-0.07*** -0.08*** -0.06*** -0.09*** -0.10*** -0.08*** -0.04*** -0.07*** -0.05*** -0.04*** -0.08*** -0.06*** -0.08*** -0.08*** -0.06*** -0.03*** -0.07*** -0.05***
hc,hs
(0.00)
(0.00)
(0.00)
(0.00)
(0.00)
(0.00)
(0.00)
(0.00)
(0.00)
(0.00)
(0.00)
(0.00)
(0.00)
(0.00)
(0.00)
(0.00)
(0.00)
(0.00)
Distance
-0.07*** -0.04*** -0.06*** -0.04*** -0.03*** -0.05*** -0.03*** -0.02*** -0.03*** -0.04*** -0.01*** -0.03*** -0.07*** -0.03*** -0.04*** -0.03*** -0.02*** -0.03***
(0.00)
(0.00)
(0.00)
(0.00)
(0.00)
(0.00)
(0.01)
(0.00)
(0.00)
(0.00)
(0.00)
(0.00)
(0.00)
(0.01)
(0.00)
(0.00)
(0.00)
(0.00)
Imports
-0.00*** -0.00 -0.00*** -0.01*** 0.00*** -0.00*
-0.00
0.00
0.00
0.00
-0.00
0.00
-0.01*** 0.00*
-0.00 -0.00***
0.00
-0.00
(0.00)
(0.00)
(0.00)
(0.00)
(0.00)
(0.00)
(0.00)
(0.00)
(0.00)
(0.00)
(0.00)
(0.00)
(0.00)
(0.00)
(0.00)
(0.00)
(0.00)
(0.00)
Com. language
0.01
-0.00
0.01
0.03**
-0.01
0.00
-0.00
0.00
-0.00
-0.01
-0.00
-0.01
0.03* -0.01*** -0.01**
0.00
-0.00
-0.00
(0.01)
(0.00)
(0.00)
(0.01)
(0.01)
(0.01)
(0.01)
(0.00)
(0.00)
(0.00)
(0.00)
(0.01)
(0.00)
(0.01)
(0.00)
(0.00)
(0.01)
(0.00)
B
U KGBP
0.10** 0.22*** 0.14***
0.05
0.19***
0.06*
0.11*** 0.32*** 0.23***
0.03
0.32*** 0.22***
0.04
0.24*** 0.18***
-0.02
0.30*** 0.22***
(0.04)
(0.03)
(0.02)
(0.05)
(0.05)
(0.04)
(0.07)
(0.02)
(0.03)
(0.03)
(0.02)
(0.03)
(0.04)
(0.07)
(0.04)
(0.03)
(0.02)
(0.03)
B
U KEU
0.31*** 0.26*** 0.30*** 0.15*** 0.27*** 0.15*** 0.19*** 0.33*** 0.28*** 0.09*** 0.31*** 0.23*** 0.23*** 0.28*** 0.20*** 0.04** 0.29*** 0.21***
R
(0.04)
(0.03)
(0.02)
(0.03)
(0.05)
(0.03)
(0.05)
(0.02)
(0.02)
(0.03)
(0.03)
(0.03)
(0.04)
(0.04)
(0.04)
(0.04)
(0.02)
(0.03)
B
U KOT
0.01
-0.05
-0.02
0.01
0.02
-0.04
0.04
-0.01
0.01
-0.00
-0.04
-0.03
0.06
-0.04
-0.04
-0.02
-0.03
-0.03
H
(0.04)
(0.04)
(0.03)
(0.03)
(0.07)
(0.04)
(0.06)
(0.04)
(0.03)
(0.04)
(0.03)
(0.05)
(0.05)
(0.05)
(0.06)
(0.04)
(0.02)
(0.04)
GG
U KGBP
0.12** 0.35*** 0.22***
0.05
0.36*** 0.17*** 0.13*** 0.44*** 0.30*** 0.12** 0.45*** 0.33***
0.01
0.37*** 0.25***
-0.01
0.40*** 0.29***
(0.04)
(0.04)
(0.03)
(0.06)
(0.05)
(0.03)
(0.08)
(0.02)
(0.03)
(0.04)
(0.03)
(0.05)
(0.05)
(0.05)
(0.04)
(0.04)
(0.03)
(0.04)
NF C
U KGBP
0.16*** 0.11** 0.13***
0.04
0.04**
0.04
0.05
0.20*** 0.15***
0.00
0.19*** 0.14***
-0.06
0.11*** 0.07**
-0.01
0.17*** 0.13***
(0.05)
(0.03)
(0.02)
(0.04)
(0.05)
(0.04)
(0.09)
(0.02)
(0.03)
(0.03)
(0.02)
(0.06)
(0.04)
(0.05)
(0.04)
(0.03)
(0.02)
(0.03)
NF C
U KEU
0.20*** 0.24*** 0.21*** 0.14** 0.15*** 0.13*** 0.21*** 0.27*** 0.27*** 0.12*** 0.24*** 0.22*** 0.14*** 0.21*** 0.16***
0.01
0.25*** 0.18***
R
(0.05)
(0.03)
(0.02)
(0.03)
(0.05)
(0.03)
(0.07)
(0.02)
(0.02)
(0.03)
(0.02)
(0.03)
(0.04)
(0.03)
(0.04)
(0.03)
(0.02)
(0.03)
NF C
U KOT
0.04
0.07**
0.05
0.11**
0.07*
-0.11**
0.01
-0.06*
0.01
0.10**
0.06**
0.02
0.15*** 0.11***
-0.01
0.09**
0.01
0.08*
H
(0.03)
(0.03)
(0.03)
(0.04)
(0.05)
(0.04)
(0.05)
(0.02)
(0.03)
(0.04)
(0.03)
(0.03)
(0.04)
(0.03)
(0.04)
(0.03)
(0.02)
(0.05)
OF I
U KGBP
0.15*** 0.17*** 0.14***
0.08
0.13***
0.06
0.08*** 0.27*** 0.19***
0.06*
0.26*** 0.19*** 0.14** 0.19*** 0.14*** -0.05*** 0.24*** 0.17***
(0.04)
(0.03)
(0.02)
(0.04)
(0.05)
(0.04)
(0.07)
(0.02)
(0.03)
(0.03)
(0.02)
(0.03)
(0.04)
(0.07)
(0.04)
(0.03)
(0.02)
(0.03)
OF I
U KEU
0.24*** 0.24*** 0.23*** 0.13** 0.19*** 0.15*** 0.20*** 0.28*** 0.27*** 0.11*** 0.25*** 0.22*** 0.16*** 0.24*** 0.18***
0.04*
0.26*** 0.19***
R
(0.04)
(0.04)
(0.03)
(0.03)
(0.05)
(0.03)
(0.06)
(0.02)
(0.02)
(0.03)
(0.02)
(0.03)
(0.04)
(0.04)
(0.04)
(0.04)
(0.02)
(0.03)
Table 1: Debt securities, UK-exposures by currency of denomination – all euro area countries
39.
ECB Working Paper Series No 2734 / September 202238
Observations
49,766
39,673
67,333
26,011
52,433
61,066
64,931 117,601 131,104 31,280
77,083
83,912
22,022
59,081
65,302
36,360 107,125 115,706
R-squared
0.06
0.09
0.05
0.06
0.11
0.07
0.05
0.09
0.07
0.06
0.10
0.08
0.07
0.10
0.07
0.06
0.10
0.09
B
B
GG
B
GBPU K , GBPEA and GBPOT H are dummies for sterling exposures, issued by banks, in, respectively the UK, the euro area and all other countries. GBPU
K,
GG
GG
NF C
NF C
NF C
GBPEA and GBPOT H are similar dummies for securities issued by the general government; GBPU K , GBPEA and GBPOT H for securities issued by NFCs; and
OF I
OF I
OF I
GBPU
and GBPOT
K , GBPEA
H for securities issued by OFIs. *** p<0.01, ** p<0.05, * p<0.1. Robust standard errors in parentheses, clustered at holder and issuer
country-sector-currency level.
(1)
(2)
(3)
(4)
(5)
(6)
(7)
(8)
(9)
(10)
(11)
(12)
(13)
(14)
(15)
(16)
(17)
(18)
B dir
B ind
B tot OFI dir OFI ind OFI tot IC dir
IC ind
IC tot PF dir PF ind PF tot NFC dir NFC ind NFC tot HH dir HH ind HH tot
)
ln(hic,a,is,c
-0.07*** -0.08*** -0.06*** -0.09*** -0.09*** -0.07*** -0.04*** -0.07*** -0.05*** -0.04*** -0.08*** -0.06*** -0.08*** -0.08*** -0.06*** -0.03*** -0.07*** -0.05***
hc,hs
(0.00)
(0.00)
(0.00)
(0.00)
(0.00)
(0.00)
(0.00)
(0.00)
(0.00)
(0.00)
(0.00)
(0.00)
(0.00)
(0.00)
(0.00)
(0.00)
(0.00)
(0.00)
Distance
-0.06*** -0.03*** -0.05*** -0.04*** -0.02*** -0.04*** -0.02*** -0.02*** -0.02*** -0.03*** -0.01*** -0.03*** -0.06*** -0.03*** -0.03*** -0.02*** -0.02*** -0.02***
(0.00)
(0.00)
(0.00)
(0.00)
(0.00)
(0.00)
(0.01)
(0.00)
(0.00)
(0.00)
(0.00)
(0.00)
(0.00)
(0.01)
(0.00)
(0.00)
(0.00)
(0.00)
Imports
-0.00*** -0.00
-0.00** -0.01*** 0.00** -0.00**
0.00*
0.00*** 0.00***
0.00
0.00
0.00
-0.01*** 0.00*
-0.00 -0.00*** 0.00***
0.00
(0.00)
(0.00)
(0.00)
(0.00)
(0.00)
(0.00)
(0.00)
(0.00)
(0.00)
(0.00)
(0.00)
(0.00)
(0.00)
(0.00)
(0.00)
(0.00)
(0.00)
(0.00)
Com. language 0.02**
-0.01
0.01
0.03**
-0.00
0.01
-0.00
0.00
-0.00
-0.01
-0.01
-0.01
0.03** -0.01*** -0.01**
0.00
-0.01*
-0.00
(0.01)
(0.00)
(0.00)
(0.01)
(0.01)
(0.01)
(0.01)
(0.00)
(0.00)
(0.00)
(0.00)
(0.01)
(0.00)
(0.01)
(0.00)
(0.00)
(0.01)
(0.00)
B
GBPU
0.06
0.26*** 0.10** 0.26*** 0.27*** 0.17*** 0.05** 0.30*** 0.18***
0.02
0.32*** 0.19***
0.11
0.26*** 0.20***
-0.01
0.27*** 0.19***
K
(0.03)
(0.02)
(0.01)
(0.06)
(0.03)
(0.04)
(0.06)
(0.02)
(0.02)
(0.02)
(0.01)
(0.04)
(0.02)
(0.08)
(0.02)
(0.02)
(0.03)
(0.02)
B
GBPEA
0.06
0.11***
0.04
0.03
0.08***
0.03
-0.03
0.12*** 0.06***
-0.06
0.15*** 0.07***
0.05
0.08*** 0.08*** -0.06** 0.11*** 0.07***
(0.02)
(0.02)
(0.01)
(0.05)
(0.03)
(0.04)
(0.07)
(0.02)
(0.02)
(0.02)
(0.01)
(0.04)
(0.02)
(0.07)
(0.02)
(0.02)
(0.03)
(0.02)
B
GBPOT
0.08*
0.09***
0.07*
0.08*
0.06***
0.02
0.01
0.10*** 0.05***
-0.03
0.11*** 0.06***
-0.02
0.07*** 0.07*** -0.06** 0.08*** 0.06***
H
(0.02)
(0.02)
(0.01)
(0.05)
(0.02)
(0.04)
(0.05)
(0.02)
(0.02)
(0.02)
(0.01)
(0.04)
(0.02)
(0.08)
(0.02)
(0.02)
(0.03)
(0.02)
GG
GBPU
0.07
0.40*** 0.18*** 0.26*** 0.41*** 0.27*** 0.08*** 0.42*** 0.26*** 0.13** 0.46*** 0.30***
0.08
0.38*** 0.28***
0.01
0.39*** 0.27***
K
(0.03)
(0.02)
(0.01)
(0.07)
(0.03)
(0.04)
(0.07)
(0.03)
(0.03)
(0.02)
(0.01)
(0.05)
(0.03)
(0.06)
(0.03)
(0.02)
(0.04)
(0.02)
GG
GBPEA
0.04
0.01
0.00
0.11**
0.00
-0.06** -0.04*
0.05*
0.01
-0.20*** 0.08***
0.03
0.02
0.01
0.01
-0.01
0.03
0.02
(0.02)
(0.02)
(0.02)
(0.05)
(0.04)
(0.04)
(0.05)
(0.02)
(0.02)
(0.03)
(0.02)
(0.05)
(0.03)
(0.05)
(0.03)
(0.02)
(0.03)
(0.03)
GG
GBPOT
-0.02
-0.05
-0.04
0.01
-0.08*** -0.09***
0.03
-0.01
0.02
-0.03 -0.11*** -0.08*** -0.01
-0.04*
-0.02
-0.01
-0.03
0.01
H
(0.03)
(0.02)
(0.02)
(0.06)
(0.04)
(0.05)
(0.03)
(0.02)
(0.04)
(0.03)
(0.03)
(0.03)
(0.03)
(0.10)
(0.02)
(0.02)
(0.03)
(0.02)
NF C
GBPU
0.11** 0.15***
0.09*
0.25*** 0.13*** 0.15***
-0.01
0.18*** 0.10***
-0.01
0.19*** 0.11***
0.01
0.13*** 0.10***
0.01
0.15*** 0.10***
K
(0.04)
(0.02)
(0.01)
(0.05)
(0.03)
(0.05)
(0.08)
(0.02)
(0.03)
(0.01)
(0.01)
(0.06)
(0.02)
(0.06)
(0.02)
(0.02)
(0.03)
(0.01)
NF C
GBPEA
-0.04
-0.02
-0.03
0.10* -0.08*** -0.04
-0.04
-0.01
-0.01
-0.07*
0.01
-0.03
0.01
-0.04*
-0.04** -0.06*
-0.01
-0.02
(0.03)
(0.02)
(0.01)
(0.05)
(0.03)
(0.04)
(0.06)
(0.02)
(0.03)
(0.02)
(0.02)
(0.04)
(0.03)
(0.06)
(0.02)
(0.02)
(0.03)
(0.02)
NF C
-0.02
-0.01
GBPOT H
-0.04
-0.01
-0.02
0.10**
-0.02
0.02
0.02
-0.02
-0.00
-0.02
-0.03
-0.02
-0.13
-0.03
-0.03
-0.04*
(0.03)
(0.02)
(0.01)
(0.06)
(0.04)
(0.04)
(0.05)
(0.03)
(0.02)
(0.02)
(0.02)
(0.05)
(0.03)
(0.09)
(0.03)
(0.02)
(0.04)
(0.02)
OF I
GBPU
0.10*
0.21***
0.09*
0.29*** 0.21*** 0.17***
0.02
0.25*** 0.14***
0.05
0.26*** 0.15*** 0.22*** 0.21*** 0.17***
-0.03
0.22*** 0.14***
K
(0.03)
(0.02)
(0.01)
(0.06)
(0.03)
(0.05)
(0.06)
(0.02)
(0.03)
(0.02)
(0.01)
(0.04)
(0.02)
(0.08)
(0.02)
(0.02)
(0.03)
(0.02)
OF I
GBPEA
0.02
0.03
-0.03
0.02
-0.03
0.13*
0.00
0.00
-0.05* 0.06***
0.03*
-0.00
0.07***
0.03
0.03*
-0.13*** 0.06*** 0.04***
(0.03)
(0.02)
(0.01)
(0.06)
(0.03)
(0.04)
(0.07)
(0.02)
(0.03)
(0.02)
(0.02)
(0.08)
(0.02)
(0.07)
(0.02)
(0.02)
(0.04)
(0.02)
Table 2: Debt securities, sterling exposures by issuer country – all euro area countries
40.
ECB Working Paper Series No 2734 / September 202239
Observations
8,075
14,748
16,712
10,557
19,415
21,875
12,883
40,480
41,341
10,732
28,206
29,671
9,407
21,432
23,297
18,255
37,739
0.12
0.16
0.09
0.09
0.16
0.08
0.11
0.23
0.21
0.18
0.20
0.19
0.11
0.23
0.16
0.18
0.26
R-squared
B
NF C
NF C
B
U KGBP
and U KEU
R are exposures to securities issued in the UK, by banks, and denominated in, respectively, sterling and euro. U KGBP and U KEU R are similar
OF I
OF I
dummies for securities issued by NFCs; U KGBP
and U KEU
R for securities issued by OFIs. *** p<0.01, ** p<0.05, * p<0.1. Robust standard errors in parentheses,
clustered at holder and issuer country-sector-currency level.
40,967
0.23
(1)
(2)
(3)
(4)
(5)
(6)
(7)
(8)
(9)
(10)
(11)
(12)
(13)
(14)
(15)
(16)
(17)
(18)
B dir
B ind
B tot OFI dir OFI ind OFI tot IC dir
IC ind
IC tot PF dir PF ind PF tot NFC dir NFC ind NFC tot HH dir HH ind HH tot
-0.15*** -0.10*** -0.10*** -0.08*** -0.09*** -0.07*** -0.05*** -0.05*** -0.05*** -0.06*** -0.09*** -0.06*** -0.04*** -0.07*** -0.05*** -0.02*** -0.05*** -0.03***
(0.01)
(0.01)
(0.00)
(0.01)
(0.01)
(0.01)
(0.01)
(0.01)
(0.00)
(0.00)
(0.00)
(0.00)
(0.01)
(0.00)
(0.01)
(0.00)
(0.00)
(0.00)
Distance
-0.09*** -0.06*** -0.08*** -0.10*** -0.04*** -0.07*** -0.05*** -0.02*** -0.03*** -0.04*** -0.02*** -0.03*** -0.05*** -0.04*** -0.05*** -0.03*** -0.02*** -0.03***
(0.01)
(0.01)
(0.00)
(0.02)
(0.01)
(0.01)
(0.01)
(0.01)
(0.01)
(0.00)
(0.00)
(0.01)
(0.01)
(0.01)
(0.01)
(0.01)
(0.01)
(0.00)
Imports
-0.03*** -0.00 -0.01*** -0.01*** -0.00* -0.01*** -0.00**
-0.00
-0.00
-0.00
-0.00
-0.00 -0.02*** -0.00*** -0.01*** -0.00*** -0.00* -0.00**
(0.00)
(0.00)
(0.00)
(0.01)
(0.00)
(0.00)
(0.00)
(0.00)
(0.00)
(0.00)
(0.00)
(0.00)
(0.00)
(0.00)
(0.00)
(0.00)
(0.00)
(0.00)
Com. language
0.06
-0.00
0.01
0.02
0.01
0.01
0.01
0.01**
0.00
0.01
0.02**
0.01*
0.03**
0.00
0.02*
0.02***
0.01
0.01***
(0.01)
(0.01)
(0.00)
(0.04)
(0.01)
(0.02)
(0.03)
(0.00)
(0.01)
(0.00)
(0.00)
(0.01)
(0.01)
(0.01)
(0.01)
(0.01)
(0.01)
(0.00)
B
U KGBP
-0.21** -0.14*** -0.04
-0.16** -0.14*** -0.10*** -0.12*** -0.03
-0.03 -0.14*** -0.08* -0.06** -0.16*** -0.10*** -0.10*** -0.09*** -0.04** -0.05***
(0.03)
(0.03)
(0.02)
(0.10)
(0.04)
(0.06)
(0.06)
(0.03)
(0.04)
(0.02)
(0.02)
(0.04)
(0.04)
(0.03)
(0.03)
(0.02)
(0.02)
(0.02)
B
U KEU
-0.24*** -0.34*** -0.07
0.04
-0.12*** -0.06** -0.10*** -0.14*** -0.14*** -0.10*** -0.40*** -0.29*** -0.32*** -0.19*** -0.15*** -0.05 -0.12*** -0.07
R
(0.03)
(0.08)
(0.05)
(0.09)
(0.07)
(0.08)
(0.05)
(0.03)
(0.04)
(0.04)
(0.04)
(0.03)
(0.11)
(0.04)
(0.04)
(0.03)
(0.06)
(0.03)
NF C
U KGBP
0.15
0.21*** 0.22*** 0.20*** 0.21*** 0.18*** 0.12*** 0.19*** 0.18*** 0.09*** 0.25*** 0.17***
-0.00
0.19*** 0.09*** 0.07*** 0.15*** 0.10***
(0.03)
(0.02)
(0.02)
(0.10)
(0.04)
(0.05)
(0.04)
(0.03)
(0.02)
(0.02)
(0.02)
(0.02)
(0.03)
(0.03)
(0.03)
(0.02)
(0.01)
(0.02)
NF C
U KEU
-0.31*** -0.17*** -0.19*** -0.06 -0.17*** -0.15*** -0.15*** -0.05*
-0.04 -0.15*** -0.13*** -0.09** -0.19* -0.11*** -0.09* -0.09** -0.06*** -0.07***
R
(0.05)
(0.03)
(0.02)
(0.10)
(0.05)
(0.07)
(0.17)
(0.03)
(0.04)
(0.03)
(0.03)
(0.03)
(0.05)
(0.10)
(0.03)
(0.05)
(0.05)
(0.02)
OF I
0.00
U KGBP
-0.13 -0.10*** -0.05
-0.10* -0.10*** -0.10*** -0.07***
0.00
-0.12*** -0.03
-0.04
-0.11** -0.07** -0.08*** -0.08*** -0.02
-0.04**
(0.04)
(0.03)
(0.02)
(0.11)
(0.04)
(0.07)
(0.06)
(0.03)
(0.02)
(0.02)
(0.02)
(0.02)
(0.04)
(0.05)
(0.03)
(0.03)
(0.02)
(0.02)
)
ln(hic,a,is,c
hc,hs
Table 3: Listed shares, UK exposures by currency of denomination – all euro area countries
41.
ECB Working Paper Series No 2734 / September 202240
Observations
8,075
14,748
16,712
10,556
19,414
21,875
12,883
40,481
41,342
10,733
28,206
29,671
9,408
21,432
23,298
18,258
37,739
0.12
0.16
0.09
0.09
0.17
0.08
0.11
0.24
0.21
0.18
0.20
0.19
0.11
0.24
0.16
0.18
0.26
R-squared
B
B
B
GG
GBPU
K , GBPEA and GBPOT H are dummies for sterling exposures, issued by banks, in, respectively the UK, the euro area and all other countries. GBPU K ,
GG
GG
NF C
NF C
NF C
GBPEA
and GBPOT
and GBPOT
H are similar dummies for securities issued by the general government; GBPU K , GBPEA
H for securities issued by NFCs; and
OF I
OF I
OF I
GBPU
,
GBP
and
GBP
for
securities
issued
by
OFIs.
***
p<0.01,
**
p<0.05,
*
p<0.1.
Robust
standard
errors
in
parentheses,
clustered at holder and issuer
K
EA
OT H
country-sector-currency level.
40,969
0.22
(1)
(2)
(3)
(4)
(5)
(6)
(7)
(8)
(9)
(10)
(11)
(12)
(13)
(14)
(15)
(16)
(17)
(18)
B dir
B ind
B tot OFI dir OFI ind OFI tot IC dir
IC ind
IC tot PF dir PF ind PF tot NFC dir NFC ind NFC tot HH dir HH ind HH tot
-0.15*** -0.10*** -0.10*** -0.08*** -0.10*** -0.07*** -0.05*** -0.06*** -0.05*** -0.05*** -0.09*** -0.06*** -0.04*** -0.07*** -0.05*** -0.03*** -0.05*** -0.03***
(0.01)
(0.00)
(0.00)
(0.01)
(0.01)
(0.01)
(0.01)
(0.01)
(0.00)
(0.00)
(0.00)
(0.00)
(0.01)
(0.00)
(0.01)
(0.00)
(0.00)
(0.00)
Distance
-0.09*** -0.06*** -0.08*** -0.10*** -0.04*** -0.07*** -0.05*** -0.02*** -0.03*** -0.03*** -0.03*** -0.04*** -0.05*** -0.04*** -0.04*** -0.03*** -0.02*** -0.03***
(0.01)
(0.00)
(0.00)
(0.02)
(0.01)
(0.01)
(0.01)
(0.01)
(0.01)
(0.00)
(0.00)
(0.01)
(0.01)
(0.01)
(0.01)
(0.01)
(0.00)
(0.00)
Imports
-0.03*** -0.00
-0.01** -0.01*** -0.00* -0.01*** -0.00**
-0.00
-0.00
-0.00
-0.00
-0.00 -0.01*** -0.00** -0.01*** -0.00*** -0.00
-0.00**
(0.00)
(0.00)
(0.00)
(0.01)
(0.00)
(0.00)
(0.00)
(0.00)
(0.00)
(0.00)
(0.00)
(0.00)
(0.00)
(0.00)
(0.00)
(0.00)
(0.00)
(0.00)
Com. language 0.06*
-0.01
0.01
0.02
0.01
0.01
0.01
0.01**
0.00
0.01
0.01*
0.01
0.03**
0.00
0.02*
0.02***
0.00
0.01***
(0.01)
(0.01)
(0.00)
(0.04)
(0.01)
(0.02)
(0.03)
(0.01)
(0.01)
(0.00)
(0.00)
(0.01)
(0.01)
(0.01)
(0.01)
(0.01)
(0.01)
(0.00)
B
GBPU
0.54*** 0.22*** 0.38***
0.02
0.14*** 0.10**
0.05
0.12*** 0.11***
0.08
0.22*** 0.16***
0.06
0.14*** 0.16*** 0.07** 0.11*** 0.08***
K
(0.05)
(0.04)
(0.02)
(0.14)
(0.05)
(0.08)
(0.08)
(0.02)
(0.05)
(0.02)
(0.02)
(0.05)
(0.04)
(0.11)
(0.03)
(0.04)
(0.03)
(0.02)
NF C
GBPU
0.91*** 0.58*** 0.65*** 0.38*** 0.50*** 0.38*** 0.30*** 0.37*** 0.34*** 0.31*** 0.56*** 0.40***
0.22*
0.43*** 0.36*** 0.23*** 0.31*** 0.24***
K
(0.05)
(0.04)
(0.02)
(0.14)
(0.07)
(0.09)
(0.07)
(0.04)
(0.05)
(0.02)
(0.03)
(0.04)
(0.05)
(0.11)
(0.04)
(0.05)
(0.03)
(0.03)
NF C
GBPOT
0.01
0.02
0.24** 0.19*** 0.22***
-0.06
0.10***
0.06
0.05*** 0.06***
0.05
0.13*** 0.09**
-0.13
0.07**
0.07**
0.05**
0.04*
H
(0.04)
(0.04)
(0.02)
(0.12)
(0.06)
(0.07)
(0.06)
(0.03)
(0.05)
(0.02)
(0.02)
(0.04)
(0.05)
(0.11)
(0.03)
(0.03)
(0.03)
(0.02)
OF I
GBPU K
0.62*** 0.26*** 0.37***
0.07
0.18***
0.10*
0.10** 0.16*** 0.15*** 0.10** 0.27*** 0.19***
0.10
0.18*** 0.19*** 0.08*** 0.13*** 0.10***
(0.05)
(0.04)
(0.02)
(0.14)
(0.05)
(0.09)
(0.08)
(0.03)
(0.05)
(0.02)
(0.02)
(0.04)
(0.04)
(0.11)
(0.03)
(0.04)
(0.03)
(0.02)
)
ln(hic,a,is,c
hc,hs
Table 4: Listed shares, sterling exposures by issuer country – all euro area countries
42.
AcknowledgementsWe thank Philip Lane, Yannick Timmer and participants at an internal ECB seminar for helpful comments and suggestions.
The views expressed are those of the authors and do not necessarily reflect those of Banco de Portugal or the European Central Bank.
Daniel Carvalho
Banco de Portugal, Lisbon, Portugal; email: dscarvalho@bportugal.pt
Martin Schmitz
European Central Bank, Frankfurt am Main, Germany; email: martin.schmitz@ecb.int
© European Central Bank, 2022
Postal address 60640 Frankfurt am Main, Germany
Telephone
+49 69 1344 0
Website
www.ecb.europa.eu
All rights reserved. Any reproduction, publication and reprint in the form of a different publication, whether printed or produced
electronically, in whole or in part, is permitted only with the explicit written authorisation of the ECB or the authors.
This paper can be downloaded without charge from www.ecb.europa.eu, from the Social Science Research Network electronic library or
from RePEc: Research Papers in Economics. Information on all of the papers published in the ECB Working Paper Series can be found
on the ECB’s website.
ISBN 978-92-899-5321-4
ISSN 1725-2806
doi:10.2866/48316
QB-AR-22-099-EN-N