


 Финансы
 Менеджмент
Похожие презентации:

")


Financial Management. Lecture 8. The Cost of Capital
1.
Financial Management:Principles & Applications
Thirteenth Edition
Lecture 8
The Cost of Capital
Copyright Education,
© 2018, 2014, 2011 Pearson
Inc. All Reserved
Rights Reserved
Copyright © 2018, 2014, 2011 Pearson
Inc. Education,
All Rights
2.
Learning Objectives (1 of 2)1. Understand the concepts underlying the firm’s
overall cost of capital and the purpose for its
calculation.
2. Evaluate a firm’s capital structure, and determine
the relative importance (weight) of each source
of financing.
3. Calculate the after-tax cost of debt, preferred
stock, and common equity.
Copyright © 2018, 2014, 2011 Pearson Education, Inc. All Rights Reserved
3.
Learning Objectives (2 of 2)4. Calculate a firm’s weighted average cost of
capital.
5. Discuss the pros and cons of using multiple,
risk-adjusted discount rates and describe the
divisional cost of capital as a viable alternative
for firms with multiple divisions.
6. Adjust the NPV for the costs of issuing new
securities when analyzing new investment
opportunities.
Copyright © 2018, 2014, 2011 Pearson Education, Inc. All Rights Reserved
4.
Principles Applied in This Chapter• Principle 1: Money Has a Time Value.
• Principle 2: There is a Risk-Return Tradeoff.
• Principle 3: Cash Flows Are the Source of Value.
• Principle 4: Market Prices Reflect Information.
• Principle 5: Individuals Respond to Incentives.
Copyright © 2018, 2014, 2011 Pearson Education, Inc. All Rights Reserved
5.
14.1 THE COST OF CAPITAL: AN OVERVIEWCopyright © 2018, 2014, 2011 Pearson Education, Inc. All Rights Reserved
6.
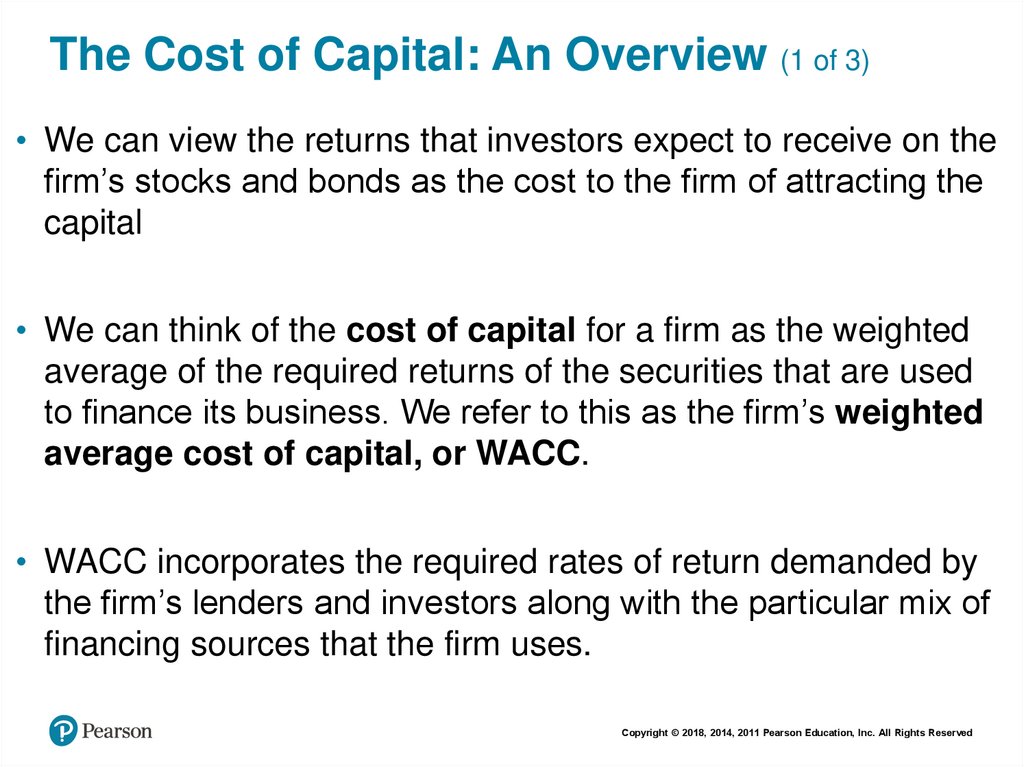
The Cost of Capital: An Overview (1 of 3)• We can view the returns that investors expect to receive on the
firm’s stocks and bonds as the cost to the firm of attracting the
capital
• We can think of the cost of capital for a firm as the weighted
average of the required returns of the securities that are used
to finance its business. We refer to this as the firm’s weighted
average cost of capital, or WACC.
• WACC incorporates the required rates of return demanded by
the firm’s lenders and investors along with the particular mix of
financing sources that the firm uses.
Copyright © 2018, 2014, 2011 Pearson Education, Inc. All Rights Reserved
7.
The Cost of Capital: An Overview (2 of 3)The riskiness of a firm affects its WACC in two
ways:
– First, required rate of return on the debt and equity
securities that the firm issues will be higher if the firm is
riskier, and
– Second, risk influences how the firm chooses the
extent to which it is financed with debt and equity
securities.
Copyright © 2018, 2014, 2011 Pearson Education, Inc. All Rights Reserved
8.
The Cost of Capital: Importance (3 of 3)The firm’s WACC is used in a number of ways:
First, WACC is used to value the entire firm.
Second, firms often use WACC as the starting
point for determining the discount rate for
individual investment projects they might
undertake
Finally, firms sometimes use their WACC to
evaluate their performance
Copyright © 2018, 2014, 2011 Pearson Education, Inc. All Rights Reserved
9.
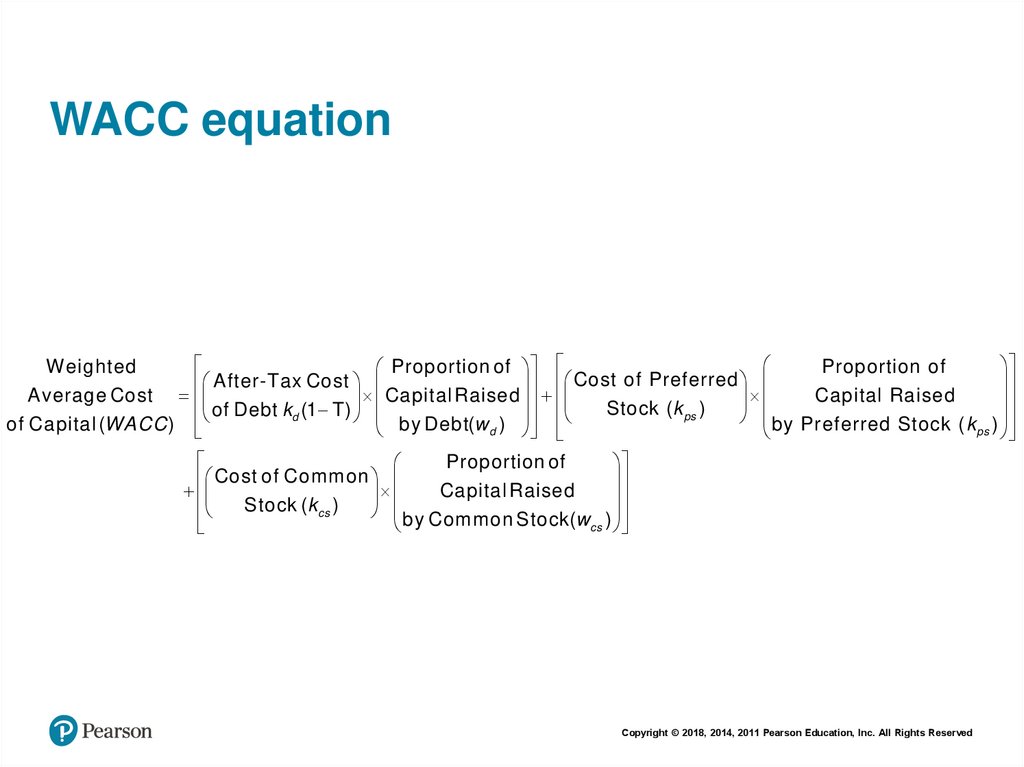
WACC equationW eighted
Proportion of
Proportion of
After-Tax Cost
Cost of Preferred
Average Cost
Capital Raised
Capital Raised
Stock ( k ps )
of Debt kd (1 T)
of Capital (WACC )
by Debt(w d )
by Pr eferred Stock ( k ps )
Proportion of
Cost of Common
Capital Raised
Stock (kcs )
by Common Stock(w )
cs
Copyright © 2018, 2014, 2011 Pearson Education, Inc. All Rights Reserved
10.
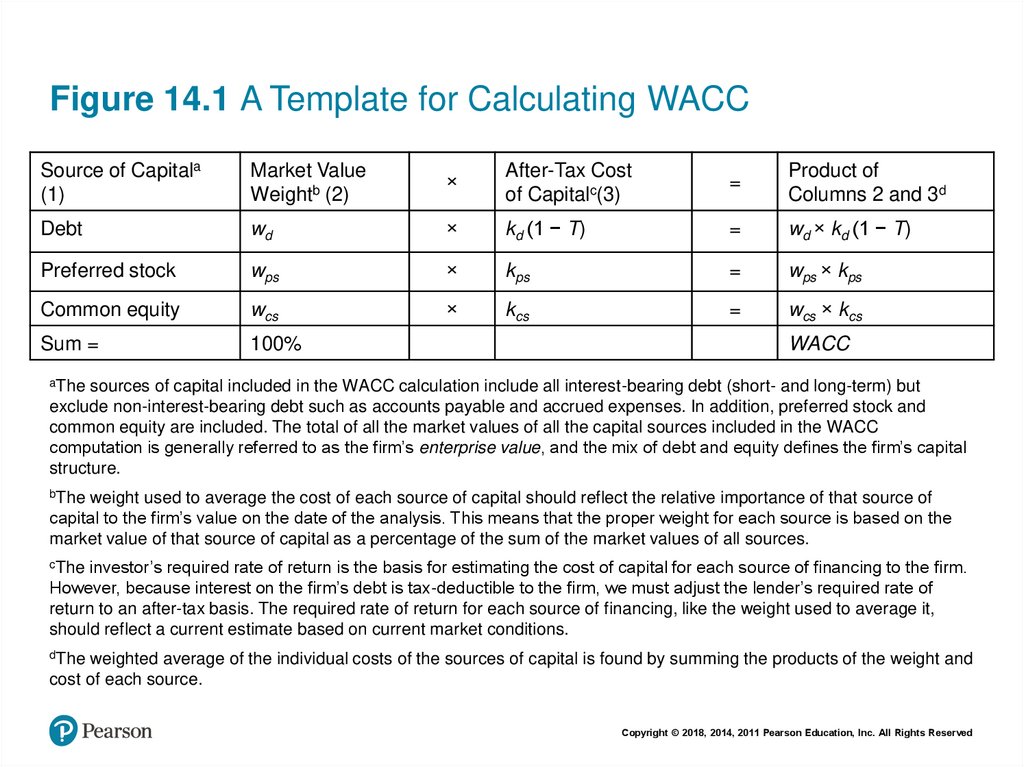
Figure 14.1 A Template for Calculating WACCSource of Capitala
(1)
Market Value
Weightb (2)
×
After-Tax Cost
of Capitalc(3)
=
Product of
Columns 2 and 3d
Debt
wd
×
kd (1 − T)
=
wd × kd (1 − T)
Preferred stock
wps
×
kps
=
wps × kps
Common equity
wcs
×
kcs
=
wcs × kcs
Sum =
100%
Blank
Blank
Blank
WACC
aThe sources of capital included in the WACC calculation include all interest-bearing debt (short- and long-term) but
exclude non-interest-bearing debt such as accounts payable and accrued expenses. In addition, preferred stock and
common equity are included. The total of all the market values of all the capital sources included in the WACC
computation is generally referred to as the firm’s enterprise value, and the mix of debt and equity defines the firm’s capital
structure.
bThe weight used to average the cost of each source of capital should reflect the relative importance of that source of
capital to the firm’s value on the date of the analysis. This means that the proper weight for each source is based on the
market value of that source of capital as a percentage of the sum of the market values of all sources.
cThe investor’s required rate of return is the basis for estimating the cost of capital for each source of financing to the firm.
However, because interest on the firm’s debt is tax-deductible to the firm, we must adjust the lender’s required rate of
return to an after-tax basis. The required rate of return for each source of financing, like the weight used to average it,
should reflect a current estimate based on current market conditions.
dThe weighted average of the individual costs of the sources of capital is found by summing the products of the weight and
cost of each source.
Copyright © 2018, 2014, 2011 Pearson Education, Inc. All Rights Reserved
11.
Three—Step Procedure for Estimating theFirm’s WACC (1 of 2)
1. Define the firm’s capital structure by determining
the weight of each source of capital. (see column 2,
figure 14.1). The weight (importance) of each source
of capital is based on the current market value of
each source of capital.
2. Estimate the cost of each source of financing.
These costs are equal to the investor’s required
rates of return after adjusting the cost of debt for the
effects of taxes (see column 3, figure 14-1)
Copyright © 2018, 2014, 2011 Pearson Education, Inc. All Rights Reserved
12.
Three—Step Procedure for Estimating theFirm’s WACC (2 of 2)
3. Calculate a weighted average of the cost of
capital from all source of financing. This step
requires calculating the product of the after-tax
cost of each capital source used by the firm and
the weight associated with that source. The sum
of these products is the WACC. (see column 4,
figure 14-1)
Copyright © 2018, 2014, 2011 Pearson Education, Inc. All Rights Reserved
13.
14.2 DETERMINING THE FIRM’SCAPITAL STRUCTURE WEIGHTS
Copyright © 2018, 2014, 2011 Pearson Education, Inc. All Rights Reserved
14.
Determining the Firm’s Capital StructureWeights (1 of 2)
The weights are based on the following sources of
financing: debt (short-term and long-term), preferred
stock and common equity.
Liabilities such as accounts payable are not
included in capital structure.
Copyright © 2018, 2014, 2011 Pearson Education, Inc. All Rights Reserved
15.
Determining the Firm’s Capital StructureWeights (2 of 2)
• In theory, market value is preferred for all
securities. However, not all market values may be
readily available.
• In practice, we generally use book values for debt
and market values for equity securities.
Copyright © 2018, 2014, 2011 Pearson Education, Inc. All Rights Reserved
16.
14.3 ESTIMATING THE COST OFINDIVIDUAL SOURCES OF CAPITAL
Copyright © 2018, 2014, 2011 Pearson Education, Inc. All Rights Reserved
17.
The Cost of Debt (1 of 4)The cost of debt is the rate of return the firm’s
lenders demand when they loan money to the firm.
We estimate the market’s required rate of return on
a firm’s debt using its yield to maturity and not the
coupon rate.
Copyright © 2018, 2014, 2011 Pearson Education, Inc. All Rights Reserved
18.
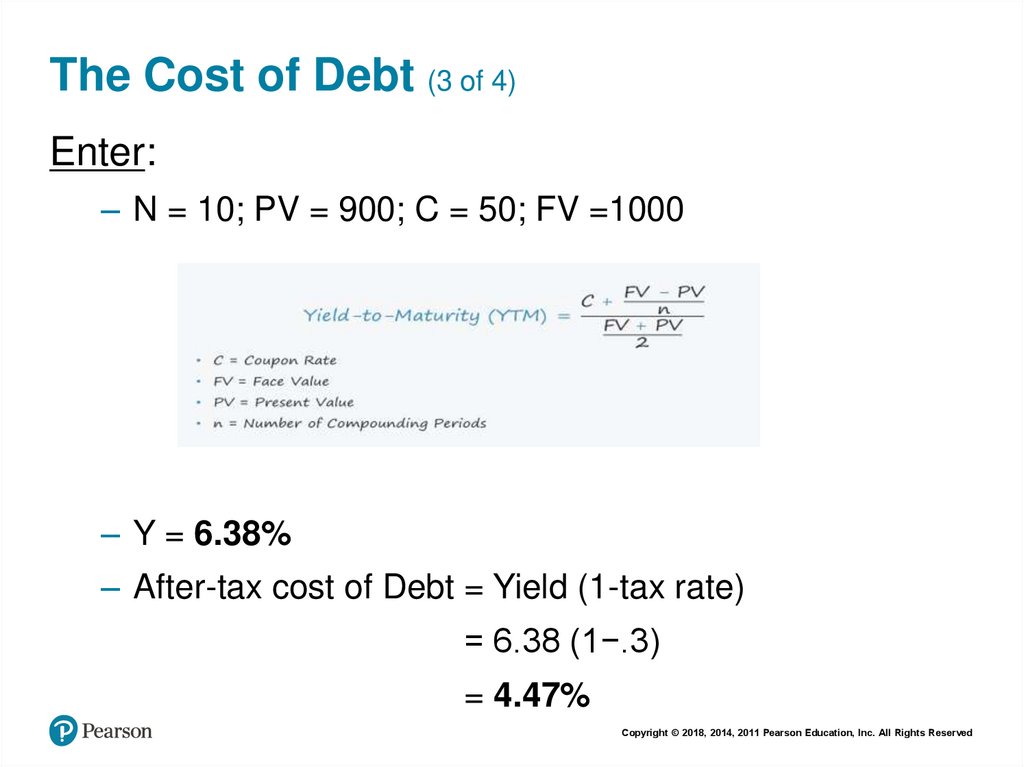
The Cost of Debt (2 of 4)After-tax cost of debt = Yield (1-tax rate)
Example What will be the yield to maturity on a debt
that has par value of $1,000, a coupon interest rate
of 5%, time to maturity of 10 years and is currently
trading at $900? What will be the cost of debt if the
tax rate is 30%?
Copyright © 2018, 2014, 2011 Pearson Education, Inc. All Rights Reserved
19.
The Cost of Debt (3 of 4)Enter:
– N = 10; PV = 900; C = 50; FV =1000
– Y = 6.38%
– After-tax cost of Debt = Yield (1-tax rate)
= 6.38 (1−.3)
= 4.47%
Copyright © 2018, 2014, 2011 Pearson Education, Inc. All Rights Reserved
20.
The Cost of Debt (4 of 4)It is not easy to find the market price of a specific
bond.
It is a standard practice to estimate the cost of debt
using yield to maturity on a portfolio of bonds with
similar credit rating and maturity as the firm’s
outstanding debt.
Copyright © 2018, 2014, 2011 Pearson Education, Inc. All Rights Reserved
21.
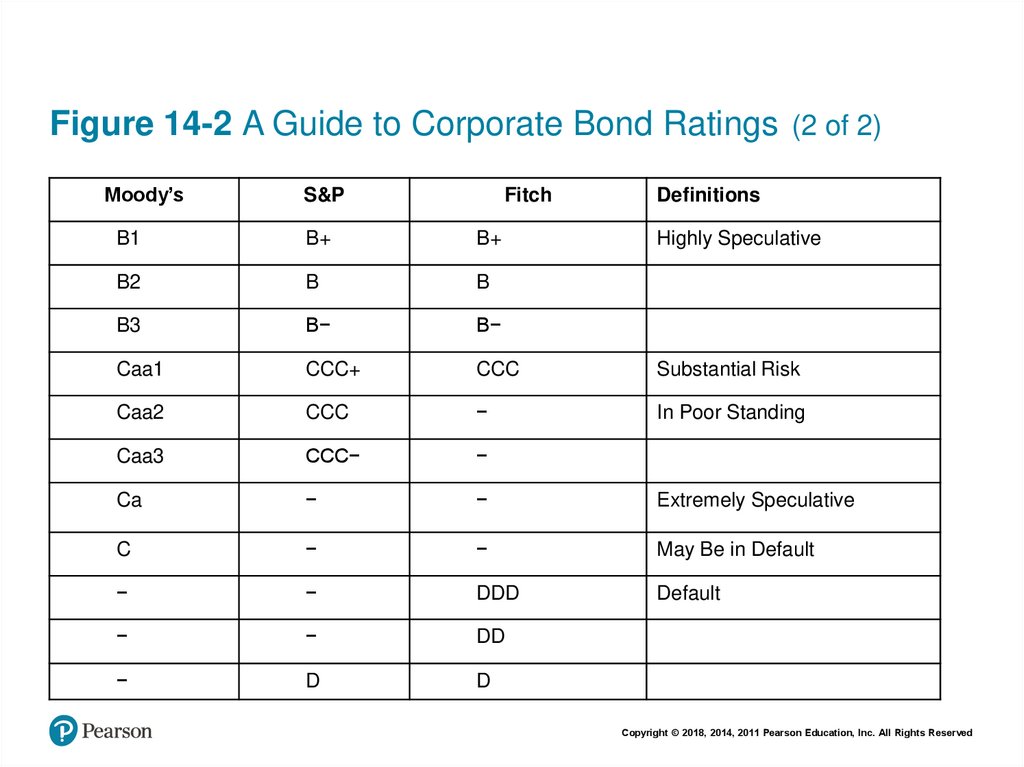
Figure 14-2 A Guide to Corporate Bond Ratings (2 of 2)Moody’s
S&P
B1
B+
B+
Highly Speculative
B2
B
B
Blank
B3
B−
B−
Blank
Caa1
CCC+
CCC
Substantial Risk
Caa2
CCC
−
In Poor Standing
Caa3
CCC−
−
Blank
Ca
−
−
Extremely Speculative
C
−
−
May Be in Default
−
−
DDD
Default
−
−
DD
Blank
−
D
D
Blank
Fitch
Definitions
Copyright © 2018, 2014, 2011 Pearson Education, Inc. All Rights Reserved
22.
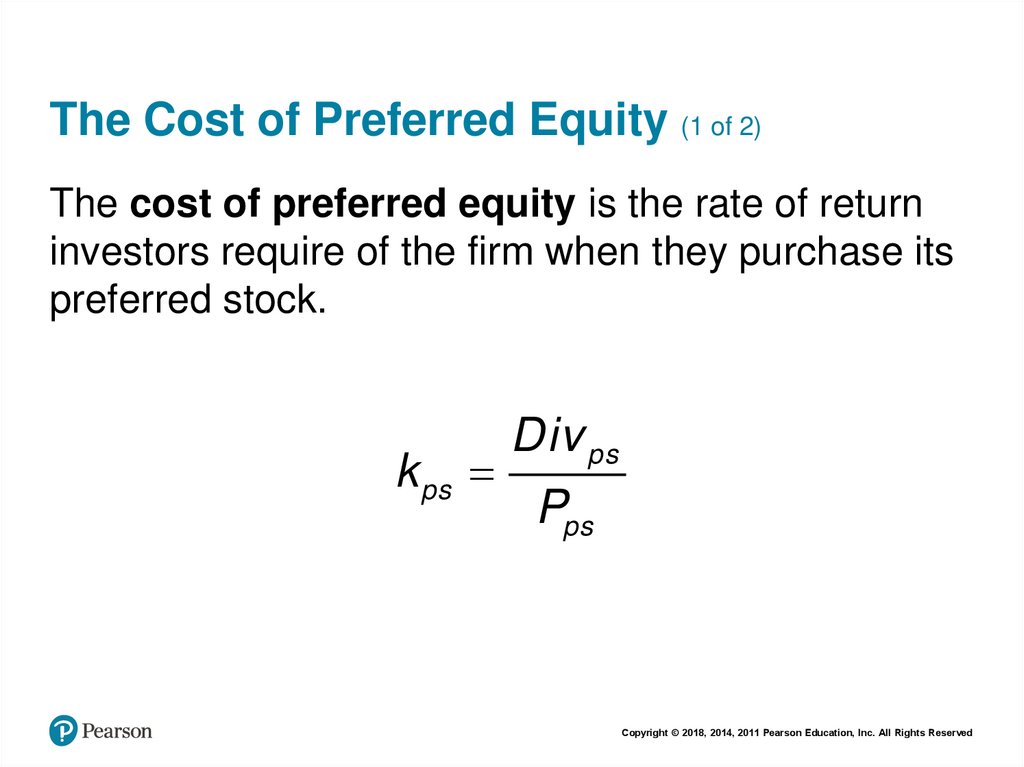
The Cost of Preferred Equity (1 of 2)The cost of preferred equity is the rate of return
investors require of the firm when they purchase its
preferred stock.
k ps
Div ps
Pps
Copyright © 2018, 2014, 2011 Pearson Education, Inc. All Rights Reserved
23.
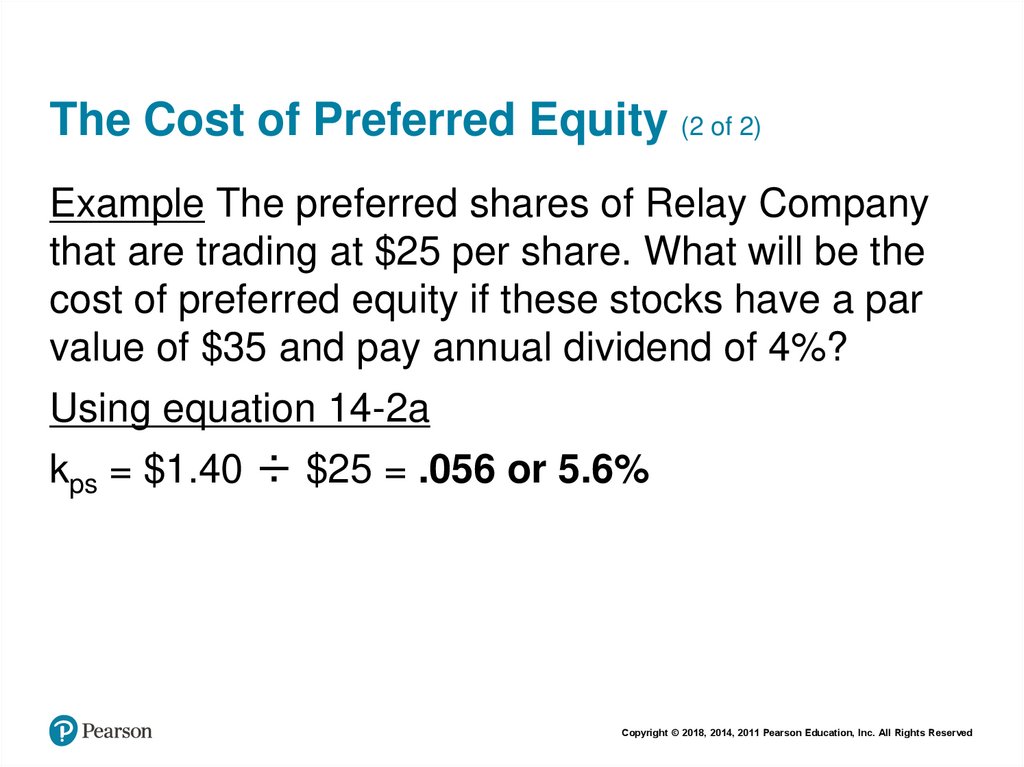
The Cost of Preferred Equity (2 of 2)Example The preferred shares of Relay Company
that are trading at $25 per share. What will be the
cost of preferred equity if these stocks have a par
value of $35 and pay annual dividend of 4%?
Using equation 14-2a
kps = $1.40 ÷ $25 = .056 or 5.6%
Copyright © 2018, 2014, 2011 Pearson Education, Inc. All Rights Reserved
24.
The Cost of Common EquityThe cost of common equity is the rate of return
investors expect to receive from investing in firm’s
stock.
This return comes in the form of cash distributions
(dividends and cash proceeds from the sale of the
stock).
There are two commonly used approaches for
calculating the cost of equity:
1. The dividend growth model
2. CAPM
Copyright © 2018, 2014, 2011 Pearson Education, Inc. All Rights Reserved
25.
The Dividend Growth Model: DiscountedCash Flow Approach (1 of 2)
1. First, estimate the expected stream of dividends
that the common stock is expected to provide t
the stockholder.
2. Second, using these estimated dividends as the
estimated cash flows from the stock, and the
firm’s current stock price, calculate the internal
rate of return on the stock investment.
Copyright © 2018, 2014, 2011 Pearson Education, Inc. All Rights Reserved
26.
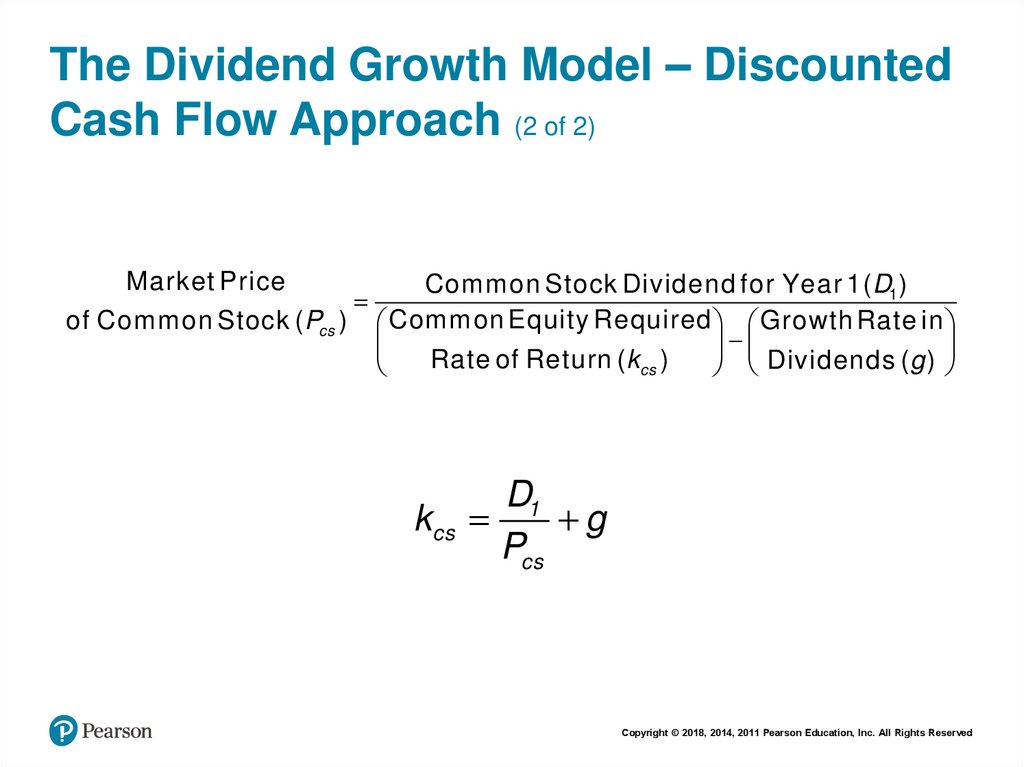
The Dividend Growth Model – DiscountedCash Flow Approach (2 of 2)
Market Price
Common Stock Dividend for Year 1(D1 )
of Common Stock (Pcs ) Common Equity Required Growth Rate in
Rate
of
Return
(
k
)
Dividends
(
g
)
cs
D1
kcs
g
Pcs
Copyright © 2018, 2014, 2011 Pearson Education, Inc. All Rights Reserved
27.
Estimating the Rate of Growth, gThe growth rate can be obtained from:
– websites that post analysts forecasts, and
– using historical data to compute the arithmetic average
or geometric average.
Copyright © 2018, 2014, 2011 Pearson Education, Inc. All Rights Reserved
28.
Arithmetic and Geometric AverageYear
Dividend
$ Change
% Change
2012
$0.800
Blank
Blank
2013
0.825
$0.025
3.1%
2014
0.840
0.015
1.8%
2015
0.875
0.035
4.2%
2016
0.900
0.025
2.9%
Blank
Arithmetic Average
Blank
3.0%
Blank
Geometric Average
Blank
2.99%
Copyright © 2018, 2014, 2011 Pearson Education, Inc. All Rights Reserved
29.
Pros and Cons of the Dividend GrowthRate Model Approach
• Pros – Simplicity
• Cons – severely dependent upon the quality of
growth rate estimates; constant dividend growth
rate for ever is an oversimplification
Copyright © 2018, 2014, 2011 Pearson Education, Inc. All Rights Reserved
30.
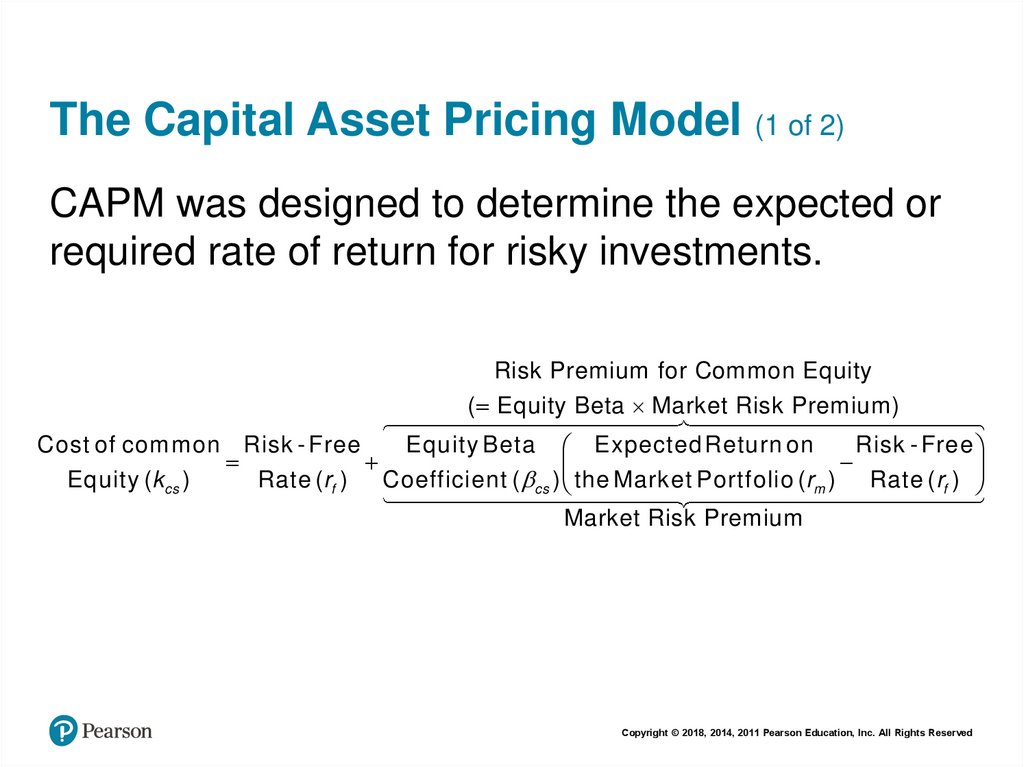
The Capital Asset Pricing Model (1 of 2)CAPM was designed to determine the expected or
required rate of return for risky investments.
Risk Premium for Common Equity
( Equity Beta Market Risk Premium)
Cost of common Risk - Free
Equity Beta Expected Return on
Risk - Free
Equity (kcs )
Rate (rf ) Coefficient ( cs ) the Market Portfolio ( rm ) Rate ( rf )
Market Risk Premium
Copyright © 2018, 2014, 2011 Pearson Education, Inc. All Rights Reserved
31.
The Capital Asset Pricing Model (2 of 2)Equation illustrates that the expected return on
common stock is determined by three key
ingredients:
– The risk-free rate of interest,
– The beta or systematic risk of the common stock
returns, and
– The market risk premium.
Copyright © 2018, 2014, 2011 Pearson Education, Inc. All Rights Reserved
32.
Advantages and Disadvantages of theCAPM approach
Advantages – simplicity, wider applications
Disadvantages – Choice of risk-free is not clearly
defined, estimates of beta and market risk premium
will vary depending on the data used.
Copyright © 2018, 2014, 2011 Pearson Education, Inc. All Rights Reserved
33.
CHECKPOINT 14.3: CHECK YOURSELFEstimating the Cost of Common Equity
Using the CAPM
Prepare two additional estimates of Pearson’s cost of common equity using the CAPM
where you use the most extreme values of each of the three factors that drive the
CAPM.
Copyright © 2018, 2014, 2011 Pearson Education, Inc. All Rights Reserved
34.
Step 1: Picture the Problem (1 of 4)CAPM describes the relationship between the
expected rates of return on risky assets in terms of
their systematic risk. Its value depends on:
– The risk-free rate of interest,
– The beta or systematic risk of the common stock
returns, and
– The market risk premium.
Copyright © 2018, 2014, 2011 Pearson Education, Inc. All Rights Reserved
35.
Step 1: Picture the Problem (2 of 4)However, there can be wide variation in the
estimates for each one of these variables. Here we
are given the following estimates:
– The risk-free rate of interest (.01% or 2.80%)
– The beta or systematic risk of the common stock
returns (.8 or 1.2)
– The market risk premium (4% or 8%)
Copyright © 2018, 2014, 2011 Pearson Education, Inc. All Rights Reserved
36.
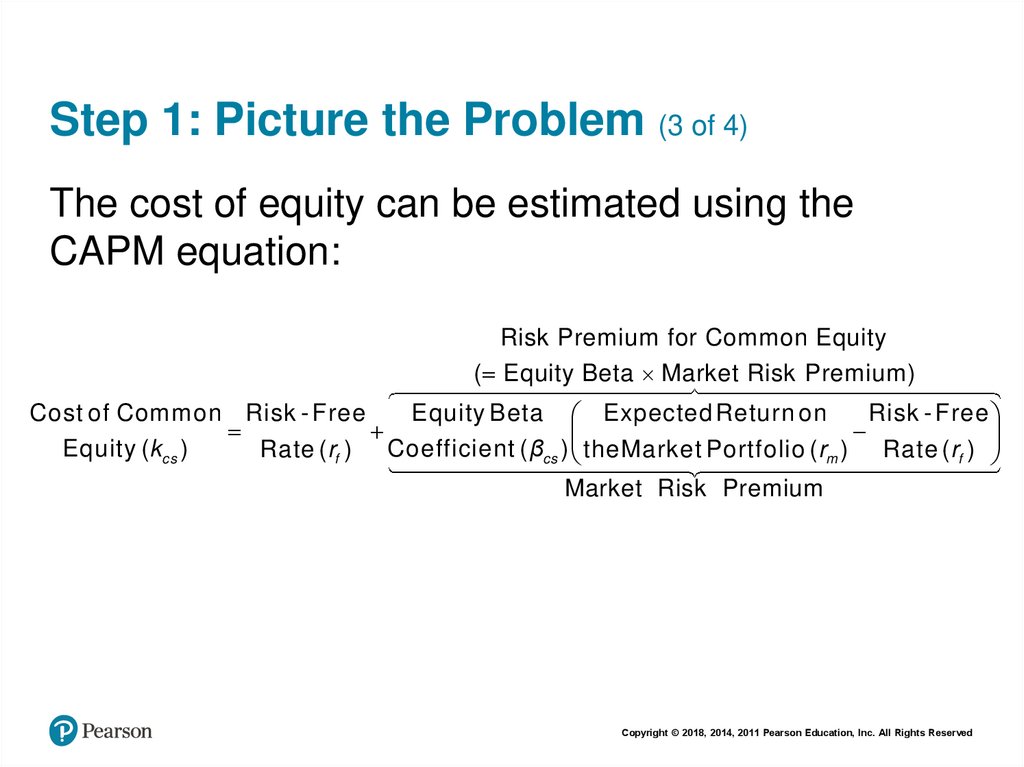
Step 1: Picture the Problem (3 of 4)The cost of equity can be estimated using the
CAPM equation:
Risk Premium for Common Equity
( Equity Beta Market Risk Premium)
Cost of Common Risk - Free
Equity Beta Expected Return on
Risk - Free
Equity (kcs )
Rate (rf ) Coefficient ( βcs ) theMarket Portfolio ( rm ) Rate ( rf )
Market Risk Premium
Copyright © 2018, 2014, 2011 Pearson Education, Inc. All Rights Reserved
37.
14.4 SUMMING UP: CALCULATING THEFIRM’S WACC
Copyright © 2018, 2014, 2011 Pearson Education, Inc. All Rights Reserved
38.
Summing Up: Calculating the Firm’sWACC
When estimating the firm’s WACC, following issues
should be kept in mind:
– Use Market-Based Weights: weights should be based
on market values of firm’s securities rather than their
book values
– Use Market-Based Costs of Capital: the cost of capital
for each source of funds should reflect the current
market prices and expected future returns rather than
historical rates from the past.
– Use Forward-Looking weights and Opportunity Costs.
Copyright © 2018, 2014, 2011 Pearson Education, Inc. All Rights Reserved
39.
Weighted Average Cost of Capital inPractice
• The cost of capital varies across firms because of
differences in their lines of business.
• Cost of capital is determined by business risk, and
differences in individual firms’ capital structures or
financial leverage, which is the source of financial
risk.
Copyright © 2018, 2014, 2011 Pearson Education, Inc. All Rights Reserved
40.
Weighted Average Cost of Capital inPractice
• Figure on the slide shows the estimates of
WACCs for a sample of large U.S. firms. The
WACCs range from 3.31 percent to 7.20 percent.
• In general, the firms with the highest costs of
capital are those with the lowest use of debt
financing.
Copyright © 2018, 2014, 2011 Pearson Education, Inc. All Rights Reserved
41.
Figure 14.4 WACCs for a Sample of Large U.S. Firms (1 of 2)(Panel A) Cost of Capital Estimates
Blank
% Debta
After-Tax
Cost of Debtb
% Equity
Cost of
Equityc
WACC
American Airlines (AAL)
28.20%
2.94%
71.80%
7.50%
6.22%
American Electric Power (AEP)
40.61%
2.60%
59.39%
3.80%
3.31%
Emerson Electric (EMR)
11.64%
2.26%
88.36%
7.85%
7.20%
Exxon-Mobil (XOM)
8.53%
1.79%
91.47%
7.10%
6.65%
Ford (F)
65.21%
2.94%
34.79%
7.90%
4.67%
General Electric (GE)
19.11%
2.15%
80.89%
8.05%
6.92%
Starbucks (SBUX)
0.81%
2.86%
99.19%
6.15%
6.12%
Target (TGT)
19.23%
2.26%
80.77%
5.20%
4.63%
Wal-Mart (WMT)
16.77%
2.09%
83.23%
3.90%
3.60%
Copyright © 2018, 2014, 2011 Pearson Education, Inc. All Rights Reserved
42.
14.6 FLOATATION COSTS AND PROJECT NPVCopyright © 2018, 2014, 2011 Pearson Education, Inc. All Rights Reserved
43.
Floatation CostsFloatation costs are fees paid to an investment
banker and costs incurred when securities are sold
at a discount to the current market price.
Copyright © 2018, 2014, 2011 Pearson Education, Inc. All Rights Reserved
44.
WACC, Floatation Costs and Project NPV(1 of 3)
Because of floatation costs, the firm will have to
raise more than the amount it needs.
Financing
Flotation-Cost-Adjusted
Needed
Flotation Cost
Initial Outlay
1
as
a
Percent
of
Funds
Raised
Copyright © 2018, 2014, 2011 Pearson Education, Inc. All Rights Reserved
45.
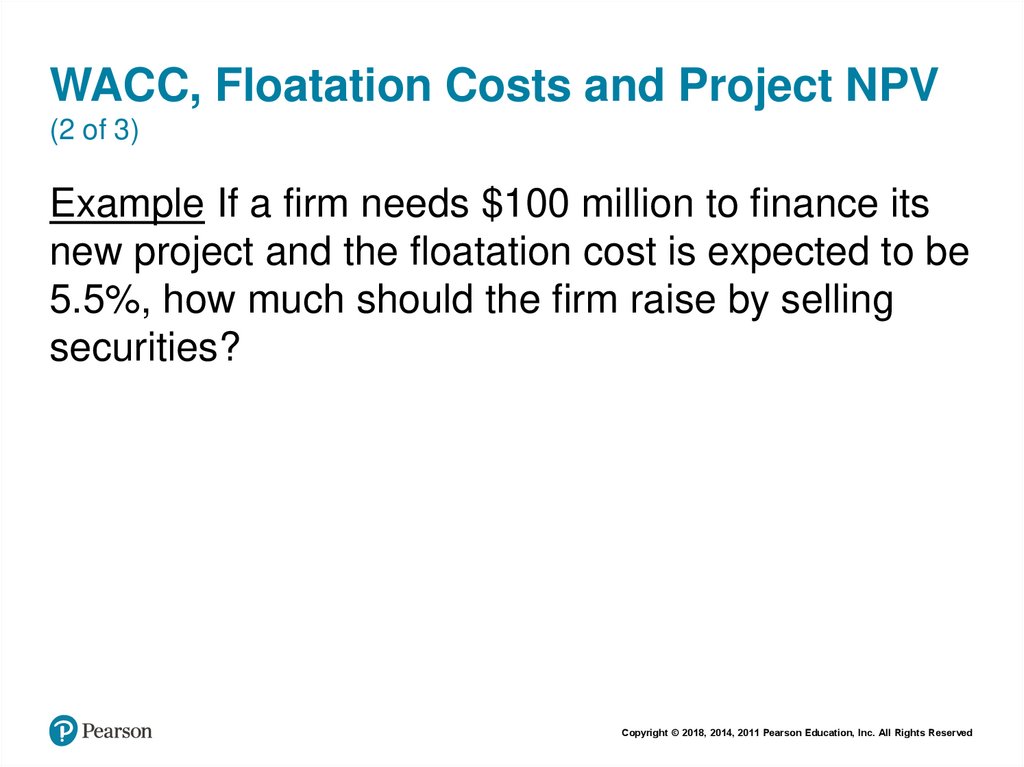
WACC, Floatation Costs and Project NPV(2 of 3)
Example If a firm needs $100 million to finance its
new project and the floatation cost is expected to be
5.5%, how much should the firm raise by selling
securities?
Copyright © 2018, 2014, 2011 Pearson Education, Inc. All Rights Reserved
46.
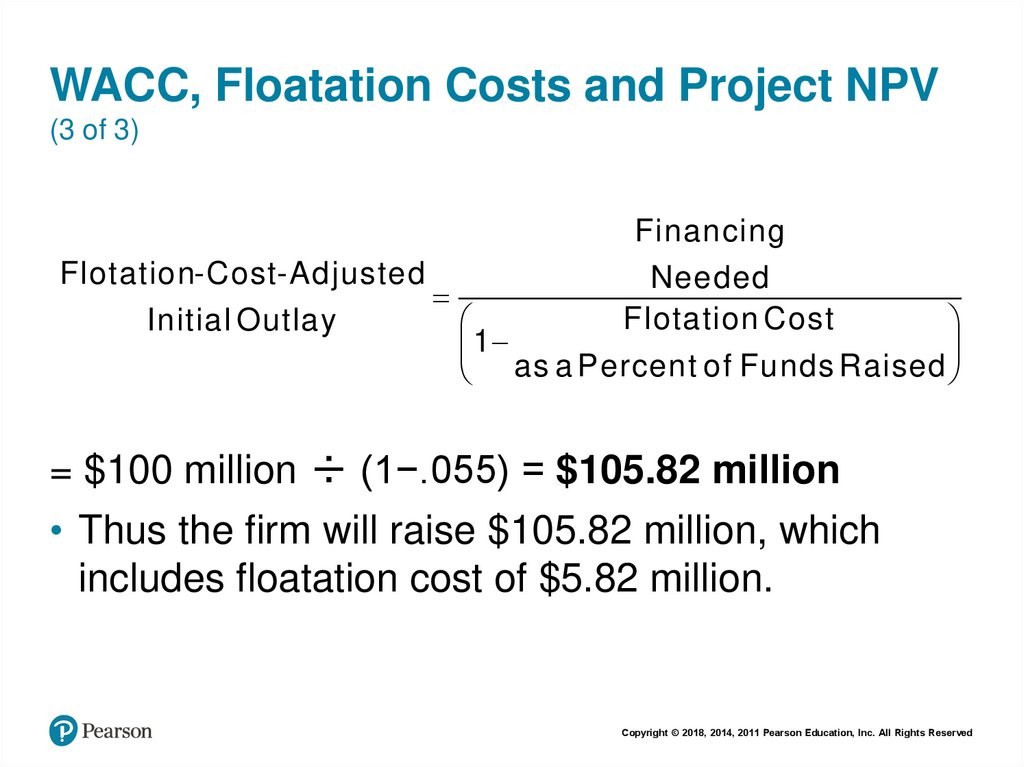
WACC, Floatation Costs and Project NPV(3 of 3)
Financing
Flotation-Cost-Adjusted
Needed
Flotation Cost
Initial Outlay
1
as
a
Percent
of
Funds
Raised
= $100 million ÷ (1−.055) = $105.82 million
• Thus the firm will raise $105.82 million, which
includes floatation cost of $5.82 million.
Copyright © 2018, 2014, 2011 Pearson Education, Inc. All Rights Reserved
47.
Key Terms• Cost of capital
• Cost of common equity
• Cost of debt
• Cost of preferred equity
• Floatation costs
• Risk Premium
• Weighted Average Cost of Capital (WACC)
Copyright © 2018, 2014, 2011 Pearson Education, Inc. All Rights Reserved
48.
CopyrightCopyright © 2018, 2014, 2011 Pearson Education, Inc. All Rights Reserved