 Финансы
Похожие презентации:
")
")
")

 Analysis")


")

Revision session
1.
Revision session(for ref./def. final exam takers/retakers)
2.
Relevant costs3.
Relevant costs can be defined as any cost relevant to adecision. A matter is relevant if there is a change in
cash flow that is caused by the decision.
• Relevant costs
– costs appropriate to specific management decisions
– these are represented by future cash flows whose
magnitude will vary depending upon the outcome of the
management decision made.
(Chartered Institute of Management Accountants)
4.
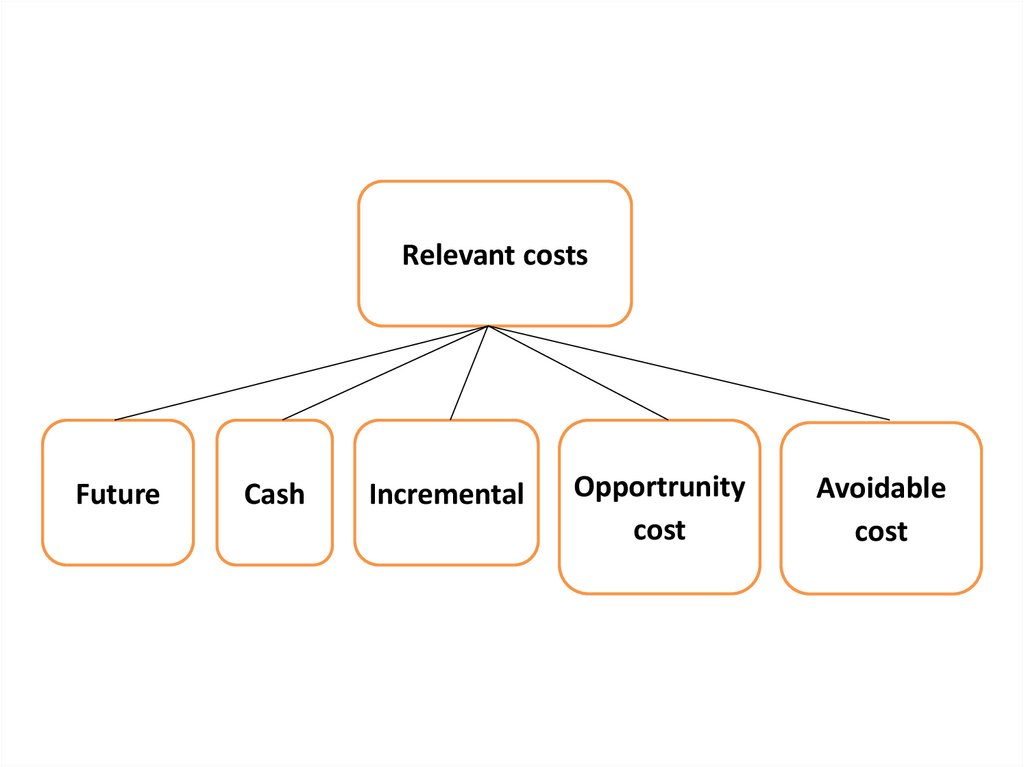
Relevant costsFuture
Cash
Incremental
Opportrunity
cost
Avoidable
cost
5.
Relevant costs are FUTURE costs.• They must occur in the future.
• A decision is about the future and it cannot
alter what has been done already.
• Costs that have been incurred in the past are
totally irrelevant to any decision that is being
made 'now'.
• Such costs are called past costs or sunk costs
and are irrelevant.
6.
Relevant costs are CASH FLOWS• This means that costs or charges which do not
reflect additional cash spending (such as
depreciation and notional costs), should be
ignored for the purpose of decision-making.
7.
Relevant costs are INCREMENTAL costs• It is the increase in costs and revenues that occurs as a
direct result of a decision taken that is relevant.
• Common costs can be ignored for the purpose of
decision making.
• For example, suppose a company decides to accept a
contract from a customer. An existing supervisor
currently earning $1,000 per month is given an extra
$100 per month for taking on the extra responsibility
associated with this contract. The incremental cost is
the additional salary paid to the supervisor ($100) –
the original salary of $1,000 was being paid anyway.
8.
Relevant costs are AVOIDABLE costs• These are costs which would not be incurred if the
activity to which they relate did not exist.
or
• These are the specific costs of an activity that would be
avoided if that activity did not exist.
• Therefore, they are relevant to a decision.
• Avoidable costs are usually associated with shutdown
decisions.
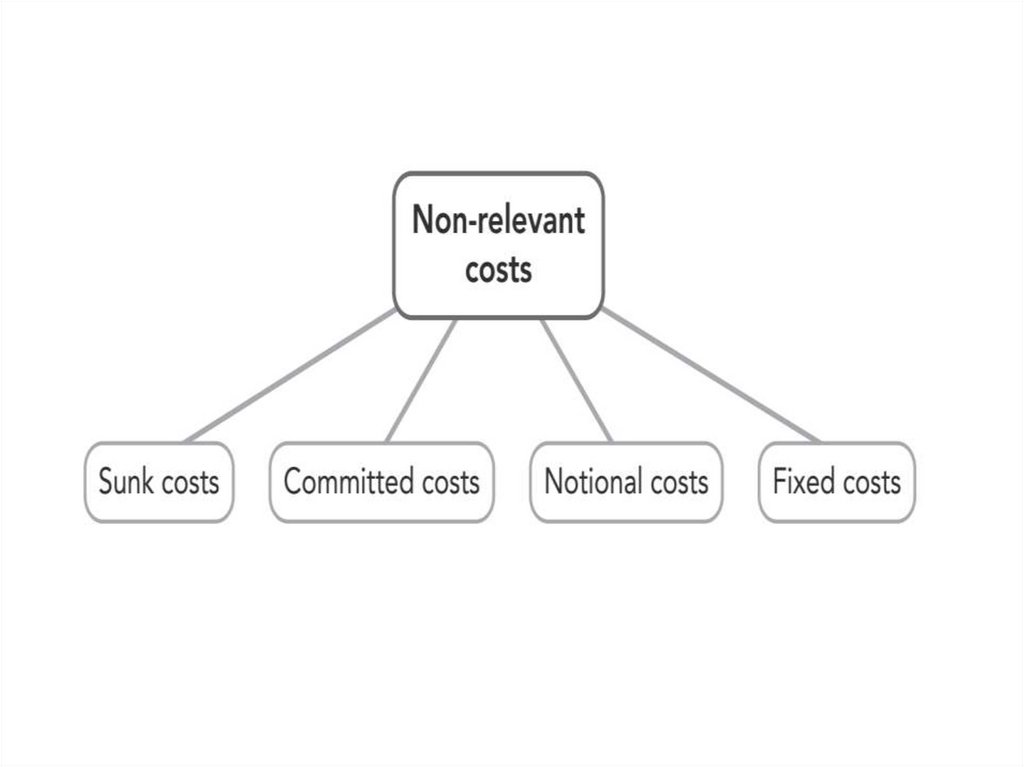
• Committed costs are future costs that cannot be
avoided because of decisions that have already been
made. These are non-relevant costs
9.
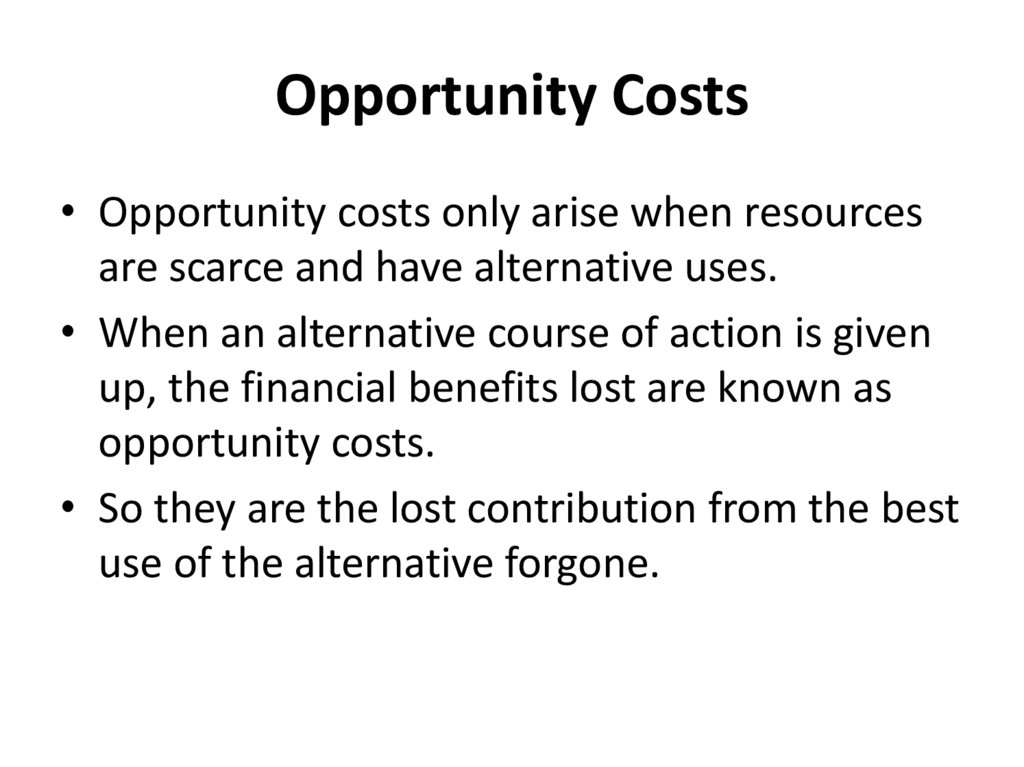
Opportunity Costs• Opportunity costs only arise when resources
are scarce and have alternative uses.
• When an alternative course of action is given
up, the financial benefits lost are known as
opportunity costs.
• So they are the lost contribution from the best
use of the alternative forgone.
10.
11.
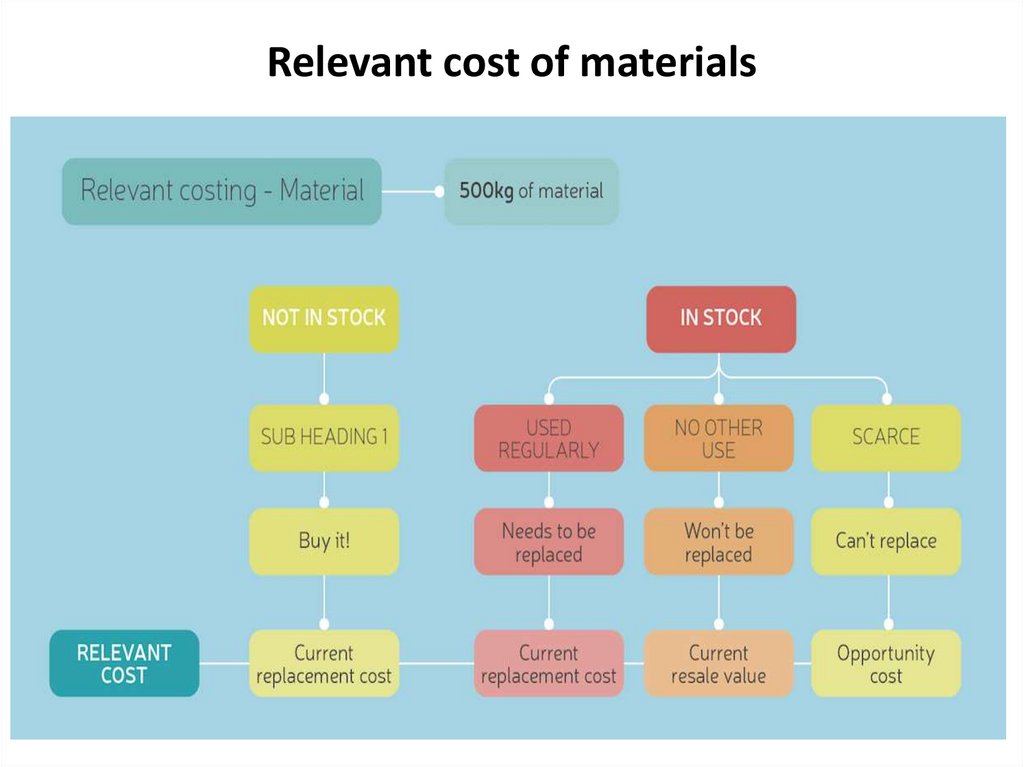
Relevant cost of materials12.
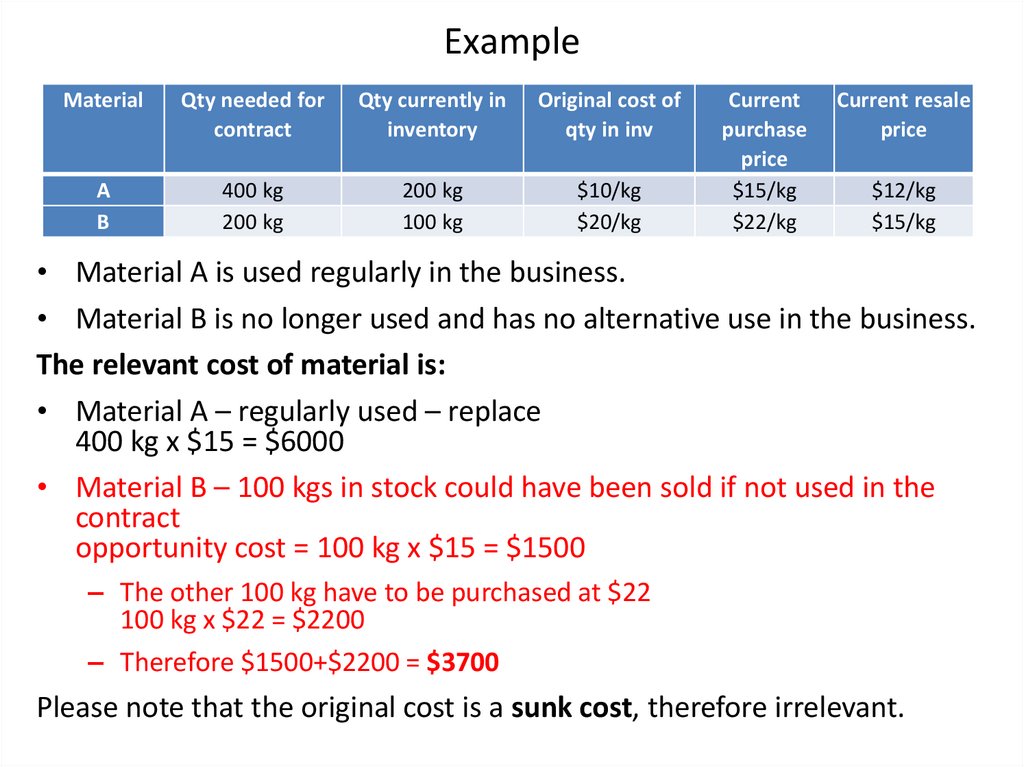
ExampleMaterial
Qty needed for
contract
Qty currently in
inventory
Original cost of
qty in inv
A
B
400 kg
200 kg
200 kg
100 kg
$10/kg
$20/kg
Current
purchase
price
$15/kg
$22/kg
Current resale
price
$12/kg
$15/kg
• Material A is used regularly in the business.
• Material B is no longer used and has no alternative use in the business.
The relevant cost of material is:
• Material A – regularly used – replace
400 kg x $15 = $6000
• Material B – 100 kgs in stock could have been sold if not used in the
contract
opportunity cost = 100 kg x $15 = $1500
– The other 100 kg have to be purchased at $22
100 kg x $22 = $2200
– Therefore $1500+$2200 = $3700
Please note that the original cost is a sunk cost, therefore irrelevant.
13.
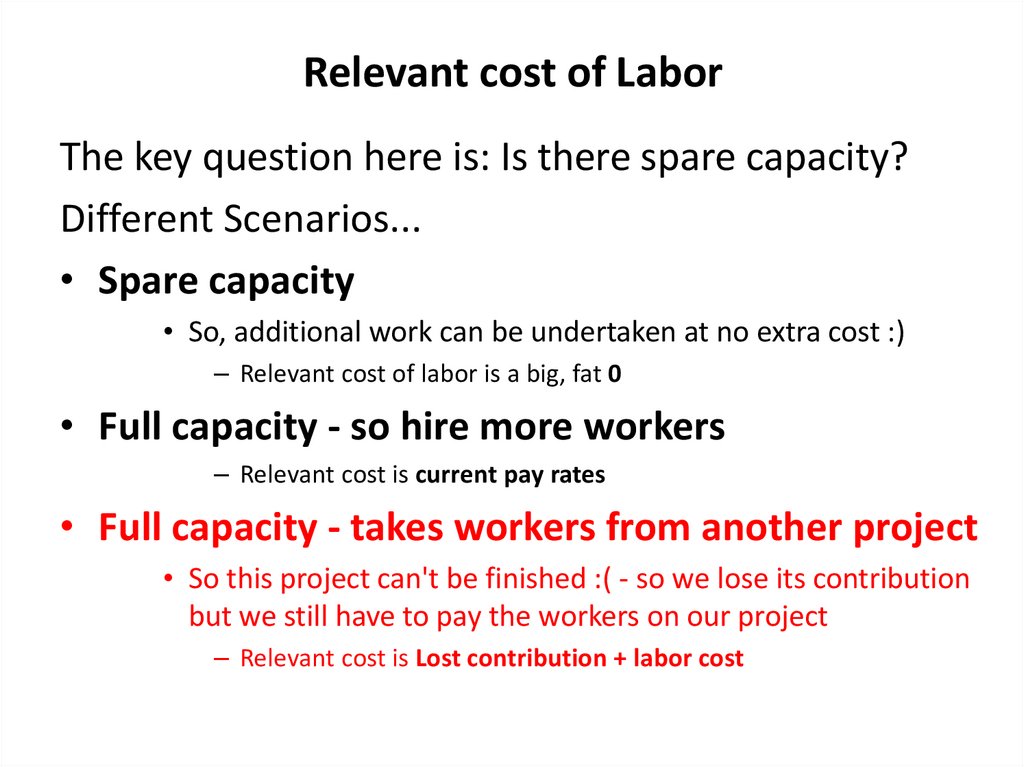
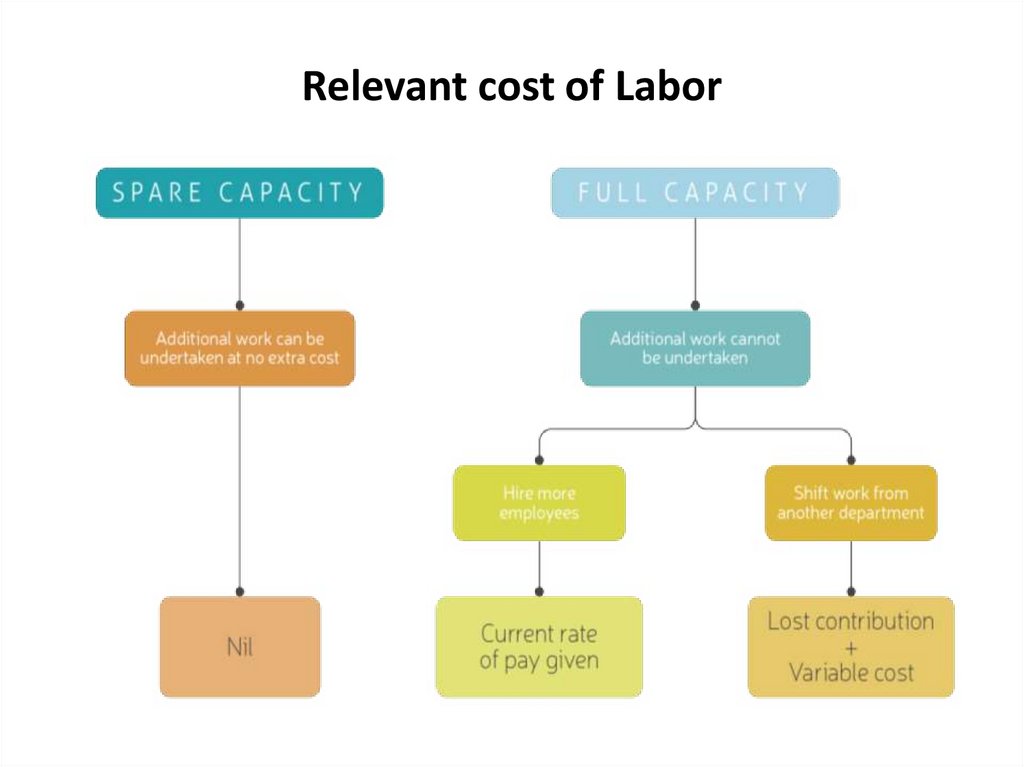
Relevant cost of LaborThe key question here is: Is there spare capacity?
Different Scenarios...
• Spare capacity
• So, additional work can be undertaken at no extra cost :)
– Relevant cost of labor is a big, fat 0
• Full capacity - so hire more workers
– Relevant cost is current pay rates
• Full capacity - takes workers from another project
• So this project can't be finished :( - so we lose its contribution
but we still have to pay the workers on our project
– Relevant cost is Lost contribution + labor cost
14.
Relevant cost of Labor15.
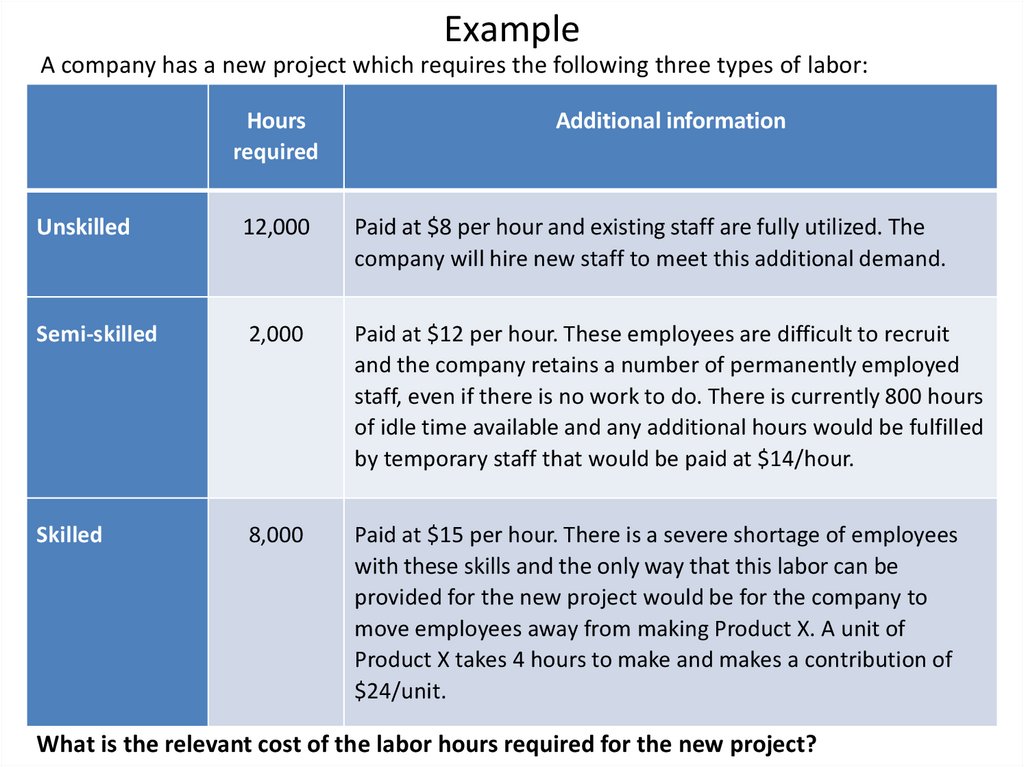
ExampleA company has a new project which requires the following three types of labor:
Hours
required
Additional information
Unskilled
12,000
Paid at $8 per hour and existing staff are fully utilized. The
company will hire new staff to meet this additional demand.
Semi-skilled
2,000
Paid at $12 per hour. These employees are difficult to recruit
and the company retains a number of permanently employed
staff, even if there is no work to do. There is currently 800 hours
of idle time available and any additional hours would be fulfilled
by temporary staff that would be paid at $14/hour.
Skilled
8,000
Paid at $15 per hour. There is a severe shortage of employees
with these skills and the only way that this labor can be
provided for the new project would be for the company to
move employees away from making Product X. A unit of
Product X takes 4 hours to make and makes a contribution of
$24/unit.
What is the relevant cost of the labor hours required for the new project?
16.
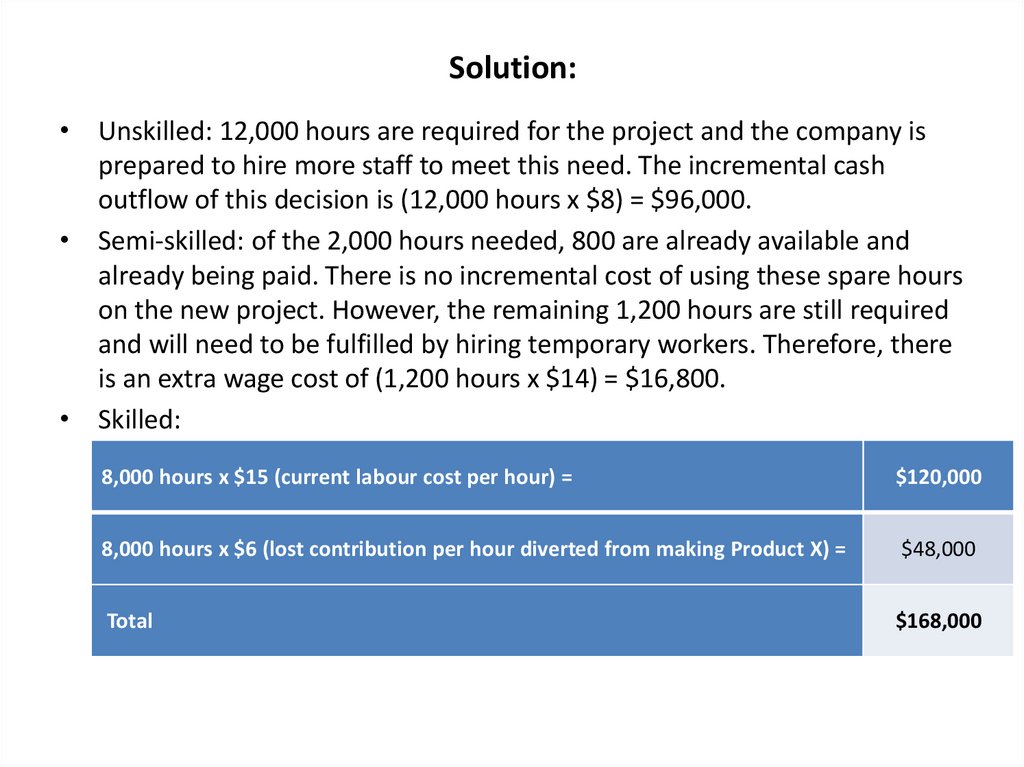
Solution:• Unskilled: 12,000 hours are required for the project and the company is
prepared to hire more staff to meet this need. The incremental cash
outflow of this decision is (12,000 hours x $8) = $96,000.
• Semi-skilled: of the 2,000 hours needed, 800 are already available and
already being paid. There is no incremental cost of using these spare hours
on the new project. However, the remaining 1,200 hours are still required
and will need to be fulfilled by hiring temporary workers. Therefore, there
is an extra wage cost of (1,200 hours x $14) = $16,800.
• Skilled:
8,000 hours x $15 (current labour cost per hour) =
$120,000
8,000 hours x $6 (lost contribution per hour diverted from making Product X) =
$48,000
Total
$168,000
17.
Relevant cost of Machinery• Repair costs arising from use
• Hire charges
• Fall in resale value arising from use
18.
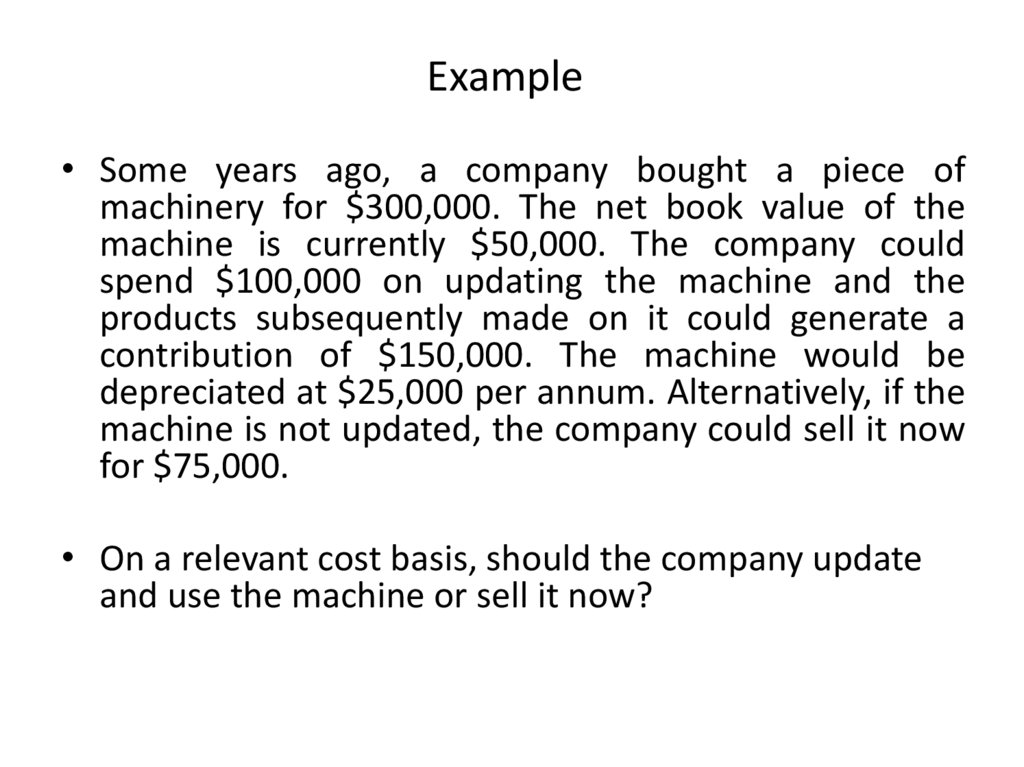
Example• Some years ago, a company bought a piece of
machinery for $300,000. The net book value of the
machine is currently $50,000. The company could
spend $100,000 on updating the machine and the
products subsequently made on it could generate a
contribution of $150,000. The machine would be
depreciated at $25,000 per annum. Alternatively, if the
machine is not updated, the company could sell it now
for $75,000.
• On a relevant cost basis, should the company update
and use the machine or sell it now?
19.
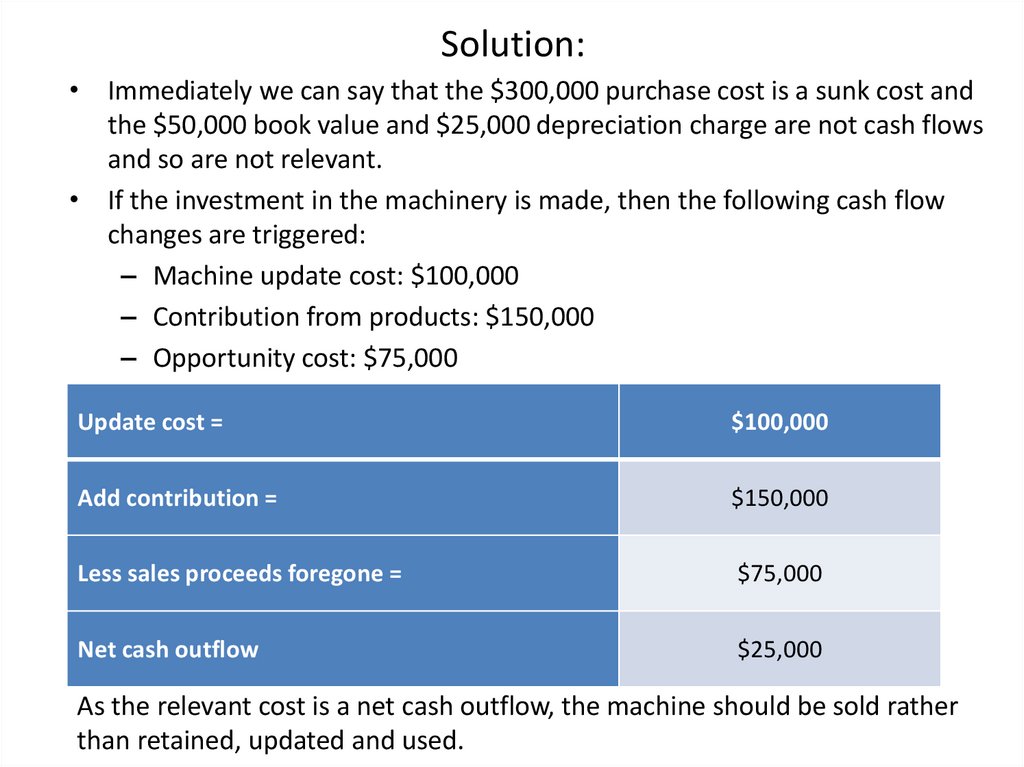
Solution:• Immediately we can say that the $300,000 purchase cost is a sunk cost and
the $50,000 book value and $25,000 depreciation charge are not cash flows
and so are not relevant.
• If the investment in the machinery is made, then the following cash flow
changes are triggered:
– Machine update cost: $100,000
– Contribution from products: $150,000
– Opportunity cost: $75,000
Update cost =
$100,000
Add contribution =
$150,000
Less sales proceeds foregone =
$75,000
Net cash outflow
$25,000
As the relevant cost is a net cash outflow, the machine should be sold rather
than retained, updated and used.
20.
Cost volume profit analysis(CVP analysis)
21.
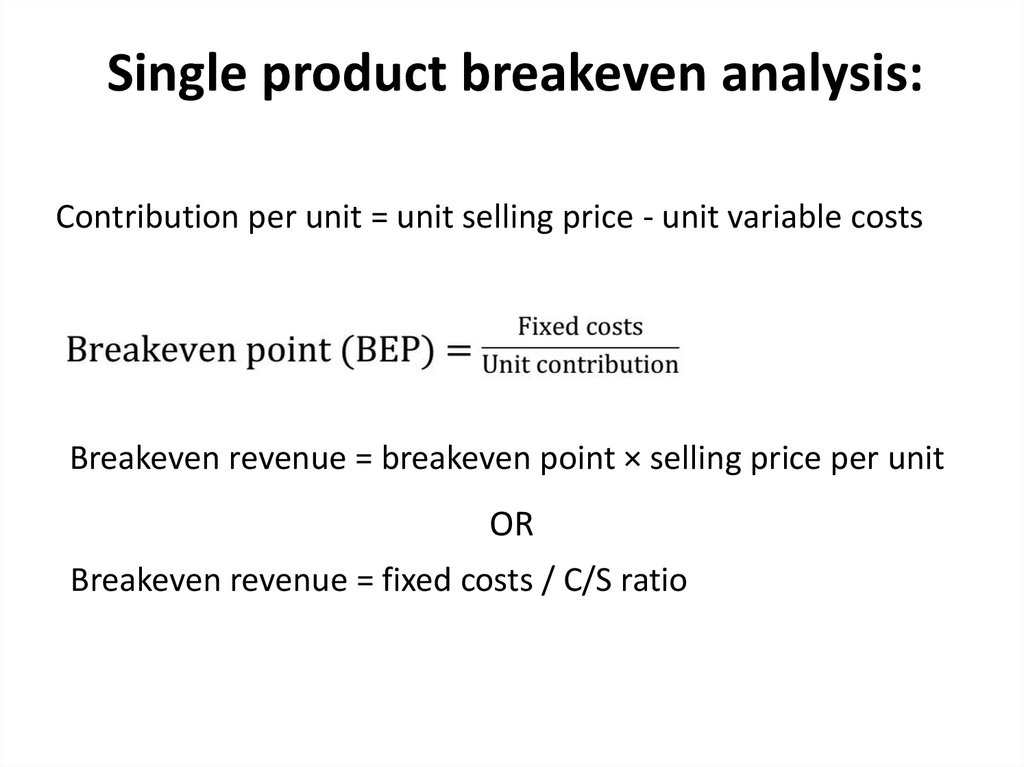
Single product breakeven analysis:Contribution per unit = unit selling price - unit variable costs
Breakeven revenue = breakeven point × selling price per unit
OR
Breakeven revenue = fixed costs / C/S ratio
22.
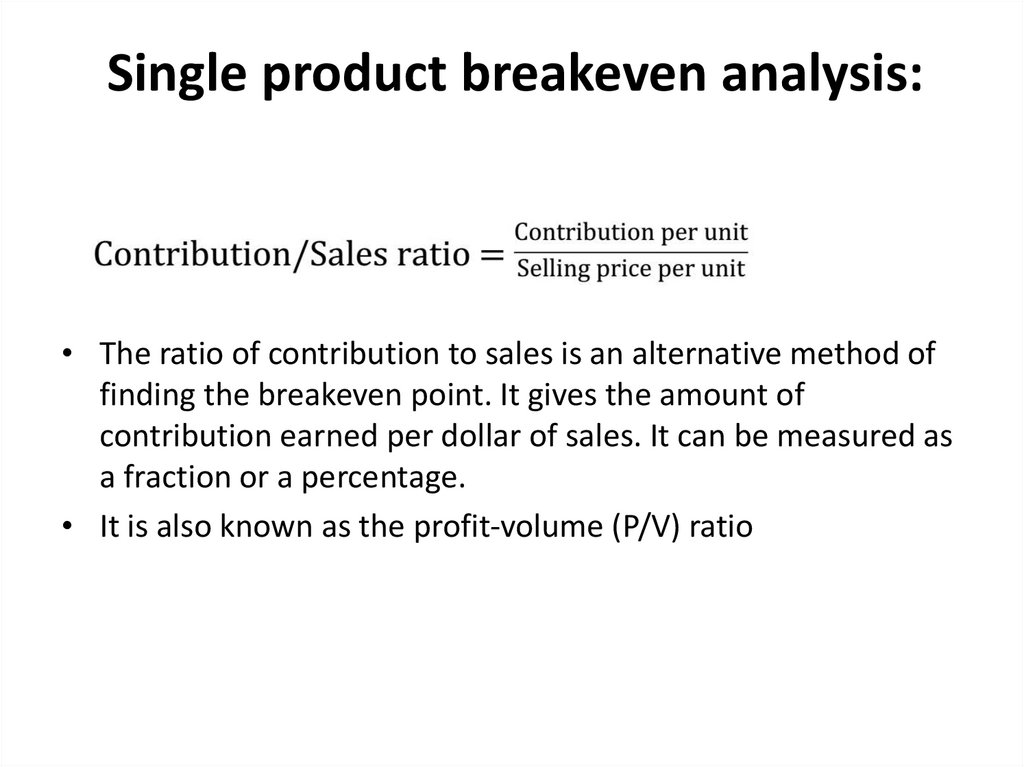
Single product breakeven analysis:• The ratio of contribution to sales is an alternative method of
finding the breakeven point. It gives the amount of
contribution earned per dollar of sales. It can be measured as
a fraction or a percentage.
• It is also known as the profit-volume (P/V) ratio
23.
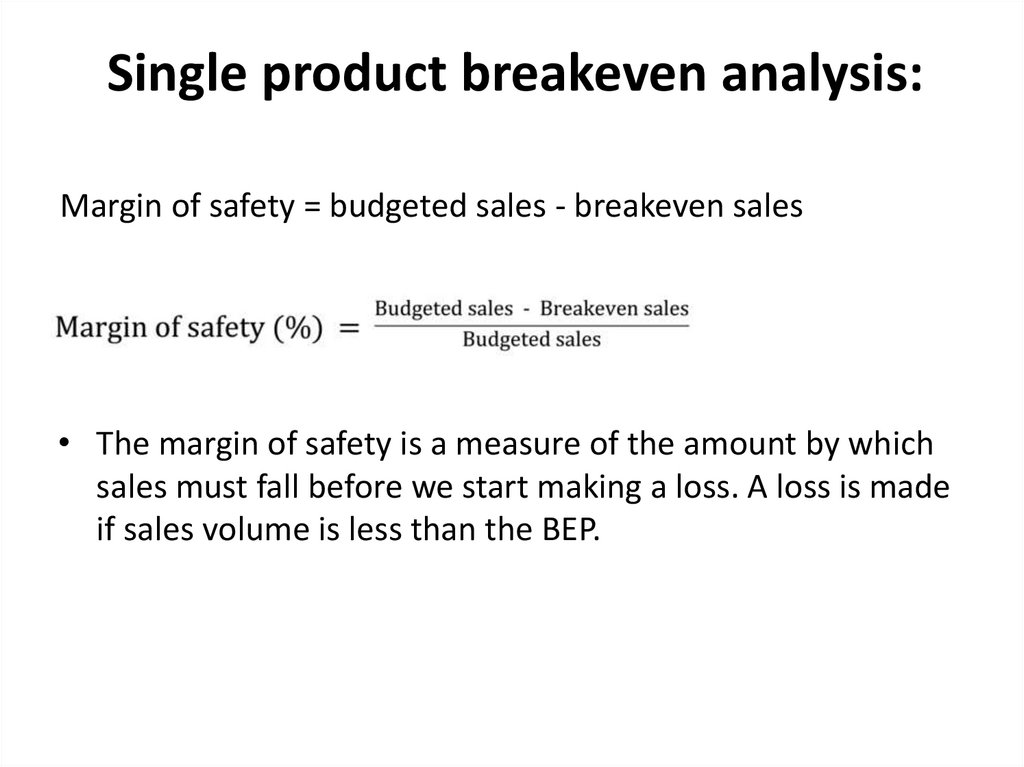
Single product breakeven analysis:Margin of safety = budgeted sales - breakeven sales
• The margin of safety is a measure of the amount by which
sales must fall before we start making a loss. A loss is made
if sales volume is less than the BEP.
24.
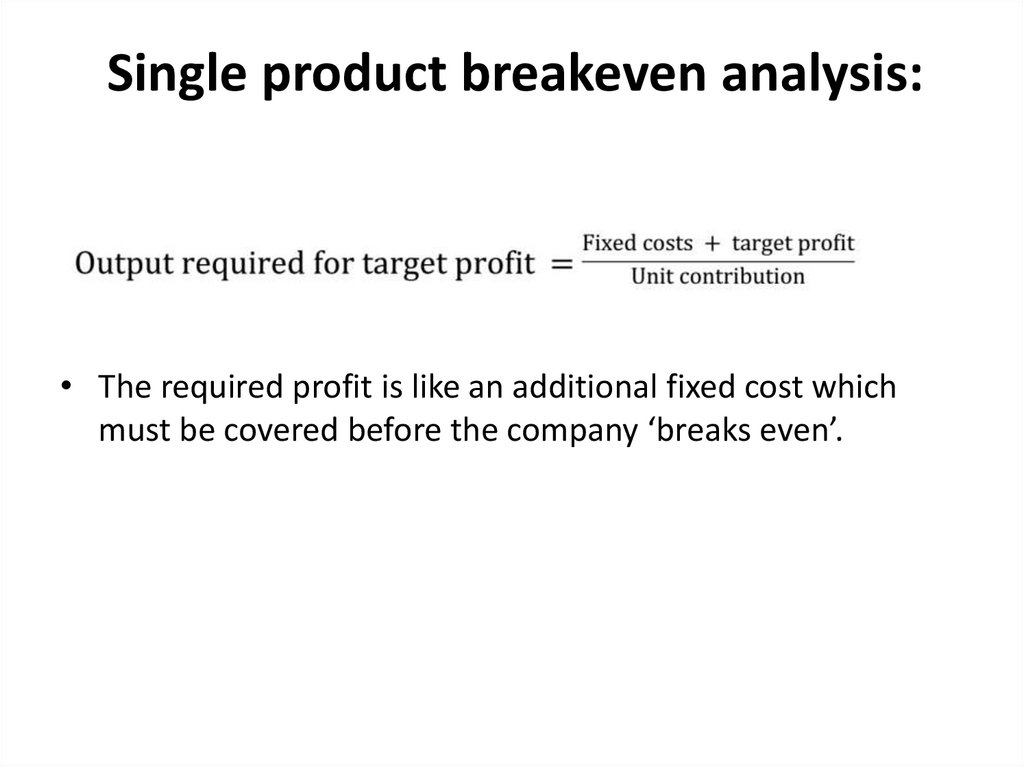
Single product breakeven analysis:• The required profit is like an additional fixed cost which
must be covered before the company ‘breaks even’.
25.
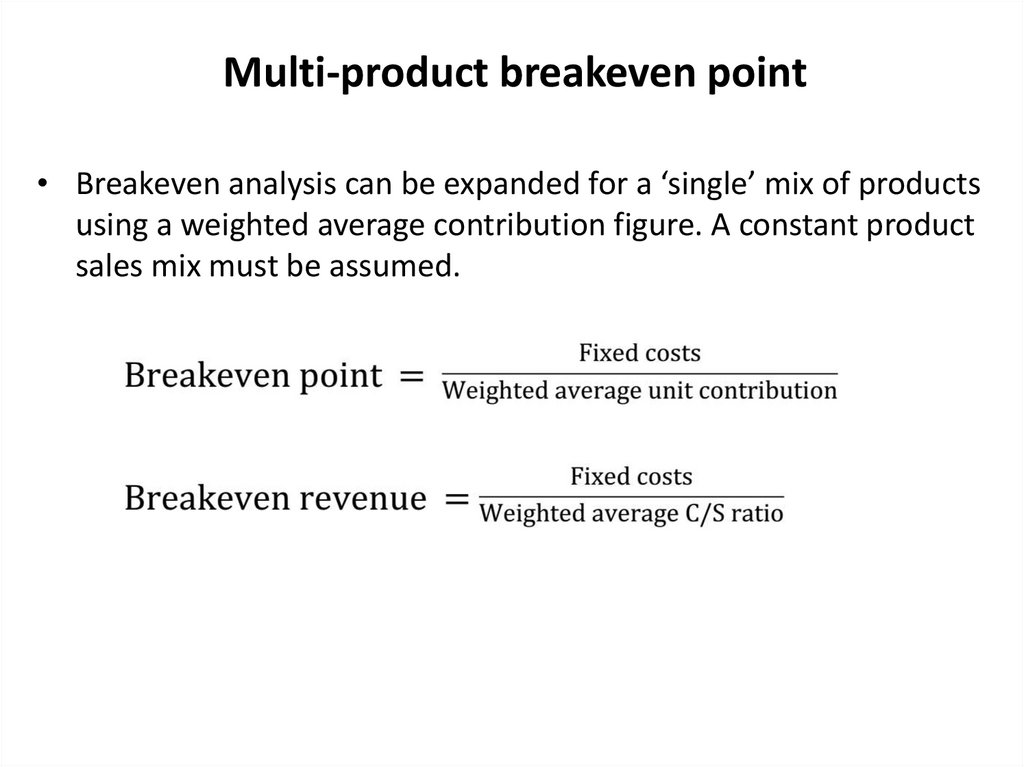
Multi-product breakeven point• Breakeven analysis can be expanded for a ‘single’ mix of products
using a weighted average contribution figure. A constant product
sales mix must be assumed.
26.
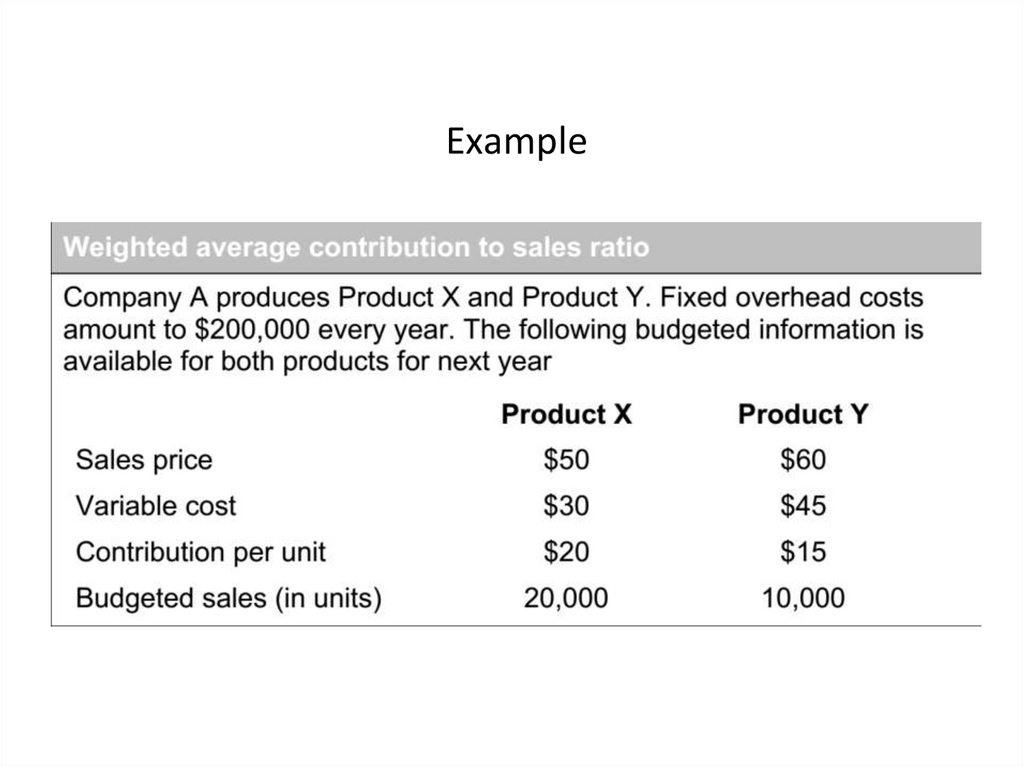
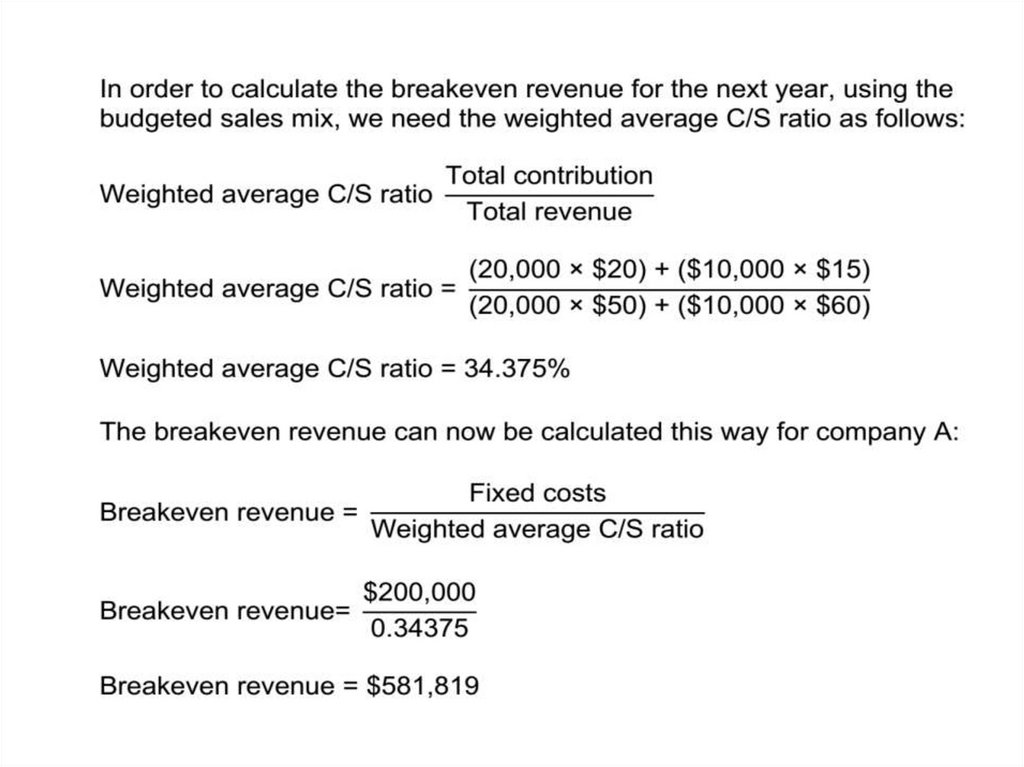
Example27.
28.
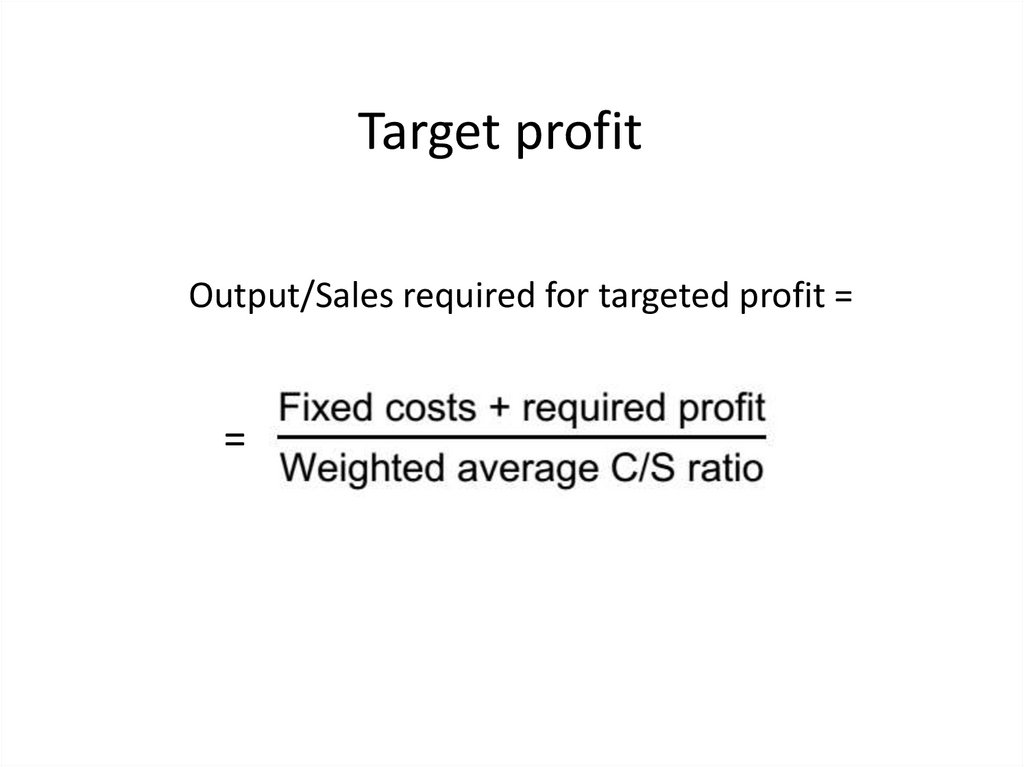
Target profitOutput/Sales required for targeted profit =
=
29.
Limiting factors andLinear programming
30.
Limiting factorsThe production and sales plans of a business may
be limited by a limiting factor/scarce resource.
This could be:
• Market demand
• Materials
• Manpower (labor)
• Machine hours
• Money
31.
Planning with one limiting factor• Options must be ranked using contribution earned per unit
of the scarce resource.
Steps in key factor analysis
If there is one limiting factor, then the problem is best solved
using key factor analysis:
• Step 1: Identify the scarce resource.
Step 2: Calculate the contribution per unit for each product.
• Step 3: Calculate the contribution per unit of the scarce
resource for each product.
• Step 4: Rank the products in order of the contribution per
unit of the scarce resource.
• Step 5: Allocate resources using this ranking and answer
the question.
32.
Linear programming - Planningwith several limiting factors
33.
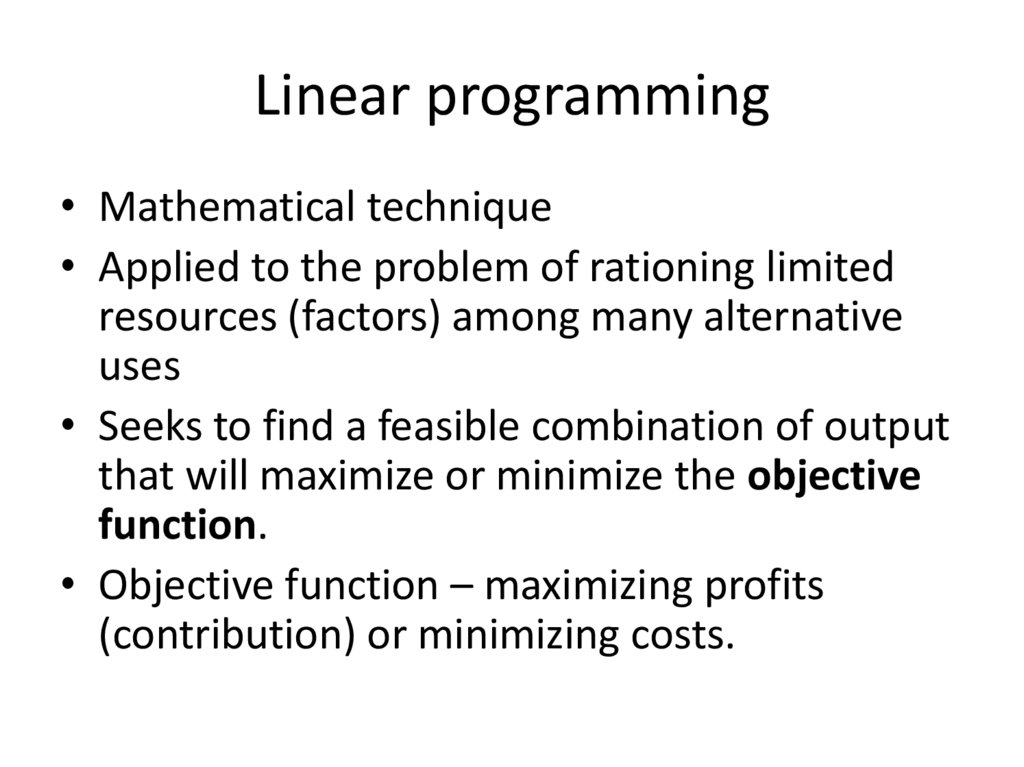
Linear programming• Mathematical technique
• Applied to the problem of rationing limited
resources (factors) among many alternative
uses
• Seeks to find a feasible combination of output
that will maximize or minimize the objective
function.
• Objective function – maximizing profits
(contribution) or minimizing costs.
34.
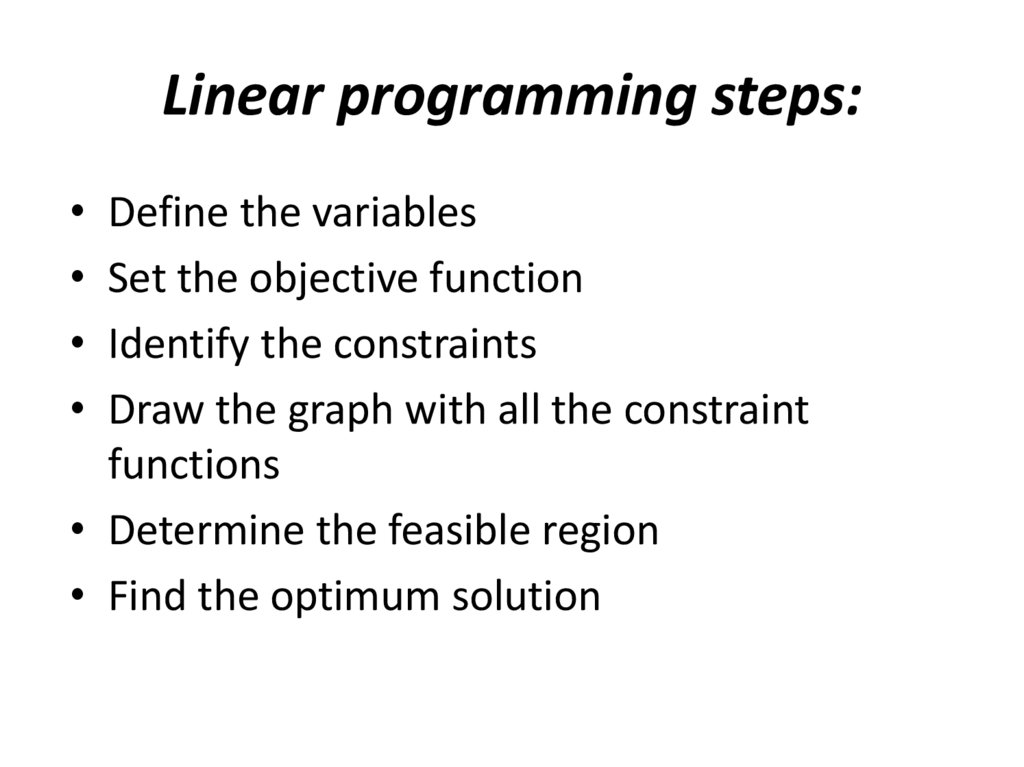
Linear programming steps:• Define the variables
• Set the objective function
• Identify the constraints
• Draw the graph with all the constraint
functions
• Determine the feasible region
• Find the optimum solution
35.
36.
Slack• When discussing constraints, slack is the amount
by which a resource is under-utilized, i.e. slack
occurs when the maximum availability of a
resource is not used. Graphically speaking, it will
occur when the optimum point does not fall on a
given resource line.
• The optimal solution will typically occur where
two ("critical") constraint lines cross. There will
be no slack for these constraints/resources as
they will be fully utilized. Hence, a shadow price
can be calculated.
37.
Slack• For other constraint lines, the fact that the optimal solution is not
on these lines means that the resources are not fully utilized, so
there will be slack.
Slack is important for two reasons:
• For critical constraints (zero slack), then gaining additional units of
these scarce resources will allow the optimal solution to be
improved (e.g. higher contribution earned). Similarly if another
department wants these resources then it will result in lower
contribution.
• For non-critical constraints, gaining or losing a small number of
units of the scarce resource will have no impact on the optimal
solution. To determine how much this makes scarce resources
worth to the business, see below on "shadow prices"
38.
Shadow priceThis is the ‘increase in value which would be created by
having available one additional unit of a limiting resource
at the original cost’. (CIMA Official Terminology)
A shadow price is:
• The additional contribution generated from one
additional unit of limiting factor.
• The opportunity cost of not having the use of one extra
unit of limiting factor.
• The maximum extra amount that should be paid for
one additional unit of scarce resource.
39.
Shadow price• The shadow price of a resource can be found by
calculating the increase in value (usually extra
contribution) which would be created by having
available one additional unit of a limiting resource at
its original cost.
• It therefore represents the maximum premium that the
firm should be willing to pay for one extra unit of each
constraint.
• Non-critical constraints will have zero shadow prices as
slack exists already.
40.
Shadow priceThe simplest way to calculate shadow prices for a critical constraint is
as follows:
• Step 1: Take the equations of the straight lines that intersect at the
optimal point. Add one unit to the constraint concerned, while
leaving the other critical constraint unchanged.
• Step 2: Use simultaneous equations to derive a new optimal
solution.
• Step 3: Calculate the revised optimal contribution and compare to
the original contribution calculated. The increase is the shadow
price.
41.
Divisional PerformanceMeasurement
42.
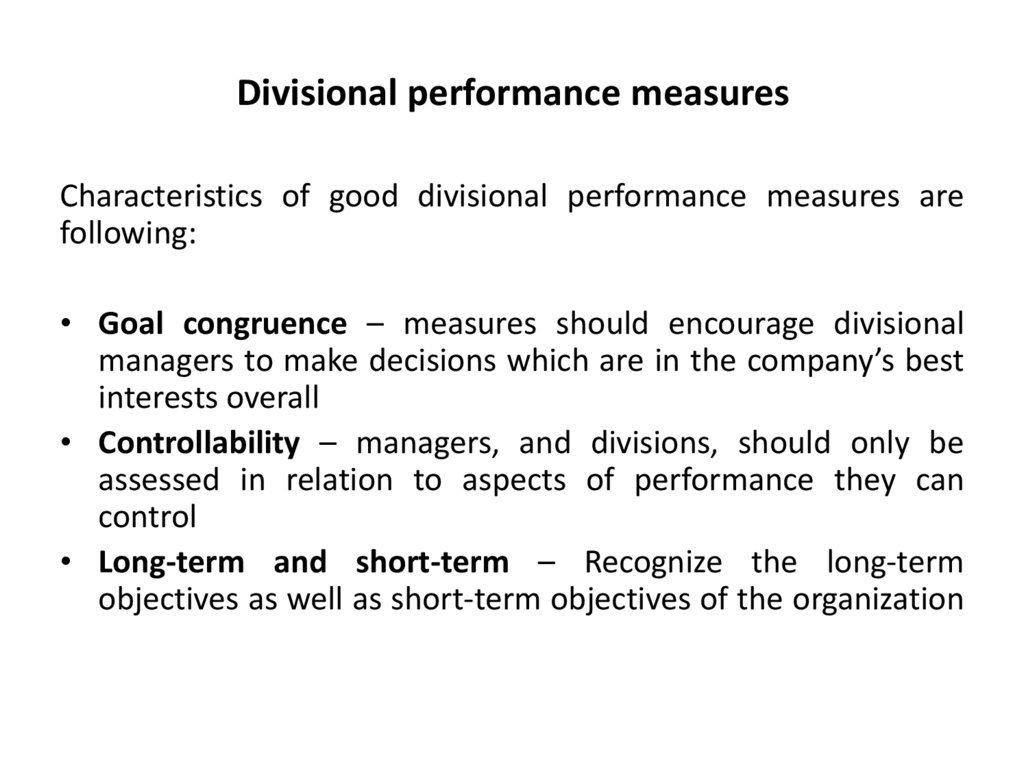
Divisional performance measuresCharacteristics of good divisional performance measures are
following:
• Goal congruence – measures should encourage divisional
managers to make decisions which are in the company’s best
interests overall
• Controllability – managers, and divisions, should only be
assessed in relation to aspects of performance they can
control
• Long-term and short-term – Recognize the long-term
objectives as well as short-term objectives of the organization
43.
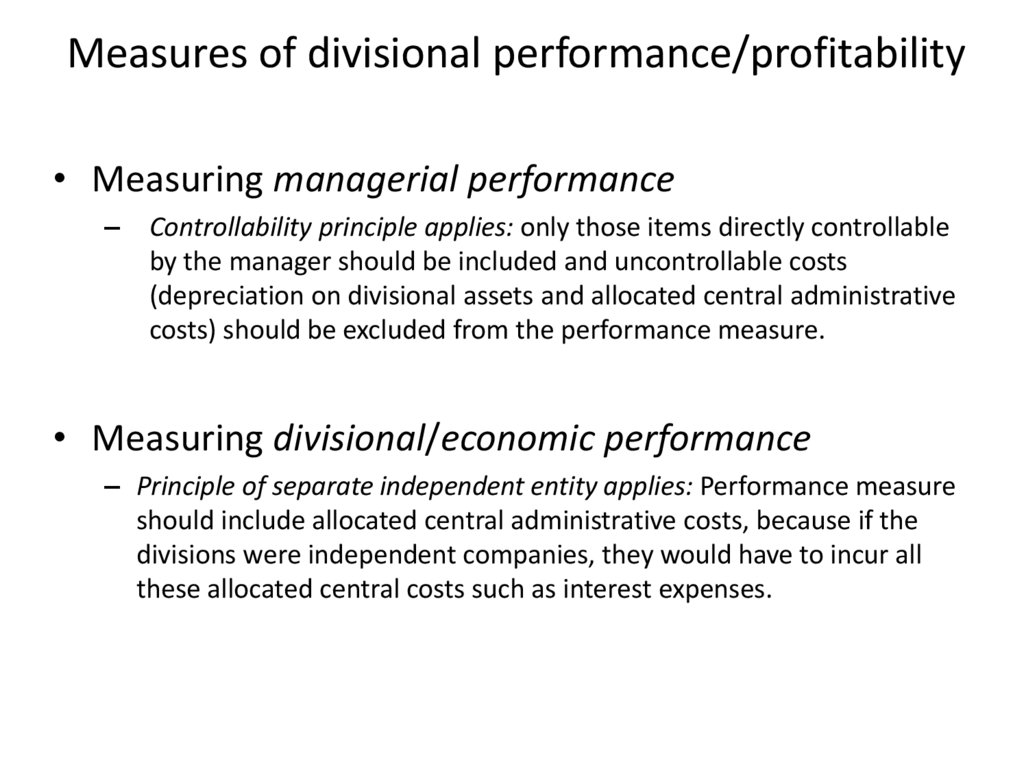
Measures of divisional performance/profitability• Measuring managerial performance
–
Controllability principle applies: only those items directly controllable
by the manager should be included and uncontrollable costs
(depreciation on divisional assets and allocated central administrative
costs) should be excluded from the performance measure.
• Measuring divisional/economic performance
– Principle of separate independent entity applies: Performance measure
should include allocated central administrative costs, because if the
divisions were independent companies, they would have to incur all
these allocated central costs such as interest expenses.
44.
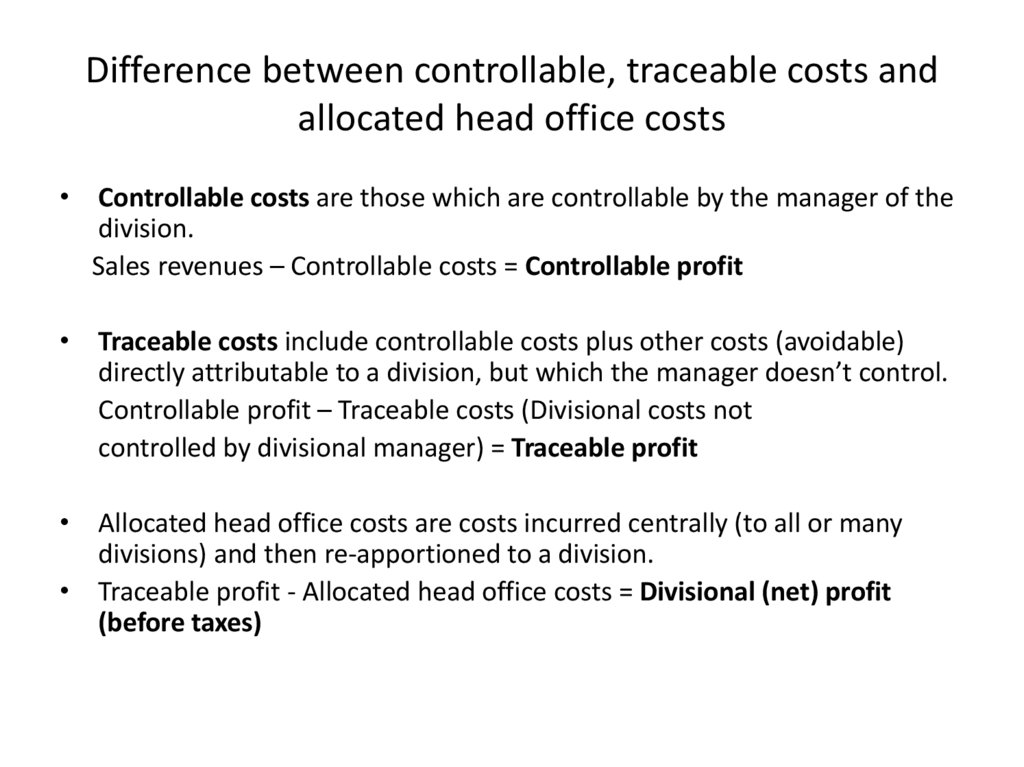
Difference between controllable, traceable costs andallocated head office costs
• Controllable costs are those which are controllable by the manager of the
division.
Sales revenues – Controllable costs = Controllable profit
• Traceable costs include controllable costs plus other costs (avoidable)
directly attributable to a division, but which the manager doesn’t control.
Controllable profit – Traceable costs (Divisional costs not
controlled by divisional manager) = Traceable profit
• Allocated head office costs are costs incurred centrally (to all or many
divisions) and then re-apportioned to a division.
• Traceable profit - Allocated head office costs = Divisional (net) profit
(before taxes)
45.
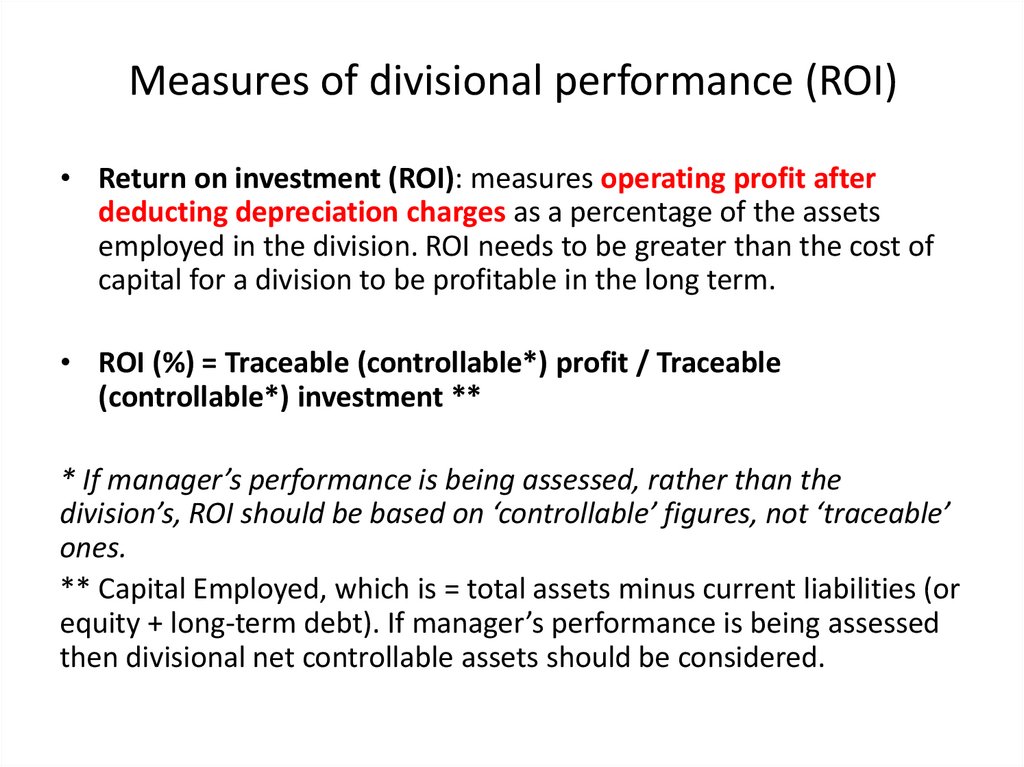
Measures of divisional performance (ROI)• Return on investment (ROI): measures operating profit after
deducting depreciation charges as a percentage of the assets
employed in the division. ROI needs to be greater than the cost of
capital for a division to be profitable in the long term.
• ROI (%) = Traceable (controllable*) profit / Traceable
(controllable*) investment **
* If manager’s performance is being assessed, rather than the
division’s, ROI should be based on ‘controllable’ figures, not ‘traceable’
ones.
** Capital Employed, which is = total assets minus current liabilities (or
equity + long-term debt). If manager’s performance is being assessed
then divisional net controllable assets should be considered.
46.
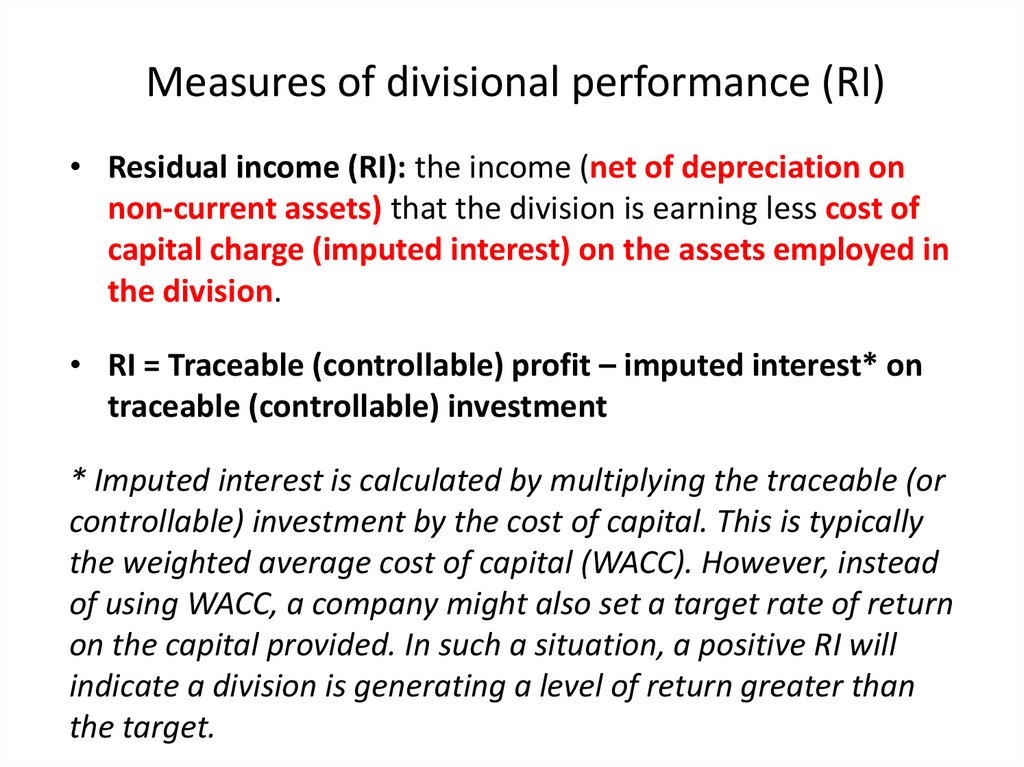
Measures of divisional performance (RI)• Residual income (RI): the income (net of depreciation on
non-current assets) that the division is earning less cost of
capital charge (imputed interest) on the assets employed in
the division.
• RI = Traceable (controllable) profit – imputed interest* on
traceable (controllable) investment
* Imputed interest is calculated by multiplying the traceable (or
controllable) investment by the cost of capital. This is typically
the weighted average cost of capital (WACC). However, instead
of using WACC, a company might also set a target rate of return
on the capital provided. In such a situation, a positive RI will
indicate a division is generating a level of return greater than
the target.
47.
Transfer pricing and BSC48.
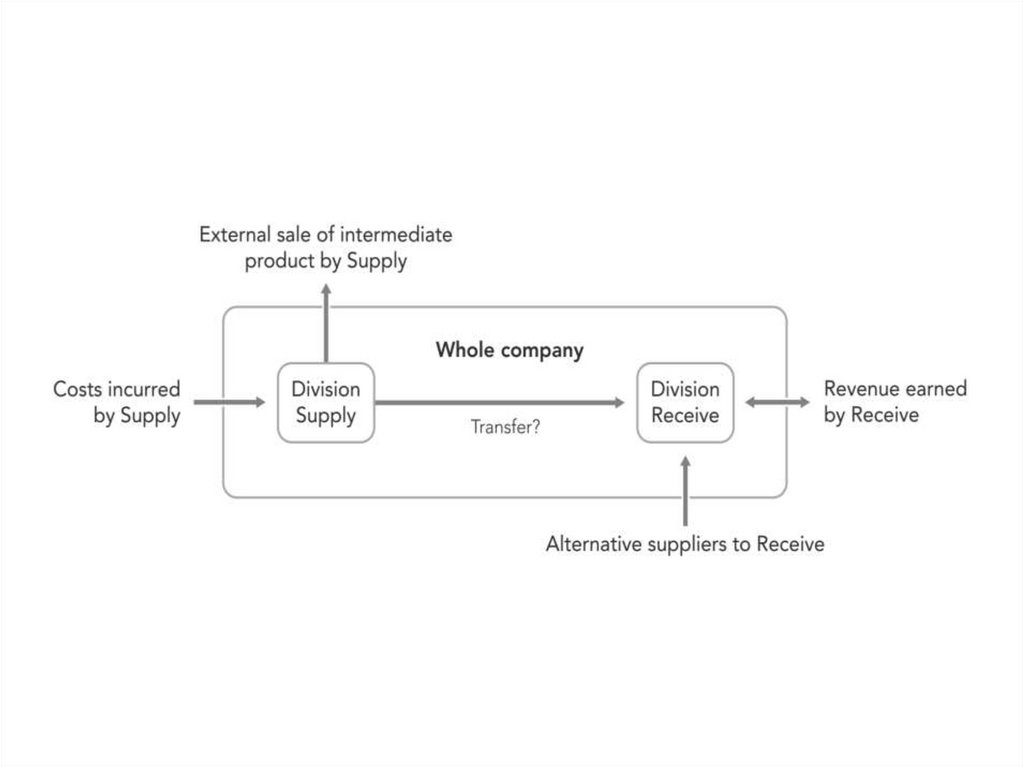
Goals of transfer pricingThe price charged should ensure that the transfer satisfies
the company, the supplying division and the receiving
division.
It is vital that the transfer price is carefully selected to
ensure all parties act in the best interest of the company.
The goals of a transfer pricing system are:
• (a) Goal congruence
• (b) Equitable performance measurement
• (c) Retained divisional autonomy
• (d) Motivated divisional managers
• (e) Optimum resource allocation
49.
50.
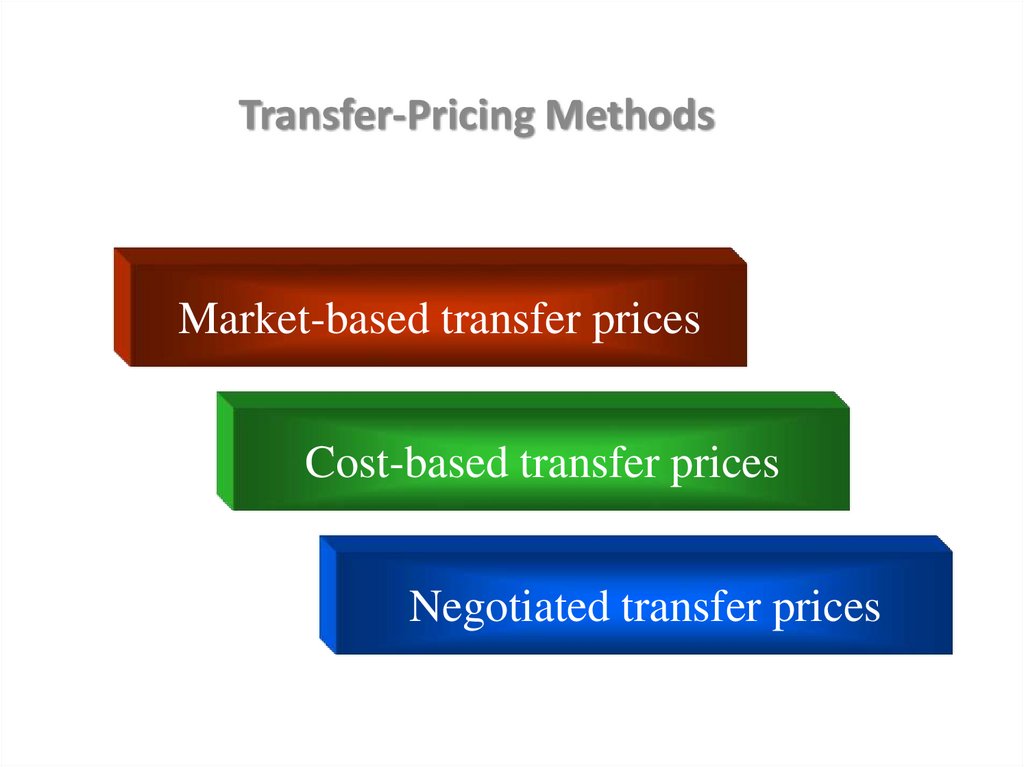
Transfer-Pricing MethodsMarket-based transfer prices
Cost-based transfer prices
Negotiated transfer prices
51.
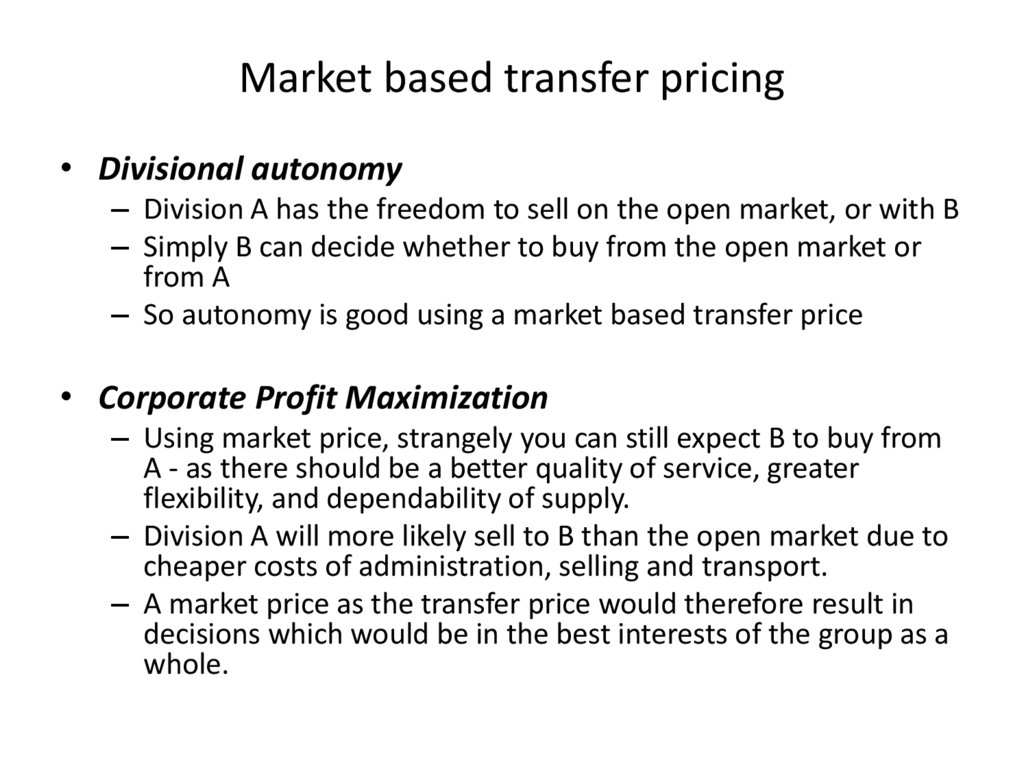
Market based transfer pricing• Divisional autonomy
– Division A has the freedom to sell on the open market, or with B
– Simply B can decide whether to buy from the open market or
from A
– So autonomy is good using a market based transfer price
• Corporate Profit Maximization
– Using market price, strangely you can still expect B to buy from
A - as there should be a better quality of service, greater
flexibility, and dependability of supply.
– Division A will more likely sell to B than the open market due to
cheaper costs of administration, selling and transport.
– A market price as the transfer price would therefore result in
decisions which would be in the best interests of the group as a
whole.
52.
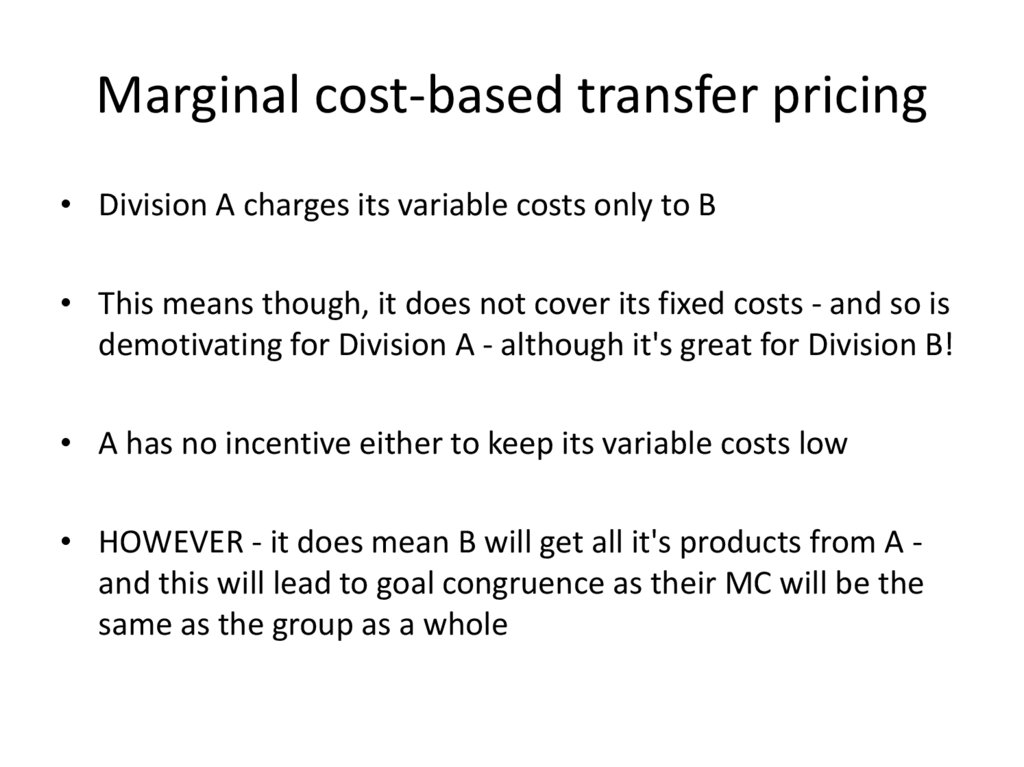
Marginal cost-based transfer pricing• Division A charges its variable costs only to B
• This means though, it does not cover its fixed costs - and so is
demotivating for Division A - although it's great for Division B!
• A has no incentive either to keep its variable costs low
• HOWEVER - it does mean B will get all it's products from A and this will lead to goal congruence as their MC will be the
same as the group as a whole
53.
Full cost-based transfer pricing• Division A charges the full cost (including fixed overheads
absorbed).
• They would still not earn any profit - so sometimes a COST + profit
approach is used. If a full cost plus approach is used, a profit margin
is also included in this transfer price.
• Division A gets some profit at the expense of Division B.
• However, Division A has no incentive to keep costs down -although
using standard costs instead of actual costs would prevent this.
• Also, Division B's variable costs include Division A's FC and profit this can lead to dysfunctional decisions
54.
Negotiated Transfer Pricing• In some cases, the divisions of a company are free to
negotiate the transfer price between themselves and
then to decide whether to buy and sell internally or
deal with outside parties.
• Negotiated transfer prices are often employed when
market prices are volatile and change occurs
constantly.
• The negotiated transfer price is the outcome of a
bargaining process between the supplying and
receiving division.
55.
Other Approaches to Transfer PricingThere are two approaches to transfer pricing which try to preserve the economic
information inherent in variable costs while permitting the transferring division
to make profits and allowing better performance valuation:
• Variable cost plus lump sum (“two-part” tariff transfer pricing system):
Here transfers are made at variable cost but, periodically, a transfer is made
between the two divisions to account for A's fixed costs and profit (supplying
division charges the receiving division a fixed fee to recover its fixed costs and earn a
profit).
• Dual Pricing:
Here, Division A transfers out at cost plus a mark up and the receiving division
transfers in at variable cost.
Obviously, the divisional current accounts won’t agree, and some period-end
adjustments will be needed to reconcile those and eliminate fictitious interdivisional
profits.
56.
Minimum and Maximum Transfer Prices• What is the minimum selling price that the selling division
would be prepared to sell for?
• What is the maximum price that the buying division would be
prepared to pay for the product?
57.
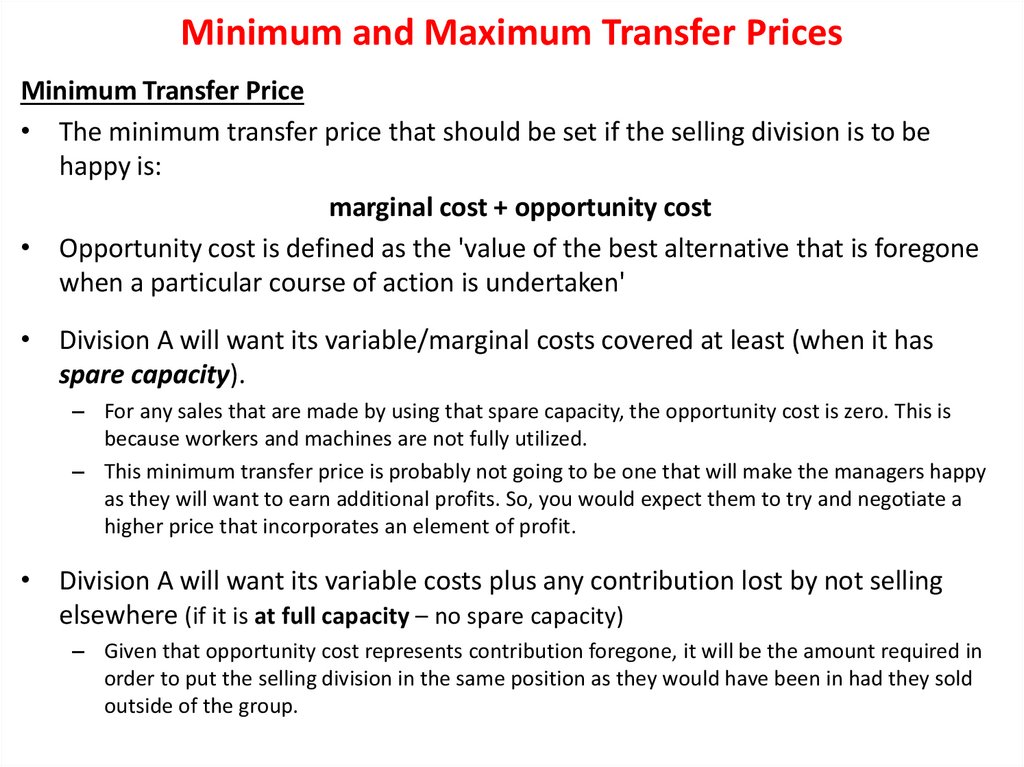
Minimum and Maximum Transfer PricesMinimum Transfer Price
• The minimum transfer price that should be set if the selling division is to be
happy is:
marginal cost + opportunity cost
• Opportunity cost is defined as the 'value of the best alternative that is foregone
when a particular course of action is undertaken'
• Division A will want its variable/marginal costs covered at least (when it has
spare capacity).
– For any sales that are made by using that spare capacity, the opportunity cost is zero. This is
because workers and machines are not fully utilized.
– This minimum transfer price is probably not going to be one that will make the managers happy
as they will want to earn additional profits. So, you would expect them to try and negotiate a
higher price that incorporates an element of profit.
• Division A will want its variable costs plus any contribution lost by not selling
elsewhere (if it is at full capacity – no spare capacity)
– Given that opportunity cost represents contribution foregone, it will be the amount required in
order to put the selling division in the same position as they would have been in had they sold
outside of the group.
58.
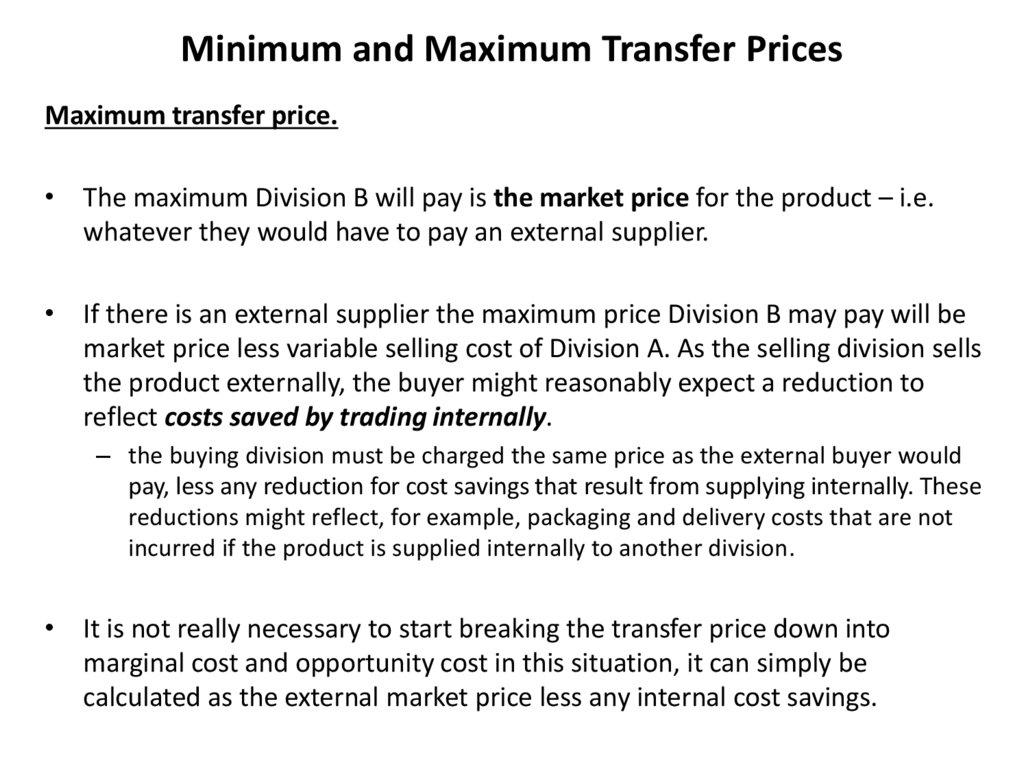
Minimum and Maximum Transfer PricesMaximum transfer price.
• The maximum Division B will pay is the market price for the product – i.e.
whatever they would have to pay an external supplier.
• If there is an external supplier the maximum price Division B may pay will be
market price less variable selling cost of Division A. As the selling division sells
the product externally, the buyer might reasonably expect a reduction to
reflect costs saved by trading internally.
– the buying division must be charged the same price as the external buyer would
pay, less any reduction for cost savings that result from supplying internally. These
reductions might reflect, for example, packaging and delivery costs that are not
incurred if the product is supplied internally to another division.
• It is not really necessary to start breaking the transfer price down into
marginal cost and opportunity cost in this situation, it can simply be
calculated as the external market price less any internal cost savings.
59.
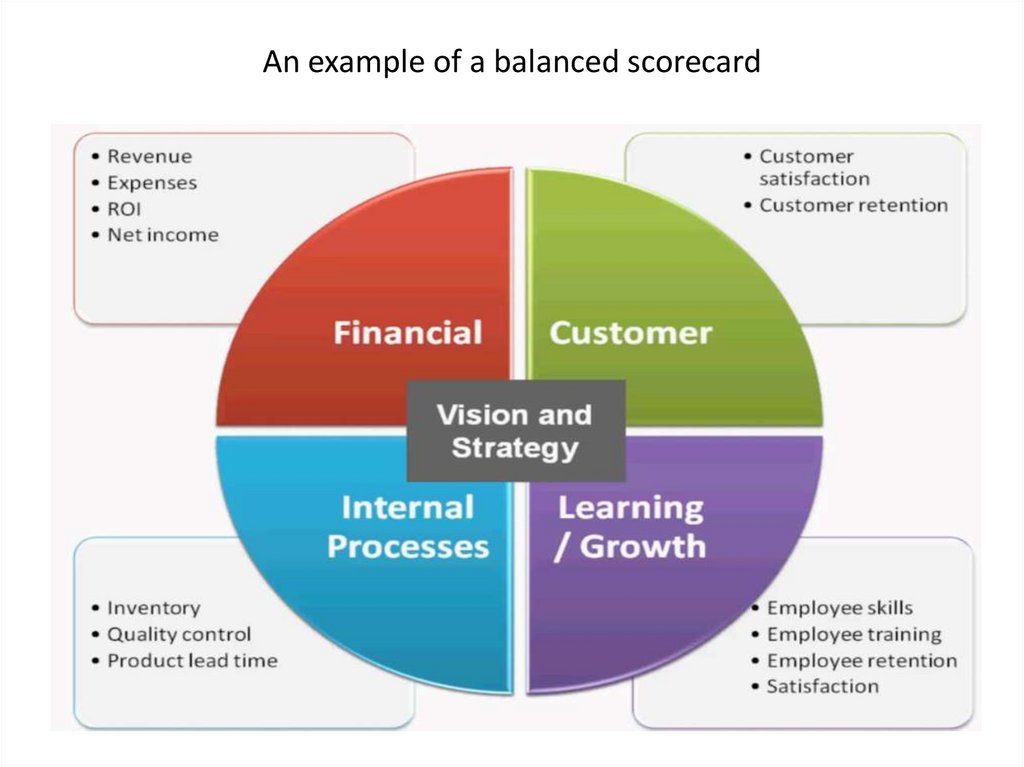
Balanced Score Card60.
Four perspectives of BSC:• The balanced scorecard approach to performance measurement and
control emphasizes the need to provide management with a set of
information which covers all relevant areas of performance.
• It focuses on four different perspectives and uses financial and nonfinancial indicators.
• The four perspectives are:
• Customer – what is it about us that new and existing customers value?
• Internal – what processes must we excel at to achieve our financial and
customer objectives?
• Innovation and growth (learning) – how can we continue to improve and
create future value?
• Financial – how do we create value for our shareholders?
• Within each of these perspectives a company should seek to identify a
series of goals and measures.