


 Химия
Химия Промышленность
Похожие презентации:


Investigation of iron-containing minerals in the biox process
1.
Navoi State University of Mining and TechnologiesChemistry-metallurgy faculty
Group: 15 M -21
Specialty: Chemical Technology
Student: Nodira Saidova
Master’s thesis defense:
INVESTIGATION OF IRON-CONTAINING
MINERALS IN THE BIOX PROCESS
26/06/2023
2.
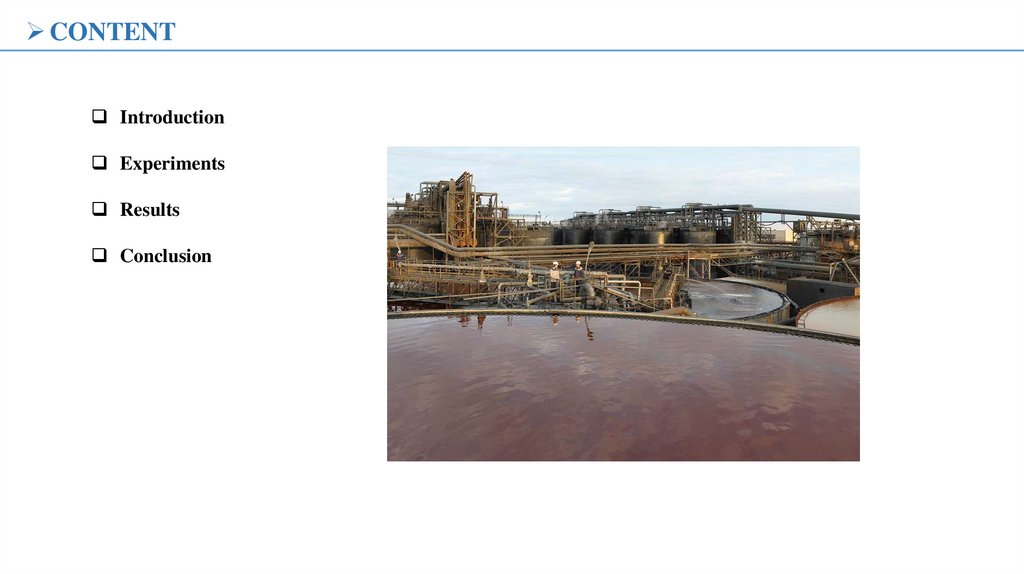
CONTENTIntroduction
Experiments
Results
Conclusion
3.
INTRODUCTIONThe aim of the work:
Studying chemical and physical properties of minerals which are produced in the BIOX process, especially iron-bearing
minerals.
Research object:
Kokpatas and Daugiztau deposits at the 3rd hydrometallurgical plant of the Navoi Mining and Metallurgical Combine
Research subject:
Investigation of physico-chemical properties of sulfide ores from different stages of bacterial leaching: ore preparation,
enrichment, up to thickening, neutralization, sorption cyanidation and analysis of cyanidation tailings
4.
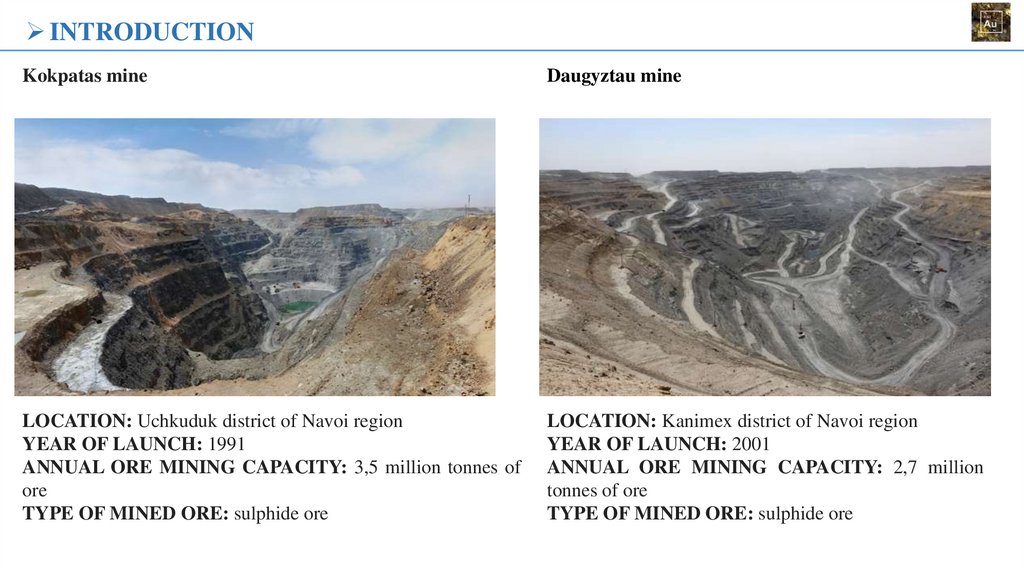
INTRODUCTIONKokpatas mine
Daugyztau mine
LOCATION: Uchkuduk district of Navoi region
YEAR OF LAUNCH: 1991
ANNUAL ORE MINING CAPACITY: 3,5 million tonnes of
ore
TYPE OF MINED ORE: sulphide ore
LOCATION: Kanimex district of Navoi region
YEAR OF LAUNCH: 2001
ANNUAL ORE MINING CAPACITY: 2,7 million
tonnes of ore
TYPE OF MINED ORE: sulphide ore
5.
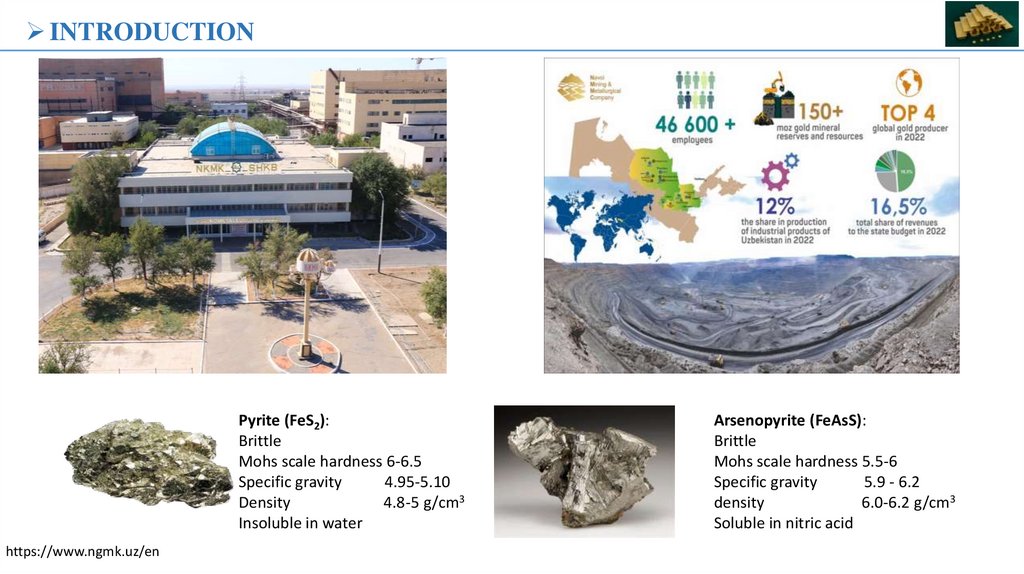
INTRODUCTIONPyrite (FeS2):
Brittle
Mohs scale hardness 6-6.5
Specific gravity
4.95-5.10
Density
4.8-5 g/cm3
Insoluble in water
https://www.ngmk.uz/en
Arsenopyrite (FeAsS):
Brittle
Mohs scale hardness 5.5-6
Specific gravity
5.9 - 6.2
density
6.0-6.2 g/cm3
Soluble in nitric acid
6.
INTRODUCTIONThe oxidation reactions are:
2FeS2 + 7O2 + 2H2O → 2FeSO4 + 2H2SO4
4FeSO4 + 2H2SO4 + O2 → 2Fe2(SO4)3 + 2H2O
4FeS2 + 15O2 + 2H2O → 2Fe2(SO4)3 + 2H2SO4
4FeAsS + 11O2 + 2H2O → 4HAsO2 + 4FeSO4
HAsO2 + 2FeSO4 + H2SO4 + O2 → Fe2(SO4)3 + H3AsO4
4FeAsS + 13O2 + 2H2SO4 + 2H2O → 2 Fe2(SO4)3 + 2H3AsO4 + 2HAsO2
The main end-product of the oxidation reaction is ferric sulfate. The
hydrolysis reactions include:
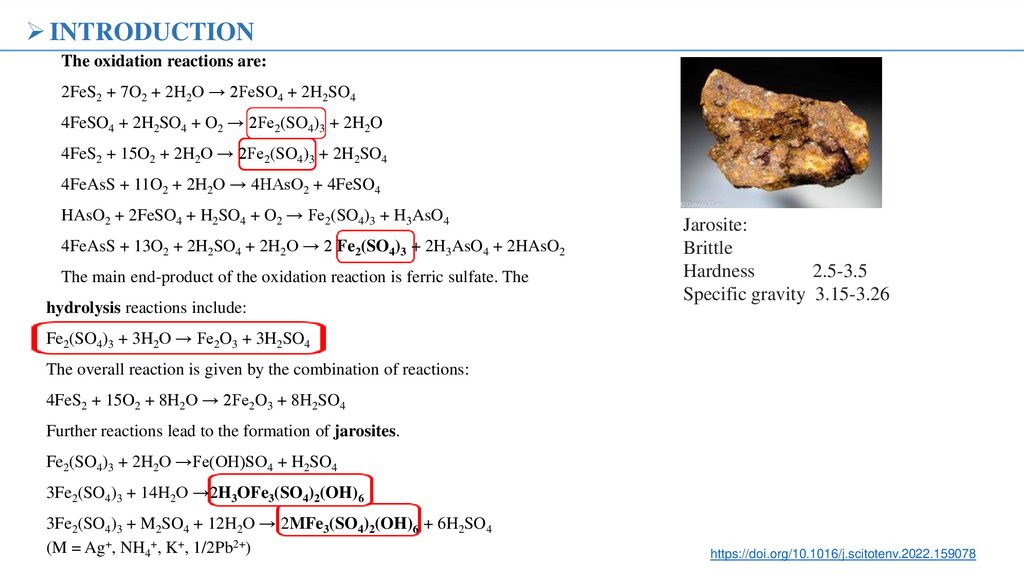
Jarosite:
Brittle
Hardness
2.5-3.5
Specific gravity 3.15-3.26
Fe2(SO4)3 + 3H2O → Fe2O3 + 3H2SO4
The overall reaction is given by the combination of reactions:
4FeS2 + 15O2 + 8H2O → 2Fe2O3 + 8H2SO4
Further reactions lead to the formation of jarosites.
Fe2(SO4)3 + 2H2O →Fe(OH)SO4 + H2SO4
3Fe2(SO4)3 + 14H2O →2H3OFe3(SO4)2(OH)6
3Fe2(SO4)3 + M2SO4 + 12H2O → 2MFe3(SO4)2(OH)6 + 6H2SO4
(M = Ag+, NH4+, K+, 1/2Pb2+)
https://doi.org/10.1016/j.scitotenv.2022.159078
7.
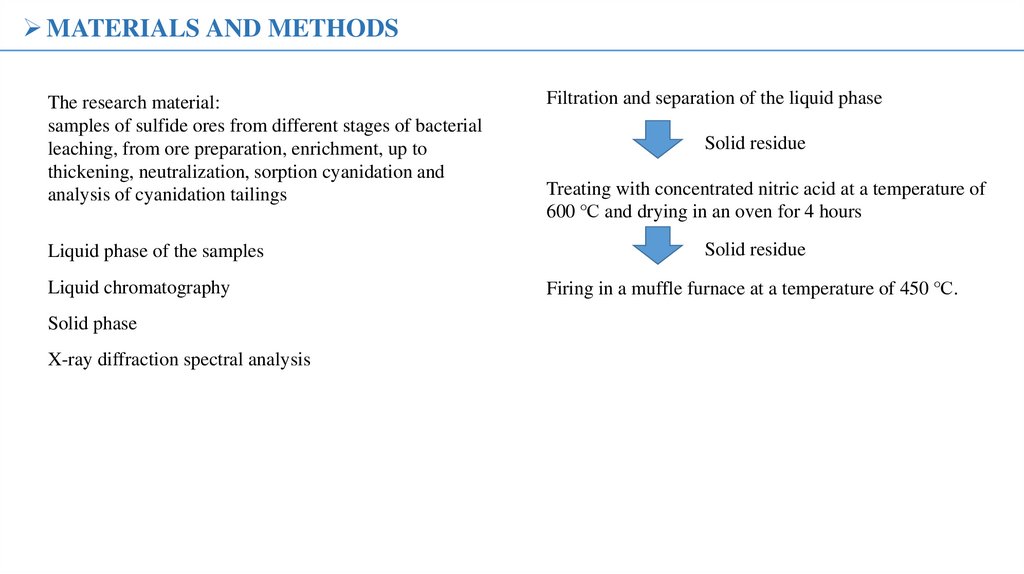
MATERIALS AND METHODSThe research material:
samples of sulfide ores from different stages of bacterial
leaching, from ore preparation, enrichment, up to
thickening, neutralization, sorption cyanidation and
analysis of cyanidation tailings
Liquid phase of the samples
Liquid chromatography
Solid phase
X-ray diffraction spectral analysis
Filtration and separation of the liquid phase
Solid residue
Treating with concentrated nitric acid at a temperature of
600 ℃ and drying in an oven for 4 hours
Solid residue
Firing in a muffle furnace at a temperature of 450 ℃.
8.
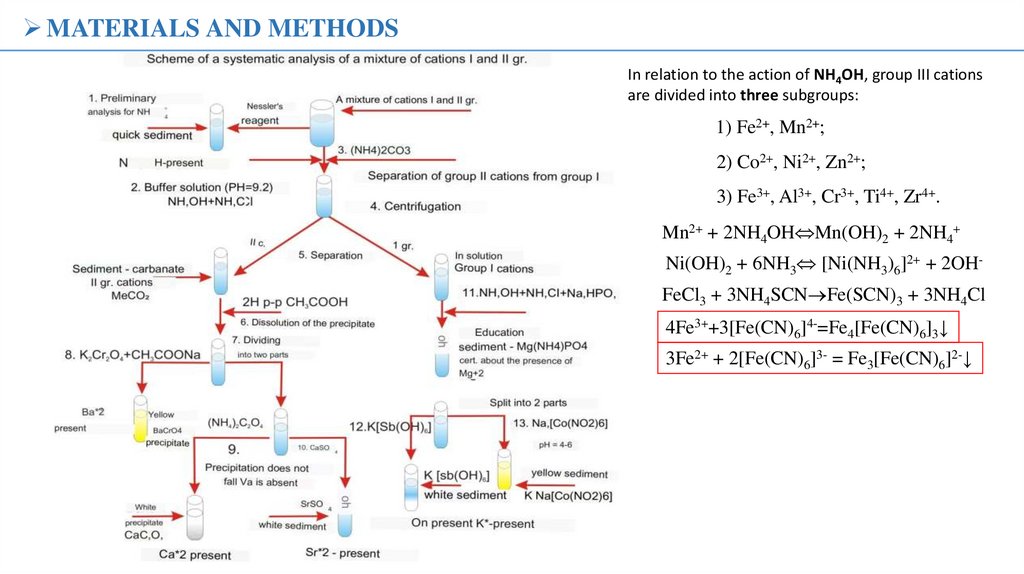
MATERIALS AND METHODSIn relation to the action of NH4OH, group III cations
are divided into three subgroups:
1) Fe2+, Mn2+;
2) Co2+, Ni2+, Zn2+;
3) Fe3+, Al3+, Cr3+, Ti4+, Zr4+.
Mn2+ + 2NH4OH Mn(OH)2 + 2NH4+
Ni(OH)2 + 6NH3 [Ni(NH3)6]2+ + 2OHFeCl3 + 3NH4SCN Fe(SCN)3 + 3NH4Cl
4Fe3++3[Fe(CN)6]4-=Fe4[Fe(CN)6]3↓
3Fe2+ + 2[Fe(CN)6]3- = Fe3[Fe(CN)6]2-↓
9.
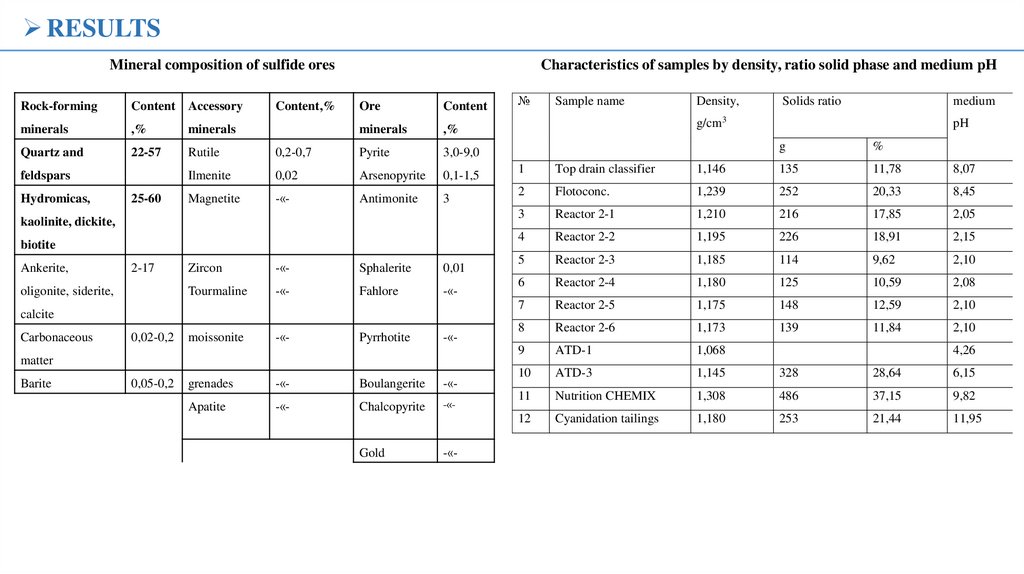
RESULTSMineral composition of sulfide ores
Rock-forming
Content Accessory
minerals
,%
minerals
Quartz and
22-57
Rutile
feldspars
Hydromicas,
25-60
Content,%
Characteristics of samples by density, ratio solid phase and medium pH
Ore
Content
minerals
,%
0,2-0,7
Pyrite
3,0-9,0
Ilmenite
0,02
Arsenopyrite
0,1-1,5
Magnetite
-«-
Antimonite
3
kaolinite, dickite,
biotite
Ankerite,
2-17
oligonite, siderite,
Zircon
-«-
Sphalerite
0,01
Tourmaline
-«-
Fahlore
-«-
calcite
Carbonaceous
0,02-0,2
moissonite
-«-
Pyrrhotite
-«-
matter
Barite
0,05-0,2
grenades
-«-
Boulangerite
-«-
Apatite
-«-
Chalcopyrite
-«-
Gold
-«-
№
Sample name
Density,
Solids ratio
medium
g/cm3
pH
g
%
1
Top drain classifier
1,146
135
11,78
8,07
2
Flotoconc.
1,239
252
20,33
8,45
3
Reactor 2-1
1,210
216
17,85
2,05
4
Reactor 2-2
1,195
226
18,91
2,15
5
Reactor 2-3
1,185
114
9,62
2,10
6
Reactor 2-4
1,180
125
10,59
2,08
7
Reactor 2-5
1,175
148
12,59
2,10
8
Reactor 2-6
1,173
139
11,84
2,10
9
ATD-1
1,068
10
ATD-3
1,145
328
28,64
6,15
11
Nutrition CHEMIX
1,308
486
37,15
9,82
12
Cyanidation tailings
1,180
253
21,44
11,95
4,26
10.
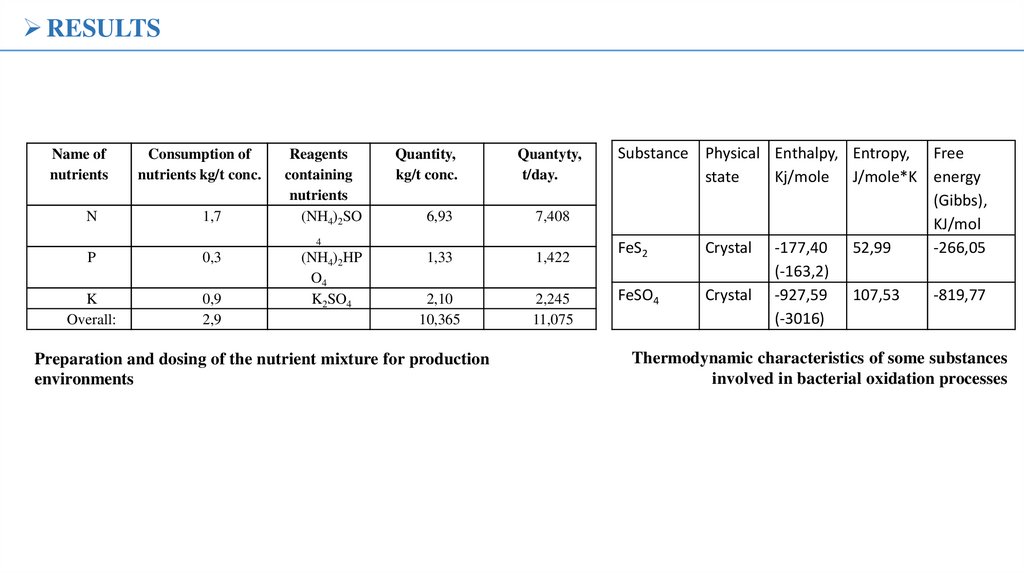
RESULTSName of
nutrients
N
Consumption of
nutrients kg/t conc.
1,7
Reagents
containing
nutrients
(NH4)2SO
Quantity,
kg/t conc.
Quantyty,
t/day.
6,93
7,408
1,33
1,422
2,10
10,365
2,245
11,075
4
P
0,3
K
Overall:
0,9
2,9
(NH4)2HP
O4
K2SO4
Preparation and dosing of the nutrient mixture for production
environments
Substance Physical Enthalpy, Entropy, Free
state
Kj/mole J/mole*K energy
(Gibbs),
KJ/mol
FeS2
Crystal -177,40 52,99
-266,05
(-163,2)
FeSO4
Crystal -927,59 107,53
-819,77
(-3016)
Thermodynamic characteristics of some substances
involved in bacterial oxidation processes
11.
RESULTSa. Concentration of Na
Sample
No
1
44Ca
%
0,0016
0,16
2
0,00163
0,163
3
0,0022
0,22
4
0,00288
0,288
5
0,00309
0,309
6
0,00276
0,276
7
0,00261
0,261
8
0,00287
0,287
9
0,00278
0,278
10
0,00267
0,267
11
0,0023
0,23
12
0,00273
0,273
13
0,00309
0,309
b. Concentration of K
Behavior of (a) Sodium and (b) Potassium ions during leaching
The behavior of calcium ions at different stages of leaching.
12.
RESULTS1
1
5
13
4,5
4
3,5
3
2,5
2
1,5
1
0,5
0
13
2
4
3
12
3
12
2
1
11
4
11
0
10
1
2
13
3
12
4
11
8000000
7000000
6000000
5000000
4000000
3000000
2000000
1000000
0
2
3
4
5
10
9
5
10
5
6
8
7
9
6
8
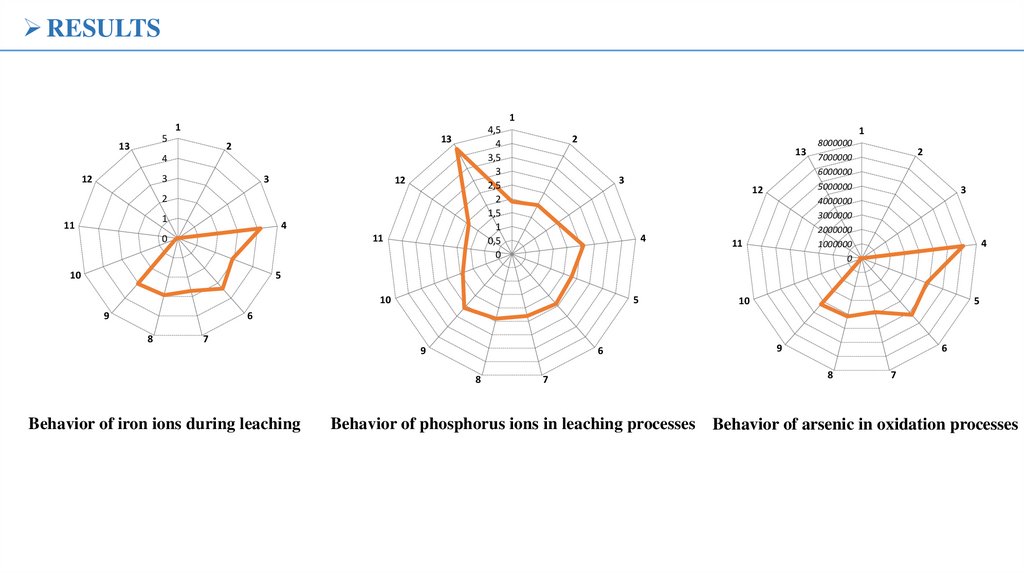
Behavior of iron ions during leaching
7
Behavior of phosphorus ions in leaching processes
9
6
8
7
Behavior of arsenic in oxidation processes
13.
Name of optionsRESULTS
Top drain classifier
Flotation concentrate
1
160
140
120
100
80
60
40
20
0
13
12
11
Reactor 2-1
2
Reactor 2-2
3
Reactor 2-3
4
Reactor 2-4
10
5
Reactor 2-5
Reactor 2-6
9
6
Countercurrent decanting unit Dec-1
8
7
Behavior of gold ions at different stages of leaching
Countercurrent decanting unit Dec -3
Nutrition CHEMIX
Cyanidation tailings
Cyanidation tailings cinder
Samples
Sample 1 acid
Sample 1 alkali
Sample 2 acid
Sample 2 alkali
Sample 3 acid
Sample 3 alkali
Sample 4 acid
Sample 4 alkali
Sample 5 acid
Sample 5 alkali
Sample 6 acid
Sample 6 alkali
Sample 7 acid
Sample 7 alkali
Sample 8 acid
Sample 8 alkali
Sample 9 acid
Sample 9 alkali
Sample 10 acid
Sample 10 alkali
Sample 11 acid
Sample 11 alkali
Sample 12 acid
Sample 12 alkali
Sample 13 acid
Sample 13 alkali
Au (ppb)
797,76716
389,15825
291,86604
0
1478,9281
0
379,42662
0
3327,3969
428,06867
3989,1352
0
5477,7156
0
5964,2433
933,98302
8387,176
1439,8998
14313,834
0
8250,9392
0
7287,5946
1235,7839
39880,71
3784,6911
Results of analyzes of gold content in solid samples after acid and
alkali treatment
14.
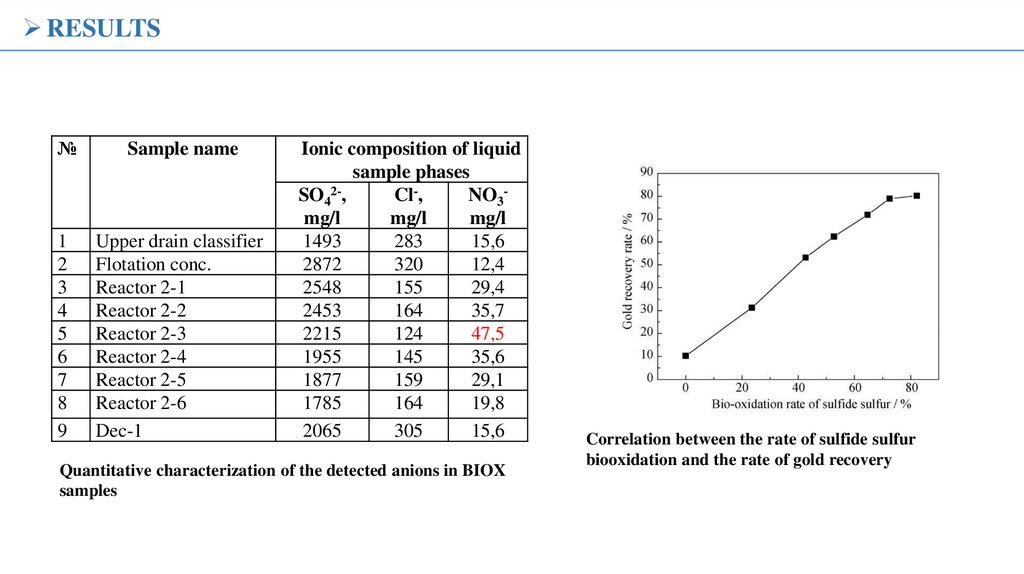
RESULTS№
Sample name
1
2
3
4
5
6
7
8
9
Upper drain classifier
Flotation conc.
Reactor 2-1
Reactor 2-2
Reactor 2-3
Reactor 2-4
Reactor 2-5
Reactor 2-6
Dec-1
Ionic composition of liquid
sample phases
SO42-,
Cl-,
NO3mg/l
mg/l
mg/l
1493
283
15,6
2872
320
12,4
2548
155
29,4
2453
164
35,7
2215
124
47,5
1955
145
35,6
1877
159
29,1
1785
164
19,8
2065
305
15,6
Quantitative characterization of the detected anions in BIOX
samples
Correlation between the rate of sulfide sulfur
biooxidation and the rate of gold recovery
15.
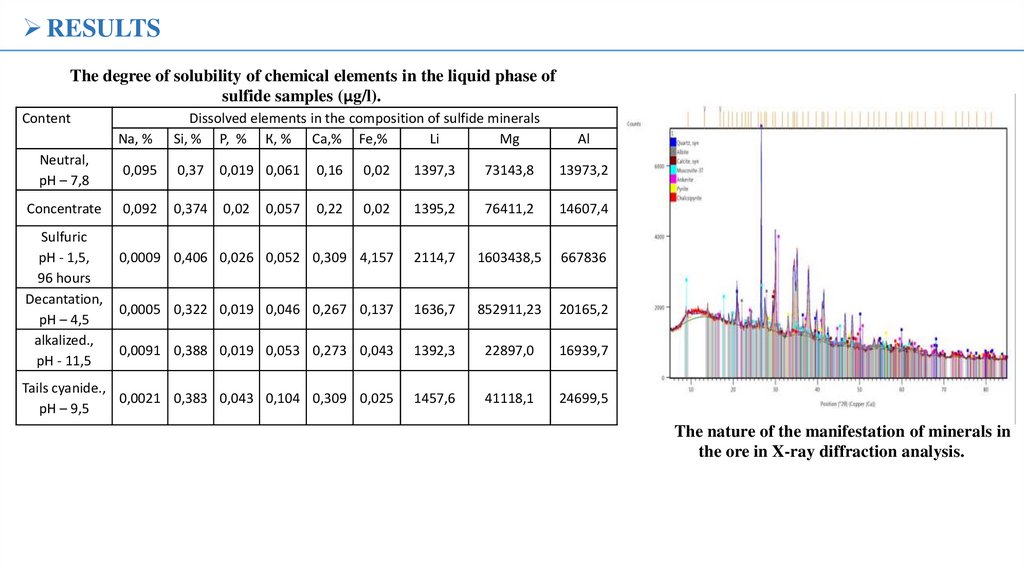
RESULTSThe degree of solubility of chemical elements in the liquid phase of
sulfide samples (µg/l).
Content
Na, %
Dissolved elements in the composition of sulfide minerals
Si, % Р, % К, % Са,% Fe,%
Li
Mg
Neutral,
рН – 7,8
0,095
0,37
0,019 0,061
0,16
0,02
1397,3
73143,8
13973,2
Concentrate
0,092
0,374
0,02
0,22
0,02
1395,2
76411,2
14607,4
0,0009 0,406 0,026 0,052 0,309 4,157
2114,7
1603438,5
667836
0,0005 0,322 0,019 0,046 0,267 0,137
1636,7
852911,23
20165,2
0,0091 0,388 0,019 0,053 0,273 0,043
1392,3
22897,0
16939,7
Tails cyanide.,
0,0021 0,383 0,043 0,104 0,309 0,025
рН – 9,5
1457,6
41118,1
24699,5
Sulfuric
рН - 1,5,
96 hours
Decantation,
рН – 4,5
alkalized.,
рН - 11,5
0,057
Al
The nature of the manifestation of minerals in
the ore in X-ray diffraction analysis.
16.
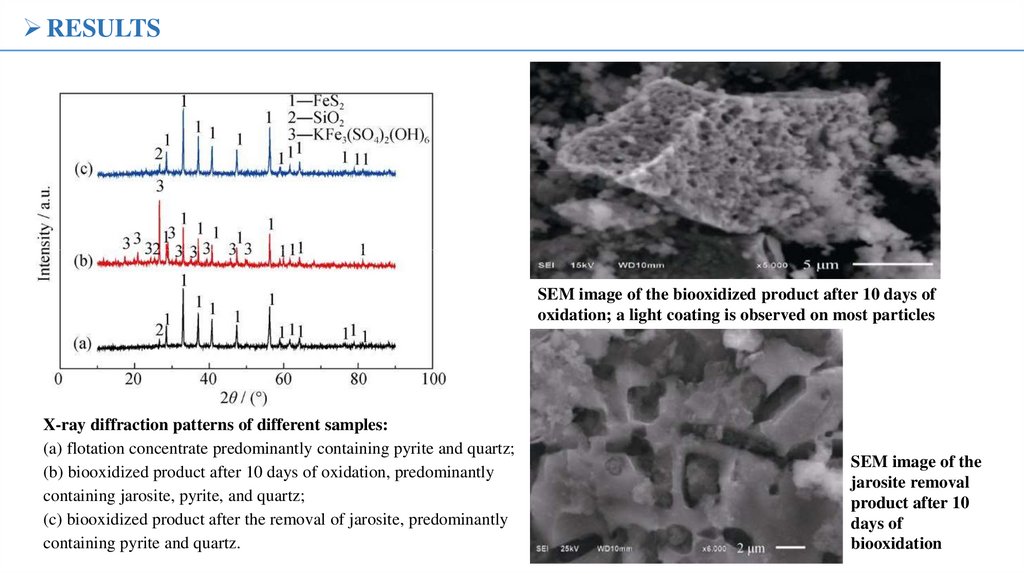
RESULTSSEM image of the biooxidized product after 10 days of
oxidation; a light coating is observed on most particles
X-ray diffraction patterns of different samples:
(a) flotation concentrate predominantly containing pyrite and quartz;
(b) biooxidized product after 10 days of oxidation, predominantly
containing jarosite, pyrite, and quartz;
(c) biooxidized product after the removal of jarosite, predominantly
containing pyrite and quartz.
SEM image of the
jarosite removal
product after 10
days of
biooxidation
17.
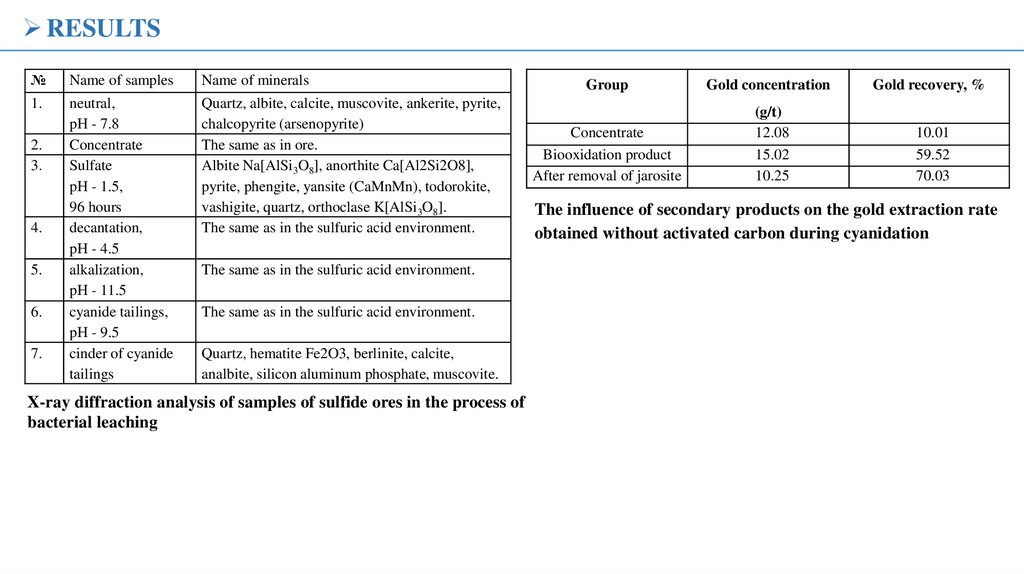
RESULTS№
Name of samples
Name of minerals
1.
neutral,
pH - 7.8
Concentrate
Sulfate
pH - 1.5,
96 hours
decantation,
pH - 4.5
alkalization,
pH - 11.5
cyanide tailings,
pH - 9.5
cinder of cyanide
tailings
Quartz, albite, calcite, muscovite, ankerite, pyrite,
chalcopyrite (arsenopyrite)
The same as in ore.
Albite Na[AlSi3O8], anorthite Ca[Al2Si2O8],
pyrite, phengite, yansite (CaMnMn), todorokite,
vashigite, quartz, orthoclase K[AlSi3O8].
The same as in the sulfuric acid environment.
2.
3.
4.
5.
6.
7.
The same as in the sulfuric acid environment.
The same as in the sulfuric acid environment.
Quartz, hematite Fe2O3, berlinite, calcite,
analbite, silicon aluminum phosphate, muscovite.
X-ray diffraction analysis of samples of sulfide ores in the process of
bacterial leaching
Group
Gold concentration
Gold recovery, %
Concentrate
Biooxidation product
After removal of jarosite
(g/t)
12.08
15.02
10.25
10.01
59.52
70.03
The influence of secondary products on the gold extraction rate
obtained without activated carbon during cyanidation
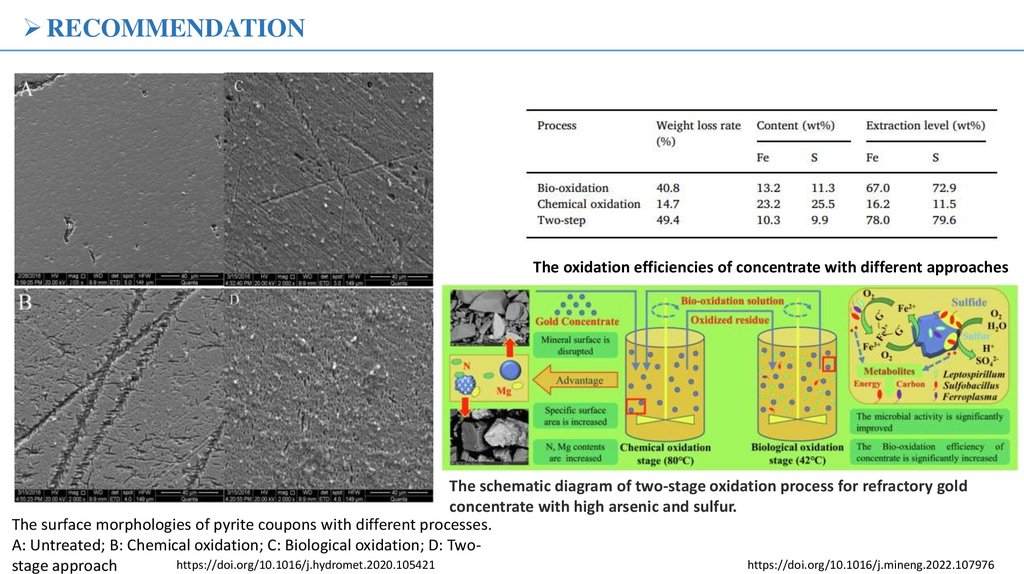
18.
RECOMMENDATIONThe oxidation efficiencies of concentrate with different approaches
The schematic diagram of two-stage oxidation process for refractory gold
concentrate with high arsenic and sulfur.
The surface morphologies of pyrite coupons with different processes.
A: Untreated; B: Chemical oxidation; C: Biological oxidation; D: Twohttps://doi.org/10.1016/j.hydromet.2020.105421
https://doi.org/10.1016/j.mineng.2022.107976
stage approach
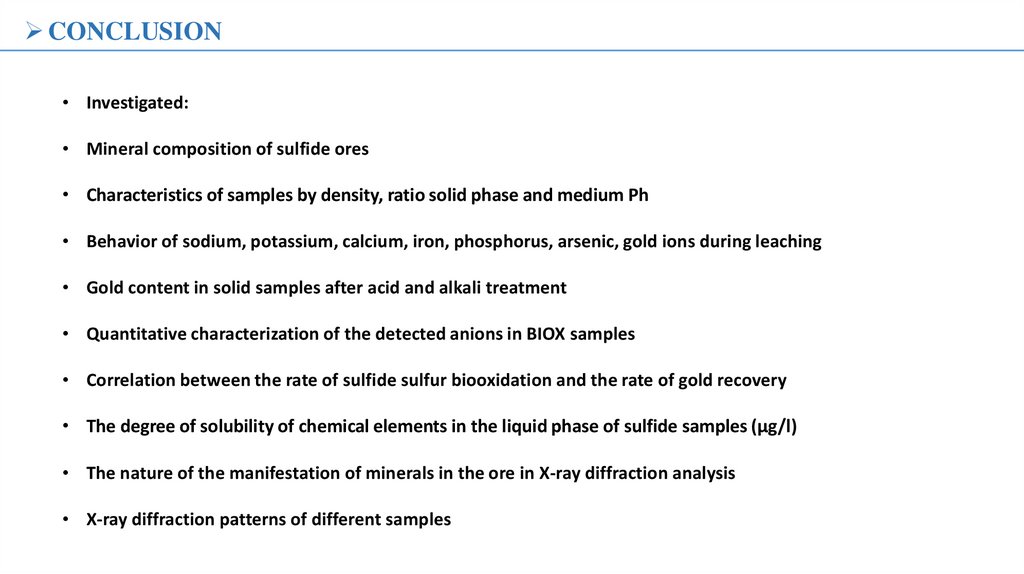
19.
CONCLUSION• Investigated:
• Mineral composition of sulfide ores
• Characteristics of samples by density, ratio solid phase and medium Ph
• Behavior of sodium, potassium, calcium, iron, phosphorus, arsenic, gold ions during leaching
• Gold content in solid samples after acid and alkali treatment
• Quantitative characterization of the detected anions in BIOX samples
• Correlation between the rate of sulfide sulfur biooxidation and the rate of gold recovery
• The degree of solubility of chemical elements in the liquid phase of sulfide samples (µg/l)
• The nature of the manifestation of minerals in the ore in X-ray diffraction analysis
• X-ray diffraction patterns of different samples
20.
Q&ATHANK YOU FOR YOUR
ATTENTION!
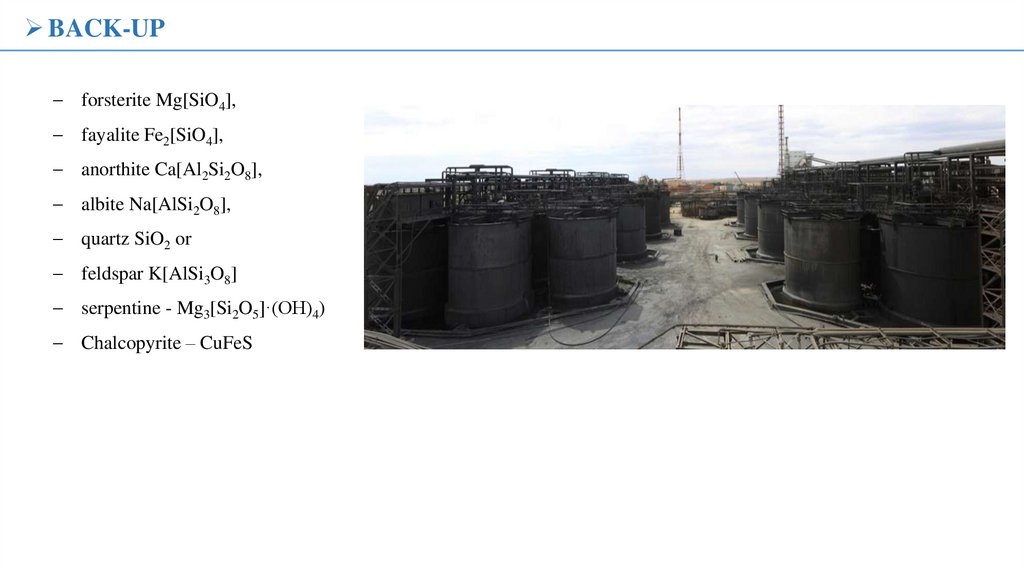
21.
BACK-UPforsterite Mg[SiO4],
fayalite Fe2[SiO4],
anorthite Ca[Al2Si2O8],
albite Na[AlSi2O8],
quartz SiO2 or
feldspar K[AlSi3O8]
serpentine - Mg3[Si2O5]·(OH)4)
Chalcopyrite – CuFeS