


 Психология
Похожие презентации:


Research question
1.
1MOTIVATION
Research question
Current study involves Investigation of the relationship between human sweet-liking phenotype, their impulsivity and
reward sensitivity
2.
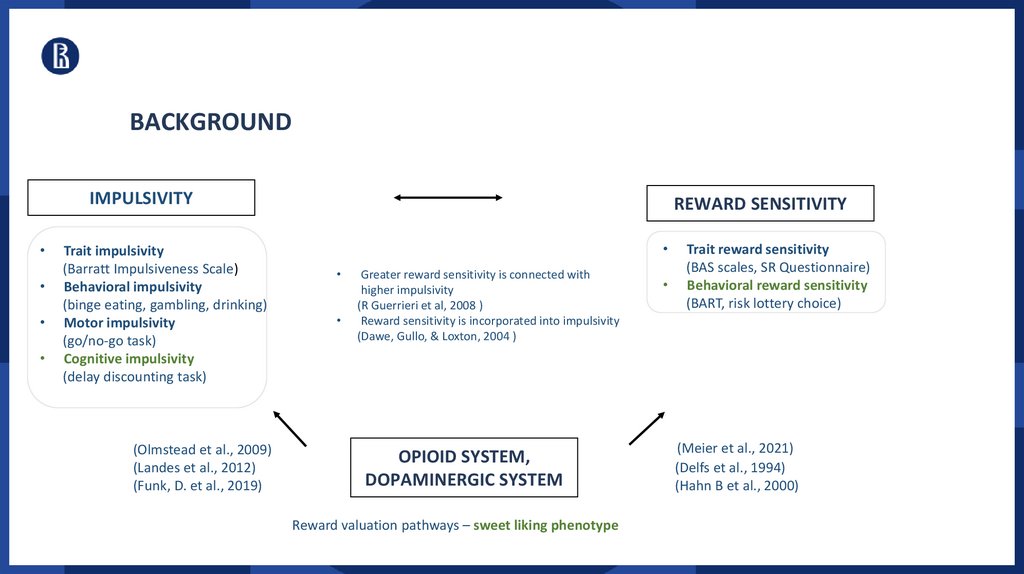
3BACKGROUND
IMPULSIVITY
Trait impulsivity
(Barratt Impulsiveness Scale)
Behavioral impulsivity
(binge eating, gambling, drinking)
Motor impulsivity
(go/no-go task)
Cognitive impulsivity
(delay discounting task)
(Olmstead et al., 2009)
(Landes et al., 2012)
(Funk, D. et al., 2019)
REWARD SENSITIVITY
Greater reward sensitivity is connected with
higher impulsivity
(R Guerrieri et al, 2008 )
Reward sensitivity is incorporated into impulsivity
(Dawe, Gullo, & Loxton, 2004 )
OPIOID SYSTEM,
DOPAMINERGIC SYSTEM
Reward valuation pathways – sweet liking phenotype
Trait reward sensitivity
(BAS scales, SR Questionnaire)
Behavioral reward sensitivity
(BART, risk lottery choice)
(Meier et al., 2021)
(Delfs et al., 1994)
(Hahn B et al., 2000)
3.
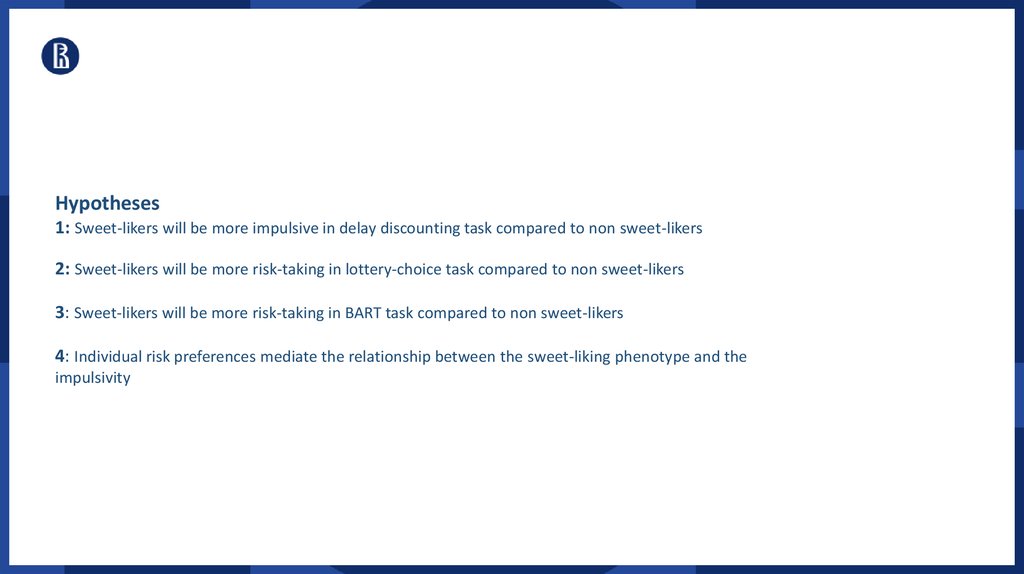
4Hypotheses
1: Sweet-likers will be more impulsive in delay discounting task compared to non sweet-likers
2: Sweet-likers will be more risk-taking in lottery-choice task compared to non sweet-likers
3: Sweet-likers will be more risk-taking in BART task compared to non sweet-likers
4: Individual risk preferences mediate the relationship between the sweet-liking phenotype and the
impulsivity
4.
5EXPERIMENTAL PROCEDURE
1. 38 participants
2. Age of participants: from 21 to 39
Non-pregnant
Absence of diabetes, or any psychiatric and neurological disorders
Absence of background in mathematics, physics, economics
3. Participants performed tasks in the Behavioral laboratory in HSE
Detailed instructions about each task
Examples of tasks
Randomized order
5.
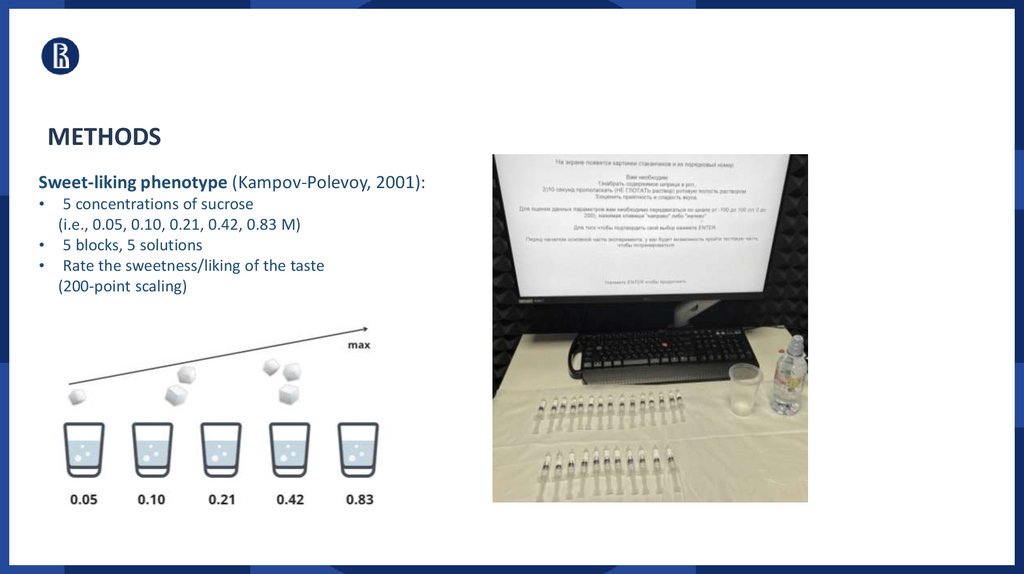
6METHODS
Sweet-liking phenotype (Kampov-Polevoy, 2001):
5 concentrations of sucrose
(i.e., 0.05, 0.10, 0.21, 0.42, 0.83 M)
• 5 blocks, 5 solutions
• Rate the sweetness/liking of the taste
(200-point scaling)
6.
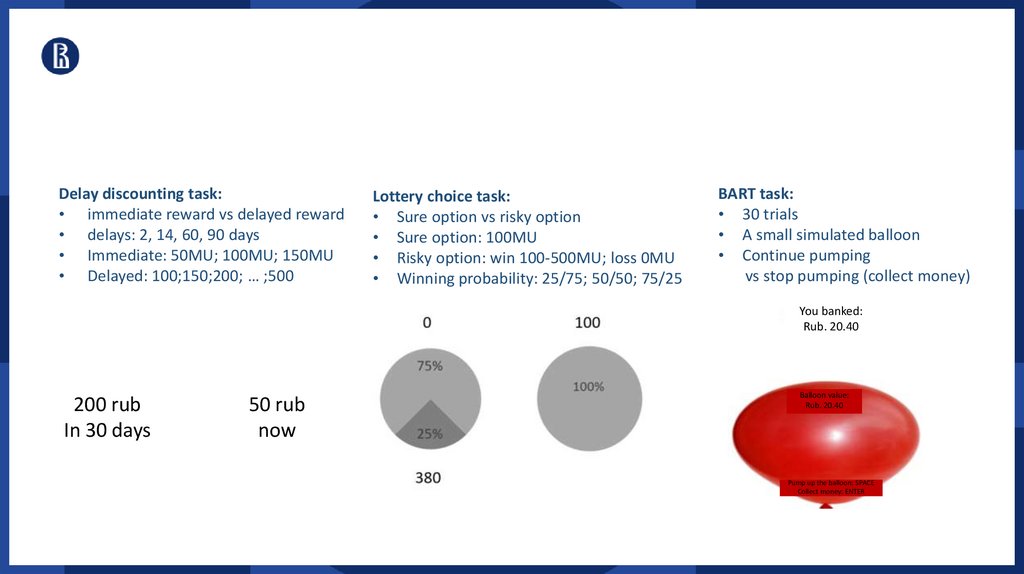
7Delay discounting task:
• immediate reward vs delayed reward
• delays: 2, 14, 60, 90 days
• Immediate: 50MU; 100MU; 150MU
• Delayed: 100;150;200; … ;500
Lottery choice task:
• Sure option vs risky option
• Sure option: 100MU
• Risky option: win 100-500MU; loss 0MU
• Winning probability: 25/75; 50/50; 75/25
BART task:
• 30 trials
• A small simulated balloon
• Continue pumping
vs stop pumping (collect money)
You banked:
Rub. 20.40
200 rub
In 30 days
50 rub
now
Balloon value:
Rub. 20.40
Pump up the balloon: SPACE
Collect money: ENTER
7.
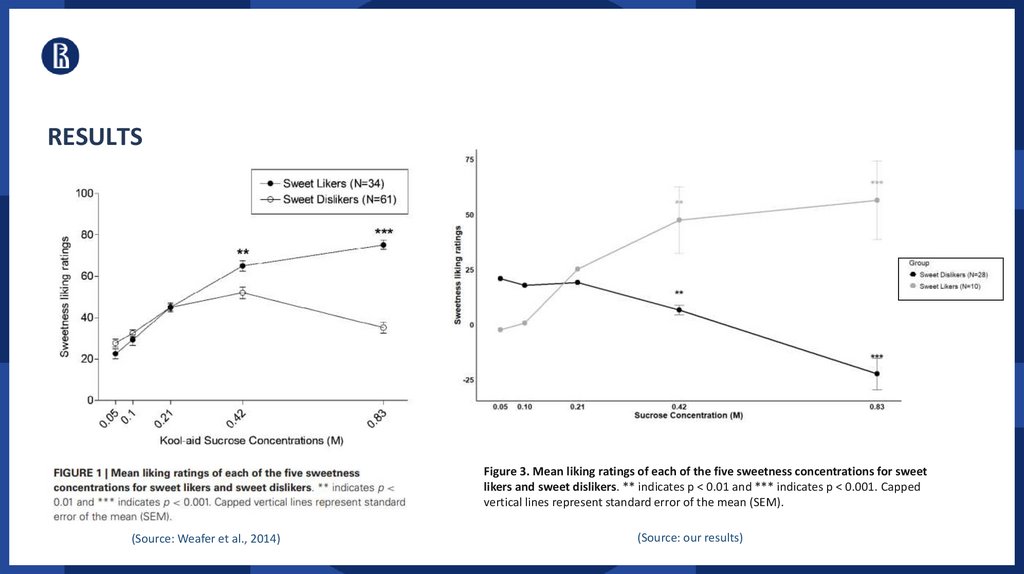
8RESULTS
Figure 3. Mean liking ratings of each of the five sweetness concentrations for sweet
likers and sweet dislikers. ** indicates p < 0.01 and *** indicates p < 0.001. Capped
vertical lines represent standard error of the mean (SEM).
(Source: Weafer et al., 2014)
(Source: our results)
8.
RESULTSComparison of Risky Choices Across Probabilities Between Sweet-Liking Groups
9
9.
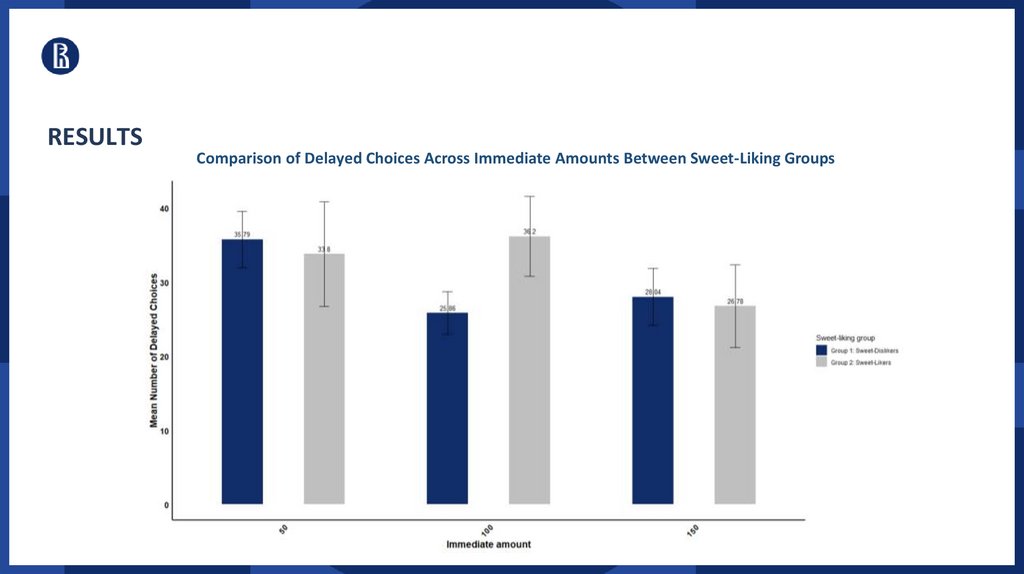
10RESULTS
Comparison of Delayed Choices Across Immediate Amounts Between Sweet-Liking Groups
10.
Comparative Results of Four Regression Models: Delay Discounting TaskссссDependent variable:
RESULTS
Model 1
(1)
Gender
Age
Sweet likers
Delay discounting task (dependent binary
variable – impulsive choice):
1.Sweet likers are significantly more impulsive
rather than sweet-dislikers with an increase in
Delay (Model 2; 3)
Delay (in days)
Delayed reward
Immediate reward
Relation to sweet liking test
1.996
(0.188)
-0.048
(0.765)
1.879
(0.251)
-0.065***
(0.000)
0.0152***
(0.000)
-0.026***
(0.0000)
1.240
(0.385)
Task order
Impulsive choice
Model 2
Model 3
(2)
(3)
2.033
(0.181)
-0.037
(0.818)
2.880
(0.109)
-0.062***
(0.000)
0.015***
(0.000)
-0.026***
(0.000)
-0.932
(0.748)
1.449
(0.407)
-0.019*
(0.018)
0.001
(0.681)
-0.001
(0.857)
1.923
(0.216)
-0.048
(0.771)
2.592
(0.175)
-0.062***
(0.000)
0.015***
(0.000)
-0.026***
(0.000)
-0.825
(0.779)
1.596
(0.374)
-0.035
(0.616)
-0.019*
(0.018)
0.001
(0.684)
-0.001
(0.865)
0.595
(0.895)
1.706
(0.738)
Number of risky choices
2.Sweet likers are NOT significantly more
impulsive rather than sweet-dislikers with an
increase in Delay (Model 4)
3. Delay*Number of risky choices: all the effect of
the relationship between Sweet likers*Delay and
impulsivity can be explained by their riskiness
(Model 4)
Sweet likers*Delay
Sweet likers*Delayed reward
Sweet likers*Immediate reward
Delay* Number of risky choices
Delayed reward*Number of risky choices
Immediate reward*Number of risky choices
Constant
Observations
Log Likelihood
Akaike Inf. Crit.
Bayesian Inf. Crit.
2.397
(0.551)
Model 4
(4)
1.879
(0.236)
-0.049
(0.769)
2.199
(0.259)
-0.094***
(0.000)
0.013***
(0.000)
-0.021**
(0.010)
-0.669
(0.824)
1.532
(0.404)
-0.095
(0.226)
-0.010
(0.228)
0.002
(0.428)
-0.003
(0.539)
0.001**
(0.004)
0.001
(0.458)
-0.001
(0.471)
3.692
(0.482)
4,560
4,560
4,560
4,560
-967.930 -963.614 -963.489 -956.508
1,953.862 1,953.227 1,954.979 1,947.015
2,011.687 2,036.753 2,044.930 2,056.242
11
11.
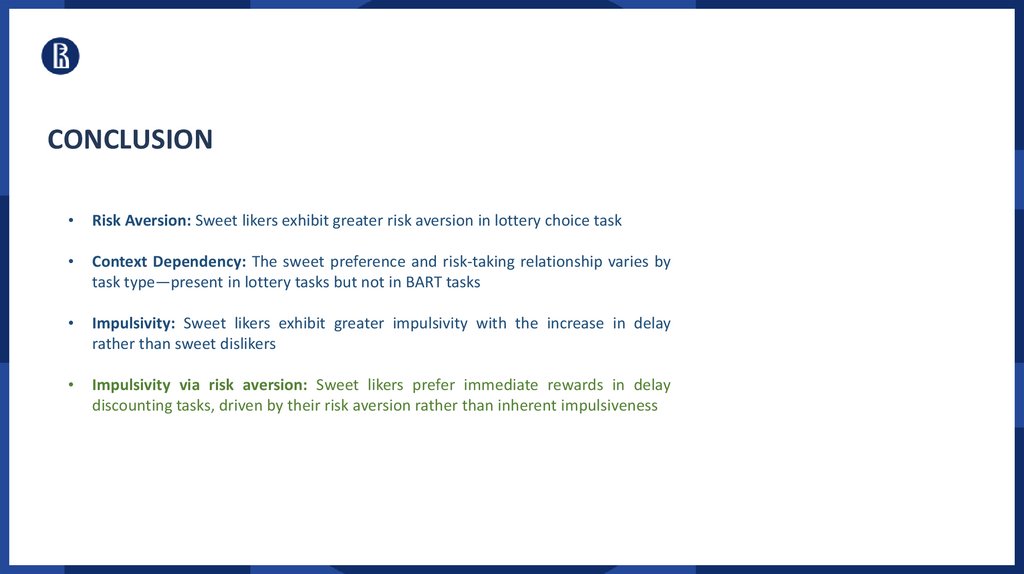
12CONCLUSION
Risk Aversion: Sweet likers exhibit greater risk aversion in lottery choice task
Context Dependency: The sweet preference and risk-taking relationship varies by
task type—present in lottery tasks but not in BART tasks
Impulsivity: Sweet likers exhibit greater impulsivity with the increase in delay
rather than sweet dislikers
Impulsivity via risk aversion: Sweet likers prefer immediate rewards in delay
discounting tasks, driven by their risk aversion rather than inherent impulsiveness