


 Программное обеспечение
Похожие презентации:


Exploring iTrace Prime Software v230907.ppsx
1.
WITHVISUAL FUNCTION MADE
SIMPLE.
INTERACTIVE GUIDEBOOK
F O R i T R A C E 7 “ P R I M E ” S O F T WA R E
VISUAL FUNCTION MADE SIMPLE.
2.
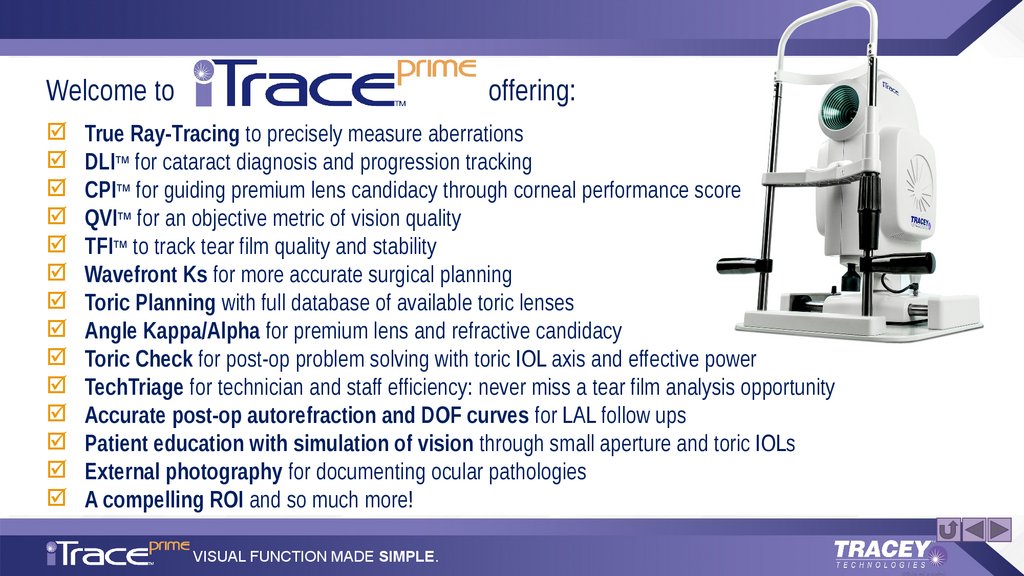
Welcome tooffering:
True Ray-Tracing to precisely measure aberrations
DLITM for cataract diagnosis and progression tracking
CPITM for guiding premium lens candidacy through corneal performance score
QVITM for an objective metric of vision quality
TFITM to track tear film quality and stability
Wavefront Ks for more accurate surgical planning
Toric Planning with full database of available toric lenses
Angle Kappa/Alpha for premium lens and refractive candidacy
Toric Check for post-op problem solving with toric IOL axis and effective power
TechTriage for technician and staff efficiency: never miss a tear film analysis opportunity
Accurate post-op autorefraction and DOF curves for LAL follow ups
Patient education with simulation of vision through small aperture and toric IOLs
External photography for documenting ocular pathologies
A compelling ROI and so much more!
VISUAL FUNCTION MADE SIMPLE.
3.
WITHVISUAL FUNCTION MADE
SIMPLE.
We believe that every cataract and refractive surgeon deserves the very best information
about patient visual function from which to make informed and clinically sound decisions,
which will result in improved outcomes for patients.
Better outcomes will decrease post-op problems that consume energy and chair-time,
and better outcomes will increase referrals to the practice, all leading to more revenue.
And now, with the introduction of iTrace Prime, Visual Function is Made Simple.
Tap
VISUAL FUNCTION MADE SIMPLE.
for key feature information.
4.
NEW comprehensivesurgicalquality
data display
Exam and capture
data introduced with iTrace PRIME. This report provides
exam quality information, new indices that provide DLI-like data for the cornea and total eye,
key indices useful in cataract surgery planning, and similar functionality for simulating the
effect of toric correction and small aperture IOL and pharma treatments.
Corneal Performance is new
metric for MFIOL candidacy
Toric Toggle: Simulates
post-op with/without
sphere/cyl correction
Simulates small
aperture optics
CPI value at worse case, with white bar and arrows showing range of
performance from 4.5mm to 2.5 mm pupil
Displays Snellen E simulation
of best corrected vision from
cornea. Can be adjusted with
buttons to the right to
simulate post-op IOL vision
Displays Snellen E
simulation from
Internal optics, in this
case the impact of
cataract to vision.
DLI score < 5 usually
means actionable cataract
QVI for assessing
overall vision quality
and a new way to
express visual acuity
5.
Prime Dashboard – KEY INDICES PANELWF Ks – most accurate keratometry
using Zernike math and larger zone.
Tracey refraction calculated at the larger of scan
diameter or 4mm. Color coded to signal presence
of certain HOAs and/or day to night shift.
Toggle to display
other Ks
Tracey Refraction are extremely accurate in LAL
treatments.
Used for ASCRS postref IOL power calcs,
same as EyeSys EffRP
Opacity grade > 2.5
usually means significant
opacity.
Consider non-aspheric
lens if CSA < 0.1
Keratoconus screening will color
code yellow/red when criteria met
Angle Alpha (distance from visual axis to
optical center of cornea) – should be
<0.5mm if using MFIOL
TFI will appear if a Tear Film
Exam was performed same day
as CT
6.
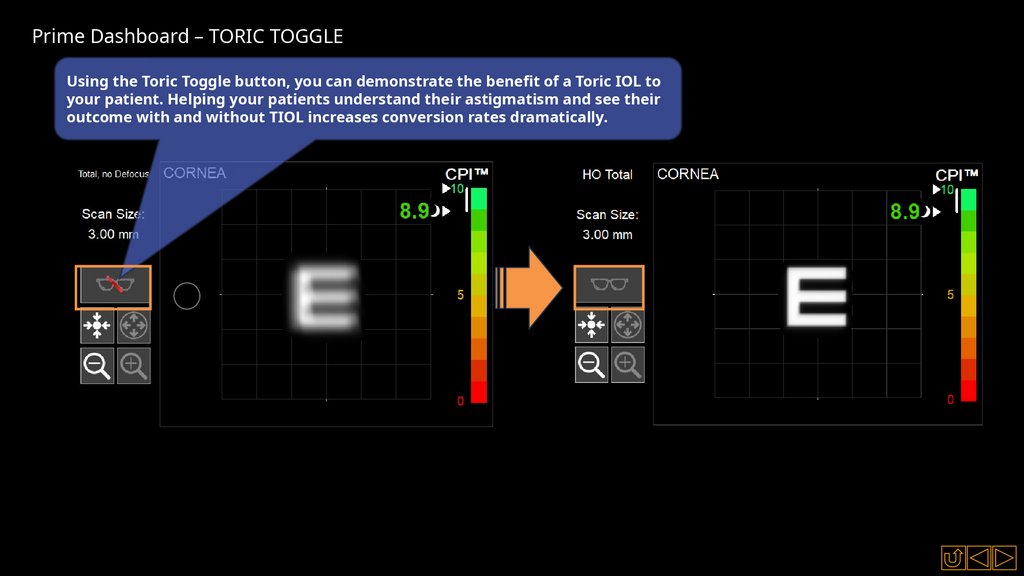
Prime Dashboard – TORIC TOGGLEUsing the Toric Toggle button, you can demonstrate the benefit of a Toric IOL to
your patient. Helping your patients understand their astigmatism and see their
outcome with and without TIOL increases conversion rates dramatically.
7.
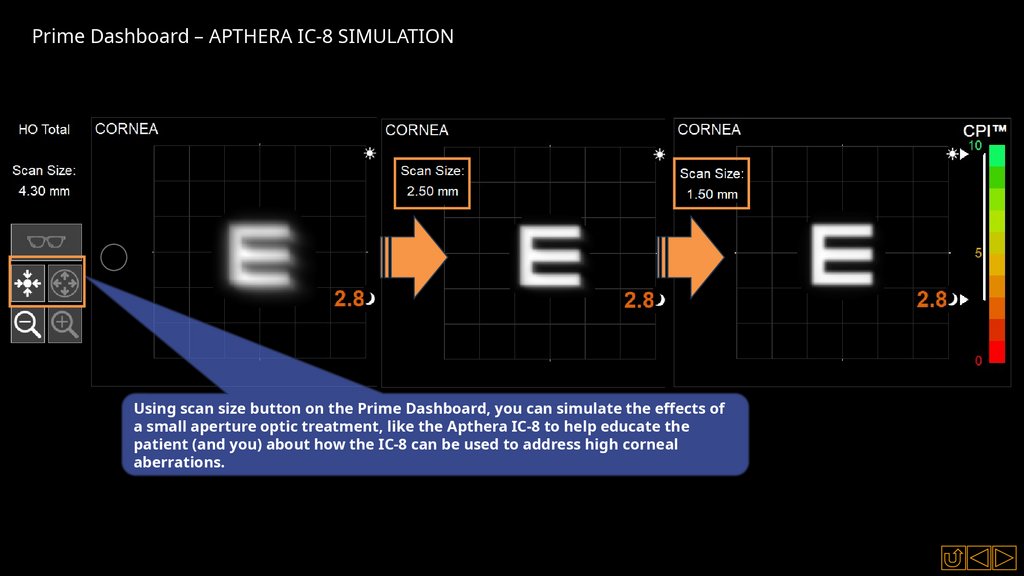
Prime Dashboard – APTHERA IC-8 SIMULATIONUsing scan size button on the Prime Dashboard, you can simulate the effects of
a small aperture optic treatment, like the Apthera IC-8 to help educate the
patient (and you) about how the IC-8 can be used to address high corneal
aberrations.
8.
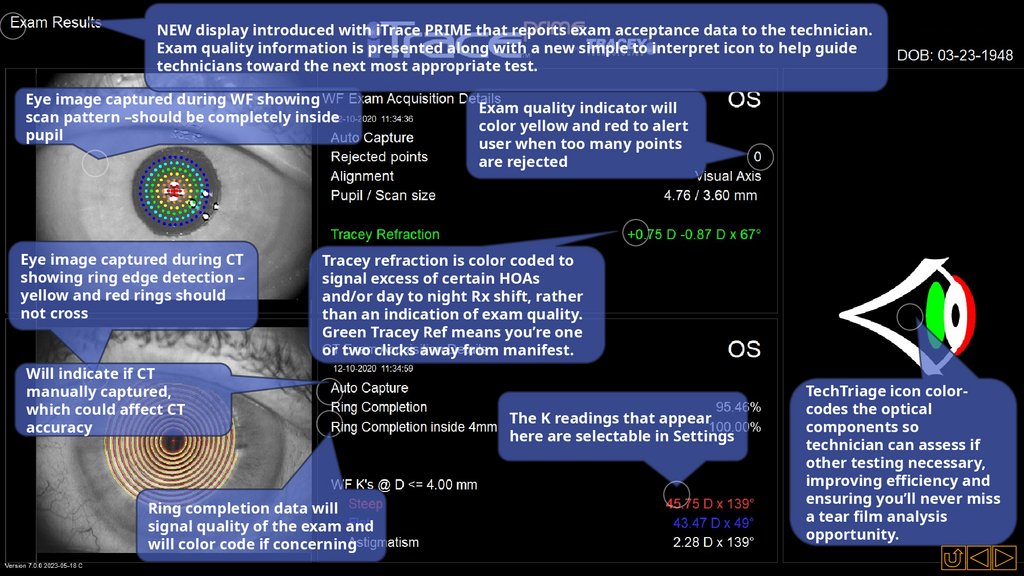
NEW display introduced with iTrace PRIME that reports exam acceptance data to the technician.Exam quality information is presented along with a new simple to interpret icon to help guide
technicians toward the next most appropriate test.
Eye image captured during WF showing
scan pattern –should be completely inside
pupil
Eye image captured during CT
showing ring edge detection –
yellow and red rings should
not cross
Exam quality indicator will
color yellow and red to alert
user when too many points
are rejected
Tracey refraction is color coded to
signal excess of certain HOAs
and/or day to night Rx shift, rather
than an indication of exam quality.
Green Tracey Ref means you’re one
or two clicks away from manifest.
Will indicate if CT
manually captured,
which could affect CT
accuracy
Ring completion data will
signal quality of the exam and
will color code if concerning
The K readings that appear
here are selectable in Settings
TechTriage icon colorcodes the optical
components so
technician can assess if
other testing necessary,
improving efficiency and
ensuring you’ll never miss
a tear film analysis
opportunity.
9.
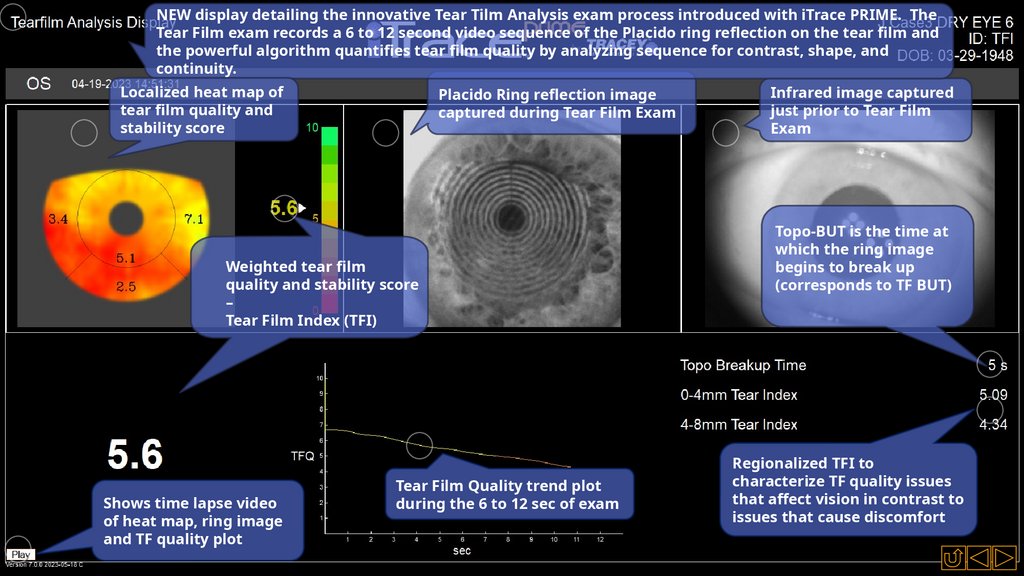
NEW display detailing the innovative Tear Tilm Analysis exam process introduced with iTrace PRIME. TheTear Film exam records a 6 to 12 second video sequence of the Placido ring reflection on the tear film and
the powerful algorithm quantifies tear film quality by analyzing sequence for contrast, shape, and
continuity.
Localized heat map of
tear film quality and
stability score
Placido Ring reflection image
captured during Tear Film Exam
Weighted tear film
quality and stability score
–
Tear Film Index (TFI)
Shows time lapse video
of heat map, ring image
and TF quality plot
Tear Film Quality trend plot
during the 6 to 12 sec of exam
Infrared image captured
just prior to Tear Film
Exam
Topo-BUT is the time at
which the ring image
begins to break up
(corresponds to TF BUT)
Regionalized TFI to
characterize TF quality issues
that affect vision in contrast to
issues that cause discomfort
10.
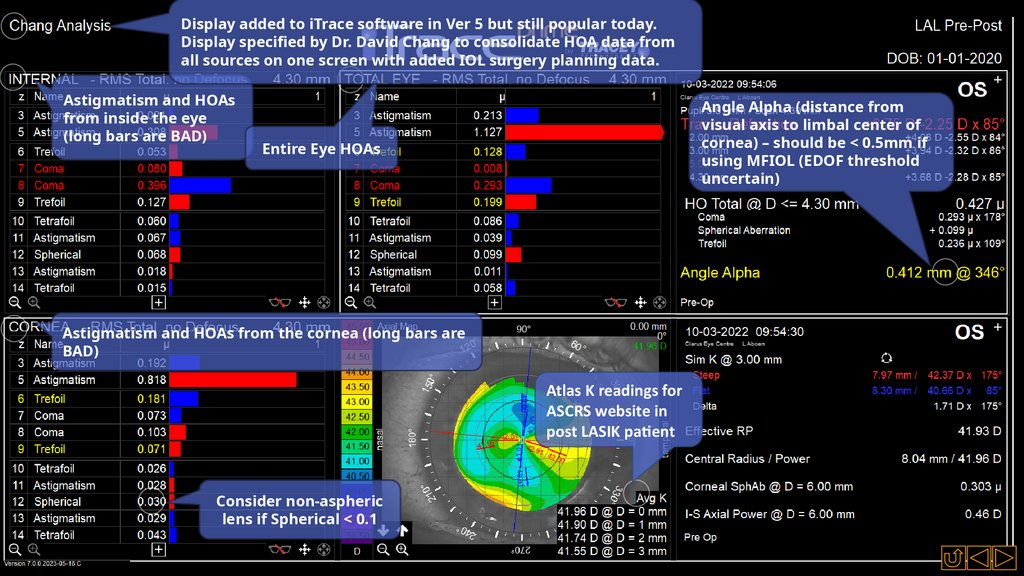
Display added to iTrace software in Ver 5 but still popular today.Display specified by Dr. David Chang to consolidate HOA data from
all sources on one screen with added IOL surgery planning data.
Astigmatism and HOAs
from inside the eye
(long bars are BAD)
Angle Alpha (distance from
visual axis to limbal center of
cornea) – should be < 0.5mm if
using MFIOL (EDOF threshold
uncertain)
Entire Eye HOAs
Astigmatism and HOAs from the cornea (long bars are
BAD)
Atlas K readings for
ASCRS website in
post LASIK patient
Consider non-aspheric
lens if Spherical < 0.1
11.
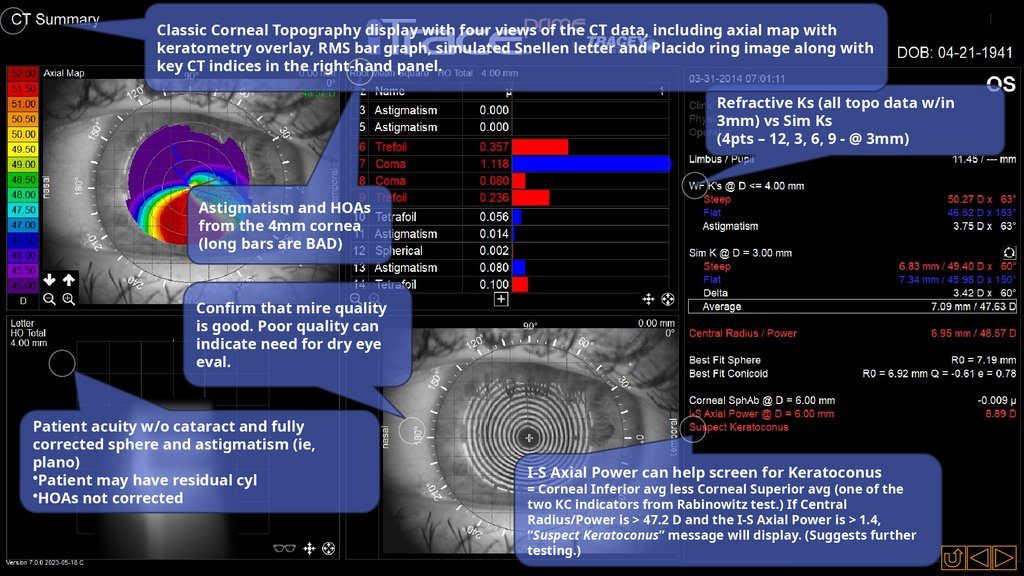
Classic Corneal Topography display with four views of the CT data, including axial map withkeratometry overlay, RMS bar graph, simulated Snellen letter and Placido ring image along with
key CT indices in the right-hand panel.
Refractive Ks (all topo data w/in
3mm) vs Sim Ks
(4pts – 12, 3, 6, 9 - @ 3mm)
Astigmatism and HOAs
from the 4mm cornea
(long bars are BAD)
Confirm that mire quality
is good. Poor quality can
indicate need for dry eye
eval.
Patient acuity w/o cataract and fully
corrected sphere and astigmatism (ie,
plano)
•Patient may have residual cyl
•HOAs not corrected
I-S Axial Power can help screen for Keratoconus
= Corneal Inferior avg less Corneal Superior avg (one of the
two KC indicators from Rabinowitz test.) If Central
Radius/Power is > 47.2 D and the I-S Axial Power is > 1.4,
“Suspect Keratoconus” message will display. (Suggests further
testing.)
12.
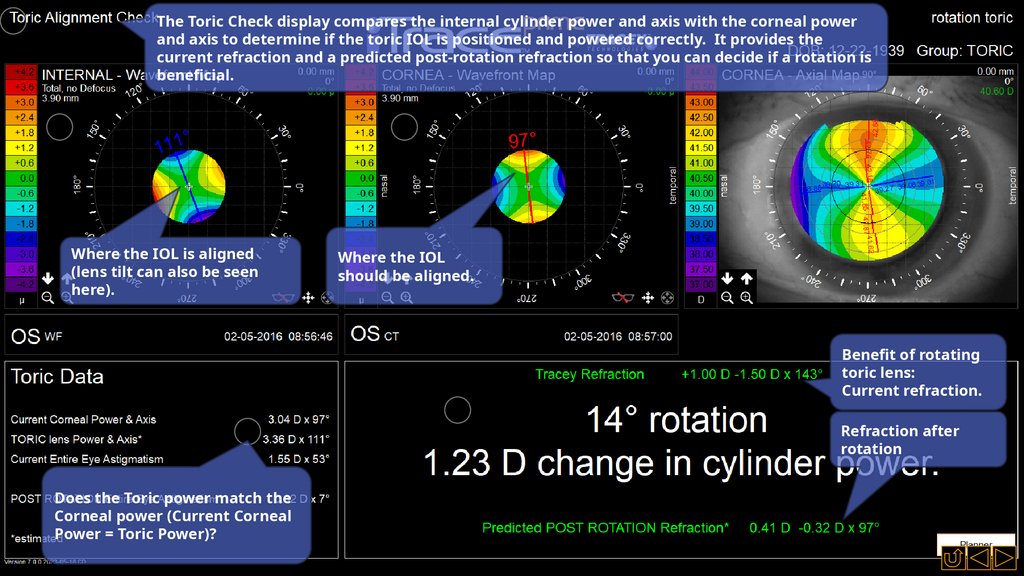
The Toric Check display compares the internal cylinder power and axis with the corneal powerand axis to determine if the toric IOL is positioned and powered correctly. It provides the
current refraction and a predicted post-rotation refraction so that you can decide if a rotation is
beneficial.
Where the IOL is aligned
(lens tilt can also be seen
here).
Where the IOL
should be aligned.
Benefit of rotating
toric lens:
Current refraction.
Refraction after
rotation
Does the Toric power match the
Corneal power (Current Corneal
Power = Toric Power)?
13.
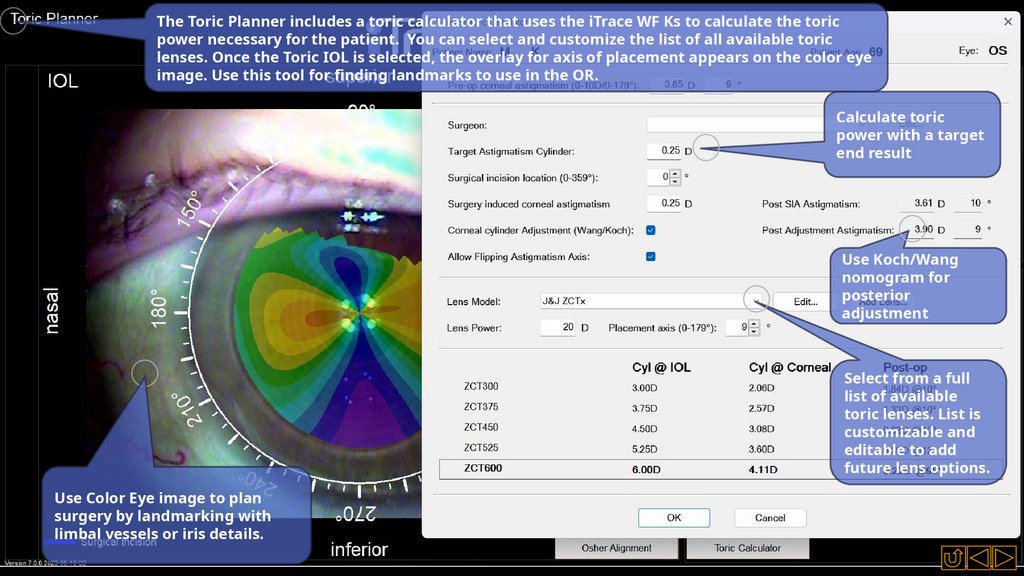
The Toric Planner includes a toric calculator that uses the iTrace WF Ks to calculate the toricpower necessary for the patient. You can select and customize the list of all available toric
lenses. Once the Toric IOL is selected, the overlay for axis of placement appears on the color eye
image. Use this tool for finding landmarks to use in the OR.
Calculate toric
power with a target
end result
Use Koch/Wang
nomogram for
posterior
adjustment
Select from a full
list of available
toric lenses. List is
customizable and
editable to add
future lens options.
Use Color Eye image to plan
surgery by landmarking with
limbal vessels or iris details.
14.
The MTF display provides the Modulation Transfer Functions* of the cornea, internal and totaleye. This display is used by many surgeons to determine if (1) the cornea provides adequate
contrast to support a contrast-stealing multifocal IOL, and (2) the internal (IOL) is providing
adequate contrast.
When measuring a
pseudophakic eye,
the MTF of the
internal optics will
indicate the
contrast capability
of the IOL.
The contrast capability of
the cornea should be
high enough that it will
support the loss of
contrast that will be
caused by a Multifocal
IOL. Don’t use a MFIOL
behind a cornea which
has an MTF curve in the
red danger zone.
*The Modulation Transfer Function
(MTF) describes how well an optical
system can represent the detail
contrast of an object to its image. Y
axis = modulation, X axis = spatial
frequency.
15.
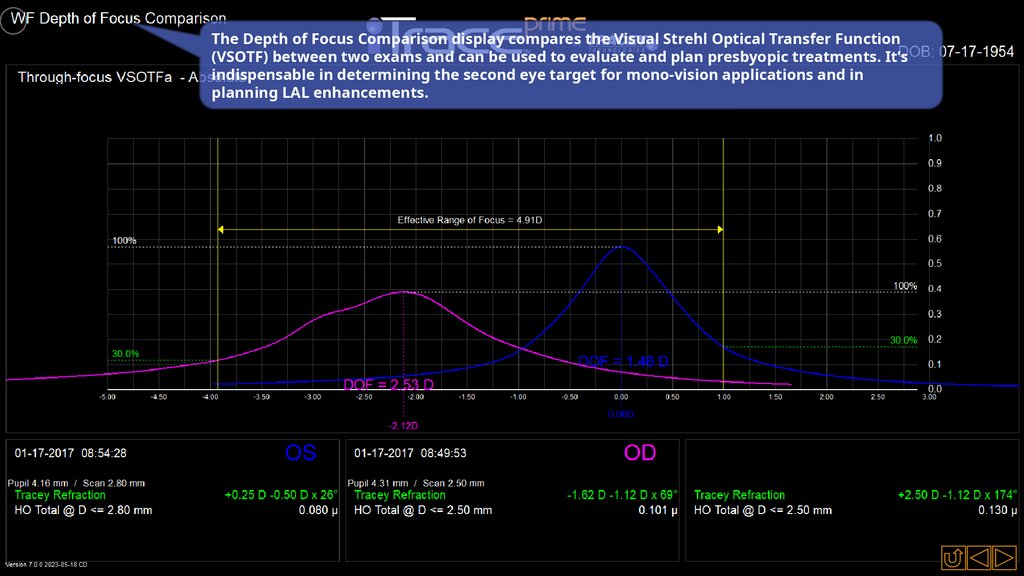
The Depth of Focus Comparison display compares the Visual Strehl Optical Transfer Function(VSOTF) between two exams and can be used to evaluate and plan presbyopic treatments. It’s
indispensable in determining the second eye target for mono-vision applications and in
planning LAL enhancements.
16.
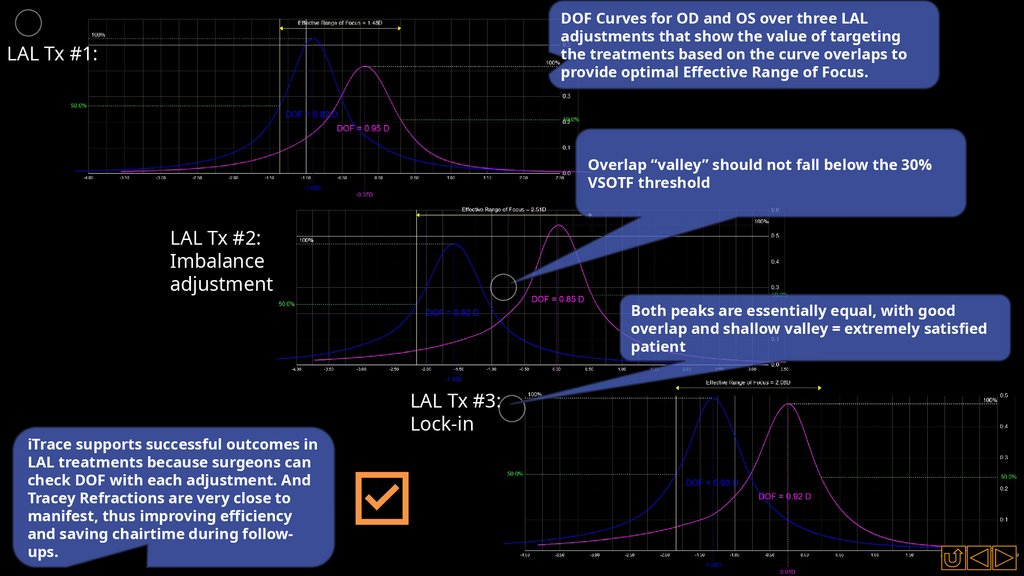
DOF Curves for OD and OS over three LALadjustments that show the value of targeting
the treatments based on the curve overlaps to
provide optimal Effective Range of Focus.
LAL Tx #1:
Overlap “valley” should not fall below the 30%
VSOTF threshold
LAL Tx #2:
Imbalance
adjustment
Both peaks are essentially equal, with good
overlap and shallow valley = extremely satisfied
patient
iTrace supports successful outcomes in
LAL treatments because surgeons can
check DOF with each adjustment. And
Tracey Refractions are very close to
manifest, thus improving efficiency
and saving chairtime during followups.
LAL Tx #3:
Lock-in
17.
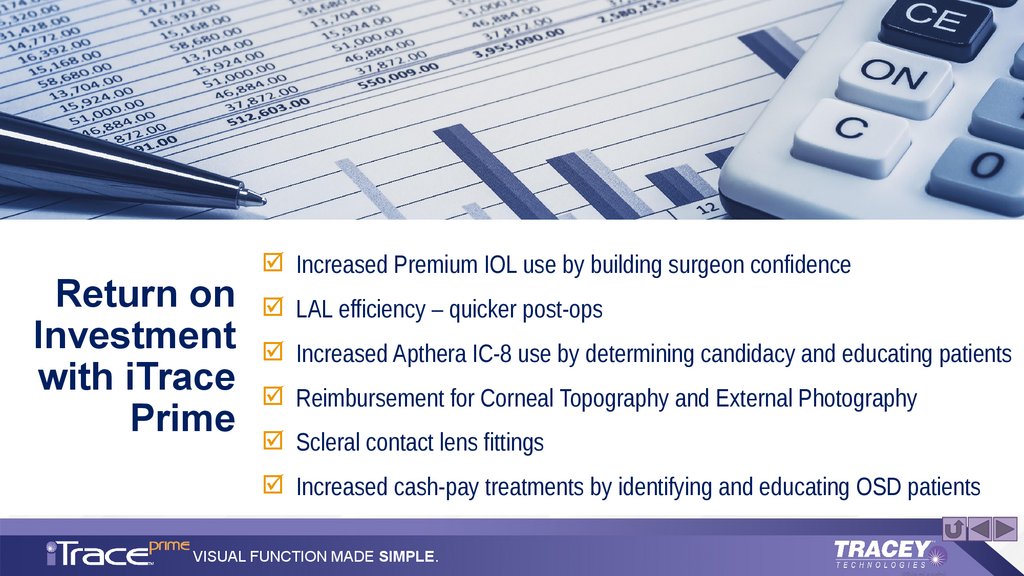
Increased Premium IOL use by building surgeon confidenceReturn on LAL efficiency – quicker post-ops
Investment Increased Apthera IC-8 use by determining candidacy and educating patients
with iTrace Reimbursement for Corneal Topography and External Photography
Prime
Scleral contact lens fittings
Increased cash-pay treatments by identifying and educating OSD patients
VISUAL FUNCTION MADE SIMPLE.
18.
WITHVISUAL FUNCTION MADE
SIMPLE.
NEXT STEP: See the iTrace for yourself.
Schedule a DEMO today.
VISUAL FUNCTION MADE SIMPLE.