





 Химия
ХимияПохожие презентации:




Chemical Kinetics Revision
1. Chemical Kinetics
Sunday, 05 April 2026Chemical Kinetics
REVISION
2. Rate and Collision Theory
Sunday, 05 April 2026Rate and Collision Theory
For a reaction to occur particles must collide
Rate of reaction
The change of
concentration/amount of
a reactant or product per
unit time
Particles move all the time and
collide into each other too. BUT
most collisions don’t lead to a
reaction
REMEMBER THIS!
Rate = Amount of reactant used / product made
Time
Collision Theory
1. For a reaction to
occur the particles
must collide in the
right direction
Collision Theory
2. They must also have a
minimum amount of
kinetic energy
3. Activation Energy
Sunday, 05 April 2026Activation Energy
The minimum amount of energy required for a reaction to occur is called
the activation energy
enthalpy
Molecule bonds stretching as
they have more kinetic energy
reactants
products
At this point
bonds have
sufficient energy
to break
ACTIVATION
ENERGY
Always between
reactants and
top of profile
Reaction progress
An energy profile
diagram can show the
energy changes in a
reaction
Reactions that have a low
activation energy need less
energy to break the bonds
(normally heat energy) and
vice versa.
4. Maxwell-Boltzmann Distribution
Sunday, 05 April 2026Maxwell-Boltzmann Distribution
Maxwell-Boltzmann distribution shows the energy in gas particles
Number of molecules
The most likely energy
of a particle in a sample
The mean energy
the particles have
Most particles
move with
moderate speeds
If we plot this on a graph we get a
Maxwell-Boltzmann distribution.
Activation Energy
Particles with
energy greater
than the activation
energy can react
Kinetic Energy
These particles have very little energy and move slowly
Particles of gas in a sample move at
different speeds. Some move slowly,
some move quickly.
They have different amounts of kinetic
energy
Graph starts at 0,0 as no particles have
zero kinetic energy
The area under the curve is equal to the
total number of molecules
5. What affects rate?
Sunday, 05 April 2026What affects rate?
Number of molecules
Temperature affects the rate of reaction
1. Curve sifts the RIGHT
2. Peak is LOWER
3. Area under curve is the SAME
4. Area under curve beyond
activation energy INCREASES
Particles have on average more kinetic
energy when they are heated
1. Curve sifts the LEFT
2. Peak is HIGHER
3. Area under curve is the SAME
4. Area under curve beyond
activation energy DECREASES
Kinetic Energy
Activation
Energy
A larger proportion of the molecules
will have energy greater than the
activation energy. This is the RED line.
Larger area under the curve beyond the
activation energy
When we decrease temperature a
smaller proportion of the molecules
will have energy greater than the
activation energy. This is the BLUE line.
Smaller area under the curve beyond
the activation energy
6. What affects rate?
Sunday, 05 April 2026What affects rate?
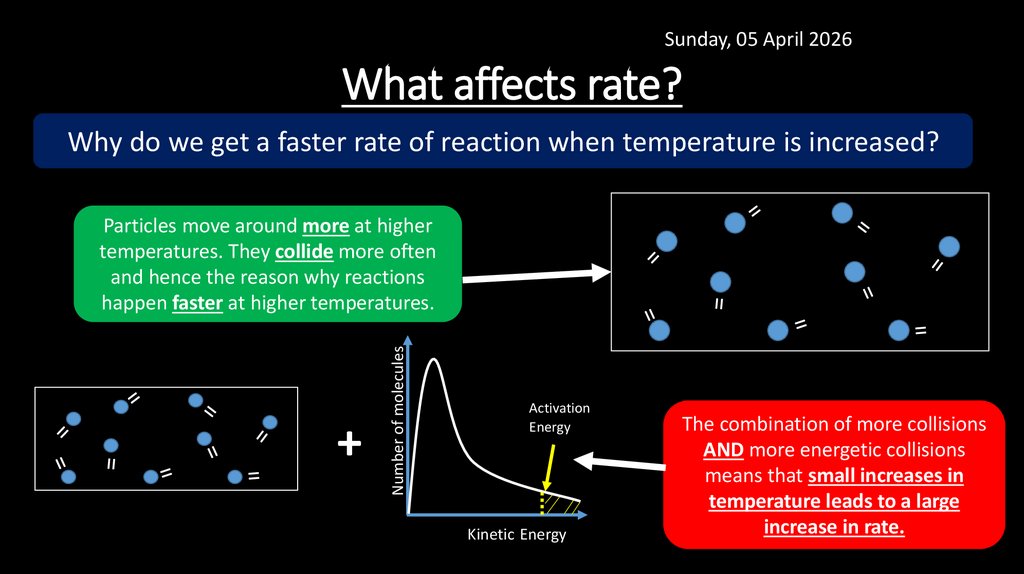
Why do we get a faster rate of reaction when temperature is increased?
+
Number of molecules
Particles move around more at higher
temperatures. They collide more often
and hence the reason why reactions
happen faster at higher temperatures.
Activation
Energy
Kinetic Energy
The combination of more collisions
AND more energetic collisions
means that small increases in
temperature leads to a large
increase in rate.
7. What affects rate?
Sunday, 05 April 2026What affects rate?
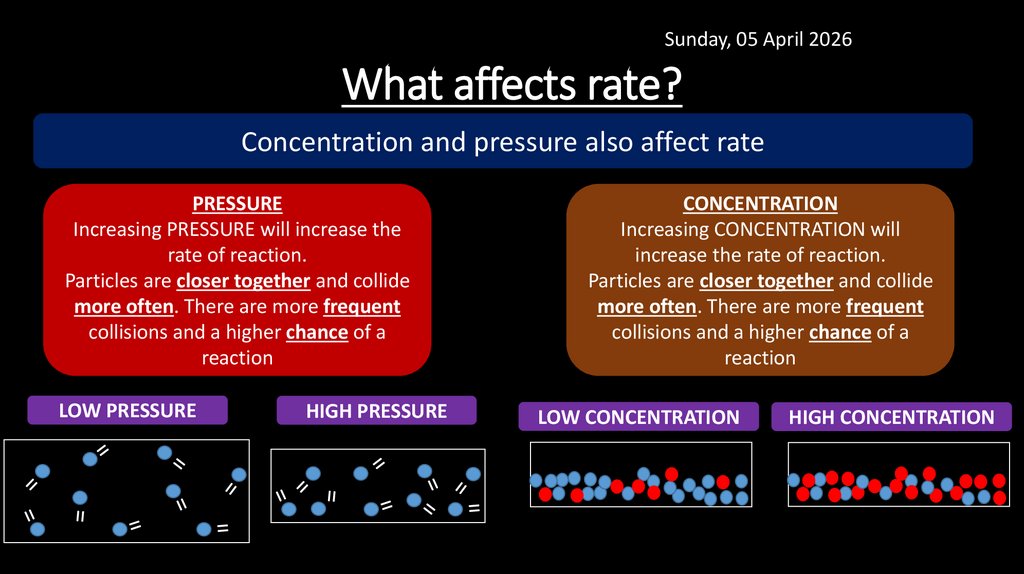
Concentration and pressure also affect rate
PRESSURE
Increasing PRESSURE will increase the
rate of reaction.
Particles are closer together and collide
more often. There are more frequent
collisions and a higher chance of a
reaction
LOW PRESSURE
HIGH PRESSURE
CONCENTRATION
Increasing CONCENTRATION will
increase the rate of reaction.
Particles are closer together and collide
more often. There are more frequent
collisions and a higher chance of a
reaction
LOW CONCENTRATION
HIGH CONCENTRATION
8. What affects rate?
Sunday, 05 April 2026What affects rate?
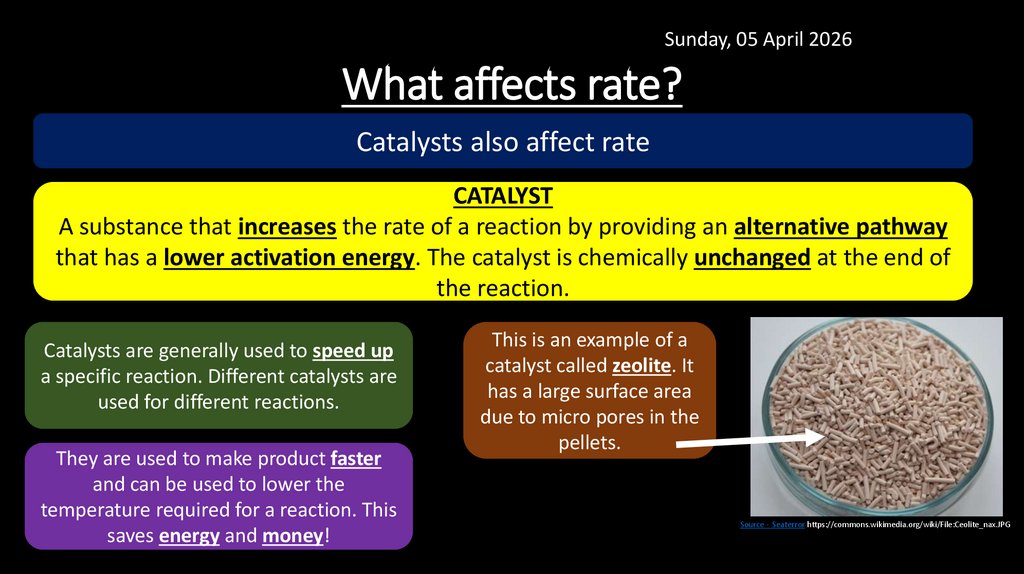
Catalysts also affect rate
CATALYST
A substance that increases the rate of a reaction by providing an alternative pathway
that has a lower activation energy. The catalyst is chemically unchanged at the end of
the reaction.
Catalysts are generally used to speed up
a specific reaction. Different catalysts are
used for different reactions.
They are used to make product faster
and can be used to lower the
temperature required for a reaction. This
saves energy and money!
This is an example of a
catalyst called zeolite. It
has a large surface area
due to micro pores in the
pellets.
Source - Seaterror https://commons.wikimedia.org/wiki/File:Ceolite_nax.JPG
9. How catalysts affect rate
Sunday, 05 April 2026How catalysts affect rate
Energy profile diagram
Activation Energy
with no catalyst
The catalyst lowers the activation
energy so more particles now
have enough energy to react.
Activation
Energy with
catalyst
Activation
Energy with
no catalyst
Kinetic Energy
enthalpy
Number of molecules
Maxwell-Boltzmann distribution
reactants
products
Activation
Energy with
catalyst
Reaction progress
10. Calculating rate from a graph
Sunday, 05 April 2026Calculating rate from a graph
Volume of gas produced (cm3)
Rate can be found from the gradient
5
The bigger the section of graph you use to
work out the gradient the better!
Try and find points on the graph where the
change in y and x can be worked out easily.
X
4
X
3
2
4.0
X
1
6.0
X
0
0
2
4
Time (mins)
6
Gradient = change in y
change in x
8
Gradient = (4.6 - 0.6)
(7.0 – 1.0)
Gradient = 0.67 cm3 min-1
11. Calculating rate from a graph
Sunday, 05 April 2026Calculating rate from a graph
Rate can be found from the gradient of a tangent on a curved line of best fit
In this example we are working out
the rate of reaction at 3 minutes.
22.0
Mass of reaction vessel (g)
1. With curves you just draw a tangent (a diagonal line
that meets the curve at a specific point).
2. Extend the line right across the graph and work out
the gradient as mentioned in the previous slide.
3. The gradient is the rate at the specific point on the
curve
X
21.5
Tangent
21.0
20.5 0.8
20.0
4.0
0
Gradient = change in y
change in x
X
2
X
4
Time (mins)
X
6
8
Gradient = (20.8 - 20.0)
(4.0 – 0.0)
Gradient = 0.20 g min-1
12. The Rate Equation and Orders
Sunday, 05 April 2026The Rate Equation and Orders
The rate equation links rate with concentrations of substances
Rate / moldm-3s-1
Rate = k[A]a[B]b
Rate constant / units vary
Orders of reaction
An order is the power to which a
concentration is raised to in the rate equation.
It tells us how the concentration of the
substance affects the rate.
1st order
Changes in concentration has a
proportional change on rate.
e.g. if [A] doubles then rate doubles
Orders of the reaction
Concentration of
substance – e.g.
in the following
equation –
A+B C+D
Zero order
Changes in concentration has no effect on
rate.
e.g. if [A] doubles then rate doesn’t change
2nd order
Changes in concentration has a squared
proportional change on rate.
e.g. if [A] doubles then rate quadruples
Orders can
only be
determined by
experiment!
You can’t work
them out by
looking at an
equation.
13. The Rate Equation and Rate Constant
Sunday, 05 April 2026The Rate Equation and Rate Constant
The rate equation links rate with concentrations of substances
Rate constant - k
A constant is a number that allows us to
equate rate and concentration.
The rate constant is only fixed at a
particular temperature. If the temperature
changes so does the rate constant. (‘k’
increases when temperature increases)
The explanation part!
As we increase the temperature the
particles have more kinetic energy and
they collide more often. This increases
the rate.
To make this equation balance then the
value of k must increase.
Rate = k [A]a[B]b
But the concentrations of the
substances remain constant.
14. Calculating Rate
Sunday, 05 April 2026Calculating Rate
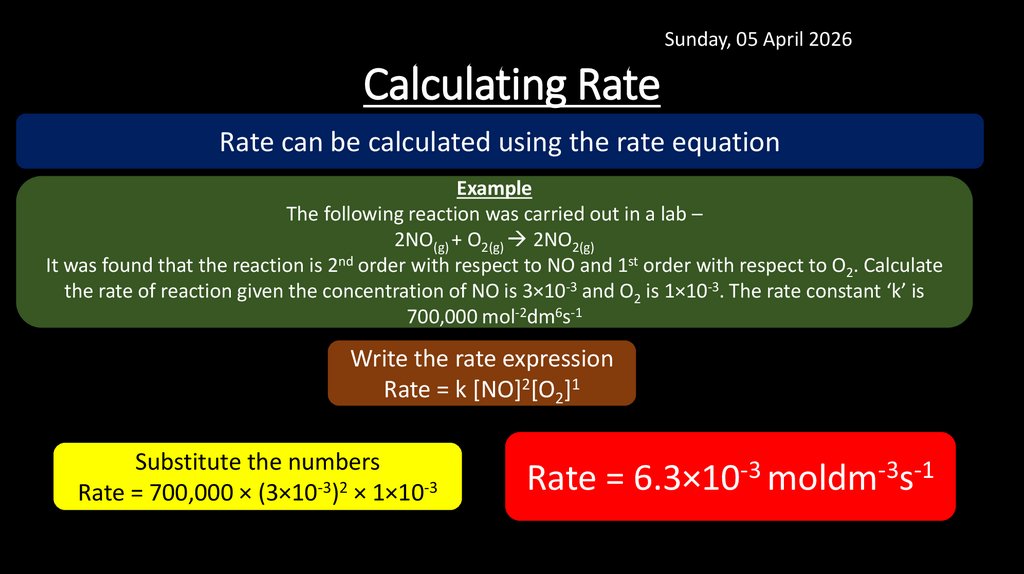
Rate can be calculated using the rate equation
Example
The following reaction was carried out in a lab –
2NO(g) + O2(g) 2NO2(g)
It was found that the reaction is 2nd order with respect to NO and 1st order with respect to O2. Calculate
the rate of reaction given the concentration of NO is 3×10⁻³ and O2 is 1×10⁻³. The rate constant ‘k’ is
700,000 mol-2dm6s-1
Write the rate expression
Rate = k [NO]2[O2]1
Substitute the numbers
Rate = 700,000 × (3×10-3)2 × 1×10-3
Rate = 6.3×10⁻³ moldm-3s-1
15. Calculating Rate Constant
Sunday, 05 April 2026Calculating Rate Constant
Rate constant can be calculated using the rate equation too
Example
The following reaction was carried out in a lab –
NO(g) + CO(g) + O2(g) NO2(g) + CO2(g)
Calculate the rate constant for this reaction given that the order with respect to NO is SECOND order and
ZERO order with respect to CO and O2. The concentration of all reactants is the same – 1.5×10⁻³ moldm-3
and the rate of reaction is 1.17×10⁻³ moldm-3s-1.
Write the rate expression
Rate = k [NO]2
Rearrange to make k the subject
k = Rate / [NO]2
Substitute the numbers
k = 1.17×10⁻³ / (1.5×10⁻³)2
k = 520 mol-1dm3s-1
Work out the units (just
substitute into the rate
equation)
moldm-3s-1
moldm-3 moldm-3
16. Calculating initial rate from a graph
Sunday, 05 April 2026Calculating initial rate from a graph
Initial rate can be found too using the gradient of a tangent
The initial rate is the rate right at the start of
the reaction.
Just like the slides before – we take the
gradient of the tangent but with initial rate we
take it at 0 minutes.
Tangent at 0 minutes
Mass of reaction vessel (g)
22.0
X
21.5
Tangent
21.0
20.5
1.7
20.0
X
1.0
0
Gradient = change in y
change in x
X
2
4
Time (mins)
X
6
8
Gradient = (21.7 - 20.0)
(1.0 – 0.0)
Gradient = 1.70 g min-1
17. The Initial Rates Method
Sunday, 05 April 2026The Initial Rates Method
Initial rates is a great way of working out the rate equation for a reaction
Let’s say we want to work out the rate
equation for A + B + C D + E
(Remember we can only work out the rate
equation by conducting an experiment!)
1. Repeat the experiment several times
but changing the concentrations of A,B &
C one at a time in each experiment. (You
want to find out the effects of changing
concentration of each one on the rate).
2. We need to work out the initial
3. We record the concentrations of
rate for each experiment. We
reactants used for each experiment AND
calculate this using the graph shown
before.
See the next slide their initial rates in a table. From this we
to see how this can work out the orders with respect to
each reactant and write a rate equation.
can be done.
18. The Initial Rates Method
Sunday, 05 April 2026The Initial Rates Method
Initial rates is a great way of working out the rate equation for a reaction
Here is experimental data for the following reaction –
2NO(g) + Cl2(g) 2NOCl(g)
Give the rate equation and calculate initial rate for
experiment 4.
Experiment Initial [NO] /moldm-3
First work out order with respect to NO. Ideally
we need to compare experiments where [NO] is
changing and [Cl2] is constant.
Initial [Cl2] /moldm-3
Initial rate / moldm-3s-1
1
0.20
0.10
0.63
2
0.20
0.30
1.92
3
0.80
0.10
2.58
4
0.50
0.50
?
Second work out order with respect
to Cl2. Ideally we need to compare
experiments where [Cl2] is changing
and [NO] is constant.
Experiment 1&2
[Cl2] has trebled (×3) The initial rate
has trebled too.
The order with respect to Cl2 is 1st order
Experiment 1&3
[NO] has quadrupled (×4) The
initial rate has quadrupled too.
The order with respect to NO is 1st
order
The rate equation is –
Rate = k [NO][Cl2]
19. The Initial Rates Method
Sunday, 05 April 2026The Initial Rates Method
We can use the rate equation to calculate missing data in the table
Here is experimental data for the following reaction –
2NO(g) + Cl2(g) 2NOCl(g)
Give the rate equation and calculate initial rate for
experiment 4.
Experiment Initial [NO] /moldm-3
REMEMBER
The rate equation is –
Rate = k [NO][Cl2]
Initial [Cl2] /moldm-3
Initial rate / moldm-3s-1
1
0.20
0.10
0.63
2
0.20
0.30
1.92
3
0.80
0.10
2.58
4
0.50
0.50
?
Second use the rate equation
and the value of k to calculate
the rate in experiment 4.
Rate = k [NO][Cl2]
Rate = 31.5 × 0.50 × 0.50
Rate = 7.88 moldm-3s-1
First, we need to
calculate k. Just pick
any experiment with
all the data complete.
(k is the same value for
all experiments in this
table)
Using experiment 1 data
Rate = k [NO][Cl2]
k = Rate / [NO][Cl2]
k = 0.63 / (0.20 × 0.10)
k = 31.5 mol-1dm3s-1
20. The Initial Rates Method – Difficult One!
Sunday, 05 April 2026The Initial Rates Method – Difficult One!
Sometimes the rate tables don’t have a substance where the concentration
remains constant.
A reaction occurs between A + B and the experiment was
repeated 3 times varying the concentrations of A & B.
Give the rate equation for this reaction using the data
below.
Experiment Initial [A]
/moldm-3
Initial [B]
/moldm-3
Initial rate
/moldm-3s-1
First work out order with respect to A. Ideally we
need to compare experiments where [A] is
changing and [B] is constant.
The rate due to
change [A] only
1
0.15
0.24
0.42×10⁻³
2
0.45
0.24
3.78×10⁻³
3
0.90
0.12
7.56×10⁻³ HALF 15.1×10⁻³
Experiment 1&2
[A] has trebled (×3) The initial rate
has increased ×9.
The order with respect to A is 2nd order
Second work out order with respect to B. This
is tricky as [A] changes in each experiment.
Finally there is a difference in the
rates so B must have an effect on
rate. You can see it is about half. This
caused by halving [B] so we say it is
1st order with respect to B.
Add another column at the end showing what the rate would be if we only
changed A. Looking at Ex. 2&3 we see [A] doubles so rate must quadruple as we
C Harris - Allery Chemistry
know it is 2nd order with respect to A. This gives us a rate
of 15.1×10⁻³moldm-3s-1
The rate equation is –
Rate = k [A]2[B]
21. Rate Graphs
Sunday, 05 April 2026Rate Graphs
[A]
Rate
Rate-concentration graphs can help us identify the order
0
[A]
[A]
Rate
Time
1st
[A]
[A]
Rate
Time
Time
2nd
[A]
A rate-concentration graph
is created by knowing the
rate. The rate is found by
taking the gradient at
various points on a
concentration-time graph.
Don't get them mixed up!
The rate on a steep curve graph
changes in unequal amounts.
The rate-concentration graph
shows a curved line. Changing
concentration changes the rate
squared. This is SECOND ORDER.
The rate on a straight line
graph is constant. The rateconcentration graph shows a
horizontal line. Changing
concentration doesn’t change
the rate. This is ZERO ORDER.
The rate on a shallow curve graph
changes in equal amounts. The
rate-concentration graph shows a
straight diagonal line. Changing
concentration changes the rate
equally. This is FIRST ORDER.