





 Бизнес
Похожие презентации:










Customer Churn Analysis and Prediction (Business Analytics Presentation)
1.
Business A n alytics P resentationCustomer Churn Analysis
and Prediction
Understanding, Analyzing, and Preventing Customer Attrition in Small Business
Prepared by: Zeynalov Z.,
Badasyan V., BAIP students 2-1
2.
P resentation Ov erviewWhat We'll Cover Today
01
What is Customer Churn?
02
Understanding churn types, calculation
methods, and key definitions
04
07
Reasons Customers Leave
05
Why Churn Matters
03
Industry Benchmarks
Business impact, cost analysis, and
Key statistics and churn rates across
importance for small businesses
different industries
Analysis Methods
06
Prediction Techniques
Top churn drivers and root cause
Cohort, RFM, predictive analytics, and
Machine learning approaches and key
analysis
qualitative research
predictive features
Retention Strategies
08
Success Stories
09
Key Takeaways
Actionable tactics to reduce churn and
Real-world case studies of effective
Summary of main points and actionable
improve loyalty
churn reduction
insights
3.
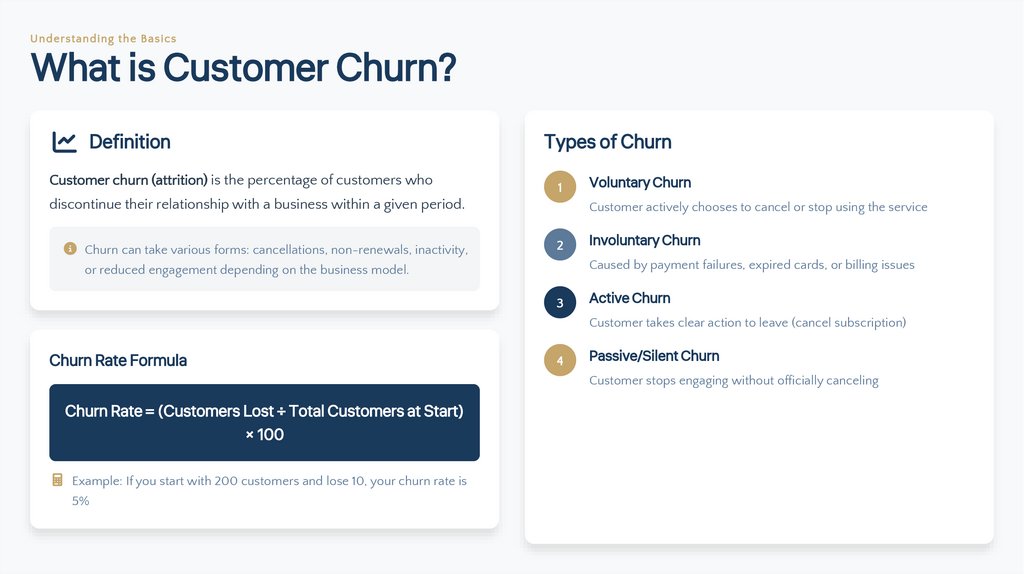
Understanding t h e BasicsWhat is Customer Churn?
Definition
Customer churn (attrition) is the percentage of customers who
Types of Churn
1
discontinue their relationship with a business within a given period.
Churn can take various forms: cancellations, non-renewals, inactivity,
Voluntary Churn
Customer actively chooses to cancel or stop using the service
2
Involuntary Churn
Caused by payment failures, expired cards, or billing issues
or reduced engagement depending on the business model.
3
Active Churn
Customer takes clear action to leave (cancel subscription)
Churn Rate Formula
4
Passive/Silent Churn
Customer stops engaging without officially canceling
Churn Rate = (Customers Lost ÷ Total Customers at Start)
× 100
Example: If you start with 200 customers and lose 10, your churn rate is
5%
4.
Business I mpactWhy Churn Matters for Small Business
65%
Revenue from Repeat Customers
The Cost of Churn
of company revenue comes from existing customers
Small businesses depend heavily on loyal customers who provide steady, predictable
US Annual Churn Cost
$136B
income and are more receptive to additional purchases.
5-7×
Cost of Acquisition vs. Retention
Companies Focus on Acquisition
44%
Customers Leave Due to No Engagement
25%
more expensive to acquire new customers
Acquiring a new customer costs significantly more than retaining an existing one. For
small businesses with limited marketing budgets, this difference is critical.
Small businesses lose 10-25% of their customer base annually. For
a business with thin margins, this can mean the difference
between profit and loss.
2595%
Profit Impact of Retention
profit increase from 5% better retention
A mere 5% increase in customer retention can boost profits by 25% to 95%, making
retention one of the highest-ROI activities for small businesses.
5.
Data-Driven I n sightsKey Statistics & Industry Benchmarks
Churn Rates by Business Segment (SaaS)
Churn Rates by Industry (Annual)
Key Benchmarks Summary
3.27%
2.41%
0.86%
<5%
Overall Average
Voluntary Churn
Involuntary Churn
Healthy Target
Monthly
Customer Choice
Payment Issues
Monthly Rate
6.
Ro ot C ause A n alysisMain Reasons Customers Leave
1
Poor Onboarding Experience
4
The first 30 days determine whether a customer stays or goes. When new clients don't
Price is rarely the real issue – it's perceived value
quickly understand how to extract value, they disengage.
relative to cost. 71% of customers cite price increases
as the #1 reason for leaving.
40-60% higher attrition without proper onboarding
2
Price Sensitivity
Lack of Ongoing Value Demonstration
Customers drift away gradually as they stop seeing value. Businesses must treat
relationships as ongoing partnerships, not transactions.
5
Poor Customer Service
When customers can't reach you or wait days for
responses, they look elsewhere. Communication gaps
create anxiety and drive churn.
Show ROI clearly; communicate results, don't just deliver them
3
Service Quality Issues
Small failures compound over time – delayed responses, missed deadlines, product
defects. Customers compare you constantly to competitors.
Additional Factors
Lack of personalization (25% leave due to no engagement)
Competitor offers and market pressure
Product not scaling with customer growth
58% of customers won't return after a negative experience
External life or business changes
7.
A n alytical A pproachesChurn Analysis Methods
Cohort Analysis
RFM Analysis
Groups customers by signup date or first purchase and tracks their behavior over
Scores customers on three dimensions: Recency (when they last purchased),
time. Shows whether customers acquired in January retain better than those in
Frequency (how often), and Monetary value (how much they spend).
June.
Best for: Identifying high-risk valuable customers, segmenting for targeted
Best for: Spotting retention trends, measuring impact of product changes,
campaigns
comparing acquisition channels
Data needed: Purchase history, dates, amounts
Data needed: Sign-up dates, activity logs
Predictive Analytics
Qualitative Research
Uses historical behavior and machine learning to forecast churn before it
Exit surveys and customer interviews reveal the "why" behind the numbers.
happens. Identifies at-risk customers 30-60 days in advance.
Captures direct feedback about satisfaction and experience.
Best for: Scaling proactive outreach, prioritizing retention efforts, automating
Best for: Understanding root causes, validating churn signals, improving
risk scoring
customer experience
Data needed: Large behavioral datasets, CRM data
Data needed: Surveys, interviews, feedback forms
8.
Machine L earning A pproachesChurn Prediction Techniques
Key Predictive Features
Tenure
Common Algorithms
Monthly Charges
How long the customer has been with
Price point and payment history.
you. New customers churn at higher
Higher charges may increase price
rates.
sensitivity.
Random Forest
Ensemble method that builds multiple decision trees. Excellent
accuracy and handles non-linear relationships well.
XGBoost
Gradient boosting algorithm. Often achieves 79% accuracy with AUC
Contract Type
Month-to-month vs. annual contracts.
Longer contracts reduce churn risk.
Engagement Metrics
Login frequency, feature usage,
support tickets. Declining engagement
signals risk.
of 0.83 in churn prediction tasks.
Logistic Regression
Simple and interpretable baseline model. Good for understanding
feature importance.
Support Vector Machines
Effective for high-dimensional data. Works well with smaller
Implementation Process
1
2
datasets.
Data Collection
Gather historical customer data from CRM, billing, and usage logs
Model Performance
Feature Engineering
Accuracy
Create meaningful variables from raw data (recency, frequency, etc.)
79%
9.
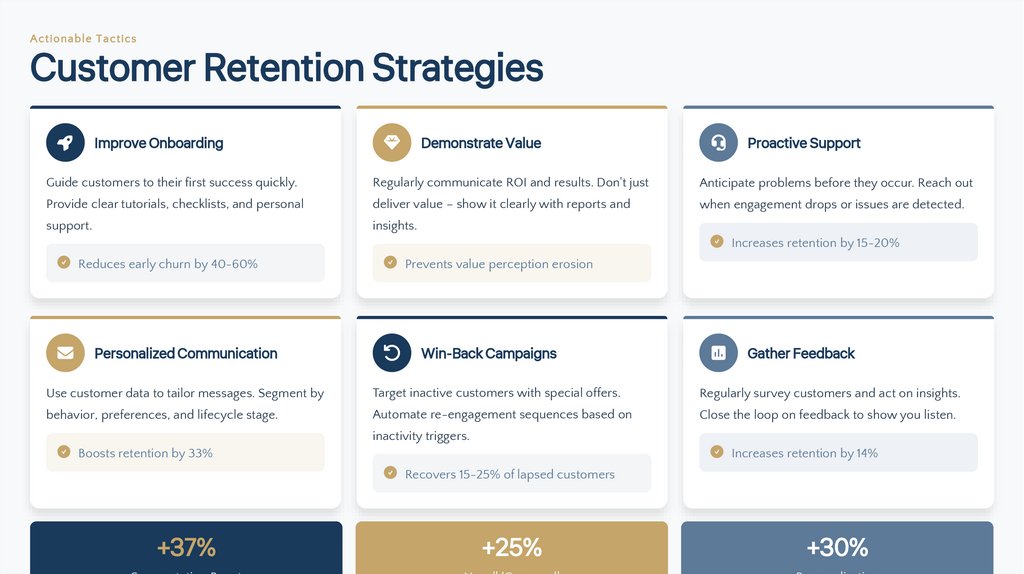
A ctionable TacticsCustomer Retention Strategies
Improve Onboarding
Demonstrate Value
Proactive Support
Guide customers to their first success quickly.
Regularly communicate ROI and results. Don't just
Anticipate problems before they occur. Reach out
Provide clear tutorials, checklists, and personal
deliver value – show it clearly with reports and
when engagement drops or issues are detected.
support.
insights.
Increases retention by 15-20%
Reduces early churn by 40-60%
Prevents value perception erosion
Personalized Communication
Win-Back Campaigns
Gather Feedback
Use customer data to tailor messages. Segment by
Target inactive customers with special offers.
Regularly survey customers and act on insights.
behavior, preferences, and lifecycle stage.
Automate re-engagement sequences based on
Close the loop on feedback to show you listen.
inactivity triggers.
Boosts retention by 33%
Increases retention by 14%
Recovers 15-25% of lapsed customers
+37%
+25%
+30%
10.
C ase St udiesReal-World Success Stories
SF
Sweet Fish Media
B2B Podcasting Agency
The company discovered they were losing 15% of recurring revenue monthly to churn. They implemented quarterly podcast reviews and proactive customer
success outreach.
IC
15% → 3%
<12 months
Monthly Churn Rate
Time to Achieve
ICON
Outsourcing Solutions Provider
ZI
ZoomInfo
SaaS Data Platform
Achieved 100% survey response rate through systematic closed-loop
Built education and training aligned with customer lifecycle.
feedback process and customer-centric action plans.
Introduced second round of training at 90-day mark when
98.8%
Customer Retention Rate
engagement typically drops.
98.5%
Customer Retention Rate
Common Success Factors
11.
Su mmaryKey Takeaways
1
Churn is Critical for Success
Retention > Acquisition
Customer churn is a key metric that directly impacts revenue and growth. Small
businesses lose 10-25% of customers annually, making churn management essential for
survival.
5-7× cheaper to retain than acquire
65% of revenue from repeat customers
5% retention increase = 25-95% profit boost
2
Understand Why Customers Leave
Existing customers spend more over time
Poor onboarding, lack of value demonstration, service quality issues, and price
sensitivity are top churn drivers. Root cause analysis enables targeted interventions.
Focus resources on keeping existing customers happy
rather than constantly chasing new ones.
3
Use Multiple Analysis Methods
Cohort analysis, RFM scoring, predictive modeling, and qualitative research each
provide different insights. Start simple and build sophistication over time.
Continuous Improvement
Monitor churn metrics monthly
4
Predict and Act Proactively
Machine learning models can identify at-risk customers 30-60 days before churn. Use
these predictions to intervene early with targeted retention efforts.
Conduct deep-dive analysis quarterly
A/B test retention interventions
Update predictive models regularly