


")


 Экономика
Похожие презентации:

")


Macroeconomics. GDP. Income. Economic Growth
1. Macroeconomics GDP Income Economic Growth
MACROECONOMICSGDP
INCOME
ECONOMIC GROWTH
Zharova Liubov
2. GDP = is the monetary value of all the finished goods and services produced within a country's borders in a specific time
GDP = IS THE MONETARY VALUE OF ALL THEFINISHED GOODS AND SERVICES PRODUCED
WITHIN A COUNTRY'S BORDERS IN A SPECIFIC
TIME PERIOD
Includes all domestic production in a boarders
Monetary measurement of value
To avoid multiple counting – must include ONLY
new production (sold to consumers)
Does NOT include:
intermediate goods (ex: tires for new auto)
public transfer payments (welfare payment)
private transfer payments (cash gifts)
stock market transactions (stocks & bonds)
secondhand sales (used books, cars, homes)
3. Approaches to calculate GDP
APPROACHES TO CALCULATE GDPExpenditure & Income Methods
Expenditure Method – count all new goods &
services that are purchased by: consumers,
businesses, government, & net exports (X – M =
Xn)
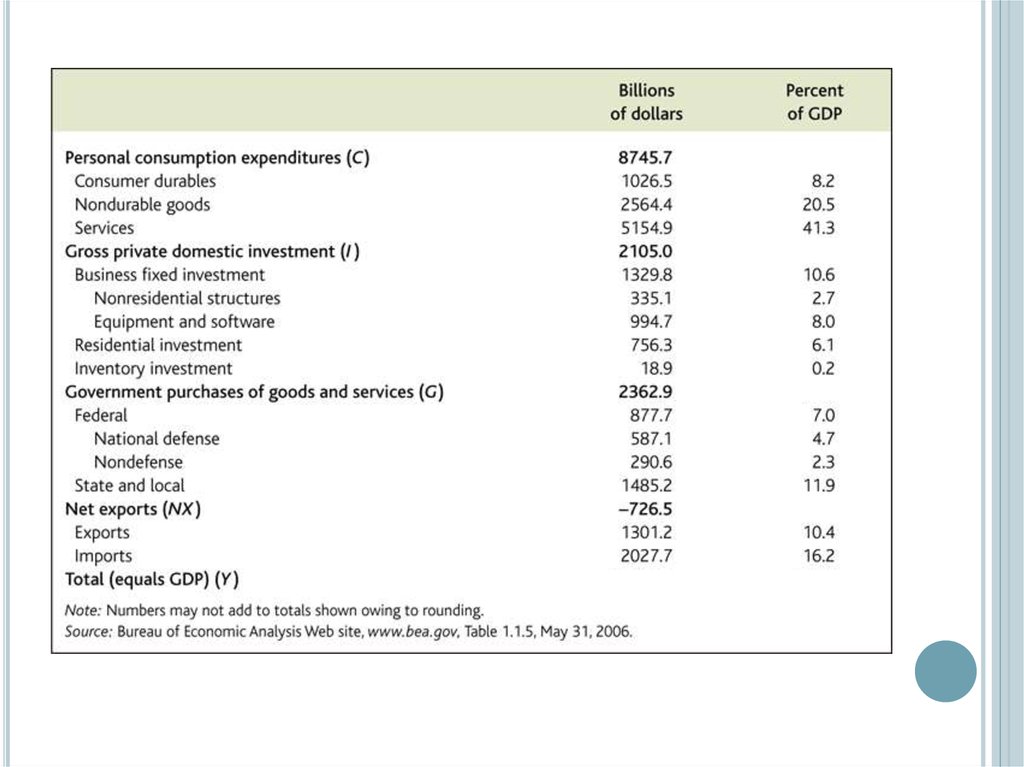
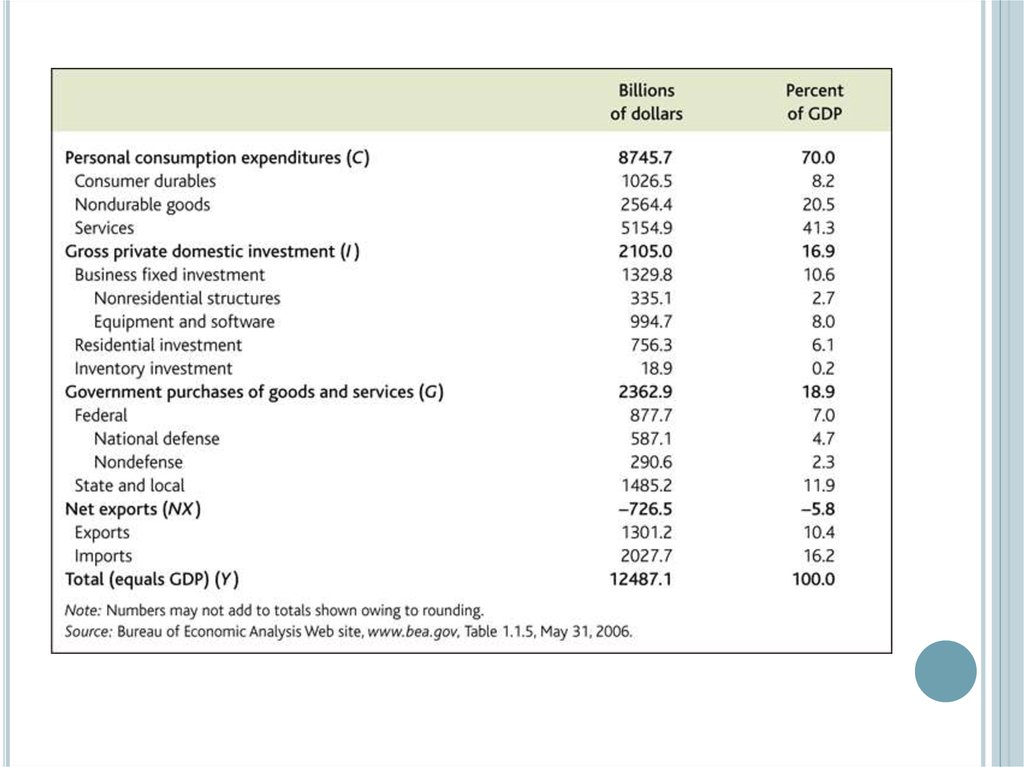
GDPExpenditure =C + I + G + NX
Net eXports
Consumption
Investment
Government purchases of
goods and services
4.
5.
6.
7.
8.
9.
10.
11.
12. Expenditure approach for 1 product economy
EXPENDITURE APPROACH FOR 1 PRODUCTECONOMY
Roaster
Wages $15,000
Taxes
$5,000
Revenue $35,000
beans sold to public $10,000
beans sold to coffee bar $25,000
Coffee bar
Wages $10,000
Taxes
$2,000
Beans bought from roaster $25,000
Revenue from coffee sold to public
$40,000
Note: Beans sold to coffee bar are intermediate goods since they are
used in the production of coffee sold to the public (final good).
Total expenditure = Consumption Expenditures = Beans purchased
by public + Coffee purchased by public = $10,000 + $40,000 = $50,000
final goods.
13. Expenditure approach for 1 product economy
EXPENDITURE APPROACH FOR 1 PRODUCTECONOMY
Winegrower
Wages $20,000
Taxes $7,000
Revenue $50,000
sold to public $20,000
sold to wine-maker $30,000
Wine-maker
Wages $18,000
Taxes $8,000
Grapes from winegrower $30,000
Revenue from wine sold to public
$40,000
Total expenditure = Consumption Expenditures = Grapes purchased
by public + Wine purchased by public = 20 000 + 40 000 = 60 000
final goods.
14. Product approach
PRODUCT APPROACHGDP is the sum of the value added created in all
the sectors of the economy.
Value added is sales minus materials,
intermediate inputs and energy costs.
The value of a final good is equal to the value
added at each stage of production.
Expenditure method = Production Method
15. Product approach for 1 product economy
PRODUCT APPROACH FOR 1 PRODUCTECONOMY
Roaster
Wages $15,000
Taxes
$5,000
Revenue $35,000
beans sold to public $10,000
beans sold to coffee bar $25,000
Coffee bar
Wages $10,000
Taxes
$2,000
Beans bought from roaster $25,000
Revenue from coffee sold to public
$40,000
Value Added – revenue earned by selling products minus the amount paid for
intermediate goods
Intermediate goods - goods that are used for the production of other goods (in
the current year)
Roaster value added = $35,000 in revenue - $0 spent on intermediate
goods = $35,000
Coffeebar value added = $40,000 in revenue - $25,000 spent on
intermediate goods (beans) = $15,000
Total value added = $50,000
16. Expenditure approach for 1 product economy
EXPENDITURE APPROACH FOR 1 PRODUCTECONOMY
Winegrower
Wages $20,000
Taxes $7,000
Revenue $50,000
sold to public $20,000
sold to wine-maker $30,000
Wine-maker
Wages $18,000
Taxes $8,000
Grapes from winegrower $30,000
Revenue from wine sold to public
$40,000
Winegrower value added = 50 000 in revenue – 0 spent on
intermediate goods = 50 000
Wine-maker value added = 40 000 in revenue – 30 000 spent on
intermediate goods (beans) = 10 000
Total value added = 50 000 + 10 000 = 60 000
17. Income method
INCOME METHODIncome Method – count all earnings received by those
who produce the goods & services
Workers, owners of property, interest earned on
savings, profit earned by business owners
(proprietors, partners & corporation stockholders)
Requires some accounting adjustments = Expenditures =
Income (must balance)
National income = all citizens supplied resources (here &
abroad)
National Income + statistical discrepancy =
Net National Product
18.
Consumption (C)Investment (I)
Government purchases (G)
Exports (X)
Imports (M)
Taxes (T)
Saving (S)
(I - S) + (G - T) + (X - M) = 0
19.
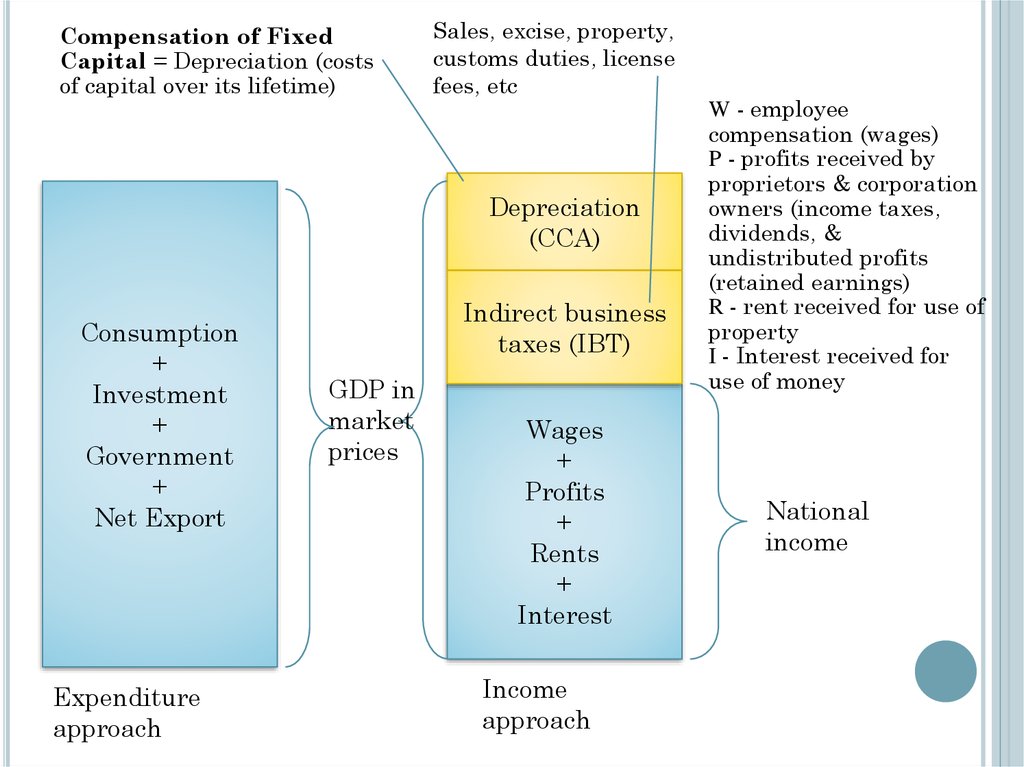
Compensation of FixedCapital = Depreciation (costs
of capital over its lifetime)
Sales, excise, property,
customs duties, license
fees, etc
Depreciation
(CCA)
Consumption
+
Investment
+
Government
+
Net Export
Expenditure
approach
Indirect business
taxes (IBT)
GDP in
market
prices
Wages
+
Profits
+
Rents
+
Interest
Income
approach
W - employee
compensation (wages)
P - profits received by
proprietors & corporation
owners (income taxes,
dividends, &
undistributed profits
(retained earnings)
R - rent received for use of
property
I - Interest received for
use of money
National
income
20.
NFIA = Factor income earned from abroad by residents - Factorincome of non-residents in domestic territory
21.
22. Income approach for 1 product economy
INCOME APPROACH FOR 1 PRODUCTECONOMY
Roaster
Wages $15,000
Taxes
$5,000
Revenue $35,000
beans sold to public $10,000
beans sold to coffee bar $25,000
Coffee bar
Wages $10,000
Taxes
$2,000
Beans bought from roaster $25,000
Revenue from coffee sold to public
$40,000
Note: profit = revenue - expenses
Total wages: $15,000 + $10,000 = $25,000
Total taxes: $5,000 + $2,000 = $7,000
Roaster profit = Revenue - Expenses = $35,000 - ($15,000 in wages +
$5,000 in taxes) = $15,000.
Coffeebar profit = Revenue - Expenses = $40,000 - ($10,000 in wages +
$2,000 in taxes + $25,000 in beans) = $3,000
Total profit = $15,000 + $3,000 = $18,000.
Total income = Total Wages + Total Taxes + Total Profits = $25,000 +
$7,000 +$18,000 = $50,000
23. Income approach for 1 product economy
INCOME APPROACH FOR 1 PRODUCTECONOMY
Winegrower
Wages $20,000
Taxes $7,000
Revenue $50,000
sold to public $20,000
sold to wine-maker $30,000
Wine-maker
Wages $18,000
Taxes $8,000
Grapes from winegrower $30,000
Revenue from wine sold to public
$40,000
Total wages = 20 000+18 000 = 38 000
Total taxes = 7 000+8 000 = 15 000
Profit (winegrower) = 50 000 - (20 000+7 000) = 23 000
Profit (wine-maker) = 40 000 - (18 000+8 000+30 000) = -16 000
Total revenue = 23 000 – 16 000 = 7 000
Total income = 38 000+150 00+7 000 = 60 000
24. GDP – by sum of Spending, Factor Incomes or Output
GDP – BY SUM OF SPENDING, FACTORINCOMES OR OUTPUT
GDP (Expenditure)
(known as
aggregate demand)
• Consumption
• Government
spending
• Investment
spending
• Exports
• - Imports
GDP (factor
incomes)
GDP (Product)
(value of output)
• Income from
people in jobs and
self-employment
• Profits of private
sector of
businesses
• Rent income from
the ownership of
land
• Value added from
each of the main
economic sectors
• These sectors are:
• Primary
• Secondary
• Tertiary
• Quaternary
25.
The first account displays the expenditure and income approaches tomeasuring GDP. The right-hand side of the account shows the final
expenditures by consumers, private business, governments and foreigners.
The left-hand side of the account shows the incomes that are generated in
the production of that output.
26. GDP (BEA commentaries)
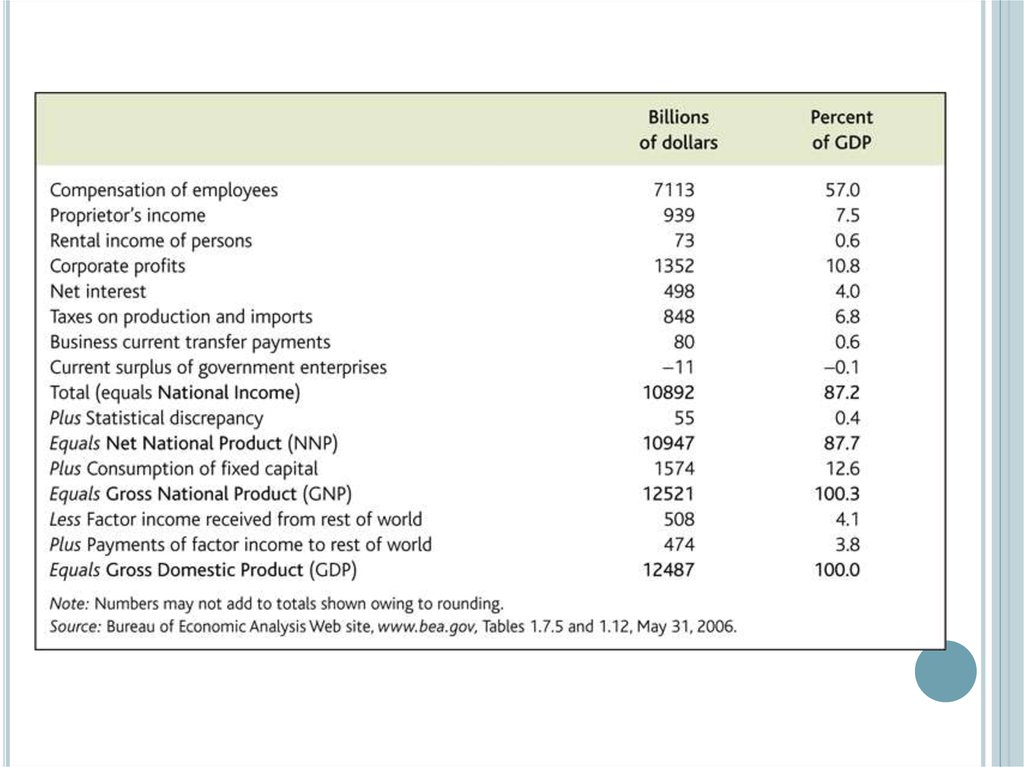
GDP (BEA COMMENTARIES)The entries on the right side of account 1 show the approach
used by BEA for deriving GDP: It is measured using the
expenditures approach – that is, as the sum of purchases by
final users.
The left (income) side – the sum of all the incomes earned and
costs incurred in production.
Specifically, the left side shows GDI as the sum of the income
earned by labor, governments and entrepreneurs and the
consumption of fixed capital.
In theory, GDI should be equal to GDP. In practice, differences
in the source data used to estimate the two measures result in
a “statistical discrepancy,” which, in the NIPAs ( national
income and product accounts), is calculated as GDP less GDI.
Because the source data used to develop the product-side
estimates of the account are based on more comprehensive
surveys and censuses, BEA considers them more reliable.
Therefore, the statistical discrepancy appears as a component
on the income side of the account to equate GDI with GDP.
27.
28. GDP – Nominal vs. Real
GDP – NOMINAL VS. REALChanges in
GDP
Quantity
Prices
Nominal = current year prices
Real = prices adjusted for inflation
Nominal Real (in the most cases)
Nominal GDP is used when comparing different
quarters of output within the same year. When
comparing the GDP of two or more years, real GDP is
used because, by removing the effects of inflation, the
comparison of the different years focuses solely on
volume.
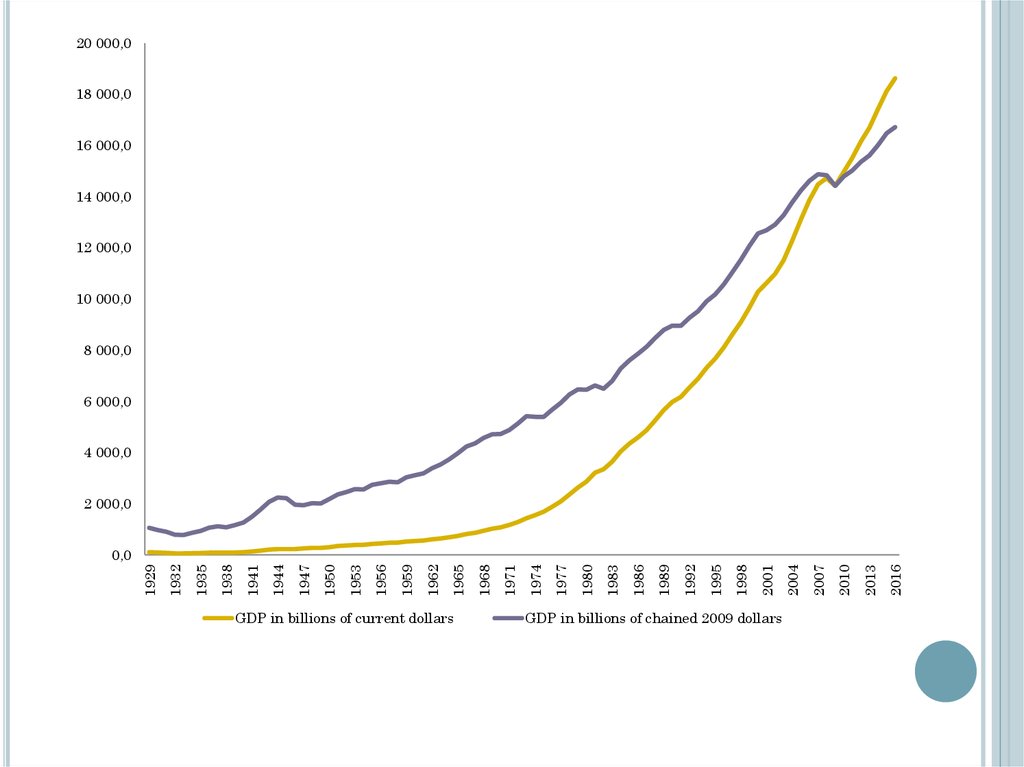
29. USA GDP Nominal and Real
2017-01-012016-07-01
2016-01-01
2015-07-01
2015-01-01
2014-07-01
2014-01-01
2013-07-01
2013-01-01
2012-07-01
2012-01-01
2011-07-01
2011-01-01
2010-07-01
2010-01-01
2009-07-01
2009-01-01
2008-07-01
2008-01-01
2007-07-01
2007-01-01
2006-07-01
2006-01-01
BLN doll
USA GDP NOMINAL AND REAL
20000,0
19000,0
18000,0
17000,0
16000,0
Real GDP or
GDP in constant
prices
15000,0
14000,0
GDPC1
GDP
13000,0
12000,0
11000,0
10000,0
30.
20 000,018 000,0
16 000,0
14 000,0
12 000,0
10 000,0
8 000,0
6 000,0
4 000,0
2 000,0
GDP in billions of current dollars
GDP in billions of chained 2009 dollars
2016
2013
2010
2007
2004
2001
1998
1995
1992
1989
1986
1983
1980
1977
1974
1971
1968
1965
1962
1959
1956
1953
1950
1947
1944
1941
1938
1935
1932
1929
0,0
31. Example
EXAMPLEBased year
Year
Price of
cheese
Quantity
of Cheese
Price
of
Wine
Quantity
of Wine
2010
$5
2 Blocks
$10
4 bottles
2011
$12
3 Blocks
$17
3 bottles
2012
$ 12
4 Blocks
$20
3 bottles
Nominal GDP =Pcheese∗Qcheese+Pwine∗Qwine
Nominal GDP2010 = 5*2+10*4=50
Nominal GDP2011=12*3+17*3=87
cheese2010∗Qcheese+Pwine2010∗Qwine
Real
GDP
=P
2012
Nominal GDP =12*4+20*3=108
Real GDP2010 = 5*2+10*4=50
Real GDP2011=5*3+10*3=45
Real GDP2012=5*4+10*3=50
Real GDP grow = (Real GDP 2011-Real GDP 2010)/Real GDP2010
Real GDP grow2011-2010 = (45-50)/50= -0.1
Real GDP grow2011-2012 = (50-45)/50= 0.1
Nominal GDP grow2011-2010 = (87-50)/50= 0.74
Nominal GDP grow2011-2012 = (108-87)/87= 0.24
32.
whereGDPt is the level of activity in the later period;
GDP0 is the level of activity in the earlier period;
m is the periodicity of the data (for example, 1 for annual data, 4 for quarterly
data, or 12 for monthly data); and
n is the number of periods between the earlier period and the later period(that is
t-0).
33. Deflator GDP
DEFLATOR GDPGDP deflator is an index of the price level relative to some
base year.
It is the cost of purchasing the goods that represent GDP
relative to the cost of purchasing the exact same goods if
they had been sold at the prices prevailing in the base year
CONSUMER PRICE INDEX
o The CPI is a measure that examines the weighted average of
prices of a basket of consumer goods and services
oPrice index in the base year is always 100
34.
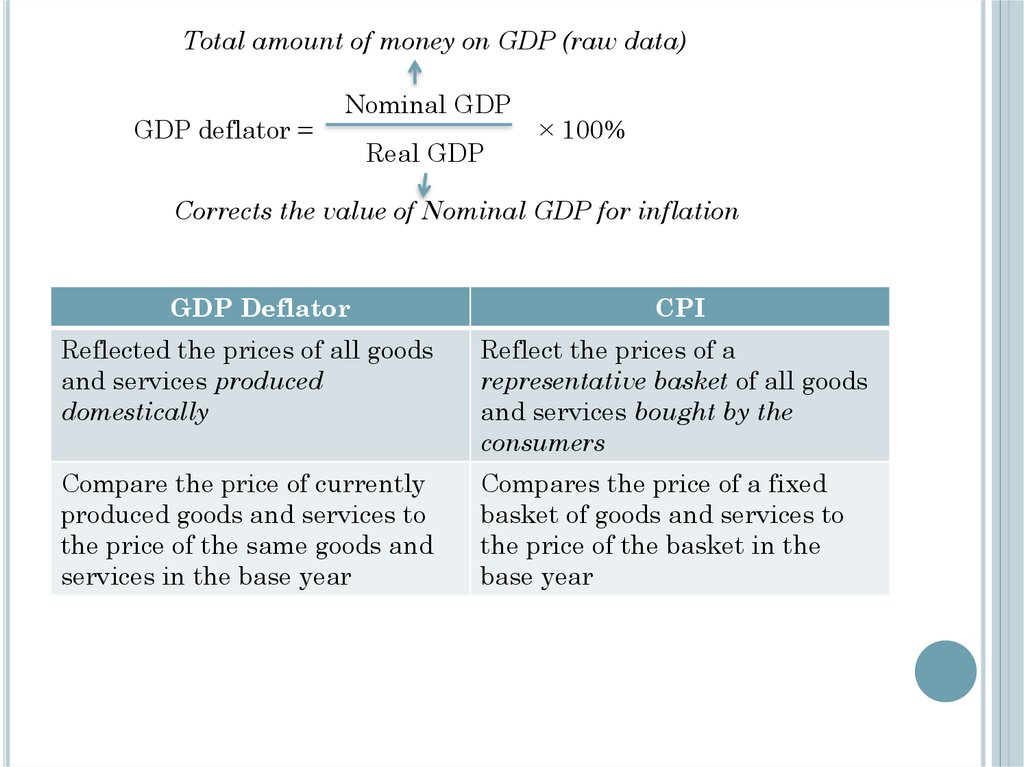
Total amount of money on GDP (raw data)GDP deflator =
Nominal GDP
Real GDP
× 100%
Corrects the value of Nominal GDP for inflation
GDP Deflator
CPI
Reflected the prices of all goods
and services produced
domestically
Reflect the prices of a
representative basket of all goods
and services bought by the
consumers
Compare the price of currently
produced goods and services to
the price of the same goods and
services in the base year
Compares the price of a fixed
basket of goods and services to
the price of the basket in the
base year
35. What is the relationship between GDP deflator & CPI?
WHAT IS THE RELATIONSHIP BETWEENGDP DEFLATOR & CPI?
o Both GDP deflator and CPI are measures of inflation.
o GDP deflator measures price level but will focus more on all new,
domestically produced, final goods and services in an economy
o CPI is the measure of changes in the price level of consumer goods
purchased by households over time.
o CPI uses a fixed basket to compare prices in determining inflation
progress. GDP deflator uses the price of the currently produced
product relative to the price from the base year.
36.
Malaysia37. Example
EXAMPLEQuantities
in Basket
2010 prices
(base)
2012
prices
Cheese
1
5
12
Wine
2
10
20
Deflator GDP2010 = (Nominal GDP2010/Real GDP2010 ) × 100=(50/50) ×100=100
Deflator GDP2012=(108/50) ×100=216
Inflation=[(Def GDP2012-Def GDP2010)/Def GDP 2010] ×100=[(216-100)/100]
×100=216
The value of this market basket in the base year :
5 × 1+10 × 2=25
The value of the market basket in the year 2012 :
12 × 1+20 × 2=52
CPI2012= (52/25) × 100= 208
To convert a nominal value to a real value:
So a Television that cost $100 in 2012 would cost $48 ([100/208] ×
100=48) (CPI) or $46.3 ([100/216] × 100=46.3) (Deflator GDP) in
2010
Real GDP 2012 in 2010 dollars =50×(100/216)=23.14
38. Inflation
INFLATIONDefine Inflation as the growth
rate of prices.
The greek letter π is often
used as a symbol of inflation
Inflation means that prices are
growing
Disinflation means that inflation is
slowing down but still positive
Deflation means that inflation is
negative and prices are actually
dropping.
1 t
t
Pt
Pt 1
Pt Pt 1
Pt 1
Pt Pt 1
Inflation Rate
x100%
Pt 1