


 Экономика
Похожие презентации:


")
")

Economics as a science
1.
Lecture 1Economics as a science
1
CHAPTER OUTLINE
Why Study Economics?
To Learn a Way of Thinking
To Understand Society
To Understand Global Affairs
To Be an Informed Citizen
The Scope of Economics
Microeconomics and
Macroeconomics
The Diverse Fields of Economics
PART I Introduction to Economics
The Method of Economics
© 2012 Pearson Education
Descriptive Economics and
Economic Theory
Theories and Models
Economic Policy
An Invitation
Appendix: How to Read
and Understand Graphs
1 of 37
2.
PART I Introduction to Economicseconomics The study of how
individuals and societies choose to use
the scarce resources that nature and
previous generations have provided.
Economics is the study of how individuals and societies choose
to use the scarce resources that nature and previous generations
have provided. The key word in this definition is choose.
Economics is a behavioral, or social, science. In large measure, it
is the study of how people make choices. The choices that people
make, when added up, translate into societal choices.
© 2012 Pearson Education
2 of 37
3. Why Study Economics?
To Learn a Way of ThinkingThree fundamental concepts:
Opportunity cost
Marginalism
PART I Introduction to Economics
Efficient markets
© 2012 Pearson Education
3 of 37
4.
Why Study Economics?To Learn a Way of Thinking
Opportunity Cost
PART I Introduction to Economics
opportunity cost The best alternative that
we forgo, or give up, when we make a
choice or a decision.
© 2012 Pearson Education
scarce Limited.
4 of 37
5.
Why Study Economics?To Learn a Way of Thinking
Marginalism
PART I Introduction to Economics
marginalism The process of analyzing the
additional or incremental costs or benefits
arising from a choice or decision.
© 2012 Pearson Education
sunk costs Costs that cannot be avoided
because they have already been incurred.
5 of 37
6.
Why Study Economics?To Learn a Way of Thinking
Efficient Markets—No Free Lunch
PART I Introduction to Economics
efficient market A market in which
profit opportunities are eliminated
almost instantaneously.
© 2012 Pearson Education
The study of economics teaches us a way
of thinking and helps us make decisions.
6 of 37
7.
Why Study Economics?To Understand Society
PART I Introduction to Economics
Industrial Revolution The period in
England during the late eighteenth and early
nineteenth centuries in which new
manufacturing technologies and improved
transportation gave rise to the modern factory
system and a massive movement of the
population from the countryside to the cities.
The study of economics is an essential part of the study of society.
© 2012 Pearson Education
7 of 37
8.
Why Study Economics?To Understand Global Affairs
An understanding of economics is essential
to an understanding of global affairs.
PART I Introduction to Economics
To Be an Informed Citizen
© 2012 Pearson Education
To be an informed citizen requires a basic
understanding of economics.
8 of 37
9.
The Scope of EconomicsMicroeconomics and Macroeconomics
microeconomics The branch of economics that
examines the functioning of individual industries
and the behavior of individual decision-making
units—that is, firms and households.
PART I Introduction to Economics
macroeconomics The branch of economics
that examines the economic behavior of
aggregates—income, employment, output, and
so on—on a national scale.
© 2012 Pearson Education
Microeconomics looks at the individual unit—the household,
the firm, the industry. It sees and examines the “trees.”
Macroeconomics looks at the whole, the aggregate. It sees
and analyzes the “forest.”
9 of 37
10.
The Scope of EconomicsMicroeconomics and Macroeconomics
TABLE 1.1 Examples of Microeconomic and Macroeconomic Concerns
Divisions
of Economics
PART I Introduction to Economics
Microeconomics
Macroeconomics
© 2012 Pearson Education
Production
Prices
Income
Employment
Production/output in
individual industries and
businesses
Price of individual
goods and services
Distribution of
income and
wealth
Employment by
individual businesses
and industries
How much steel
How much office
space
How many cars
Price of medical care
Price of gasoline
Food prices
Apartment rents
Wages in the auto
industry
Minimum wage
Executive salaries
Poverty
Jobs in the steel
industry
Number of employees
in a firm
Number of
accountants
National
production/output
Aggregate price level
National income
Employment and
unemployment in
the economy
Total industrial output
Gross domestic
product
Growth of output
Consumer prices
Producer prices
Rate of inflation
Total wages and
salaries
Total corporate
profits
Total number of jobs
Unemployment rate
10 of 37
11.
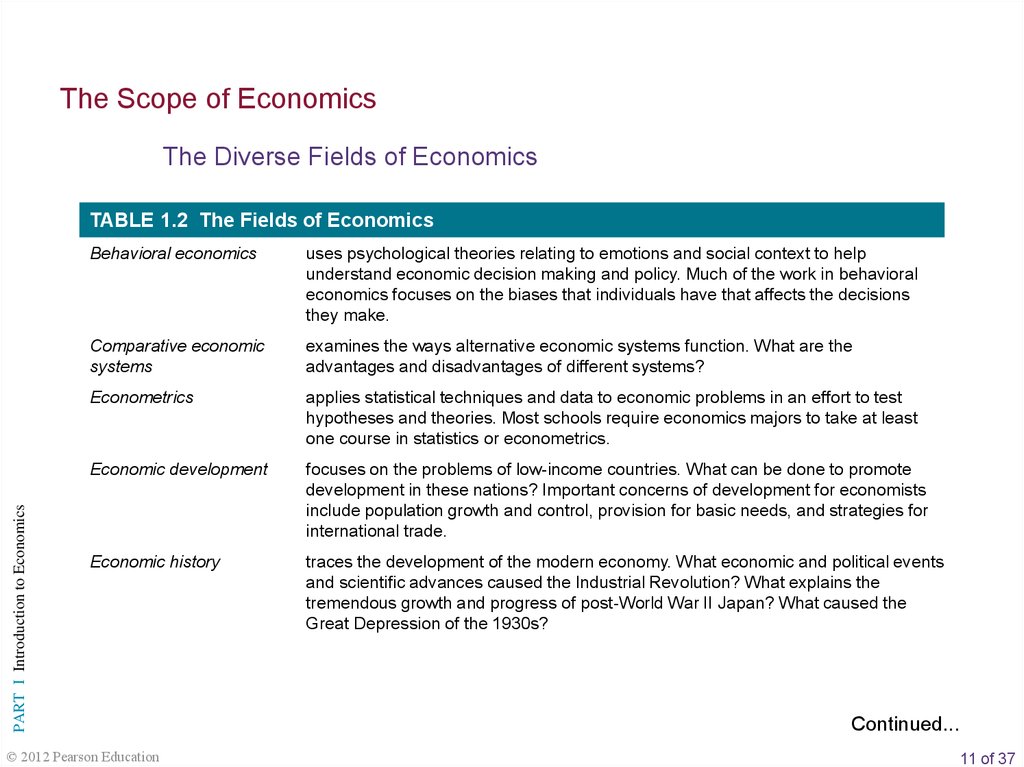
The Scope of EconomicsThe Diverse Fields of Economics
PART I Introduction to Economics
TABLE 1.2 The Fields of Economics
Behavioral economics
uses psychological theories relating to emotions and social context to help
understand economic decision making and policy. Much of the work in behavioral
economics focuses on the biases that individuals have that affects the decisions
they make.
Comparative economic
systems
examines the ways alternative economic systems function. What are the
advantages and disadvantages of different systems?
Econometrics
applies statistical techniques and data to economic problems in an effort to test
hypotheses and theories. Most schools require economics majors to take at least
one course in statistics or econometrics.
Economic development
focuses on the problems of low-income countries. What can be done to promote
development in these nations? Important concerns of development for economists
include population growth and control, provision for basic needs, and strategies for
international trade.
Economic history
traces the development of the modern economy. What economic and political events
and scientific advances caused the Industrial Revolution? What explains the
tremendous growth and progress of post-World War II Japan? What caused the
Great Depression of the 1930s?
© 2012 Pearson Education
Continued...
11 of 37
12.
The Scope of EconomicsThe Diverse Fields of Economics
PART I Introduction to Economics
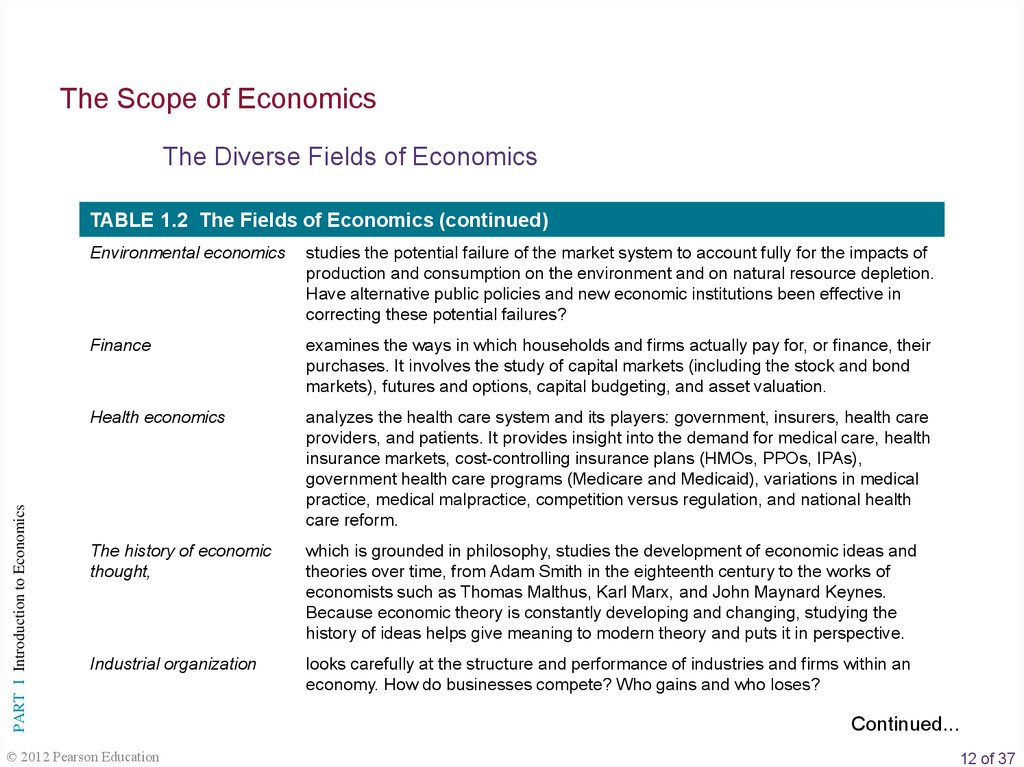
TABLE 1.2 The Fields of Economics (continued)
Environmental economics
studies the potential failure of the market system to account fully for the impacts of
production and consumption on the environment and on natural resource depletion.
Have alternative public policies and new economic institutions been effective in
correcting these potential failures?
Finance
examines the ways in which households and firms actually pay for, or finance, their
purchases. It involves the study of capital markets (including the stock and bond
markets), futures and options, capital budgeting, and asset valuation.
Health economics
analyzes the health care system and its players: government, insurers, health care
providers, and patients. It provides insight into the demand for medical care, health
insurance markets, cost-controlling insurance plans (HMOs, PPOs, IPAs),
government health care programs (Medicare and Medicaid), variations in medical
practice, medical malpractice, competition versus regulation, and national health
care reform.
The history of economic
thought,
which is grounded in philosophy, studies the development of economic ideas and
theories over time, from Adam Smith in the eighteenth century to the works of
economists such as Thomas Malthus, Karl Marx, and John Maynard Keynes.
Because economic theory is constantly developing and changing, studying the
history of ideas helps give meaning to modern theory and puts it in perspective.
Industrial organization
looks carefully at the structure and performance of industries and firms within an
economy. How do businesses compete? Who gains and who loses?
© 2012 Pearson Education
Continued...
12 of 37
13.
The Scope of EconomicsThe Diverse Fields of Economics
PART I Introduction to Economics
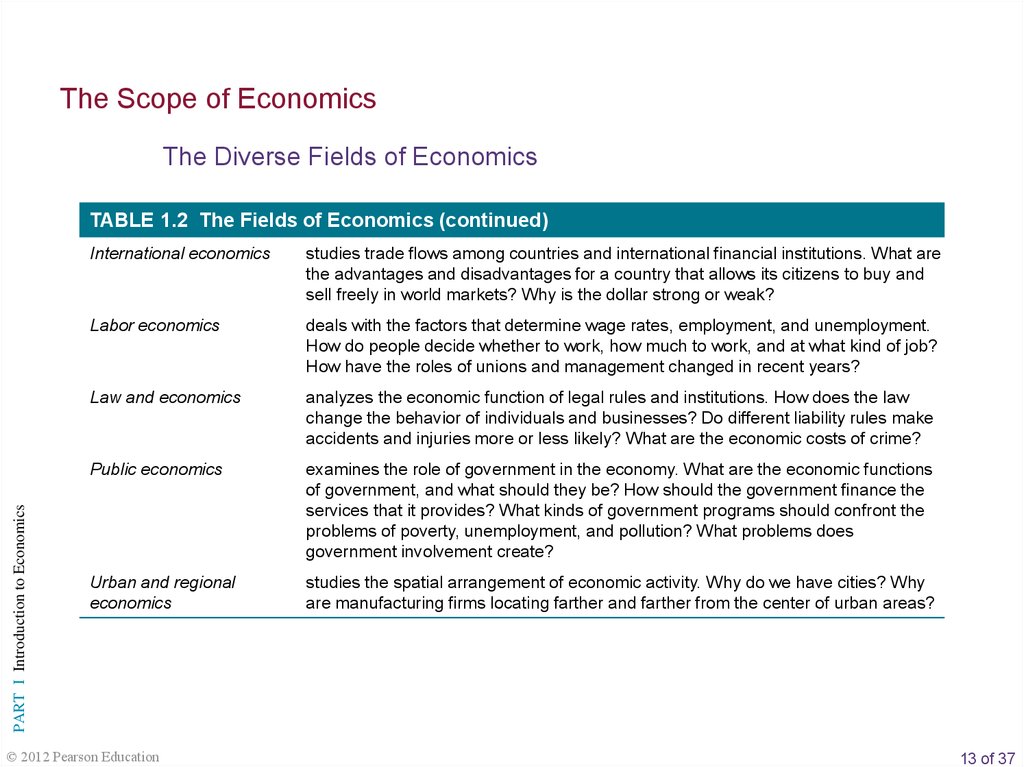
TABLE 1.2 The Fields of Economics (continued)
International economics
studies trade flows among countries and international financial institutions. What are
the advantages and disadvantages for a country that allows its citizens to buy and
sell freely in world markets? Why is the dollar strong or weak?
Labor economics
deals with the factors that determine wage rates, employment, and unemployment.
How do people decide whether to work, how much to work, and at what kind of job?
How have the roles of unions and management changed in recent years?
Law and economics
analyzes the economic function of legal rules and institutions. How does the law
change the behavior of individuals and businesses? Do different liability rules make
accidents and injuries more or less likely? What are the economic costs of crime?
Public economics
examines the role of government in the economy. What are the economic functions
of government, and what should they be? How should the government finance the
services that it provides? What kinds of government programs should confront the
problems of poverty, unemployment, and pollution? What problems does
government involvement create?
Urban and regional
economics
studies the spatial arrangement of economic activity. Why do we have cities? Why
are manufacturing firms locating farther and farther from the center of urban areas?
© 2012 Pearson Education
13 of 37
14.
EC ON OMIC S IN PRACTICETrust and Gender
PART I Introduction to Economics
While many transactions happen in
anonymous markets in which buyers
and sellers don’t know one another,
there are many other occasions in
which markets operate more
effectively if individuals develop some
trust in one another.
In experiments run at the University of
Wisconsin and the University of Miami,
researchers conclude, “We find that
men trust more than women, and
women are more trustworthy than men.”
© 2012 Pearson Education
14 of 37
15.
The Method of EconomicsPART I Introduction to Economics
positive economics An approach to economics that
seeks to understand behavior and the operation of
systems without making judgments. It describes what
exists and how it works.
© 2012 Pearson Education
normative economics An approach to economics
that analyzes outcomes of economic behavior,
evaluates them as good or bad, and may prescribe
courses of action. Also called policy economics.
15 of 37
16.
The Method of EconomicsDescriptive Economics and Economic Theory
descriptive economics The compilation of
data that describe phenomena and facts.
PART I Introduction to Economics
economic theory A statement or set of
related statements about cause and effect,
action and reaction.
© 2012 Pearson Education
16 of 37
17.
The Method of EconomicsTheories and Models
model A formal statement of a theory, usually
a mathematical statement of a presumed
relationship between two or more variables.
PART I Introduction to Economics
variable A measure that can change from time
to time or from observation to observation.
© 2012 Pearson Education
Ockham’s razor The principle that irrelevant
detail should be cut away.
17 of 37
18.
The Method of EconomicsTheories and Models
All Else Equal: Ceteris Paribus
PART I Introduction to Economics
ceteris paribus, or all else equal A device
used to analyze the relationship between
two variables while the values of other
variables are held unchanged.
Using the device of ceteris paribus is one part of the process of
abstraction. In formulating economic theory, the concept helps
us simplify reality to focus on the relationships that interest us.
© 2012 Pearson Education
18 of 37
19.
The Method of EconomicsTheories and Models
Expressing Models in Words, Graphs, and Equations
Methods of expressing the quantitative relationship between two variables:
Graphing (as presented in appendix)
Equations, for example:
PART I Introduction to Economics
© 2012 Pearson Education
If over time U.S. households collectively spend, or consume, 90
percent of their income and save 10 percent of their income, we
could then write:
C = .90 Y
and
S = .10Y
where C is consumption spending, Y is income, and S is saving.
19 of 37
20.
The Method of EconomicsTheories and Models
Cautions and Pitfalls
The Post Hoc Fallacy
PART I Introduction to Economics
post hoc, ergo propter hoc Literally, “after
this (in time), therefore because of this.” A
common error made in thinking about
causation: If Event A happens before Event
B, it is not necessarily true that A caused B.
© 2012 Pearson Education
The Fallacy of Composition
fallacy of composition The erroneous
belief that what is true for a part is
necessarily true for the whole.
20 of 37
21.
The Method of EconomicsTheories and Models
Testing Theories and Models: Empirical Economics
PART I Introduction to Economics
empirical economics The collection and use
of data to test economic theories.
© 2012 Pearson Education
21 of 37
22.
The Method of EconomicsEconomic Policy
Criteria for judging economic outcomes:
1. Efficiency
2. Equity
3. Growth
PART I Introduction to Economics
4. Stability
© 2012 Pearson Education
22 of 37
23.
The Method of EconomicsEconomic Policy
Efficiency
PART I Introduction to Economics
efficiency In economics, allocative efficiency. An
efficient economy is one that produces what
people want at the least possible cost.
© 2012 Pearson Education
Equity
equity Fairness.
23 of 37
24.
The Method of EconomicsEconomic Policy
Growth
PART I Introduction to Economics
economic growth An increase in the total
output of an economy.
© 2012 Pearson Education
Stability
stability A condition in which national
output is growing steadily, with low inflation
and full employment of resources.
24 of 37
25. R E V I E W T E R M S A N D C O N C E P T S
PART I Introduction to EconomicsREVIEW TERMS AND CONCEPTS
ceteris paribus, or all else equal
marginalism
descriptive economics
microeconomics
economic growth
model
economic theory
normative economics
economics
Ockham’s razor
efficiency
opportunity cost
efficient market
positive economics
empirical economics
post hoc, ergo propter hoc
equity
scarce
fallacy of composition
stability
Industrial Revolution
sunk costs
macroeconomics
variable
© 2012 Pearson Education
25 of 37
26.
CHAPTER 1 APPENDIXHow to Read and Understand Graphs
A graph is a two-dimensional representation
of a set of numbers, or data.
Time Series Graphs
PART I Introduction to Economics
A time series graph shows how a single
measure or variable changes over time.
© 2012 Pearson Education
26 of 37
27.
CHAPTER 1 APPENDIXHow to Read and Understand Graphs
Time Series Graphs
PART I Introduction to Economics
TABLE 1A.1 Total Disposable
Personal Income in the United States,
1975–2009 (in billions of dollars)
Year
1975
1976
1977
1978
1979
1980
1981
1982
1983
1984
1985
1986
1987
1988
1989
1990
1991
1992
Total
Disposable
Personal
Income
1,187.3
1,302.3
1,435.0
1,607.3
1,790.8
2,002.7
2,237.1
2,412.7
2,599.8
2,891.5
3,079.3
3,258.8
3,435.3
3,726.3
3,991.4
4,254.0
4,444.9
4,736.7
© 2012 Pearson Education
Year
1993
1994
1995
1996
1997
1998
1999
2000
2001
2002
2003
2004
2005
2006
2007
2008
2009
Total
Disposable
Personal
Income
4,921.6
5,184.3
5,457.0
5,759.6
6,074.6
6,498.9
6,803.3
7,327.2
7,648.5
8,009.7
8,377.8
8,889.4
9,277.3
9,915.7
10,403.1
10,806.4
10,923.6
FIGURE 1A.1 Total Disposable Personal
Income in the United States: 1975–2009 (in
billions of dollars)
27 of 37
28. Appendix
CHAPTER 1 APPENDIXHow to Read and Understand Graphs
Graphing Two Variables on a Cartesian Coordinate System
FIGURE 1A.2 A Cartesian Coordinate
System
PART I Introduction to Economics
A Cartesian coordinate system is
constructed by drawing two
perpendicular lines: a vertical
axis (the Y-axis) and a horizontal
axis (the X-axis). Each axis is a
measuring scale.
© 2012 Pearson Education
28 of 37
29.
CHAPTER 1 APPENDIXHow to Read and Understand Graphs
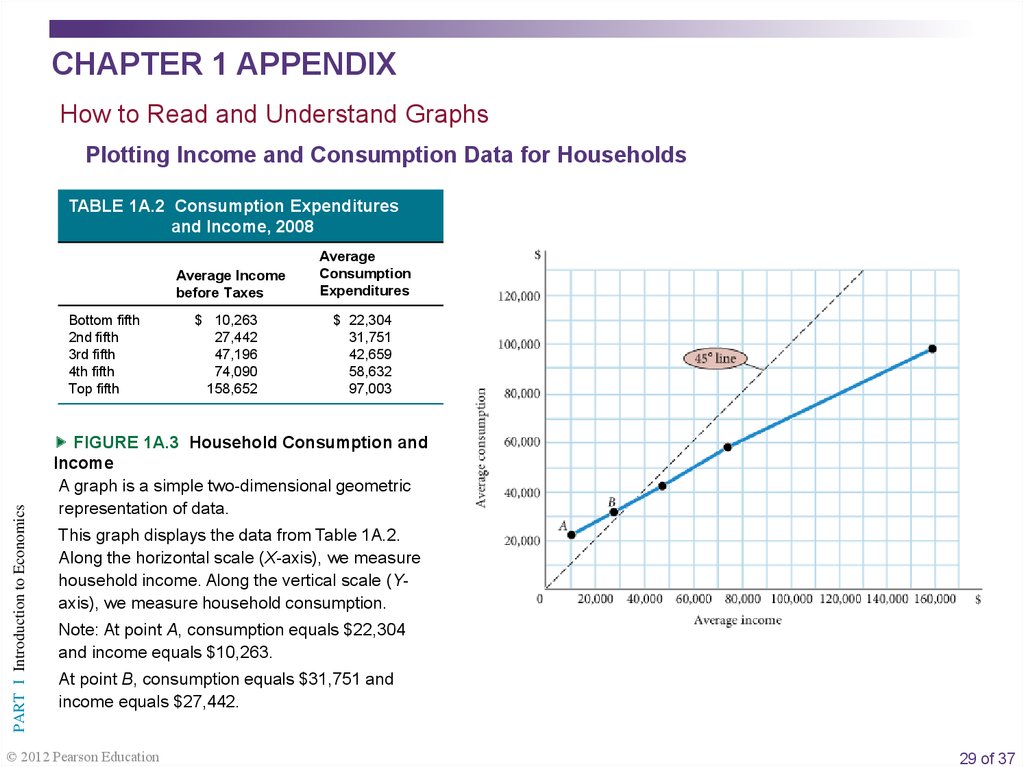
Plotting Income and Consumption Data for Households
TABLE 1A.2 Consumption Expenditures
and Income, 2008
Average Income
before Taxes
PART I Introduction to Economics
Bottom fifth
2nd fifth
3rd fifth
4th fifth
Top fifth
$ 10,263
27,442
47,196
74,090
158,652
Average
Consumption
Expenditures
$ 22,304
31,751
42,659
58,632
97,003
FIGURE 1A.3 Household Consumption and
Income
A graph is a simple two-dimensional geometric
representation of data.
This graph displays the data from Table 1A.2.
Along the horizontal scale (X-axis), we measure
household income. Along the vertical scale (Yaxis), we measure household consumption.
Note: At point A, consumption equals $22,304
and income equals $10,263.
At point B, consumption equals $31,751 and
income equals $27,442.
© 2012 Pearson Education
29 of 37
30.
CHAPTER 1 APPENDIXHow to Read and Understand Graphs
Slope
Y Y
Y
2 1
X X 2 X 1
PART I Introduction to Economics
FIGURE 1A.4 A Curve with (a) Positive Slope and (b) Negative Slope
A positive slope indicates that increases in X are
associated with increases in Y and that decreases
in X are associated with decreases in Y.
© 2012 Pearson Education
A negative slope indicates the opposite—
when X increases, Y decreases; and when
X decreases, Y increases.
30 of 37
31.
CHAPTER 1 APPENDIXHow to Read and Understand Graphs
PART I Introduction to Economics
Slope
FIGURE 1A.5 Changing Slopes along Curves
© 2012 Pearson Education
31 of 37
32.
CHAPTER 1 APPENDIXSome Precautions
TABLE 1A.3 Aggregate National Income and
Consumption for the United States,
1930–2009 (in billions of dollars)
Aggregate National Income
PART I Introduction to Economics
1930
1940
1950
1960
1970
1980
1990
2000
2005
2006
2007
2008
2009
Aggregate Consumption
82.9
90.9
263.9
473.9
929.5
2433.0
5059.8
8938.9
11,273.8
12,031.2
12,448.2
12,635.2
12,280.0
70.1
71.3
192.2
331.8
648.3
1,755.8
3,835.5
6,830.4
8,819.0
9,322.7
9,826.4
10,129.9
10,089.1
FIGURE 1A.6 National Income and
Consumption
It is important to think carefully about what is
represented by points in the space defined by the
axes of a graph.
In this graph, we have graphed income with
consumption, as in Figure 1A.3, but here each
observation point is national income and aggregate
consumption in different years, measured in billions
of dollars.
© 2012 Pearson Education
32 of 37
33. A P P E N D I X R E V I E W T E R M S A N D C O N C E P T S
PART I Introduction to EconomicsAPPENDIX REVIEW TERMS AND CONCEPTS
Cartesian coordinate system
time series graph
graph
X-axis
negative relationship
X-intercept
origin
Y-axis
positive relationship
Y-intercept
slope
© 2012 Pearson Education
33 of 37