


")


 Operations")


 Биология
Похожие презентации:


Waterflood Design and Operational Best Practices
1.
Primary funding is provided byThe SPE Foundation through member donations
and a contribution from Offshore Europe
The Society is grateful to those companies that allow their
professionals to serve as lecturers
Additional support provided by AIME
Society of Petroleum Engineers
Distinguished Lecturer Program
www.spe.org/dl
2.
Waterflood Design andOperational Best Practices
Scot Buell, SPEC
Society of Petroleum Engineers
Distinguished Lecturer Program
www.spe.org/dl
2
3. Outline
Waterflood design life and injection efficiency
Conformance management
Injection well design
Waterflood surveillance
Water quality
Fracturing and subsurface integrity
Interdisciplinary aspects of waterflooding
3
4. Waterflooding: The Gateway to Enhanced Oil Recovery
Oil Recovery% Recovery of Oil in Place
100%
80%
60%
40%
Enhanced Oil
Recovery
Secondary
(waterflood)
20%
Primary
Time
Source: SPE 84908, Stosur et al
4
5. Waterflood Mobility Ratio
Mwf = mo krw/mw kroMwf > 1 is unfavorable – water is
more mobile than oil
Mwf < 1 is favorable – oil is more
mobile than water
mo = oil viscosity
mw = water viscosity
kro = relative permeability to oil
krw = relative permeability to water
5
6. What is the Design Life of Your Waterflood?
Design Life affected by:• Mobility ratio
• Pore volumes injected
(PVI) per year
• Injection efficiency
• Water quality
• Permeability
• Well spacing
• Onshore versus
offshore
6
7. Case History: Pore Volumes Injected for Four Offshore Reservoirs
• Processing rates (PVI/yr)very different among
fields
• Same stratigraphic unit,
fluid properties, structure
& trapping mechanism for
all fields
• Unfavorable mobility ratio
for all fields
• Communication between
fields via a regional
aquifer
• Start of primary
production and water
injection varies for each
reservoir
7
8. How Efficiently Is Your Water Injection Displacing Oil?
• Technique is basedupon net accumulated water
in the reservoir
• Projects with good injection
confinement will be close to
100% efficiency (actual = theoretical)
• Injection efficiency impacts
overall water requirements
and facility life
• Field example to right lacks
confinement and has ~75%
efficiency
Reference: Staggs, SPE SW Petroleum Short Course, 1980
8
9. Voidage Replacement Ratio (VRR)
• VRR is used as a leading indicator to achievetarget reservoir pressure (particularly when
bottom hole pressure data is not available)
• Also known as FIFO (fluid-in fluid-out) or IWR
(injection-withdrawal ratio)
• Provides accounting of reservoir barrels into and
out of the reservoir
• Waterfloods should have a target, minimum, &
maximum reservoir pressures
9
10. Typical VRR Values After Fill-up
VRR 1.1 to 1.4VRR 1.0 to 1.1
VRR 1.0 to 1.2
Do you understand your VRR requirement
for your target reservoir pressure?
10
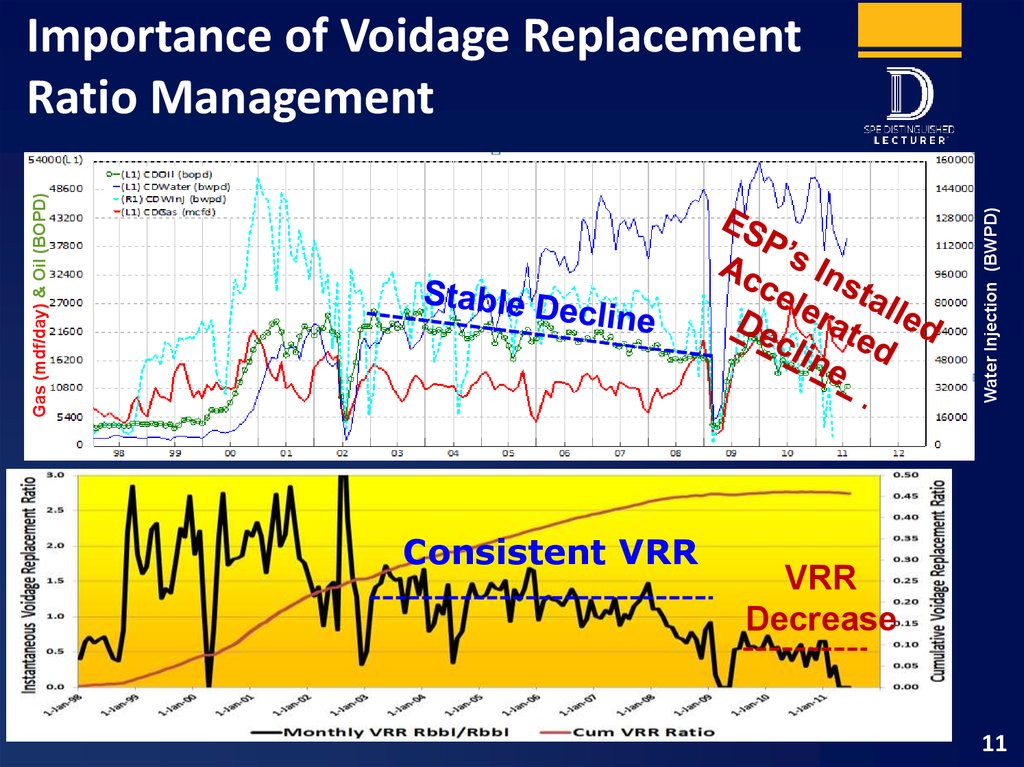
11.
Water Injection (BWPD)Gas (mdf/day) & Oil (BOPD)
Importance of Voidage Replacement
Ratio Management
Consistent VRR
VRR
Decrease
11
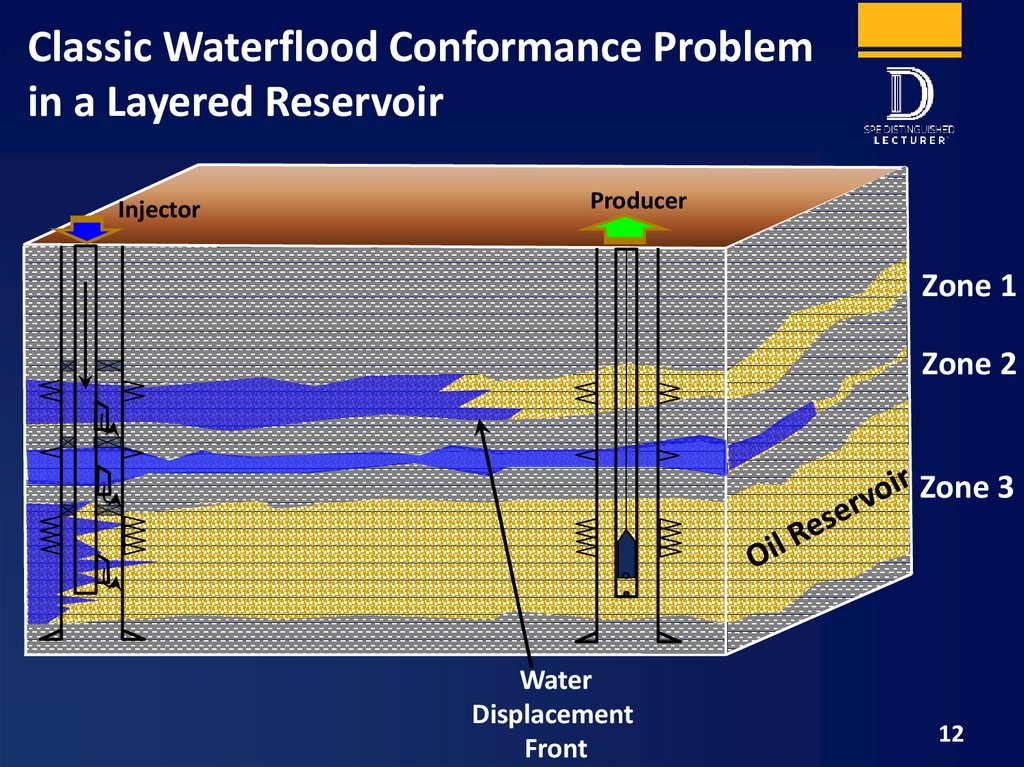
12.
Classic Waterflood Conformance Problemin a Layered Reservoir
Injector
Producer
Zone 1
Zone 2
Zone 3
Water
Displacement
Front
12
13. Management of Layered Waterflood Response
% OriginalFlow Unit Oil In Place
% Flow
Capacity
(md-ft)
Current %
Pore Volumes
Injected
Current
Water-Oil
Ratio
Zone 1
Zone 2
Zone 3
25%
15%
60%
30%
50%
20%
36%
100%
10%
2
20
Dry
Total
100%
100%
30%
2.1
Always start with the injector if possible. Need surveillance and
injector completions that enable injection profile
management.
13
14. Waterflood Analysis Techniques
Identifying Injector-ProducerRelationships
1.0
Lorenz coefficient – Dykstra-Parsons
Capacitance-resistance models
(CRM)
Streamtube or streamlines
Electromagnetic surveys
Gravimetric surveys
Flow Capacity - Skh
Waterflood Analysis Techniques
Lorenz Plot
0
Pore Volume Storage - Sfh
1.0
1950, Schmalz and Rahme
Understand Critical Assumptions of Each Technique
Single hydraulic flow unit or averaging of multiple
hydraulic units - 2 dimensional only
Material balance – confinement of injection and production
Many waterfloods do not honor these simple assumptions
Reference: SPE 23451, 30758, 59529, 68802, 84080, 102478, 114983, 124625,
129604, 171226, 176569, 177106, IPTC 17978, & SEG 2002-0791
14
15. Injector Completions for Conformance Control
Limited EntryPerforating
Dedicated
Tubingless
Slimhole
Dual String
Injection
Packers & Injection
Mandrels
with Chokes
Smart Injector
with Packers
& ICV’s
15
16. Elements of a Waterflood Surveillance Plan
Required Routine Surveillance :Production testing
Injection measurement
Water quality
Surface & bottomhole pressures
Production and injection logging
Well mechanical integrity
Non-Routine Surveillance:
Pressure transient analysis
Seismic
Saturation logs
Openhole logs in new wells
Interwell tracers
PVT Sampling
Formation testing in new wells
Routine & special core analysis
Extended leakoff test (XLOT)
16
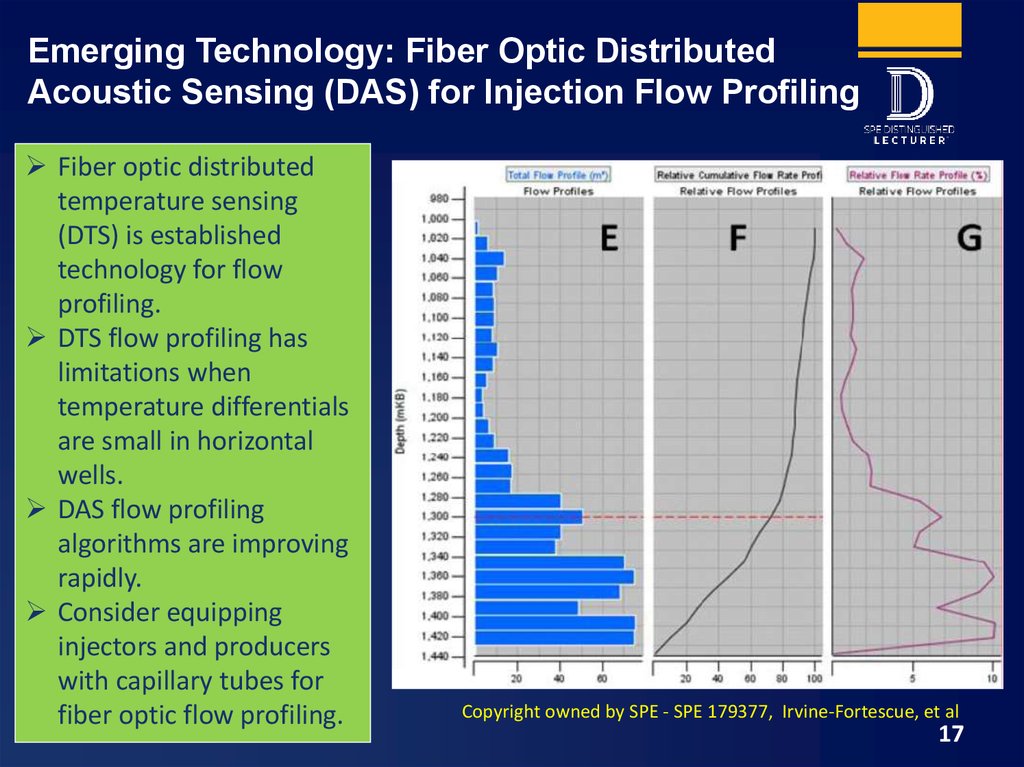
17.
Emerging Technology: Fiber Optic DistributedAcoustic Sensing (DAS) for Injection Flow Profiling
Fiber optic distributed
temperature sensing
(DTS) is established
technology for flow
profiling.
DTS flow profiling has
limitations when
temperature differentials
are small in horizontal
wells.
DAS flow profiling
algorithms are improving
rapidly.
Consider equipping
injectors and producers
with capillary tubes for
fiber optic flow profiling.
Copyright owned by SPE - SPE 179377, Irvine-Fortescue, et al
17
18. Cross-functional Waterflood Management
Waterflood ScorecardsHierarchy of Analysis
It takes more than just reservoir & production engineers
to have a successful waterflood
18
19. Typical Water Quality Specifications
ParameterTypical
Specifications
Total Suspended Solids
Dissolved Oxygen
Sulfate Content
Chlorine residual
Sessile Sulfate Reducing
Bacteria
Planktonic sulfate
reducing bacteria
< 2 ppm
< 10 ppb
< 2 to 40 ppm
0.3 – 1.0 ppm
< 100/cm2
<100/mL
Reference: NACE 5962 Eggum et al 2015, IJAETCS Abdulaziz 2014, & SPE 98096 Jordan et al 2008
19
20. Offshore Water Injection Plant Scorecard
Months withno Chlorination?
20
21. Biofouling: Consequences of Not Meeting Water Quality Specifications?
What are Biofilms?They are collections of microorganisms and
the extracellular polymers they secrete.
They attach to either inert or living
substrates. These bacteria are classified as
planktonic (free floating) or sessile
(anchored).
MIC Injection Tubing Corrosion
Example
Microbiologically Induced
Corrosion (MIC): Bacteria produce
waste products like CO2, H2S, and organic
acids that corrode the pipes by increasing
the toxicity of the flowing fluid in the
pipeline. The microbes tend to form
colonies in a hospitable environment and
accelerate corrosion under the colony.
21
22. Under Deposit Corrosion: Consequences of Not Meeting Water Quality Specifications?
A common corrosionmechanism in water
injection systems with
biofouling or solids
accumulation.
Pipeline Under Deposit Corrosion
The deposit creates “cell
corrosion,” which is typically
very aggressive and
localized.
Deep penetration of steel
can occur rapidly under
deposit
Reference: NACE 11266, 2011
22
23. Oxygen: Consequences of Not Meeting Water Quality Specifications?
Oxygen Corrosion ExamplesBare carbon steel can
provide long-term
waterflood service in the
absence of oxygen
Oxygen is a strong oxidant
and reacts with metal very
quickly.
Oxygen magnifies the
corrosive effects of the acid
gases H2S and CO2.
23
24. Water Injection Plant (WIP) Operations
• Are your water injection plantoperations lower priority
relative to oil & gas plant
operations?
• Operations staff in a difficult
position: Do they meet a water
volume target or a water quality
specification?
• Cross functional discussion is
required to make the best
decision for overall waterflood
management.
24
25. Operational Discipline with Water Quality
• Do you have a waterquality specification or a
water quality suggestion?
• Do you have quality
criteria for stopping water
injection?
• The negative impacts of offspec water are not reversed
with pigging, acidizing,
chemical shock treatments,
surface piping replacement,
etc.
Corrosion Byproducts: Oily Iron Sulphide and
Iron Oxide in an Injector
25
26. Matrix Injection Myth in Waterfloods
• Long term matrix injection cannotbe achieved with practical water
quality levels in sandstone reservoirs.
• Some near wellbore fracturing will occur in
most injectors due to thermal stress & plugging
effects.
• Injection pressures, rates and water quality can
be used to manage fracture geometry.
• Vuggy, fractured carbonates can be an
exception
26
See SPE 28082, 28488, 39698, 59354,84289,95021, 95726, 102467, 107866,165138, et al
27. Subsurface Integrity Management for Waterfloods
• Subsurface integrity management ensures injected fluidsare confined to targeted and permitted reservoirs.
• Industry events with injection water breaching seabed or
earth’s surface
• Increasing societal and governmental concerns
• Historical focus has been on understanding reservoir
fracturing and not the overburden and caprock.
• Keeping injection pressures below caprock fracture
pressures does not guarantee containment –
geomechanical modeling may be required.
27
28. Key Takeaways
• Understand the design life and processing rate of your reservoir(PVI/year)
• Understand how much of your water injection is effective
• Plan for early water breakthrough and layered reservoir
management
• Understand surveillance minimums and emerging fiber optic
technologies
• Use operational discipline with your water quality, have criteria
for stopping injection , know your water chemistry
• Plan for injector fracturing and subsurface integrity
management
• Use a cross functional/interdisciplinary team approach
28
29.
Your Feedback isImportant
Enter your section in the DL Evaluation
Contest by completing the evaluation
form for this presentation
Visit SPE.org/dl
Society of Petroleum
Engineers
Distinguished Lecturer
Program
www.spe.org/dl
29