Похожие презентации:
Operational Risk Management: Best Practice Overview and Implementation
1. Operational Risk Management:
Best Practice Overview and Implementation2. Table of Contents
Pillar I. Operational Risk Management SetupPillar 2. Identification Tools
Pillar 3. Risk Measurement and Analysis
Pillar 4. Management Actions and Framework
Business game
2
3. Table of Contents
Pillar I. Operational Risk Management Setup1. Recent trends in the ERM
2. Introduction to ORM under and after Basel 2
3
4. Table of Contents
Pillar I. Operational Risk Management Setup1. Recent trends in the ERM
2. Introduction to ORM under and after Basel 2
4
5. OpRisk IS AN ENTERPRISE-WIDE RISK
OR has been managed already before it has been „labelled― so.However ORM has never been an integrated process, rather a
set of fragmented activities to deal with a wide variety of risks
5
6. RECENT OUTSTANDING OPERATIONAL LOSSES
BARINGS PLC – 1995, USD 1.3 Bln – unauthorized trading by Nick Leighson.Mizuho Securities – Dec 2005 (USD 250 Mio) – trader error (sold 620 K shares for 1 yen, instead of 1
share for Yen 620K) – shares sold over 4 times the outstanding shares in the company; failures at
Mizuho, incl. ―fatfinger‖ syndrome, and TSE clearing failures.
SG – Jan-2008 Euro 4.9 bio net (or 6.3 bio gross of unauthorized profile of Euro 1.4 bio) – unauthorized
• trades, false hedges, risk measured on net basis,
• password management, knowledge of controls, weak
• controls; ―culture of tolerance‖, ignoring warning
• signs, incentive structure of traders….etc.
UBS – credit write-downs related to sub-prime exposure of over $ 38 bio. S&P downgraded rating one
notch to AA- and may lower further due to ―risk management lapses‖. Tier 1 ratio would fall to 7%
without capital increase and rights issue (an ELEMENT OF OPERATIONAL RISK within this credit
risk loss).
US Mortgage Crisis – non-registration of mortgage loans – instead of registering security interest with
local authority, banks did it with a parallel MERS (owned by them) – 64 Mio mortgages under
question.
Major Losses Raise Importance of Incident Management
6
7. IOR Guidance
2009 - OpRisk Appetite;03/2010 – Risk Control Self
Assessment; 09/2010 – Governance
11/2010 – KRI;
09/2011 – Risk Categorization;
11/2011 – External Loss Events
ISO Standards:
31100 – Enterprise Risk Management;
27900 – Information Security
FERMA (Federation of European
Risk Management Associations)
Standards
International Soft
Regulation of
Operational Risk
BCBS
02/2005 – Outsourcing;
06/2006 – Basel 2;
08/2006 – Business continuity;
11/2007 – Home-Host Supervision;
10/2010 – Insurances for AMA;
11/2010 – Guidelines AMA;
06/2011 – Principles of OpRiskSound
Management
EBA (CEBS) Guidelines
06/2010 – Market Activities OR;
09/2011 – Internal Governance;
01/2012 – AMA Extensions &
Changes
7
8. INTERNATIONAL REGULATORY PERCEPTION OF the companyING OR
Supervisors „discovered― OR as separate risk class => Don‗t get trapped into finding a perfectdefinition
8
9. DEFINE OpRisk PRIOR TO MEASURING IT
„Narrow“(Basel 2, §644, R.Morris Ass.)
„Wide“
Risk of losses resulting from:
(1) inadequate or failed internal
processes,
(2) people and
(3) systems or
(4) from external events
BCBS definition is artificial, for
regulatory capital calculation.
• The largest OR component - Business
risk - OMITTED
• Reputational risk (biggest biz risk!)
EXCLUDED
including legal risk (as fraud
constitutes the most significant OR
loss events category and a legal
issue,
excluding strategic & reputational
risks
―All risks, other than credit and market,
which could cause volatility of revenues,
expenses and value of the company‘s
business.‖
9
10. BANKING RISKS
StrategicRisk
Credit
Risk
Based on
creditworthine
ss
Market
Risk
Based on market
prices
Operational Risk
Based on key
bank‗s assets
Non-product specific;
Driven by key resources &
Operations
Linked to reward
Credit and Markets Risks are specific to the financial industry vs
OpRisk - a general business risk with particular features in banking. OpRisk is taken not because of
financial reward (like credit & market risks), but exists in a normal course of business activity;
10
11. OPERATIONAL RISK PORTION IN REGCAP
OpRiskDiverse in its scope
Encompasses the risks emanating from all
areas of business
Complex in causes, sources and
manifestations
One-sided, no risk/return trade-off inherent
to market and credit risks
No well established quantitative approaches
Fewer resources dedicated
Multiple skills required (know-how, self
learning capacity, etc.)
• Banks’ key resources = main risk drivers
for op risk!
• OpRisk: ~ 10 percent of total regulatory
capital
11
12. MANAGEMENT RISK - #1 OpRisk
Management Riskcomponents:
conflicts of interest
excessive pay levels
breach of
fiduciary
duty
mismanagement
unjust enrichment
waste of
corporate
resources;
45% of finance topmanagers prepared to
commit
economic
crimes
Figure: Conflict of Interest Sample
B Lenders/
Bank
AGENT
DFI's
Investors
TRUSTEE
E
A
E
Govt
PE Fund
Clients
E
E
D
E
E
A
D
A
POLICIES /
REGULATIONS
B
D
B
Client "A"
Client "B"
COMPETITORS
E = EQUITY D = DEBT A = ADVISORY
12
B = BIDDER
13. LEGAL RISK
Causes of legalrisk
materializing
Breakdown of the
enforcement ―industry‖
Legal risk components
law
Corruption
Political & Occult interests
Exploitation of loopholes
in
the law
• Financial products are not
protected neither with copyright,
nor licensing! –
• Business may be lost to nonbanking institutions
Legal proceedings (lawsuits) adversely affecting bank‘s
financial position, results of operation, liquidity,
resulting from:
- contracts;
- Torts;
- Derivative actions
Documentation risk – linked to information risk;
[Regulatory] Compliance – civil, administrative &
criminal liability of the company and/or its officers
[Cross-border] insolvency proceedings
13
14. REPUT RISK INCLUSION INTO THE ORM
• Reputation is a key asset of a fininstitution, as it represents the its past
and future prospects, describes its
attractiveness for the stakeholders, as
compared to competitors.
• Risk Quantification is difficult (IRM
runs RepTrak Pulse).
• 3 elements of RepRisk mngt:
(1) Crisis mngt (acute risks mngt) –
based on catastrophic OpRisk mgnt
(2) Risk mngt (latent reputational
challenges)
(3) CSR
• Main RepRisk mgnt measure –
efficient interaction with stakeholders,
as their human perceptions rule the fin
institution‘s reputation. Important to
define the real key stakeholders.
info
complexity
Broad
public
some real
power
Freer and
smaller
world
more threats, as
fears grow
14
>100
RepRisks
ranging from
“market
squeeze out”
and “identity
theft” to
ethical risks
in retail
lending and
politics
NGOs (int‟l
charity)
real
power;
governments
strength, that
of corporates
dwindle
15. Table of Contents
Pillar I. Operational Risk Management Setup1. Recent trends in the ERM
2. Introduction to ORM under and after Basel 2
15
16. BASEL-2 PILLARS ON OpRisk
Pillar 1Pillar 2
Pillar 3
Minimum Capital
Requirements
(Objective: limit risk taking)
Capital Adequacy
(Objective: Improvement of banks internal
risk management)
Disclosure
(as risk taking & management
tool)
Issues addressed under the supervisory review
process …
Capital Requirements for op risk
OpRisk Capital
Approaches:
Risk exposure and assessment
Operational risk
Disclosure
1.
Basic Indicator (BIA,
compulsory)
2.
Standardized (TSA,
ASA, optional)
Qualitative
3.
Advanced
Measurement (AMA,
optional)
-Strategy
Quantitative
-Definition
-Governance
Reference to „Sound Practices for Management
& Supervision of OR―
-Risk Quantification (explanation
of Data Aggregation
mechanism…)
-Risk management (limits, planning, etc.)
…
16
17. B2/PILLAR 1: ORM QUANTITATIVE & QUALITATIVE REQUIREMENTS
B2/PILLAR 1: ORM QUANTITATIVE & QUALITATIVEREQUIREMENTS
OpRisk Capital
allocation: 15%
of average 3-y
gross income
Rec: implement
sound practices
paper
Measured by Bank‘s Internal Systems
- BOD & Sr.Mngt involvement;
- Independent OR Function
-Systematic OR reporting integrated into mngt;
OR losses collection (3-5 yrs);
Scenario assessment
Regular Independent Review by internal &
external auditors;
Recognition of insurance
Business environment & internal control
Fixed % of Gincome by 8 bizlines
- BOD & Sr.Mngt
involvement;
-Responsibilities for OR
function& policies;
- OR loss collection;
- OR Monitoring;
- BizLine Mapping
17
18. STAGES OF ORM DEVELOPMENT IN A BANK
1819. GOALS OF OPERATIONAL RISK MANAGEMENT UNDER AMA
Assess- OR Potential Impact ;
Level of Control
Understand how OR
Incurred
Allocate
- Budgets for Risk Reduction;
- Capital
Increase results
Reduce Risks
Improve Product Quality
19
20. COMPLEX BASEL AMA RISK GOVERNANCE FRAMEWORK
ORM Tools &Processes
Policies
ORM Policy Design
Integration with other
applicable policies &
standards
RCSA
Loss data governance
Capital modeling & allocation;
Alignment with strategic planning
& accounting
Strategy & Objectives
OR mngt goals;
ORM Framework
design
Capabilities & skills
development
Governance &
Organization
- ORM Function Design
- Committee oversight
- Detailed Roles & Responsibilities;
- Resourcerequirements
Supporting
Systems
Businessrequirements
Vendor selection
Change management
Effective
ORM
Environment
20
Measures &
Reporting
KRI;
Internal ORM reporting flows;
External ORM disclosure
requirements
21. B2/PILLAR 2: PRINCIPLES FOR THE SOUND MANAGEMENT OF OpRisk (JUNE 2011)
OpRisk mngt is especially importantfor material & new products,
activities, processes & systems.
Fundamental Principles (PP 1-2)
Risk Management Environment (PP
6-10)
Monitor & report material ops risk
profiles & losses.
Risk Governance (PP 3-5)
Effective control & mitigation
change Risk Profile &/or Appetite
Role of Disclosure (P11)
21
22. FUNDAMENTAL PRINCIPLE 1: BOD’s Leadership
… and ultimate responsibility for strong ORM cultureInternal OR culture = a combined set of individual and corporate values,
attitudes, competencies and behavior that determine a firm‘s commitment to
and style of ORM.
BOD shall establish a code of conduct, identify acceptable business practices
and
prohibited conflicts.
Compensation policies shall be aligned to the company‘s risk appetite,
appropriately balancing risk and reward
BOD shall ensure the OR training available at all levels throughout the
organization.
22
23. RISK CULTURE
Includes:(1) Integrity and ethical values;
(2) Management philosophy & operating style;
(3) Organizational structure;
(4) Delegation of authority & responsibility;
Risk mgnt
indicators
Lessons learned
drives
Risk mngt info
-
BOD & sr mngt commitment
HR practices
- OR training and awareness campaigns;
- Working environment;
- Communication style (internal as
well as disclosure to stakeholders of
ORM practices and position)
Contribute
to
Risk events reporting
(5) HR policies and practices;
(6) Staff competencies.
Driven by:
Lead to
influences
Risk mngt process
creates
Risks values and
rewards s-m
23
Opportunities to
intervene
Actions
mitigate risk
to
Staff motivation
Risk
Optimizat
ion
thru staff
behavior
24. OP RISK APPETITE (ORA) “the amount and type of risk an organization is prepared to seek, accept or tolerate” (ISO 31100). Cost
/ benefit decision needed to define. OR morecomplex than CR and MaRisk, simple limits won’t suffice.
Setting ORA
Applying ORA
ORA must be owned by the MB and established
with its engagement.
Top-down cascade from the MB – bizlines add
detail, increase level of granularity
Qualitative expression = risk culture = series of
absolute statements in the biz strategy
Quantitative expression based on hard info,
combining KPIs, KRIs, KCIs. Might bear zerotolerance, compare to peer group.
ORA is based on agreed thresholds, that shall be
sufficiently sensitive to provide early warning
of potential ORA breaches, not hypersensitive
to ring needlessly.
Use RAG (Red-Amber-Green) scale to assign
status.
1.
-
-
Monitoring to early warn
Reporting INTEGRAL (complete, accurate,
timely) data by an appropriate party at an agreed
frequency;
Converting data to information by adding
context and interpretation.
2. Aggregation and reporting.
3. Decision making, as a choice between
Accepting the breach
Mitigating the breach & avoiding its recurrence
Intermediate management action (intense
monitoring, root cause analysis, investigating
the cist/benefit of mitigating action.
Escalation policy for events over a threshold or KRI
needed
24
25. Fundamental P2: OpRisk framework integrated into overall risk management processes
It depends on size, complexity and risk profile ofbank. Framework documentation shall:
- Identify the governance
accountabilities;
structures,
their
reporting
lines
and
- Describe risk assessment tools and their usage;
- set methodology for establishing and monitoring thresholds, or limits for
inherent and residual risk exposure;
- Establish risk reporting and management information systems;
- Provide for a common taxonomy of OR terms to ensure consistency of
risk identification, exposure rating and mngt objectives
25
26. B2: AMA – EXAMPLE OF ORM FRAMEWORK
2627. MANAGING OpRisk THROUGH FRAMEWORK
OR has been managed already before it has been „labelled― so:- „4-eyes―-principle,
- separation of functions,
- allocation of responsibilities and limits,
- internal controls and their review by auditors.
ORM has never been an integrated process, rather a set of fragmented activities to deal with a
wide variety of risks
ORM shall be a tenacious process, not a program
Prevention ahead of correction
Ongoing questioning of 6Ss- ―Strategy-Structure-Systems-Safety-Simplicity-Speed‖
Risk awareness with everyone;
Further the risk culture rather then controlling numbers
ORM for own sake ahead of its management for supervisors
OR now managed via a ―framework‖ since touches all aspects of bank
27
28. ORM FRAMEWORK IMPLEMENTATION
Find quantifiablemeans to track
OR;
Create Reporting
mechanism
Involve business
units
Invest in
automated data
gathering &
workflow
technologies
coomunication
channels (e.g. e-mail)
28
Developing&
refining
modeling
approach;
Create OpRisk
Data
Technology
Development
Implement
advanced tools
-risk indicators,
-scenario
analyses,
-business
process analyses
INTEGRATED MANAGEMENT
I
•describe
potential losses by
structured info
- preventive
measures for high
DENTIFICA
risk areas
- disseminate
information via
internal
MEASUREMENT
T
•Start
loss
collection
infrastructure
(internal losses,
ION
external losses)
ASSESSMENT
ORM FRAMEWORK IMPLEMENTATION
- Integrate OR
exposure data into
management
process;
-Engage
senior
mngt
-Manage
Exposures
-Invest
in
Processes (limited
tech & m/p
29. EXAMPLE OF COMPLEX ORM FRAMEWORK
(A) OpRisk ManagementInputs
(B) OpRisk Measurement
2. Use external
losses
3. BEICF
1. Identification
2. Assessment
(inherent risks)
RCSA
Audit reports
Risk Map
(before MA)
KRI
Scorecard
(before MA)
New
risks
4. Scenario Analysis
Scaling
Database of potential losses
Frequency distribution
Severity distribution
Monte Carlo Sim.
Gross loss distribution
Mitigating actions
Mitigating actions
Net loss distribution
3. Management
Risk Map
(after MA)
Scorecard
(after MA)
Capital calculation
Risk capital
Accept
Residual Risks
4. Reporting
Accepted
Risk Map
1. Track
internal losses
Capital allocation
Accepted
Scorecard
Quality of
BEICF
Reports
Outputs
29
CapUnit 1
CapUnit 2
Adjust
Adjust
CapUnit 1‘
CapUnit 2‘
Correlations
30. P6. Operational Risk Assessment
Assessment of operational risk in all material products, processes andsystems. Identification considers external and internal factors.
Tools include:
audit findings,
internal loss data collection and analysis,
external data collection and analysis,
risk assessment,
biz process mapping,
risk and performance indicators,
scenario analysis,
measurement,
comparative analysis (e.g. frequency and severity data with results of RCSA).
30
31. LOSS TYPES
Loss typeCauses
Monetary loss
Lost legal suit
External legal and other related costs in
response to an operational risk event.
Penalties paid to the regulator
Fines or the direct cost of any other penalties, such as
associated costs of license revocations – excludes lost/
foregone revenues
Loss or damage to assets
Neglect, accident, fire, earthquake
Reduction in the value of the firm‘s non-financial
assets and property
Restitution
Interest claims
Note: excludes legal damages
which are addressed under legal
and liability costs
Payments to third parties of principal and/ or interest, or
the cost of any other form of compensation paid to clients
and/ or third parties
Loss of recourse
Inability to enforce a legal claim on
a third party for the recovery of
assets due to an operational error
Payments made to incorrect parties and not recovered.
Includes losses arising from incomplete registration of
collateral and inability to enforce position using ultra
vires.
Fraud, misrepresented market
and/ or credit risk
Direct reduction in value of financial assets as a
result of operational events.
Legal and liability
Regulatory, compliance and
taxation penalties
Write downs
31
32. BASEL 2, 2D-CLASSIFICATION – EVENT/CAUSE
BASEDLossevent
categor
y
Causes
Processes
People
Systems
External events
Internal
fraud
(due to acts
intended to
defraud,
missapropri
ate
property,
circumvent
the law,
regulations
or corp
policy
involving 1
+ internal
party)
Clients,
External Employment
fraud
practices & products &
(due to acts workplace business
practices
intended to
safety
defraud,
(from
circumvent violations - (from
unintentional
the law by a
acts
3rd party); inconsistent /negligent
failure
to
with
employment, meet
health or safety professional
3 roles a laws/agreemen obligations to
specific
ts, from
bank can
/
play in fraud payment of clients
– perpetrator, personal injury product
design
vehicle, victim
claims, or
diversity/discri
mination
events)
32
Damage Business
Execution,
to
disruption & Delivery &
physical
system
Process
assets
failures
manageme
nt
(from failed
(from loss
(from
transaction
of damage disruption
business or processing or
of to by
process
natural
system
disaster or failures e.g. management,
other
telecoms,
relations
events)
utilities)
with trade
counterpartie
s & vendors)
33. OP LOSSES: CAUSE CATEGORIES & ACTIVITY EXAMPLES (1-3, 5)
OP LOSSES: CAUSE CATEGORIES & ACTIVITY EXAMPLES (1-3, 5)Internal Fraud
External Fraud
Employment
Practices &
Workplace
Safety
Damage to
physical assets
• Unauthorized Activity (transactions intentionally not reported; transaction type
unauthorized w/o monetary loss), intentional mismarking of position
• Theft and Fraud (Credit Fraud/ worthless deposits; Extortion / robbery /
embezzlement; misappropriation / malicious destruction of assets; forgery, check kiting,
account take-over; tax non-compliance/evasion; bribes/kickbacks$ insider trading (not on
firm‘s account)
• Theft & Fraud (Theft, Robbery, Forgery, Check kiting)
• Systems Security (Hacking Damage, theft of information w/o monetary loss)
• Employee Relations (Compensation, benefit, termination issues; organized labor activity);
• Safe Environment (general liability; employee health & safety rules events);
• Diversity & Discrimination (all discrimination types)
• Disasters and other events (natural disaster losses; human losses from external sources –
terrorism, vandalism)
33
34. OP LOSSES: CAUSE CATEGORIES & ACTIVITY EXAMPLES
OP LOSSES: CAUSE CATEGORIES & ACTIVITY EXAMPLESClients,
Products &
Biz
Practices
Biz
Disruption &
System
Failures
• Suitability, Disclosure & Fiduciary (fiduciary breaches / guideline violations; Suitability / disclosure (KYC, KYCC);
Retail customer disclosure violations, breach of privacy, aggressive sales; account churning, misuse of confidential
information;
• Improper Business / Market Practices (Antitrust; Improper Trade/Market practices;
• Product Flaws (product defects; model errors);
• Selection, Sponsorship & Exposure ((Failure to investigate client; Exceeding client exposure limits);
• Advisory Activities (disputes over their performance)
• Hardware;
• Telecommunications;
Software
Utility outage / disruptions
• Transaction Capture, Execution & Maintenance (Miscommunication, Data entry / maintenance /
loading error; Misused deadline / responsibility; model/system mis-operation; Accounting / entity
attribution error; other task mis-performance; delivery failure; collateral management failure;
reference data maintenance);
• Monitoring & Reporting (failed mandatory reporting obligation; inaccurate external report)
Execution, • Customer Intake & Documentation (client permissions/disclaimers missing; legal documentation
Delivery & missing/incomplete);
Process • Client Account Management (unapproved access provided to accounts; incorrect client records (loss
incurred); negligent loss or damage of client assets)
Mngt
• Trade Counterparties (non-client counterparty mis-performance; non-client counterparty disputes)
• Vendors & Suppliers (Outsourcing; Vendor Disputes)
34
35. 3D OPERATIONAL LOSS CLASSIFICATION
2.Event
Types
1.
Business
Lines
Corporate
Finance
Trading &
Sales
1
2
Internal
fraud
External
fraud
3
Employment
practics &
workplace
safety
4
Clients,
products &
business
practices
Retail Banking
Commercial
Banking
Payment and
settlement
Agency
services
Asset Mgt
Retail
brokerage
35
5
3. Loss types
6
Damage to
Business
physical
disruption &
assets
system failures
7
Execution,
Delivery &
Process
management
36. RISK MANAGEMENT ENVIRONMENT
-OpRisk shall be managed asa distinct category of risks
-Set principles for OpRisk
mngt
-Subject ORM framework to
audit
-Sr mngt responsible to implement an ORM framework
P7: Senior mgt ensures existence of approval process for all NEW
products, activities, processes and systems. Review and approval process
should consider inherent risks, changes in the risk profile, necessary
controls, risk mngt processes & mitigation strategies, the residual risk,
the procedure and metrics to measure monitor and manage the risk of
new products. Special attention to M&A that can undermine bank‘s
ability to aggregate and analyze info across risk dimensions.
P8: Senior mgt ensures regular monitoring by appropriate reporting
mechanisms. Reports shall:
(1)Be manageable in scope and volume,
(2) Be Timely
(3)Include breaches of the thresholds/limits, details of significant internal
OR loss events, relevant external events
P10: Bank should have business resiliency and continuity plans.
36
37. RISK MANAGEMENT CONTROL ENVIRONMENT (P9)
I.Internal controls:
II. Risk mitigation
strategies
1)
clearly established authorities for approval;
2)
3)
monitoring of adherence to assigned risk thresholds / limits,
safeguards to access to bank assets and records;
4)
5)
6)
HR: appropriate staffing + a 2-weeks vacation policy;
regular reconciliation of accounts;
process automation coupled with sound techno governance and
infrastructure RM programs;
1)
top-level progress reviews,
2)
review of treatment and resolution of instances of noncompliance,
3) tracking reports and approved exceptions.
NB! Assignment of conflicting duties without dual controls / other
countermeasures may enable concealment of losses, errors, etc.
Areas of potential conflicts of interest should be identified
minimized and subjected to monitoring and review.
III. Risk transfer
strategies
Risk transfer through insurance
37
38. Table of Contents
Pillar I. Identification Tools1. Risk and Control Self Assessment (RCSA)
2. Key Risk Performance and Control Indicators
3. Risk-based Business Process Management
38
39. Table of Contents
Pillar I. Identification Tools1. Risk and Control Self Assessment (RCSA)
2. Key Risk Performance and Control Indicators
3. Risk-based Business Process Management
39
40. MAIN OPERATIONAL RISK MANAGEMENT TOOLS
Standardizedregistration
Interviews,
surveys
Qualitative
assessment
Risk mapping
Priorities setup
Centralized
storage
Risk and
Control SelfAssessment
Loss event RCSA approval
Database Quantitative loss
assessment
Process descriptions
Weaknesses search
OpRisk testing
Analysis (KRI,
limits)
Risk monitoring
Scenario
Modeling
& Analysis
Key Risk
Indicator
s
Trend analysis
Comparisons
Reasoning
Proactive
management
Reengineering
42
41. RCSA: PROACTIVE RISK IDENTIFICATION & MANAGEMENT TOOL
RCSA: PROACTIVE RISK IDENTIFICATION & MANAGEMENT TOOLBasel 2 AMA requirement under
business factors and internal
control environment: ―Banks
should identify the OpRisk inherent
in all types of products, activities,
processes and systems‖.
Allows to coordinate / integrate
the
risk
identification
and
management.
5 aspects to consider
Focus
Timing
Ownership
Reporting
Continuity
Business lines & support functions assess risks &
controls in their area;
RCSA provides systematic means to identify
- Risk clusters (concentrations),
- Control duplications / gaps or over-controls
and to set up:
- prevention & control measures and
- corrective action plans;
Original Internal Audit tool, facilitates a risk-focused
approach to Internal Audit;
Complimentary Management Tool, generally accepted
to satisfy corporate governance & regulatory
requirements.
RCSA proactive as opposed to Op Loss Reporting
Allocates front line responsibility for ORM and place
control directly with management – hence, corrective
actions more effective & timely;
Creates a cultural change in the institution
41
42. RCSA AIMS
RCSA aims at:- identifying OpRisks;
- assessing (incl. quantifying) the institution‘s exposure to OpRisks;
- evaluating the prevention & control system; and
- mitigating the risks
1
7
Establish a contact
with risk owners
2
Management
awareness
8
Qualitative risk
assessment
6
Designing
mechanisms of
managing risks
5
Actions approvals
4
3
Get details on
typical risk events
42
Setting up priorities
Event analysis,
rating assignment
43. RCSA MILESTONES
Define Business Objectives / Risk Tolerance / Appetite (as to residual risk)(entrepreneurial aspects, change programs, insurability etc)
Identify & Evaluate the Intrinsic OpRisks / Risk Drivers of each activity
and Institution’s Risk Profile
Naturally inherent risks, ―net‖of the prevention & control environment
Evaluate the quality of Existing Prevention & Control Systems,
enabling Risk Reduction
the existence & ef-(de)fectiveness of systems of detecting and preventing risks and/or their capacity to reduce
the financial impact and responsibility for controls (NB! excessive controls & their re-allocation)
Reduce Exposure to Residual OpRisks of each
activity
after
counting the prevention & control environment, excl. insurance
Corrective Action Plans / Risk Mitigation Plans (RMPs)
Exterminate weak areas in prevention & control by implementing that plans based on RCSA outputs and risk/reward
judgments
43
44. RCSA WORKFLOW
Define theimplementation
mode / Document
the process
Update KRIs, adjust
scenario analysis,
enhance controls &
training
Follow-up the
implementatio
n
Identify &
assess
OpRisks (incl.
scoring)
Identify
Controls
(Preventative
& Detective)
Controls
improper/
inexistent
Assess & rate
the controls
(ex-ante & expost)
Reporting
Results /
analyzing
residual risks
44
Controls
work/
exist
45. RCSA TOOLKIT-3: OpRisk MAPPING
Riskregister
(also for
output)
Org Level
Risk Map as
per
organizational
unit (risk
owner)
High level
business
process (e.g. HR
Mngt)
Process
Bank subprocess/task (e.g.
hiring)
Used for process risk analysis
Specific risks (e.g.
hiring crooks), can
be mapped to
multiple categories
45
Sub-process
Risk
Control / Mitigant
(general/specific)
- documented?
- manual/system?
- line/independent?
- Frequency?
Determine
risks not
identified in
the
repository;
Implant
SOFT
CONTROL
S
(communica
tion, degree
of trust to
managers,
aware of
procedure,
mgnt style;
ethics)
46.
47. INPUT OpRisk MAPPING SAMPLE
4748. MANAGEMENT RESULTS REPORTIG TOOLS
Unless RCSA results arerelevant for management
decision making, the
exercise is no more than
an expensive awareness
tool
Output Risk
Dashboard
RM Strategy
Mngt Reporting thru:
dashboards / heat maps /
scorecards
Heat Map
Action
(Risk
Mitigation)
plans
48
• Chart with risk
parameters by event types
and BUs
• Frequency-Severity
chart with typical risk
• Suggestions / plans
for risk mitigation
49. OUTPUT RISK SCORECARD
4950. HEAT MAPPING
facilitates the assessment of the likelihood and impact of the riskmaterializing; Can also be used to help determining the “top”
risks
Frequency-Severity Matrix
Frequency-Severity-Control Matrix
50
51. OPERATIONAL FREQUENCY – SEVERITY RISK MAPPING
HighChecks and
accounts fraud
Errors,misses
Frequency
Score Card
Bank
must
determine a scoring
system to quantify
/ express:
•Intrinsic (initial)
risk
•Effectiveness
(rating) of controls
•Losses and their
frequency expected
(given
current
controls)
•Residual
risk
(taking above 3 into
account)
Cash desk
errors
Clients‘
claims
Card fraud
Hacking
Internet fraud
Treasury
operations
Software
Unauthorized
migration,
access
Dismissal of key updates
personnel
Connections
disruptions
Credit files
missing
Legislation
breaches
M&A
Low
Severity
Low
51
Model risk
Reporting
mismarking
Natural disasters
High
52. RCSA FOLLOW UP
RCSA results ought to be used in conjunction with otherof ORM Framework.
components
Internal Event Data:
-Highlight areas susceptible to OpRisk loss events;
-Reassures quality of RCSA
External loss data
-RCSA Identifies areas of vulnerability that may benefit from considering
fast-track external data;
-Data helps determining potential weaknesses / inherent risks for RCSA
Scenario analysis
-RCSA results serve a valuable input source;
-Defining risk scenarios leads to identifying risk factors failed to be
captured within RCSA.
Timing / Frequencies of further RCSA exercise
-Annual for key processes;
-More frequent for high risk areas;
-Following major changes (e.g. after a merger).
NB! End before annual budgeting process.
52
53. Table of Contents
Pillar I. Identification Tools1. Risk and Control Self Assessment
2. Key Risk, Performance and Control Indicators
3. Risk-based Business Process Management
53
54. SOUND PRACTICE
Basel Committee on Banking SupervisionPrinciples for the Sound Management of Operational Risk, June 2011
Indicators approach is listed as an example of tools that may be used for identifying and
assessing operational risk:
―Risk and performance indicators are risk metrics and/or statistics that provide insight into a
bank’s risk exposure. Risk indicators, often referred to as Key Risk Indicators (KRIs), are used to
monitor the main drivers of exposure associated with key risks. Performance indicators, often
referred to as Key Performance Indicators (KPIs), provide insight into the status of operational
processes, which may in turn provide insight into operational weaknesses, failures, and potential loss.
Risk and performance indicators are often paired with escalation triggers to warn when risk levels
approach or exceed thresholds or limits and prompt mitigation plans‖
54
55. LET FIGURES TALK
Indicators Approach allows to track operational risk profile and monitor riskexposure with series of quantitative measures describing certain risk areas, scale of
operations and control procedures
Best use:
Quantitative analysis while no risk event collection
Early check up and qualitative projections
Benchmarking of risk owners
Targeted decision-making
Validation of other identification tools
55
56. INDICATORS COMPOSITION and DATA SOURCES
Key RiskIndicators
(KRI)
INDICATORS
SET
Key
Performance
Indicators
(KPI)
Key Control
Indicators
(KCI)
56
57. KEY RISK INDICATORS (1/2)
KRIs are the measures summarizing the frequency, severity and impact of OpRisk riskevents or corporate actions occurred in the company during a reporting period
Risk dimension
Frequency
Indicators type
Number of risk events
Volume of risk events
Severity
Average risk losses
Maximum duration of disruptions
Total amount of risk losses
Impact
Cost of mitigations
57
58. KEY RISK INDICATORS (2/2)
Branch networkLoan / Client department
• Number of complaints and claims to the company
• Average days of getting loan approval
• Number of lost clients
• Number of identified fraudcases
• Amount of compensation paid to the client
• Client dissatisfaction evidenced by client surveys
• Volume of balances lost / opportunity cost
• Number of critical errors detected in credit files
Legal department
Finance department
• Number of legal actions against the company / thirdparties
• Volume of penalties, imposed by regulators
• Volume of legal actions against the company / thirdparties
• Total amount of suspicious transactions
• Number of regulatory enquires / legislation breaches
• Number of late completion or non-completed transactions
Human resources
IT
• Turnover of experienced staff
• Number of failures related to IT system and other equipment
• Number of temporary/short term staff
• Number of calls to help desk on IT system and other
equipment
• Number of employees, attended training courses
• Average down-time of IT system and other equipment
• Number of employees, failed to pass mandatory evaluation
• Increase in transaction load on systems
58
59. KEY PERFORMANCE INDICATORS
KPIs are the measures that evaluate scale of banking activities. According to manyempirical observations that is directly related to operational risk exposure
Extension Risk
PeopleRisk
• Gross Income
• Number of Employees
• Total Assets
• Staff Payroll
• Book Value of Fixed Assets
• Income per Employee
• Cost to Income
• Cost per Employee
Customer / ReputationalRisk
Process Risk
• Number of client accounts
• Volume of transactions
• Volume of client accounts
• Number of transactions
• Average balance of single client account
• Average amount of single transaction
59
60. KEY CONTROL INDICATORS
KCIs are the measures that enables to monitor effectiveness of OpRisk managementprocedures established in the company, collected from business units, Risk
management, Internal Audit reports, and Regulators
Business Units
Risk management
• Number of breaches identified by the staff
• Number of days before breaches are
identified
• Number of disciplinary actions taken
• Number of action plans introduced
• Percentage of loss mitigation
• Number of action plans failed to implement
Internal Audit
Regulators
• Number of breaches in processes identified
by internal audit
• Number of claims on the company in the area
of
OpRisk made by the regulator
• Number of breaches eliminated
• Number of errors eliminated
60
61. DATA SOURCES
Business unitsreporting
MIS
2
Risk event
database
Key Risk
Indicators
(KRI)
Financial
reporting
MIS
1
INDICATORS
SET
Key
Performance
Indicators
(KPI)
3
Key Control
Indicators
(KCI)
61
Internal audit
reports
Risk event
database
62. DATA COLLECTION FREQUENCY
Medium bank updates KRIs/KPIs more frequently, than other identification tools,typically on monthly and rarely quarterly time periods
SOURCE: Observed range of practice in key elements of Advanced Measurement Approaches (AMA). BCBS, July 2009
62
63. DATA ANALYSIS (1/2)
DATA BREAKDOWNSUpright
Horizontal
Peers
All bank
Headquarter
Branch network
Business lines
Departments
Branches
63
64. DATA ANALYSIS (2/2)
Trend analysisRetrospective
Business plan
Thresholds Control
Regressions
Peers KPI
comparison
Peers line
Average (optimal)
64
Alarm levels (STD)
Limits (exceptions)
Risk Class
65. REPORTING MATRIX
Reporting AreaRisk
Owner
Risk
Man
Audit
OR
Com
MB
• Monthly
R
C
-
-
-
• Quarterly
R
C
R
-
-
• Annually
-
-
R
-
-
• Monthly
I
R
-
I
-
• Quarterly
-
-
I
I
I
• Quarterly
-
R
I
I
I
Peers Comparison /
• Quarterly
-
R
I
I
I
Thresholds check
• Annually
-
R
I
I
I
Risk indicators collection
Retrospective indicators /
Regression forecasts /
Frequency
Thresholds check
Business plan indicators /
Thresholds check
65
66. DECISION MAKING MATRIX
ObservationsRisk
Owner
Risk
Man
Audit
OR
Com
-
C
R
C
-
-
• Put the risk owner in a watch list
-
R
-
-
-
I/A
• Prepare action plan
R
C
-
-
R
-
I/A
Negative tendency
• Approve and monitor the plan
(Risk Class = 1)
• Set thresholds
-
R
-
A
• Written explanation of the breach
R
-
-
• Activate contingency plan
-
-
I/A
Limit overriding
• Issue a summons to ORCom
R
R
-
I/C
(Risk Class = 3)
• Make unplanned audit inspection
-
R
I/C
-
Sudden outliers
(Risk Class = Watch)
Alarm threshold breach
(Risk Class = 2)
Decision Making Options
• Contact risk owner
• Find out the reason
66
C
R
67. Table of Contents
Pillar I. Identification Tools1. Risk and Control Self Assessment
2. Key Risk, Performance and Control Indicators
3. Risk-based Business Process Management
67
68. SOUND PRACTICE (1/2)
Basel Committee on Banking SupervisionPrinciples for the Sound Management of Operational Risk, June 2011
Business Process Mapping is listed as an example of tools that may be used for identifying
and assessing operational risk:
―Business process mappings identify the key steps in business processes, activities and
organisational functions. They also identify the key risk points in the overall business process.
Process maps can reveal individual risks, risk interdependencies, and areas of control or risk
management weakness. They also can help prioritise subsequent management action.‖
Principle 7: Senior management should ensure that there is an approval process for all
new products, activities, processes and systems that fully assesses operational risk
68
69. SOUND PRACTICE (2/2)
The review and approval process should consider:a) inherent risks in the new product, service, or activity
b) changes to the company‘s operational risk profile and appetite and tolerance, including
the risk of existing products or activities
c) the necessary controls, risk management processes, and risk mitigation strategies
d) the residual risk
e) changes to relevant risk thresholds or limits
f) the procedures and metrics to measure, monitor, and manage the risk of the new
product or activity
69
70. DIVE IN PROCESSES
Business process is a collection of linked activities that consume inputs, add value, andproduce an output of value to an internal or external customer
Process risk is the type of operational risk arisen from inadequate or improper
internal business processes in the companys and lack of built-in control mechanisms
70
71. BUSINESS PROCESS MANAGEMENT TOOLS
Process engineeringProcess initiation document
As Is:
Flowchart
Activity flow diagram
RACI matrix
Process metrics analysis
To Be:
Activity flow diagram
RACI matrix
Implementation plan
71
72. HOW RISK MANAGEMENT SIGN OFF THE PROCESS?
PROCESSBENEFICIERY
BUSINESS
DEVELOPMENT
ENDORSING
DEPARTMENTS
RISK
MANAGEMENT
Risk judgment:
Approve
Review
Decline
Control suggestions
Risk map
Key Risk Indicators
Thresholds
Testing
72
BUSINESS PROCESS
COMMITEE
MANAGEMENT
BOARD
INTERNAL AUDIT
73. PROCESS RISK MAP
Process risk map is composed and monitored by Risk managementon the basis of key workflows with the idea to identify and control inherent OpRisks
High priority risks should be mitigated before the new process is launched
73
74. RISK CONTRIBUTION TO FLOWCHART
Quality controls make the flowchart telling what goes wrong or well in business processRisk controls
Risk
qualitative
judgment
Risk and Control
indicators
Areas of
comfort / concern
Timeline:
gross and
by operations
74
75. Table of Contents
Pillar II. Risk Measurement and Analysis1. Risk event data collection
2. Capital Requirement
3. Scenario analysis
75
76. Table of Contents
Pillar II. Risk Measurement and Analysis1. Risk event data collection
2. Capital Requirement
3. Scenario analysis
76
77. SOUND PRACTICE
Basel Committee on Banking SupervisionPrinciples for the Sound Management of Operational Risk, June 2011
Loss data collection is listed as an example of tools that may be used for identifying and
assessing operational risk:
―Internal Loss Data Collection and Analysis: Internal operational loss data provides meaningful
information for assessing a bank’s exposure to operational risk and the effectiveness of
internal controls. Analysis of loss events can provide insight into the causes of large losses and
information on whether control failures are isolated or systematic.‖
―External Data Collection and Analysis: External data elements consist of gross operational loss
amounts, dates, recoveries, and relevant causal information for operational loss events occurring at
organisations other than the company. External loss data can be compared with internal loss
data, or used to explore possible weaknesses in the control environment or consider
previously unidentified risk exposures‖
77
78. RISK EVENT DATA COLLECTION
Risk event database is a register of risk event records that enables to accumulate,classify, keep and export data relevant to observed internal and external risk events
SOURCE: Sungard BancWare
78
79. WHY COLLECT DATA?
3ORCom
Decision
Making
4
Key Risk and
Control
Indicators
Risk
Reporting
2
5
Verifying
Audit Reports
RISK EVENT
DATABASE
Immediate
Actions
1
6
79
Advanced
Measurement
Approach (AMA)
80. DATABASE DEVELOPMENT
Week 1Week 3
Week 2
1. Classify business
lines, risk, loss types
2. Define risk event
data and data
sources
3. Make database,
reporting templates
4. Management
buy-in, assign roles
5. Test the process
80
Week 4
Month 2
Month 3
81. DATABASE CLASSIFICATORS (1/2)
Business AreasRisk event types
Loss Types
Corporate Finance
Internal fraud
Direct
Trading & Sales
External fraud
Retail Banking
Employment Practices
and Workplace Safety
Client compensations
Staff payments
Replacement costs
Fees and penalties
Write-offs
Pending Losses
Commercial Banking
Payment and Settlement
Agency Services
Asset Management
Retail Brokerage
SOURCES:
1. BASEL II Framework, Annexes 8 and 9
Clients, Products &
Business Practices
Damage to Physical Assets
Business disruption and
system failures
Execution, Delivery &
Process Management
2.Operational Risk – Supervisory Guidelines for the AMA. BCBS, June 2011
3.Operational risk reporting standards. ORX, Edition 2011. Appendix – Detailed
Description of Data Categories
81
Provisions
Indirect
Timing losses
Opportunity costs
Enhancement costs
Insurance premiums
82. DATABASE CLASSIFICATORS (2/2)
Practical considerationsCoding classes (Size and Filtering)
Low-level breakdowns of first-rank classes
Cross classes matrixes
Risk Type – Costs
Business Line – Risk Type
82
83. RISK GRANULARITY
BASEL II Framework:A bank's risk measurement system must be sufficiently 'granular' to capture the
major drivers of operational risk affecting the shape of the tail of the loss
estimates
Medium bank has from
20 to 100 risk categories
as listed in Basel II
default scheme
SOURCE: Observed range of practice in key
elements of Advanced Measurement
Approaches (AMA). BCBS, July 2009
83
84. WHAT DATA ARE ESSENTIAL TO COLLECT?
RECORD DETAILSIDENTIFICATION
ACTIONS
• Record date
• Date of discovery
• Actions taken
• Risk owner
• Observer
• Actions to be taken
• Risk Coordinator
• Description
• Recovery
RISK EVENT DESCRIPTION
EVALUATION
AUTORIZATION
• Date of occurring
• Direct loss type
• Line Manager
• Event type
• Amount of losses
• Risk Manager
• Risk type
• Date of accounting
• Dates of approval
• Risk object
• Indirect losses
• Corrections
• Description
• Effect of risk event
• Data source
• Cause
• Qualitative Assessment
NOTE: Key information for risk judgment is highlighted blue
84
85. DATABASE FUNCTIONAL MAP
AMARisk
Management
Debugging
Data
Upload
Data contributors
1.
2.
3.
4.
5.
Risk owners
Audit reports
IT register
Book entries
Media
KRI
Database
Report
configurator
Reports
Development
platform
Report
frequency
1. Excel-based (Pivot tables)
2. Professional (Data cube)
1. Daily
2. Monthly
3. Quarterly
85
86. DATA COLLECTION WORKFLOW
Bank Staff•Identify risk event
•Inform
Coordinator
Coordinator
•Examine the
details of risk event
•Report to Line
Manager and Risk
Manager
•Fill up the form of
risk event record
Real time
Real time
Line Manager /
Coordinator
•Discuss the details
of risk event
•Make suggestions
on risk mitigation
•Line Manager
reviews and
approves the record
•Coordinator
submit the record to
Risk Manager
Risk Manager /
Coordinator
•Risk Manager
reviews and
approves the record
•Risk Manager and
Coordinator sort
out risk events
•Risk Manager
prepares regular
reporting
Risk Manager /
Line Manager
•Agree on
consistency of
database
•Review findings
and make
suggestions on risk
mitigation
Within 24 hours
Within 48 hours
86
Monthly
87. DATA COLLECTION: DIFFICULTIES AND SOLUTIONS
DifficultiesLack of knowledge which information to be reported
Fear of error acknowledgement and punishment
Feeling solidarity
No motivation
Lack of automation
Solutions
System of risk coordinators, functional subordination
Formal procedure / Typical risk map
Higher salary / Bonus / Penalties
Premiums for rationalization proposals
Anonymous hot line
Data verification – KPI, head office registers, B/S accounts
Automation
Evaluation / Team building events
87
88. KEY DATES OF DATA COLLECTION
SILENCE PERIOD ≤ 2 DaysDate of
Occurrence
Date of
Discovery
Date of
Reporting
Date of
Date of
Accounting
Settlement
SOURCE: Observed range of practice in key elements of Advanced Measurement Approaches (AMA). BCBS, July 2009
88
89. SPECIFIC EVENT TYPES (1/3)
OpRisk event is an event leading to the actual outcome(s) of a business processto differ from the expected outcome(s), due to inadequate or failed processes,
people and systems, or due to external facts or circumstances
Single event
Repeated mistakes due to a process failure
Multiple impacts from a single cause
Fraud losses connected by a common plan of action
A technology outage which affects multiple business lines
Multiple errors made by a single individual over a period of time
SOURCE: Operational Risk Reporting Standards. ORX, Edition 2011
89
90. SPECIFIC EVENT TYPES (2/3)
Linked event – a single event, which impacts more than one business linethe owner of thetransaction
business process out of which the event arose
the business with the largest P&L impact
to multiple business lines based on P&L split
Where register
losses?
SOURCE:
1.Operational Risk Reporting Standards.
ORX, Edition 2011
2.Observed range of practice in key
elements of Advanced Measurement
Approaches (AMA). BCBS, July 2009
90
91. SPECIFIC EVENT TYPES (3/3)
Near-misses – operational risk events that did not lead to a loss, but hadthe potential to do so
IT disruptions outside working hours
Fault in transmitting erroneous mandatory reports
Cancelling doubled printed trading order
Grow cold when air condition system is out of operation
Operational risk gain events – operational risk events that generate a gain
Trading limit was not observed but position win
Product mis-selling that yield profit for the company
Making mistake in setting FX rate that brought larger income
SOURCE:
Operational Risk – Supervisory Guidelines for the AMA. BCBS, June 2011
91
92. SPECIFIC LOSS TYPES (1/2)
OpRisk loss – a negative and quantifiable impact on the P&L due to OpRisk eventSingle loss – a total amount of all OpRisk losses pertained to a single loss event
Grouped losses are OpRisk losses with the same underlying cause that arise
from single events within a Business Line and between Business Lines.
For risk calculation and reporting purpose grouped losses have to be
considered and recorded as a single ―root event‖
Root loss – the initial single event without which none of the grouped related
losses would have occurred
SOURCE: Operational Risk Reporting Standards. ORX, Edition 2011
92
93. SPECIFIC LOSS TYPES (2/2)
Example: Disease Outbreak in HongKongLate Transaction
Settlement
External
consultants costs
Disinfect
building costs
Total
Comment
100K
250K
50K
400k
Linked Event
Retail Banking
200k
100k
300k
Linked Event
Asset Mgt
300k
50k
350k
Linked Event
CFinance
100k
5k
105k
Linked Event
850k
205k
1.155k
Grouped loss
Trading & Sales
Total
100k
Risk event type:
Disasters & Public Safety / Natural Disasters & Other Events
Amount of
Loss:
1.155k
SOURCE: Operational Risk Reporting Standards. ORX, Edition 2011
93
94. EXTERNAL LOSS DATA (1/4)
Lack of internalobservations
Number of
observations
Low
confidence
level for
measuring
risk
No data
integrity
and
granularity
Max accuracy
Number of tail
observations
(1%)
20
95%
-
100
99%
1
99,9%
10
Accuracy
OpVaR
20
95%
124,123
100
95%
159,134
1,000
95%
160,813
1,000
Number of
observations
94
Incorrect
decision
making
Need for
external
data
95. EXTERNAL LOSS DATA (2/4)
External loss data are collected to enlarge sample of high severity eventsMedium international banks rely more on outsourcing rather than own sources
Many banks are scaling external data for their parameters
SOURCE: Observed range of practice in key elements of Advanced Measurement Approaches (AMA). BCBS, July 2009
95
96. EXTERNAL LOSS DATA (3/4)
Key informationBusiness line / Event type
Causes / Consequences
Amount of loss
Amount of recovery
Period of recovery
Scale of operations
100
97. QUIZ: EXTERNAL LOSS DATA – local examples
Internal fraudExternal fraud
Reputational risk
Products and processes
□
□
□
□
□
System failures and disruptions
□
External events
□
□
97
98. RISK EVENT DATA REPORTING MATRIX
Reporting AreaReporting time
Risk
Owner
Risk
Man
Audit
OR
Com
MB
Typical loss risk event
• Immediate
R
C
-
-
-
Large loss risk event
• Immediate
R
C/R
I
I
I
Risk events observed
• Daily
R
C/R
-
I
-
Register check
• Monthly
C/A
R
I
-
-
Register report
• Monthly
I
R
I
I
-
Summary report
• Quarterly
I
R
I
I
I
98
99. KEY RISK REPORTS: 8x7 Matrix
Report shows distribution of frequency, severity and loss amount by business/risk typesSOURCE: Results from the 2008 Loss Data Collection Exercise for Operational Risk. BCBS, July 2009
99
100. KEY RISK REPORTS: 8x7 Matrix
Report shows distribution of frequency, severity and loss amount by business/risk typesSOURCE: Results from the 2008 Loss Data Collection Exercise for Operational Risk. BCBS, July 2009
100
101. KEY RISK REPORTS: Severity Distribution
Report shows distribution of frequency and loss amount by loss severity brackets101
102. KEY RISK REPORTS: Summary Report
Report aggregates frequency and loss amount by business / risk types102
103. KEY RISK REPORTS: Register Report
Report lists key parameters of risk events collected in database during reporting period103
104. MANAGEMENT BUY-IN
DATABASE SET INCLUDES:Classifications matrixes
Data structure
Reporting templates
Workflow guidelines
Job descriptions of key involved parties
Testing group / Action plan
REVIEW:
Operational Risk Committee
APPROVAL:
Management Board
104
105. Table of Contents
Pillar II. Risk Measurement and Analysis1. Risk event data collection
2. Capital Requirement
3. Scenario analysis
105
106. SOUND PRACTICE
Basel Committee on Banking SupervisionPrinciples for the Sound Management of Operational Risk, June 2011
―Measurement: Larger banks may find it useful to quantify their exposure to operational risk by
using the output of the risk assessment tools as inputs into a model that estimates operational risk
exposure. The results of the model can be used in an economic capital process and can be allocated
to business lines to link risk and return‖
Basel II Framework
Calculation of minimum capital requirements
106
107. MEASUREMENT APPROACHES
Complexity | implementation CostsMEASUREMENT APPROACHES
Scorecard
Approach
Scenario Based
Approach
(SBA)
Advanced
Measurement
Approach
(AMA)
Loss
Distribution
Approach
(LDA)
Internal
Measurement
Approach
(IMA)
Alternative
Standardized
Approach
(ASA)
The
Standardized
Approach
(TSA)
Basic
Indicator
Approach
(BIA)
Deviation of Capital Charge | Opportunity
Costs
107
108. SELECTION CRITERIA
Complexity or intensity of bankingoperations
Meeting qualitative standards
Partial use
Restriction to revert to a simpler approach
108
109. BASIC INDICATOR APPROACH (1/2)
The simplest approach based on linear dependence between income as keyexposure indicator and capital charge behind OpRisk
Advantages:
▪ Simplicity
Shortcomings:
▪ Linear relationship with exposure indicator
▪ Non-specific to business type
▪ Exposure indicator is distorted with business cycle
(lower in downturn, higher in upturn)
109
110. BASIC INDICATOR APPROACH (2/2)
IndicatorYear 1
Year 2
Year 3
Net Interest Income
(100)
15
20
Interest Income
100
150
250
Interest Expenses
(200)
(135)
(230)
35
13
17
Non-interest Income
45
48
29
Non-interest Expenses
(10)
(35)
(12)
Additions (not excluded)
5
7
8
Provisions (for unpaid income)
4
5
7
Operating expenses (outsourcing fees paid)
1
2
1
(5)
(3)
(2)
Realized P&L on securities in BB
(5)
(3)
(1)
Extraordinary items
0
0
(1)
(70)
25
35
Net Non-interest Income
Deductions (to be excluded)
Gross Income
Capital Charge with BIA
(25+35)/2 ∙ 0.15 = 4.5
110
111. THE STANDARDIZED APPROACH (1/3)
More accurate approach sensitive to business line segmentationAdvantages:
▪ Fairly simple
▪ Specific to business type
Shortcomings:
▪ Linear relationship with risk driver
▪ Exposure indicator is distorted with business
cycle (lower in downturn, higher in upturn)
111
112. THE STANDARDIZED APPROACH (2/3)
IndicatorCorpor
ate
finance
Tradin
g and
Sales
Retail
Bankin
g
Comm
ercial
Bankin
g
Payme
nt and
Settle
ment
Agenc
y
Servic
es
Asset
Mana
geme
nt
Retail
Broke
rage
Total
0
(20)
200
(270)
15
2
3
0
(70)
18%
18%
12%
15%
18%
15%
12%
12%
-
Capital Charge
0
(3.6)
24
(40.5)
2.7
0.3
0.36
0
<0
Gross Income
5
15
80
(-90)
12
1
2
0
25
Beta
18%
18%
12%
15%
18%
15%
12%
12%
-
Capital Charge
0.9
2.7
9.6
(13.5)
2.16
0.15
0.24
0
2.25
Gross Income
2
(5)
20
10
5
2
1
0
35
Beta
18%
18%
12%
15%
18%
15%
12%
12%
-
Capital Charge
0.36
(0.96)
2.4
1.5
0.96
0.3
0.12
0
4.68
Year 3
Year 2
Year 1
Gross Income
Beta
Capital Charge with TSA
(2.25+4.68)/3 = 2.31 < 4.5 (BIA)
112
113. THE STANDARDIZED APPROACH (3/3)
Minimum qualifying criteria for TSA:Management oversight of ORM framework
Soundness and integrity of ORMsystem
Sufficient resources in ORM across major business lines, control and audit
Specific policies developed and criteria documented for mapping gross
income for current business lines and activities
113
114.
ALTERNATIVE STANDARDIZED APPROACH (1/3)A modification to TSA encompassing volume exposure indicator
Advantages:
▪ Fairly simple
▪ Specific to business type
▪ More stable prediction through business cycle
Shortcomings:
▪ Linear relationship with exposure indicators
114
115. ALTERNATIVE STANDARDIZED APPROACH (2/3)
IndicatorYear 1
Year 2
Year 3
Average
2,200
2,500
2,850
2,517
2,000
2,500
2,750
2,417
SME loans treated as retail
500
400
650
517
Purchased receivables
50
100
150
100
(350)
(500)
(700)
(517)
Retail loans
Outstanding loans
Retail loans
Provisions
Corporate loans
Exposure indicator
(0.035 ∙ 2,517) = 88
Outstanding loans
4,150
5,375
6,050
5,192
Corporate loans
3,000
3,500
3,750
3,417
Sovereign / Bank / Specialized lending
500
750
1,000
750
Securities held in BB
250
300
350
300
1,000
1,400
1,650
1,350
Purchased receivables
250
375
400
342
Provisions
(850)
(950)
(1,100)
(967)
SME loans treated as corporate
Exposure indicator
(0.035 ∙ 5,192) = 182
115
116. ALTERNATIVE STANDARDIZED APPROACH (3/3)
IndicatorCorpor
ate
finance
Tradin
g and
Sales
Retail
Bankin
g
Comm
ercial
Bankin
g
Payme
nt and
Settle
ment
Agenc
y
Servic
es
Asset
Mana
geme
nt
Retail
Broke
rage
Total
0
(20)
88
182
15
2
3
0
-
18%
18%
12%
15%
18%
15%
12%
12%
-
Capital Charge
0
(3.6)
10.56
27.3
2.7
0.3
0.36
0
37.62
Exposure Indicator
5
15
88
182
12
1
2
0
-
Beta
18%
18%
12%
15%
18%
15%
12%
12%
-
Capital Charge
0.9
2.7
10.56
27.3
2.16
0.15
0.24
0
44.01
Exposure Indicator
2
(5)
88
182
5
2
1
0
-
Beta
18%
18%
12%
15%
18%
15%
12%
12%
-
Capital Charge
0.36
(0.96)
10.56
27.3
0.96
0.3
0.12
0
38.64
Year 3
Year 2
Year 1
Exposure Indicator
Beta
Capital Charge with TSA
(37.62+44.01+38.64)/3 = 40.09 >> 4.5 (BIA) > 2.31 (TSA)
116
117. ADVANCED MEASUREMENT APPROACHES (1/3)
Capital Chargewith AMA
Expected Losses
(EL)
Expected
Losses
Unexpected Losses
(UL)
Observations
Unexpected
Losses
Stress Losses
E(L)
Allowances
VaR (L)
Risk capital
Total capital
117
Amount of Loss (L)
118. ADVANCED MEASUREMENT APPROACHES (2/3)
Qualifying standards:Meeting minimum qualifying criteria used for TSA
Having independent full-fledged ORM function
ORM is closely integrated in day-to-day activity
Regular reporting and action taking processes
ORM practice is documented, reviewed / validated internally and externally
118
119. ADVANCED MEASUREMENT APPROACHES (3/3)
Quantitative standards:Capture potentially severe ‗tail‘ loss events at one year holding period and a 99.9th percentile
confidence interval
Risk model and its validations should be based on data history not less than 3 years (at initial
recognition) and over 5 years (in next calculations)
Be consistent with scope of BCBS OpRisk definition and loss event types
Capital charge should cover EL and UL, if EL is not provisioned properly
Should be sufficiently ‗granular‘ to capture the major drivers of OpRisk affecting the shape of the
tail of the lossestimates
Correlations across individual operational risk estimates should be recognized by the regulators as
sound and implemented with integrity
Must include the use of internal data, relevant external data, scenario analysis, RCSA and KRI/KPI
with credible, transparent, well-documented and verifiable approach for weighting the elements in
overall ORM system
119
120. INTERNAL MEASUREMENT APPROACH (1/2)
Approach based on linear proxy between expected and unexpected lossesParameters
γ
– proxy parameter between EL and UL
PE – probability of loss event during 1 year horizon
LGE – average loss given that an event occurs
EI
– exposure indicator to capture the scale of
activities for business line i/event type j
LE
– single loss event
NE
– number of single loss events
Exposure indicators
▪ Number of transactions
▪ Total turnover of operations
▪ Average volume of transactions
▪ Gross income of operations
SOURCES: 1. Working Paper on the Regulatory Treatment of Operational Risk BCBS, 2001
2. Carol Alexander. Operational Risk: Regulation, Analysis and Management, Pearson Education, 2003, p.148
120
121. INTERNAL MEASUREMENT APPROACH (2/2)
AdvantagesShortcomings
▪ Flexibility of exposure indicators
▪ Specific to business type
▪ Dependent on internal losses
▪ Linear proxy between EL and UL
Indicator
EI
PE
LGD
EL
γ
Charge
Corporate finance
20
0.2%
20
0.8
7.8
6.2
Trading and Sales
1,000
1%
0.1
1
3.4
3.4
Retail Banking
5,000
5%
0.01
2.5
4.2
10.5
750
0.1%
5
3.75
5.4
20.3
50,000
0.005%
1.5
3.75
6.6
24.7
Agency Services
15
0.1%
50
0.75
4.5
3.4
Asset Management
4
0.3%
40
0.48
5.7
2.7
Retail Brokerage
25
0.1%
25
0.625
3.8
2.4
Commercial Banking
Payment and Settlement
Capital charge with IMA
73.7
121
122. LOSS DISTRIBUTION APPROACH (1/6)
LDA estimates for each business line / event type the likely distribution of OpRisklosses over certain period of time (1 year) at required confidence level (99,9%)
LDA measures UL directly with the loss distribution derived from assumptions of loss
frequency and severity distributions an correlations between loss events
Loss distribution
Number of
Occurrence
Severity distribution
P(X=N)
P(X=N)
P(X=N)
Frequency distribution
EL
UL
122
Loss
amount
Severity per event
123. LOSS DISTRIBUTION APPROACH (2/6)
OpRisk Loss Simulation Algorithm:1.
Collect statistics on loss events no. per day and severity per event within 3 years period
2.
Select theoretical distributions and derive their parameters from the sample
3.
Construct empirical and theoretical distributions – pmfs, pdfs and cdfs
4.
Make goodness-of-fit tests and select distributions passed the test
5.
Simulate a vector of frequency and matrix of severities with selecteddistributions
6.
Sum severities for simulated frequency and obtain daily loss
7.
Repeat steps 5 and 6 at least 10.000 times and get a vector of daily losses
8.
Compute annual losses with a sliding scale of 250 days
9.
Take 99.9% percentile from the sample of annual losses obtained (OpVaR)
10.
Compute the mean of simulated annual losses (EL)
OpRisk for single business line and event type = OpVaR – EL
(if EL is adequately provisioned)
123
124. LOSS DISTRIBUTION APPROACH (3/6)
Severity distributionsValidation tests
▪ Lognormal
▪ Pareto
▪ Weibull
▪ Q-Q plot
▪ K-S test
SOURCE: Observed range of practice in key elements of Advanced Measurement Approaches (AMA). BCBS, July 2009
124
125. LOSS DISTRIBUTION APPROACH (4/6)
Frequency distributionsValidation tests
▪ Poisson
▪ Negative Binomial
▪ χ2-test
SOURCE: Observed range of practice in key elements of Advanced Measurement Approaches (AMA). BCBS, July 2009
125
126. LOSS DISTRIBUTION APPROACH (5/6)
Loss aggregationBU/ET 1
BU/ET
…
BU/ET n
Gross
Loss
▪ No diversification:
▪ Fully diversified:
▪ Dependency structure based on multivariate distribution functions (copulas)
SOURCE: Carol Alexander. Operational Risk: Regulation, Analysis and Management, Pearson Education, 2003
126
127. LOSS DISTRIBUTION APPROACH (6/6)
Loss aggregation options▪ Gaussian copula
▪ Gumbel copula
▪ Correlation matrix
SOURCE:
1. Observed range of practice in key elements of Advanced Measurement Approaches (AMA). BCBS, July 2009
2. Carol Alexander. Operational Risk: Regulation, Analysis and Management, Pearson Education, 2003
127
128. Table of Contents
Pillar II. Risk Measurement and Analysis1. Risk event data collection
2. Capital Requirement
3. Scenario analysis
128
129. SOUND PRACTICE
Basel Committee on Banking Supervision> Principles for the Sound Management of Operational Risk, June 2011
Scenario Analysis is listed as an example of tools that may be used for identifying and assessing
operational risk:
―Scenario analysis is a process of obtaining expert opinion of business line and risk managers
to identify potential operational risk events and assess their potential outcome. Scenario
analysis is an effective tool to consider potential sources of significant operational risk and the need
for additional risk management controls or mitigation solutions. Given the subjectivity of the
scenario process, a robust governance framework is essential to ensure the integrity and consistency
of the process‖
> Basel II Framework:
Scenario analysis is a part of AMA quantitative standards: ―A bank must use scenario analysis of
expert opinion in conjunction with external data to evaluate its exposure to high-severity events‖
129
130. SCENARIO ANALYSIS PROCEDURE
Management
• Business areas
• Risk types
• Data sources
Scenario
risk drivers
Expert
groups
Risk
owners
Assumptions
formulation
• Frequency
• Severity
• Loss Amount
• Recovery
• Return time
Data
sources
Validation
team
• Worst case
• Baseline
• Best case
Risk
manageme
nt
Capital planning
• AMA model
• Provisions
Scenario
selection
Audit
integrity
check
130
Expert
groups
• Controls
• Mitigations
• Early warning
signals
• Continuity plans
Follow-up
Audit
integrity
check
ORCom
131. WRITING SCENARIOS ALGO
1.Defining and structuring the task, specifying the area of interest and identifying the major relevant
features of this area.
2.
Describing important external factors and their influence on the area of interest. These factors
form the influence fields.
3.
Identifying major descriptors for each field and making assumptions about their future trends.
4.
Checking the consistency of possible combinations of alternative assumptions regarding the
critical descriptors and identifying assumption bundles.
5.
Combining assumptions with the trend assumptions regarding the uncritical depicters, resulting in
a scenario for each field.
6.
Making assumptions with respect to possible interfering events and their probabilities as well as
their impacts on the field.
7.
Assessing the impact of the field scenarios on the area of interest and its depicters. Respective
scenarios are constructed.
8.
Identifying strategies that could promote or impede the developments described in the scenarios.
SOURCE: Imad A. Moosa. Operational Risk Management. Palgrave Macmillan, 2007
131
132. WHAT SCENARIOS ARE RELEVANT?
HighWHAT SCENARIOS ARE RELEVANT?
• RCSA
Frequency
• Key risk indicators
• Audit findings
Scenario requirements:
• Internal loss data
• External loss data
Low frequency
• Scenario Analysis
Low
High severity
Realistic to the
company
Low
Loss severity
High
132
133. FORWARD-LOOKING FOCUS
Scenario data provides a forward-looking view of potential operational risk exposures,based on historical or judgmental estimations.
Internal / External
loss database
Past-looking
RCSA / KRI
Current
performance
133
Scenario Analysis
Forward-looking
134. DATA COLLECTION (1/2)
Data sourcesData types / updates
Major changes
Extreme losses
At least annually revised
External loss data
Internal loss data
KRI / KPI
RCSA
Expert opinions (imaginative thinking)
SOURCE: Observed range of practice in key elements of Advanced Measurement Approaches (AMA). BCBS, July 2009
134
135. DATA COLLECTION (2/2)
Collection processData scope
Bank-wide scenarios
Business line scenarios
Subgroup scenarios
Workshops (expert group)
Interviews (business lines)
Questionnaires (business lines)
Regular meetings (ORCom)
Voting (expert group)
SOURCE: Observed range of practice in key elements of Advanced Measurement Approaches (AMA). BCBS, July 2009
135
136. SCENARIO RISK DRIVERS
RCSA may help to identify the business lines and event types of highimpact
136
137. SCENARIO DISTRIBUTION
SOURCE: Results from the 2008 Loss Data Collection Exercise for Operational Risk. BCBS, July 2009137
138. HIGH SEVERITY SCENARIO EXAMPLES
Large loan or card fraud (internal / external)High-scale unauthorized trading
Legislation non-compliance or incomplete disclosure (banking, tax, AML regulation)
Massive technology failure or new system migration
Servers disruptions / network shutdown that lead to outages and loss of information
Mergers and acquisitions with other banks
Doubling the company‘s maximum historical loss amount
Increase/decrease of loss frequency by 20%
Increase/decrease if loss severity by 50%/100%
SOURCE:
Anna S. Chernobai, Svetlozar T. Rachev, and Frank J. Fabozzi. Operartional Risk: A Guide to Basel II Capital Requirements, Models,
and Analysis. Wiley Finance, 2007
138
139. SCENARIO PARAMETERS
Parameters ValueParameters Name
Likely
Unlikely
Very unlikely
Rare
Scenario Name
Large-scale payment card client data compromising
Scenario Data Source
External loss data
Business Line / Unit
Retail Banking / Payment cards servicing department
Risk Type
External fraud on payment cards
Risk Object
VISA payment cards
Effects
Client funds are stolen with Internet payments
Exposure
Impossible
100 cards
500 cards
5.000 cards
50k cards
500k cards
20
10
5
2
1
Severity
€100K
€500K
€5M
€50M
€500M
Uncertainty (std)
€10K
€100K
€2M
€25M
€300M
Frequency (times per 10 yrs)
Controls
Suspending operations in 5 minutes after massive withdrawals
Mitigations
Default limits on one-off and daily payments, Verified by Visa service
KRIs
Number and severity of fraud events on payment cards
Loss experience
…
139
140. QUANTIFICATION USE
Scenario estimates should add high frequency, but low severity internal loss dataScenarios account for 93.8% of the total number of high impact losses
Scenario loss severity is 3-5 times higher internal loss data severity
140
141. SCENARIO BIASES (1/2)
Overconfidence: underestimation of risk due to the number of observed events being smallAvailability: overestimation of events that respondents had closer or more recent contact with as
personally experienced events are usually more prominent, as are events occurring more recently
Anchoring: When people are asked to estimate range for uncertain, they use a starting point (anchor),
and this may create a tendency for experts to overestimate success and underestimate failures
Motivation: misrepresentation of information due to respondents‘ interests in conflict with the goals
and consequences of the assessment
Partition dependence: refers to whether the respondents‘ knowledge was distorted by discrete
choices of responses had to be represented, which may lead to underestimation of low frequency
events and overestimation of high frequency events depending on expert experience
Framing: outcomes from questionnaires are sensitive to the phrasing and the order of questions used
Representativeness: experts may tend to link events they are asking with another similar event and
derive their estimate from the probability of the similar event
SOURCES:
1. BCBS. Operational Risk – Supervisory Guidelines for the Advanced Measurement Approaches, June, 2011
2. Greg N. Gregoriou. Operational Risk toward Basel III. Wiley Finance, 2009
141
142. SCENARIO BIASES (2/2)
Banks are likely to deviate from true risk estimate due to low frequency of events, toomuch rely on recent data, and conflict of interest
SOURCE: Observed range of practice in key elements of Advanced Measurement Approaches (AMA). BCBS, July 2009
142
143. ROBUST FRAMEWORK
Established scenario framework should ensure the integrity and consistency of the estimatesproduced with the following elements:
a)
Clearly defined and repeatable process
b) Good quality background preparation of the participants
c) Qualified and experienced facilitators
d) Representatives of the business, subject matter experts and risk managers
e) Structured process for the selection of data fore scenario parameters
f)
High quality documentation of the scenario formulation and outputs
g) Robust independent challenge process and oversight by risk management
h) Process that is responsive to internal and external changes
i)
Mechanisms for mitigating biases inherent in scenario processes
SOURCE: Basel Committee on Banking Supervision.
Operational Risk – Supervisory Guidelines for the Advanced Measurement Approaches, June, 2011
143
144. Table of Contents
Pillar III. Management Actions and Framework1. Business continuity planning, Risk transfers
2. Risk governance structure
144
145. Table of Contents
Pillar III. Management Actions and Framework1. Business continuity planning, Risk mitigation & transfers
2. Risk governance structure
145
146. RISK TAKING & MANAGEMENT OPTIONS
RISK TAKING & MANAGEMENT OPTIONSProfit>Ri
sk Cost
Profit<Ri
sk Cost
=>Perform
activity
=> abandon
activity
Transfer
(Loss>Control Cost,
Loss height unacceptable)
Mitigate
(Loss>Control Cost)
=> OpRisk
taking
=> Risk
avoidance
Accept
(Loss< Control
Cost)
146
147. OP RISK MITIGATION
Riskmanagem
ent
options
OP RISK MITIGATION
Mitigate
Cause
s
Processes
People
Automatisation,
Check sums, Plausibility checks
Trainings, separation of functions
Satisfaction , need-to—known principle (access control), 4-eye principle, physical access
control...
Limit management
Inventories, plausibility checks
Systems
Backup systems
Parallel systems
External events
Business Continuity Planning
147
148. BSBC PRINCIPLE 10: BUSINESS RESILIENCY AND CONTINUITY PLANNING
BC-Plans shall take into account different types of likely or plausible scenarios towhich the company may be vulnerable.
• Continuity mngt incorporates:
(1) Biz impact analysis;
(2) Recovery strategies,
(3) testing, training and awareness, communication programs,
(4) Crisis mngt prgrms
• Banks shall identify critical biz operations and key internal and external
dependencies and appropriate resiliency levels/.
• Biz continuity testing with key service providers recommended.
148
149. BUSINESS CONTINUITY PLANNING
BCP = disaster prevention & disasterrecovery planning.
Disaster prevention aims to reduce
threats of disaster before it occurs.
Disaster recovery seeks to re-establish
the critical functions after an
interruption / disaster.
4 core resources to be protected:
Consists of
developing for
each business
and support
line of
• Structures
• Procedures
• Methods
To be
implemented in
the event of
“disaster”
resulting from
• Natural cause
• Accidental cause
• Voluntary act or obstruction
-people;
- location;
-IT; and
In order to
protect
- external services
Efficient management of disasters
– arguably more important to
stakeholders than risk transfers.
• 4 core resources
• Ensure the provision of essential
services
• Ensure the resumption of all activities
…and face threats of different nature (natural,
technical, malicious etc)
149
150. BCP PHASING
Phase 1:Project
Planning
Identify
disaster
scenarios to
be addressed
Develop
Standards and
Procedures.
Establish
and
obtain
approval on
scenario and
planning
assumptions
Adapt
methodology
tools to your
culture
and
requirements
Phase 2: Biz
Impact
Analysis
-Map processes
-Assess
financial and
non-financial
impact of risk
Determine
recovery time
objective
Determine
critical
processes
requiring
planning
Tools,
resources,
equipment
- Identify key
dependencies
Phase 3:
Recovery
Strategy
Selection
- Consolidate
and finalize
recovery
requirements;
-Review and
assess current
strategies;
-Recommend
recovery
strategies
150
Phase 4:
Developme
nt &
Document
ation
•Develop Crisis
Management
Approach and
BCPs.
• Validate
critical
processes, and
applications and
map to IT
infrastructure.
• Validate
critical data and
associated risks.
•Validate key
internal and
external
dependencies..
Phase 5:
Testing &
Implement
ation
Conduct
structured
walkthrough
for each plan
incl.
execution of
Crisis
Management
Approach.
Finalize
BCPs.
Develop
Testing and
Maintenance
Guidelines
and tools.
151. BCP SCENARIO/RISK ANALYSIS BASED
Scenario & Risk AnalysisHealth Check of Physical & IT Security Controls; Threat Analysis; Review
Existing Mitigation Program (evaluation of EXTREME vs MUNDANE
risks)
Business Impact Analysis
Determine (core) business processes – rank mission critical criteria; determine
fin & op impacts of business process failure; recovery time objectives and
interdependencies among projects
Recovery Strategy Selection
Min recovery resources; Range of strategies; Cost/benefit review
Tools:
TOR; Resource & BCP
Templates;
Deliverable: BC-Plan
Deliverables:
Testing&Maintenance
Procedures; Testing
Summary Report;
Revised BCP
Recovery Plan Development
Prepare team procedures; Prepare team structures, Draft BCP
Testing & Maintenance
Test & Maintenance procedures;
Document final BCP; Structured walk-thru
151
Tools: Checklists:
1) Health
2) Risk Assessment
Deliverable:
BCP
Workbook
Tools:
Industry
Benchmarkin
g & Best
Practices
152. CRISIS MANAGEMENT STRUCTURE
Roles & Responsibilitiesought to be defined in the
Crisis Mngt Policy
Principles of the Crisis
Management to be
established & applied:
Protection& safety of staff;
Operational collaboration;
controlled process of
information flow;
Maintaining essential
controls in crisis situation.
Roles
Responsibility
Crisis Director
(heads the crisis mngt
cmte and steers thru
the crisis)
Confirms the crisis status & level
Decides on the mobilization of a crisis
cell
Expresses external resources
requirement;
Indicates functional dep‘ts likely to be
affected
Crisis Mngt
Advisors (members
of crisis mngt cmte)
Assist the crisis director;
Contribute tech & organizational
knowledge to handling the crisis
Crisis
Communication
Mngr (CMC
member)
Suggests communication actions &
strategies;
Interfaces with the communication sector
Crisis admin &
logistics
Administers documents of the crisis cell;
Runs the logistics of the crisis cell
152
153. PERIODIC BCP CHECKS
1. BCP ought to fit the activity, prioritizing the core ones.2.BCP covers all essential business processes, locations, facilities
(incl. shared ones) and data (electronic & paper).
3.How often / thoroughly are BCP procedures tested and
rehearsed?
4.Is BCP regularly updated in line with transformation projects?
5.Is “backup to backup” needed?
6.Test from your back-up to your bizpartners back-up recovered
environments.
7.Is BCP internally audited?
8.Are crisis reporting lines clear? Is an emergency call list at hand?
153
154. BCP TIPS
• Simple preventive measures – geographic dispersion of intellectual capital;• Implement alternative IT solutions for communication & connectivity
• Contact details of CMC members shall be known;
• Crisis operation sites shall be equipped;
• Multiple locations, as per risk assessment, need to be prepared
• Leverage BCP budgets to address multiple business & technical needs (e.g.
data backup/records management, system redundancy/performance
mngt)
• Focus on pre-event risk minimization and post-event response strategies
• Plans should cover crisis management, recovery and involve all parts of
the organization
• Keep plans simple – as they to work in the heat
• Really understand vendor & business partner recovery capabilities.
154
155. RISK TRANSFER
Riskmanageme
nt options
RISK TRANSFER
Outsource
Insure
ART
Caus
es
Processes
People
Systems
External events
X
E.g.: Vault transport of cash
x
X
Bankers professional indemnity (mistakes by employees)
Directors and offier liability
Employment practice liability (e.g. discrimination)
Economic crime
Unauthorised trading
Business interruption
Computer crime
x
X
x
x
X
E.g. Property insurance
155
156. INSURANCE
Benefit:Helps removing OpRisk from the balance sheet for a small
cost (premium) by providing a restrictive cover and
(un)certain payment.
OpRisk substituted with a counterparty/credit risk on an
insurer.
Questions of Insurer‘s liquidity, loss adjustment, voidability,
moral hazards, limits in insurance product range.
9/11 and Moscow terrorist attacks called to rethink
insurability conditions and identify hidden exposures.
Terrorism magnifies business interruption as a major OpRisk.
Insurance does not protect reputation or ensure that business
can continue
Challenges of using the insurance:
-Selecting the right coverage
-Incorporating the insurance policies into the capital
allocation strategies;
- potential payment delays (critical for small credit institutions
156
Conditions:
• Must be related to actual risk
exposure of bank to evidence need
for mitigation, (e.g. catastrophe
insurance in case of earthquake)
• Insurance provider rated at least A
• Insurance provider not to be related
to banking group; unless re-insured
via eligible re-insurer
• Tenor of insurance 1 year for 100%
recognition
• If less than 1 year, apply haircuts, to
reach 0% recognition if under 90
days
• No exclusions or limitations as a
result of regulatory action or
events that took place before
insolvency
157. INSURANCE MITIGATION UNDER AMA
157158. OUTSOURCING RISKS
Op Risk Outsourcing driversCost reduction
Higher process quality
Risk sharing/ transfer
Benefits from economies of scale;
Allowing better focus on core/new business;
Accessing new technology
158
159. COMPETITIVE EDGE –OUTSOURCING IS NOT OR-FREE
Outsourcing OpRisks:(1) Unavailability of critical systems
/ loss of data
(2) Legal risks with the segregation
of duties. Who bears losses?
(3) Loosing control over the process.
(4) Black-Box systems: Loss of
know-how; dependence on key
personnel
(5) Reputation risks in case of poor
service
(6) Compliance risks (e.g. customer
data protection)
(7) Counterparty risk:
(business partner‗s failure on
service delivery), incl. fraud.
BSBS ―Outsourcing in Financial Services‖ –
Feb 2005.
“Prudent Outsourcer” Rules
1. The final responsibility towards clients and supervisors for the
outsourced service remains with the financial institution. While an
operation / service may be outsourced, the ultimate responsibility for it –
not.
2. Focus on core activities, gaining efficiency and saving cost shall outweigh
the loss of direct control over the service and be based on the provider
assessment.
3. Outsourcing causes loss of know-how, information and some
infrastructure.
4. Key processes and core competencies shall not be outsourced.
5. Min quality and reliability expectations, ability to provide KRI‘s / KPI‘s
and securing confidentiality as per Service Level Agreements.
6. Outsources shall make sure the insourcer has adequate safeguards in
place. Really understand vendor / business partner recovery capabilities
7. The out- and insourcer‘s duties shall be segregated.
8. Manage reliance on external entities (risk of failure)
9. Open communication channels btw out- and insourcer and auditing
rights and sufficient process control rights.
10. Instill satisfactory management report.
11. Reduce
degree
of
dependence:
can bank switch outsource provider if fails (backup provider)?
159
160. (Alternative Risk Transfer)
ART(Alternative Risk Transfer)
Regulators concerns:
-Complex voidance clauses
-narrowly defined insured /
risk events
Limitations
-Absence of historical data
-Imperfect
knowledge
in
certain domains on the part of
actuaries
Products
Product distinctive Features
Insurance-linked
securities, incl. index
securitization
Supercatastrophes
Finite reinsurance
Risk transfer + risk
financing
- Multi-year;
-particulars of each oprisk covered;
-Possible sharing of fin results
CAT(astrophe)bonds
If no loss-event occurs, investors receive
coupon
If a defined catastrophic event takes place,
investors lose interest, principal or both
Catastrophe swaps
Fixed payments exchanged for a series of
floating that depend on occurrence of an
insured event
Industry Loss
Warranties
Resemble catastrophe swaps, structured as a
reinsurance
Catastrophe options
Listed at Chicago Board of Trade
160
161. Table of Contents
Pillar III. Management Actions and Framework1. Business continuity planning
2. Risk transfers
3. Risk governance structure
161
162. OpRisk CORPORATE GOVERNANCE
Clear org structurewith defined lines
of responsibility
Hierarchic decisionmaking process
Output of RM system
must be integrated into
the controlling of
operational risk profile
Adequate Internal
Control Structures
proportionate to the
scale of Bank‘s
activities
Internal & External
Assessment to Ensure
the ORM framework
fits the purpose
162
163. RISK GOVERNANCE: 3 (4) LINES OF DEFENSE
(1)bizlinemgnt have primary
responsibility for managing their
risks (Risk-takers);
Role of Supervisors
-Conduct regular independent evaluations of banks‘
OR policies, processes & systems
-Ensure Compliance with the Principles at the
Financial Group level;
- Address deficiencies through the range of actions;
- Benchmark risk mngt plans to others‘;
-Applicable to all Banks regardless of size
(2)independent corporate ORM
function – supports the line mngt;
responsible for risk oversight and
guidance;
(3)Independent assurance, consists
… and regulatory expectations
of verification (tests the efficiency
-evolve as the institution gains experience with
of the overall framework) and
RM techniques;
validation (ensures the robustness
-RM Enhancement;
of
quantification
s-ms)
–
- Evidences ORM benefits to banks
internal
/external audit;
arguably, the Board of Directors shall form the last internal line of
defense
163
164. RISK MANAGEMENT ORGANIZATION
Bank RMFunction
Centralized
Distributed
Decentralized
Relation to
the business
ORM Officer/Cmte; No
dedicated bizline support
ORM Officer/Cmte
+Bizline ORM Managers
&/or dedicated staff
largely independent RM
programs managed by
bizlines
Responsibilit
ies
Identifying and managing
risk at central level
Identifying and handling risk
devoted to central functions;
identification of ORs is with
bizlines; Meets specific OR
requirements of each bizline
Identifying & managing risks at
BizLine level; Handling certain
risks
centrally;
functional
reporting of bizline risk
managers to ORM
Pro’s
Standard approach to risk Risks
identified
by
biz Risk
identification
by
identification & mngt; transactors; standard approach biztransactors; ownership with
consistent mngt info
to risk mngt;
risk takers; selective use of
centralized
risk
handling
measures;
generation
of
complete MI
Con’s
No bizline ownership; lax
risk-identification;
Incomplete MI
Lack of ownership by risk
takers to manage;
Unacceptable risk taking
164
Inconsistent
standards
&
procedures (mitigated thru clear
guidelines and their monitoring)
165. OpRisk GOVERNANCE INTERNAL STRUCTURE
ElementORM Tasks & Responsibility
1. Supervisory Board
Approves and periodically reviews operational risk management strategy
Receive reports on OR exposure against risk appetite,
Aware of major OpRisks and significant losses;
Ensures Management Board carrying out its responsibilities
2. Management Board
Responsible to implement risk mgnt strategy
Approves and periodically reviews the oprational risk framework
Ensures the staff across the organization are clear as to their roles in ORM
Ensures appropriate action taken in response to OR exposures exceeding the appetite;
Launches and manages projects for operational risk management (incl. its budgeting, resourcing and
awareness campaign);
3. CRO (often a Board Member)
Responsible for implementation of OR framework
Provide risk leadership, vision and direction
Develops a supporting infrastructure;
Sponsor for operational risk project;
Internal ORM knowledge management
Oversight / control of ORM
4. ORM function
(Independent but not isolated
from biz lines!)
Implement the ORM framework
Create the tools to manage it (risk policy, monitoring, assessment, systems, methods)
Ownership of guidelines and methods
Identify, assess and analyze key risks
Monitor risk exposures against risk appetites
5. (Operational) Risk /Audit
committee
High-level technical issues
Monitoring implementation of risk policy and strategy
Measures to improve quality of risk management
Review the results of the risk assessments and make recomendations on the OR matters
165
166. OpRisk Governance Support
ElementORM Tasks & Responsibility
6. Line management
Staff in bizline to operationalise control functions
Coordinators between business units and risk controlling
7. Internal auditors
Advisors and internal reviewers for operational risk projects
Not responsible for OR as this would violate their business process
independence
Audit reports identify areas of high operational risk
Assessment of quality of loss database
8. Compliance and other
risk oversight functions
(treasury IT sec„ty, HR)
9. OpRisk coach
(optional)
Specialised control function to avoid insider trading,
conflict of interests, monitor staff transactions
Consulted for private assesment of measures to
build–up the RM corporate culture
166
167. SPECIAL ROLE OF RISK FUNCTION
PolicyDevelop, adapt & maintain with business;
Monitoring
Develop & maintain a reporting framework. Monitor & report portfolio
exposures and risk concentrations. Report and aggregate risk mngt
info. Link to regulatory requirements.
Assessment
Develop & maintain risk profiling & (self)assessment program. Analyze
independently.
Systems
Develop & maintain risk reporting systems with relevant biz functions
Develop risk quantification methods and capital allocation models
Methodology
Transaction failure analysis, external fraud response, AML, info security,
compliance.
Other (optional)
167
168. RISK GOVERNANCE ELEMENTS
Risk identification-Identify inherent risks in all products, activities, processes and s-ms;
- Adequate assessment procedures for new products… systems.
Risk measurement
Limits & escalation process
RCSA
KRI
Incident & loss reporting
Capital allocation
Continuous monitoring
OR exposures by major biz lines
OR events and losses by major business lines
Control & Mitigation
Policies, processes and procedures
Cost & benefits of alternative risk mitigation
OR exposure adjustment in light of overall risk profile
Audit
ORM shall be subject to regular reviews by internal/external auditors
Information flows
Enable:
- sr mngt to monitor the effectiveness of ORM s-m
- BOD oversee sr mngt performance;
- Info shall be used and acted upon
168
169. ORM GOVERNANCE FRAMEWORK
• Functional units involved in OpRisk Mngt:Evolving Governance Model:
(1)a
central
OpRisk
Mngr
reporting to the CRO. The role
is on settling, development of
tools, coordination, analysis and
benchmarking as well as
integration and aggregation o
fof the risk-profile +
(2)Line management remaining
responsible for the day-to-day
risk mngt activities +
(3)Risk committies
(4)Optional: ORM coach
Mngt & Fin Accounting
Procurement
Corporate Security
Human Resources
• OpRisk ownership:
(1) Risk-takers who indulge in activities leading to OpRisk
(responsibility alligned with profit centers – siloed approach);
(2) A more centralized corporate body (as OpRisk is enterprisewide).
NB! Functional support units may also generate ORs.
• Allocate OR-capital to bizlines and event types to incentivise
optimising risk-adjusted capital
OR helps to manage risks qualitatively with internal control
system (e.g. capital limits) => Capital becomes an additional
control variable
169
170. OR GOVERNANCE STRUCTURE: DB EXAMPLE
CRORisk Committee(s)
Operation risk Committee
initiates
Head
ORM function
- main decisions for operational risk OpRisk Officer OpRisk Officer OpRisk Officer
BU 1
BU 2
BU ...
Audit
Compliance
Line management
170
171. DISCLOSURE TO EXTERNAL STAKEHOLDERS
-Meet regulatory expectations;-Meet
rating
agency
expectations (ORM assessment
form part of their overall firm‘s
assessment)
-Align business to the interests
of
investors;
ongoing
communications to ensure the
investment protected;
- Effective RM leads
informed decision making
to
P11: Banks’ public disclosure should allow market
participants to assess its approach to OpRisk.
Amount and type of disclosure shall be commensurate
with the size, risk profile and complexity of a bank‘s
operations.
A formal disclosure policy shall be approved by BOD.
The Policy shall establish
(1)internal controls over disclosure and
(2)a process of assessing the appropriateness
of disclosure, incl. the verification of frequency
Recommended Sources:
1) BCBS ―Internal Convergence of Capital Measurement and Capital Standards: A revised framework‖, - June 2006.;
2) IOR Operational Risk Sound Practice Guidance: Operational Risk Governance, Sept 2010.
175
172. RULES OF STAKEHOLDER ENGAGEMENT
Do internal (“machine room”) and external (context) intelligence;Communication team composition: Experts and Message Determiners;
Align the message with the target audience;
separate internal and external communications in OpRisk event situation;
coordinate & cooperate with credible sources (e.g. regulators, consultants,
politicians etc);
Cover “4 Rs” “Regret-Reform-Restitute-Responsible”
Beware of Media mind-frames:
• Fin institution serve ideal targets, as they deal with large sums of money;
• Circumstances less important than victims & quantification: Simplify;
• Deviations in size & expectations make the news (e.g. “large fraud in a trusted
bank”);
• Telling a story is more attractive than a factual description.
Protect your bank from wrong customers
172
173.
- Who are yourstakeholders?
-What’s your Symbol
(Brand, Reputation)?
- Is it worth protecting?
173
174. BENEFITS OF OR GOVERNANCE
Reductionof operational losses;Risk assessment / internal audit
Improved
business
performance management;
New product / initiatives approval
Protection
and
against
loss
of reputation;
Regulatory compliance;
Greater levels of accountability
(staff and business unit levels);
Reductionin regulatory capital
Strategic planning
Systemsimplementation
Outsourcing/ vendor selection
Performance measurement
Annual budgeting
Product profitability
DISCUSSION: HOW WOULD YOU RANK THESE BENEFITS?
174
175. ORM IS SIMPLY GOOD CORPORATE GOVERNANCE
Increasedshareholder value
Good ORM
Fewer Surprises
175
176. Table of Contents
Pillar I. Operational Risk Management SetupPillar 2. Identification Tools
Pillar 3. Risk Measurement and Analysis
Pillar 4. Management Actions and Framework
Business game
176
177. Contact information
INTERNATIONAL FINANCE CORPORATION (IFC)Bank Advisory Program
Central Asia and Eastern Europe
Yevgeni Prokopenko, Banking Advisor
T: +38 095 280 5271
E: yprokopenko@ifc.org
Denis Bondarenko, Banking Expert
T: +7 495 411 7555 (ext. 2145)
E: dbondarenko@ifc.org
177


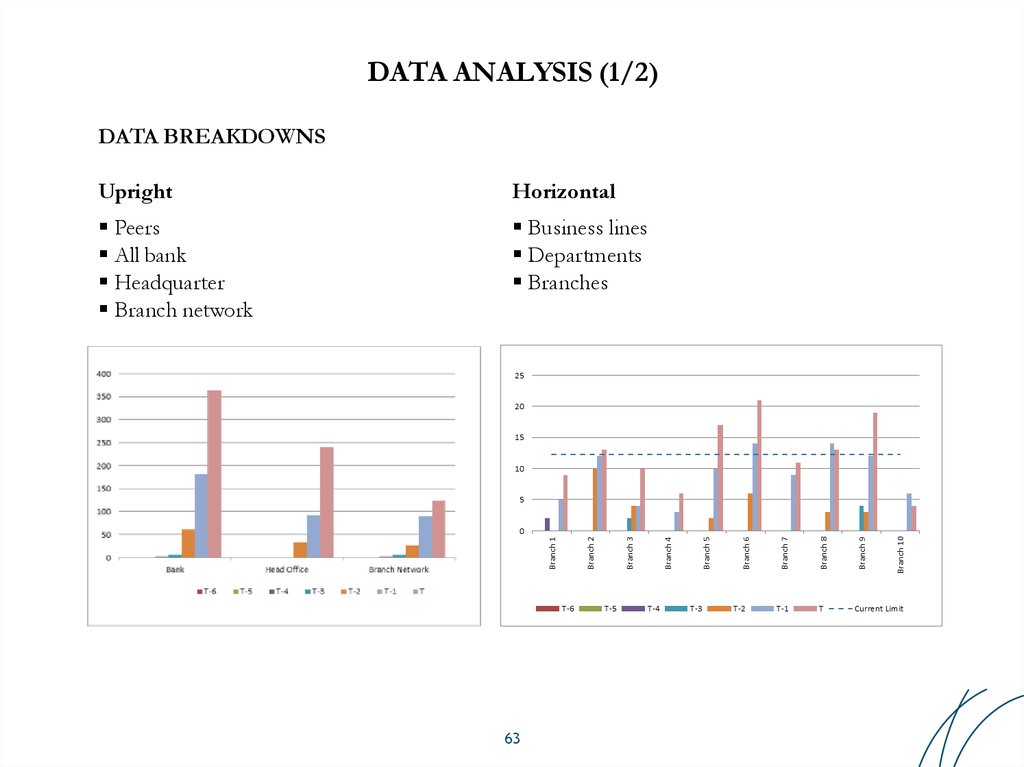
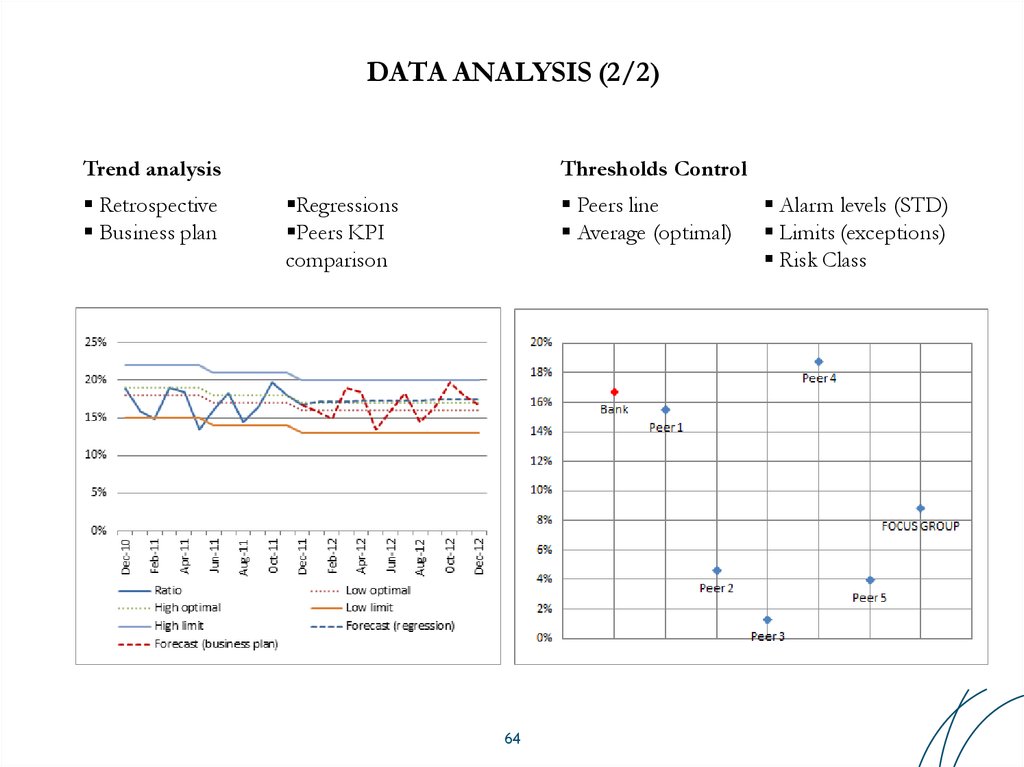
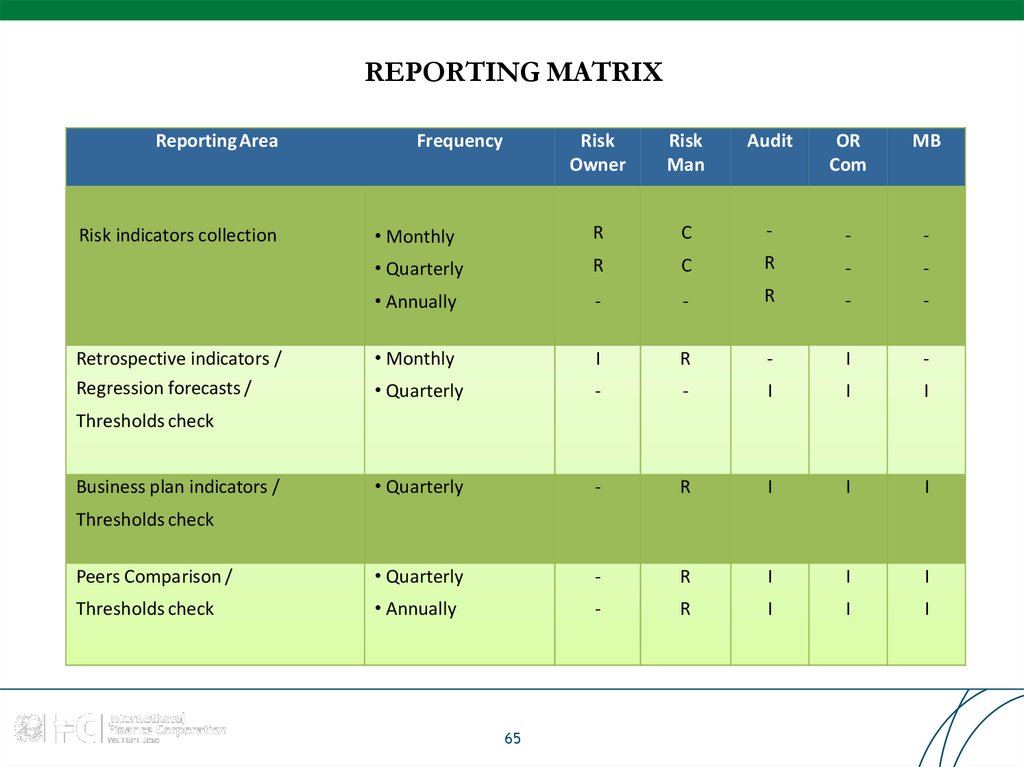

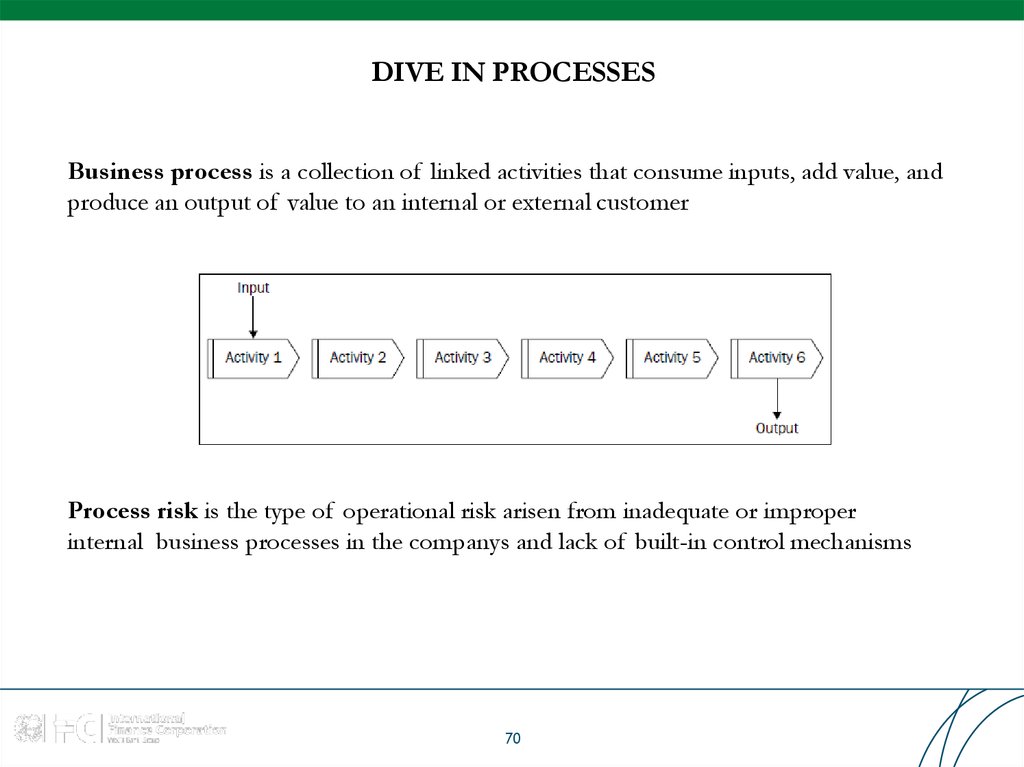
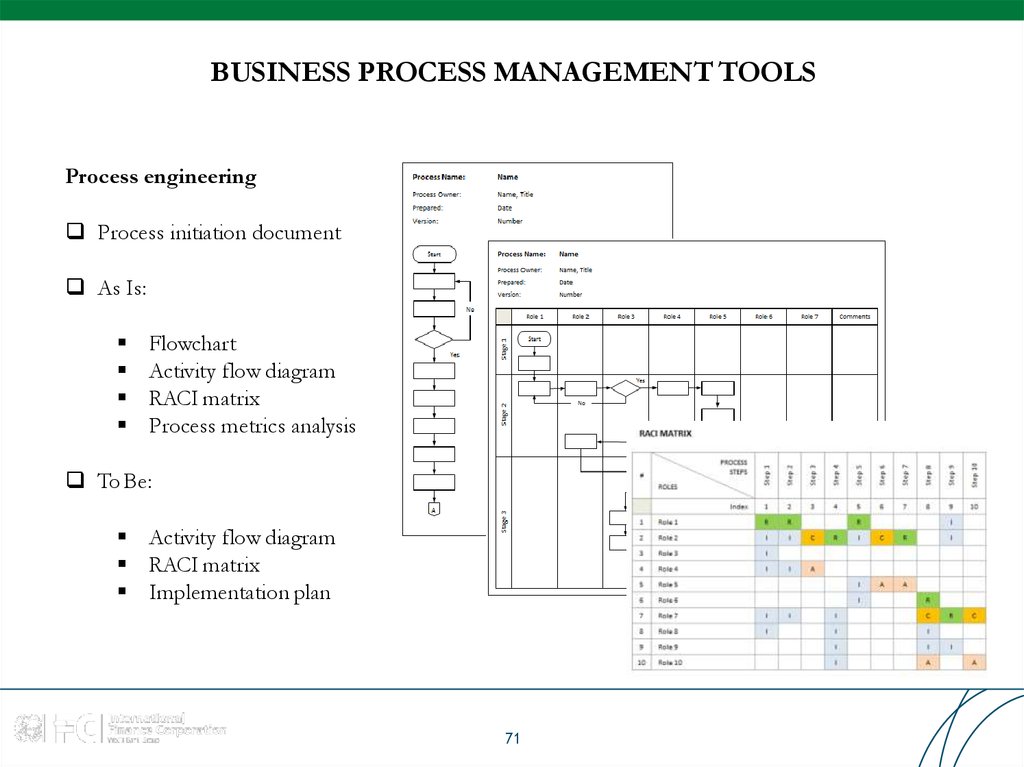
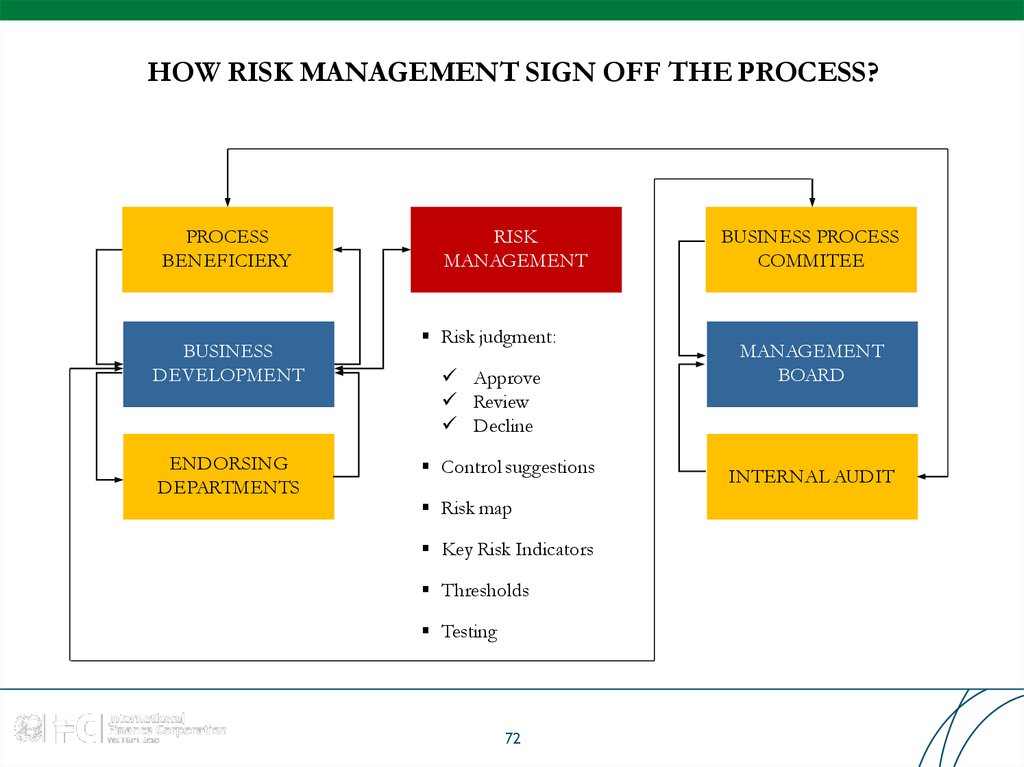
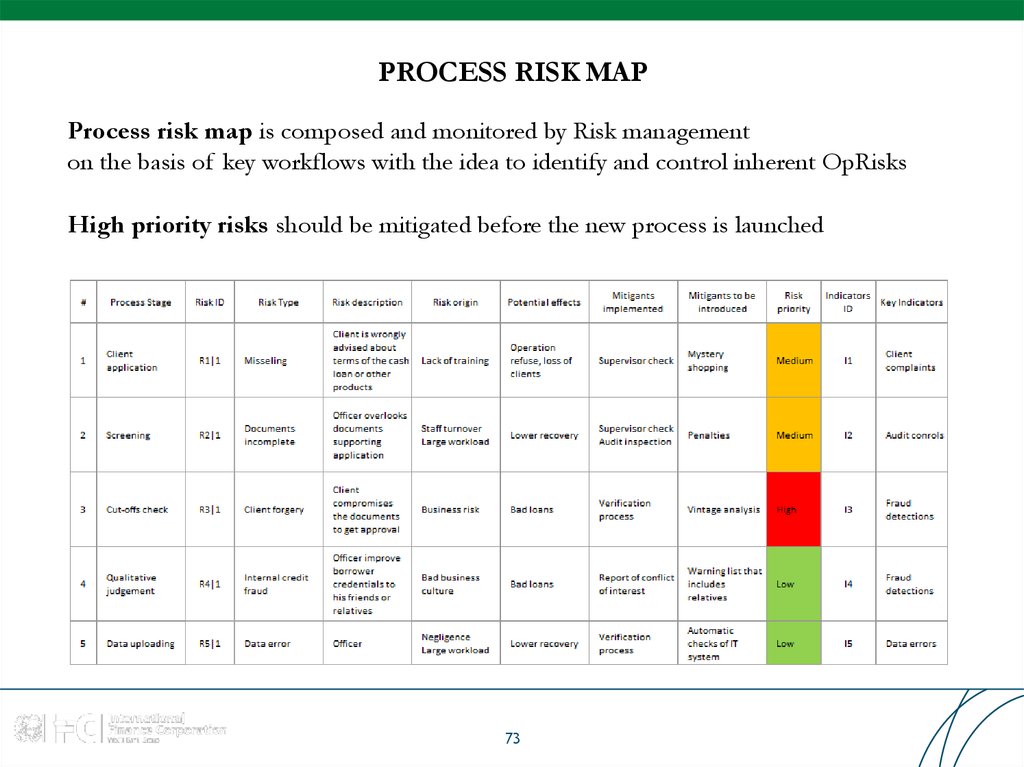

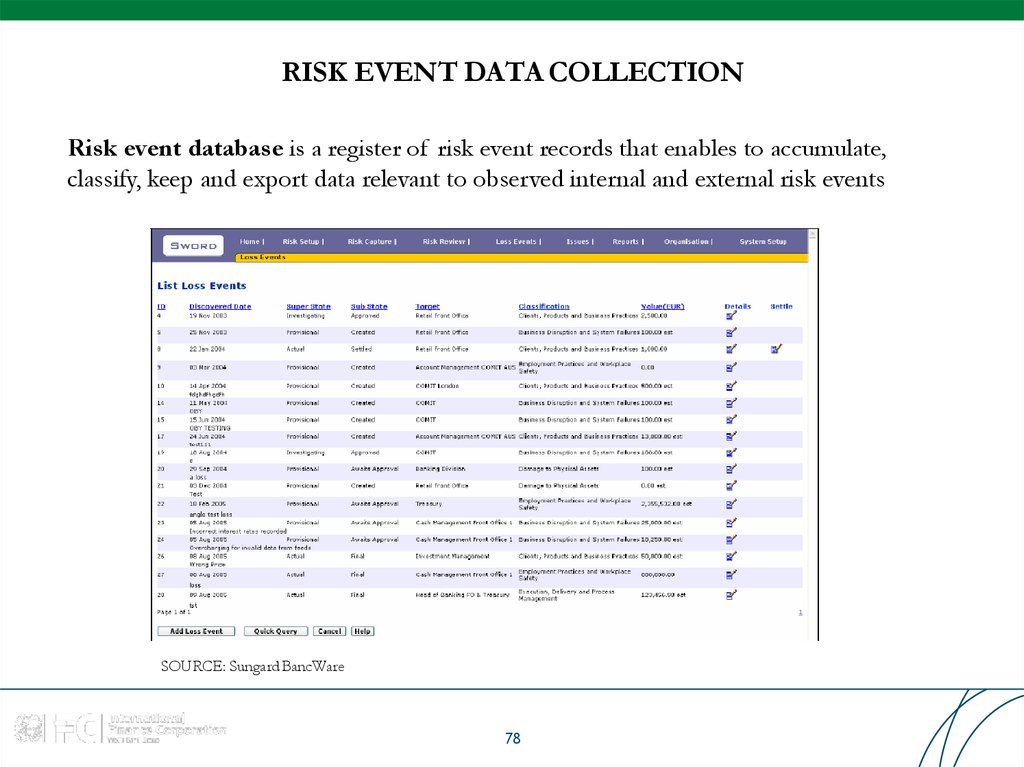
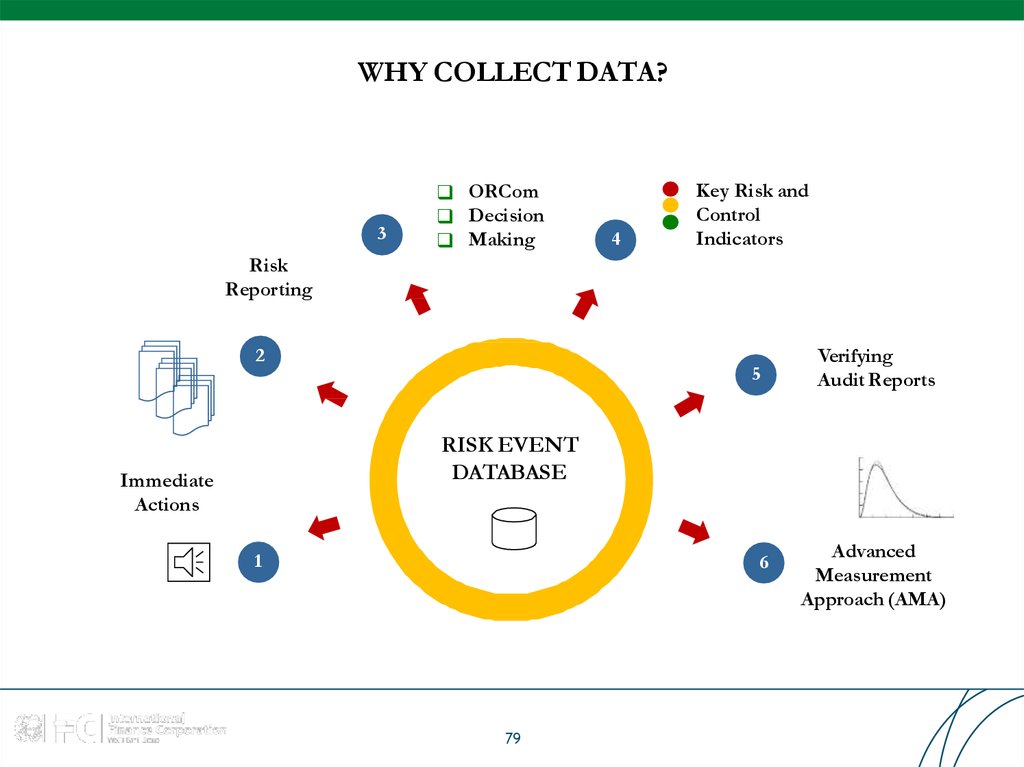
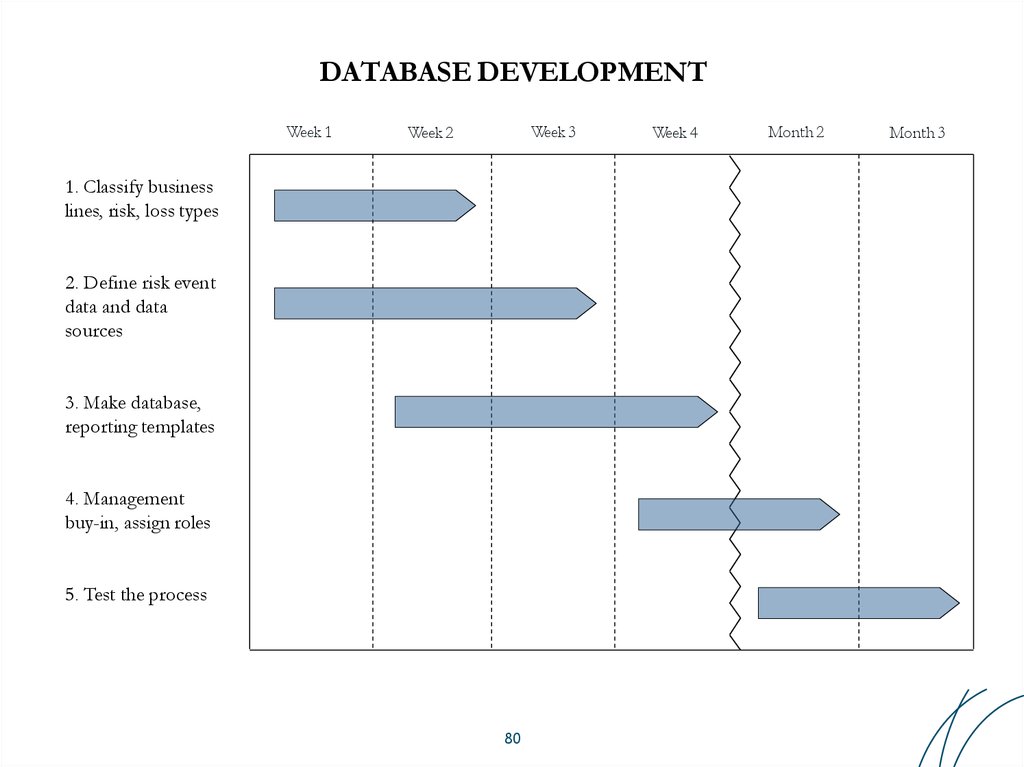
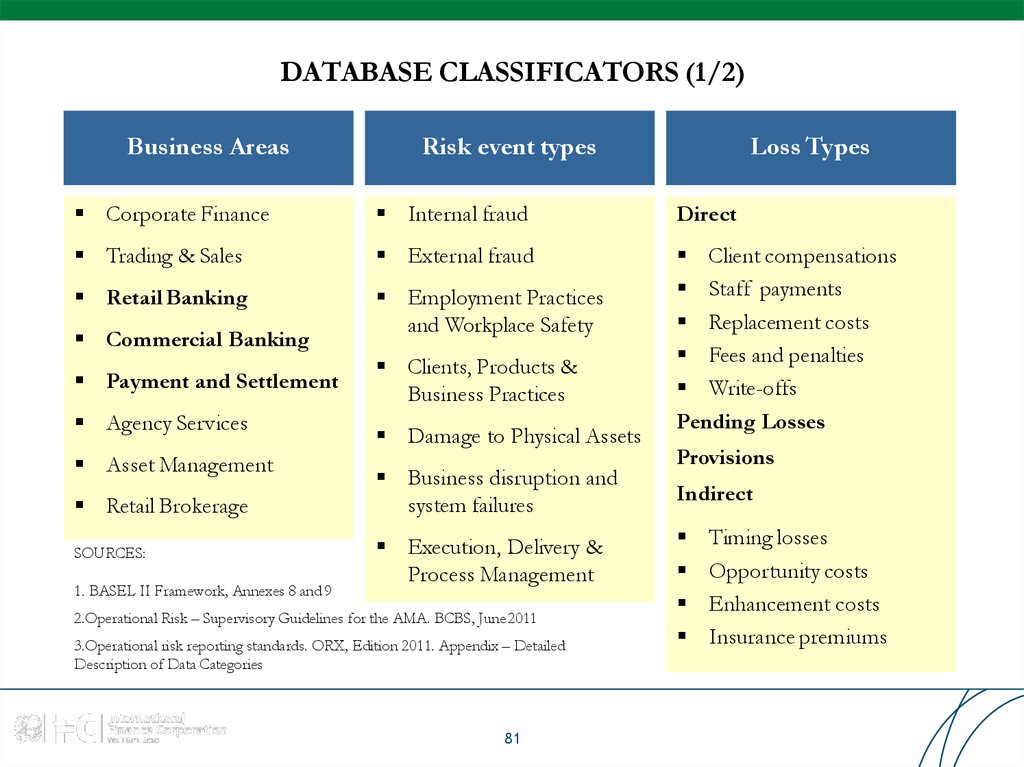
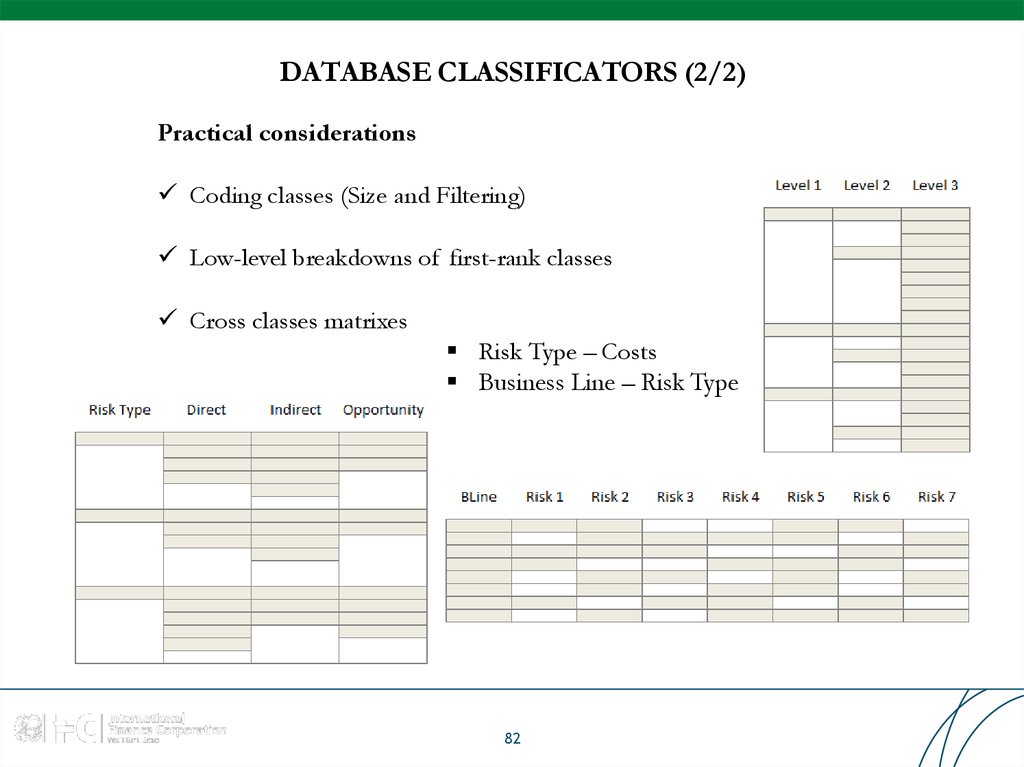
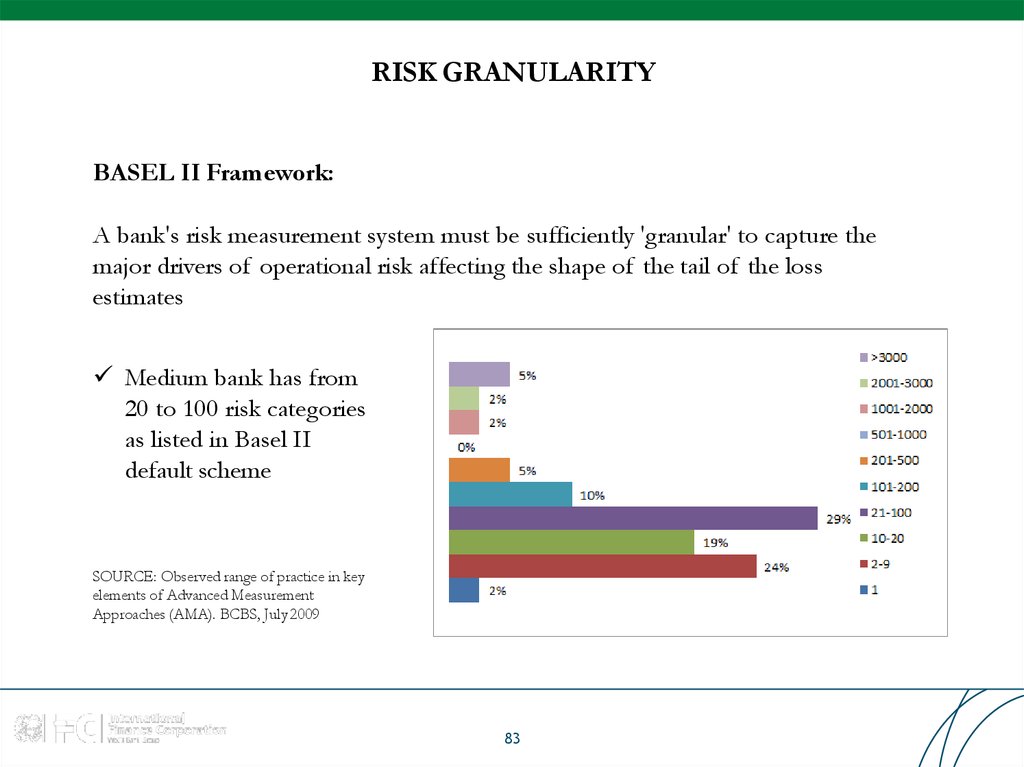
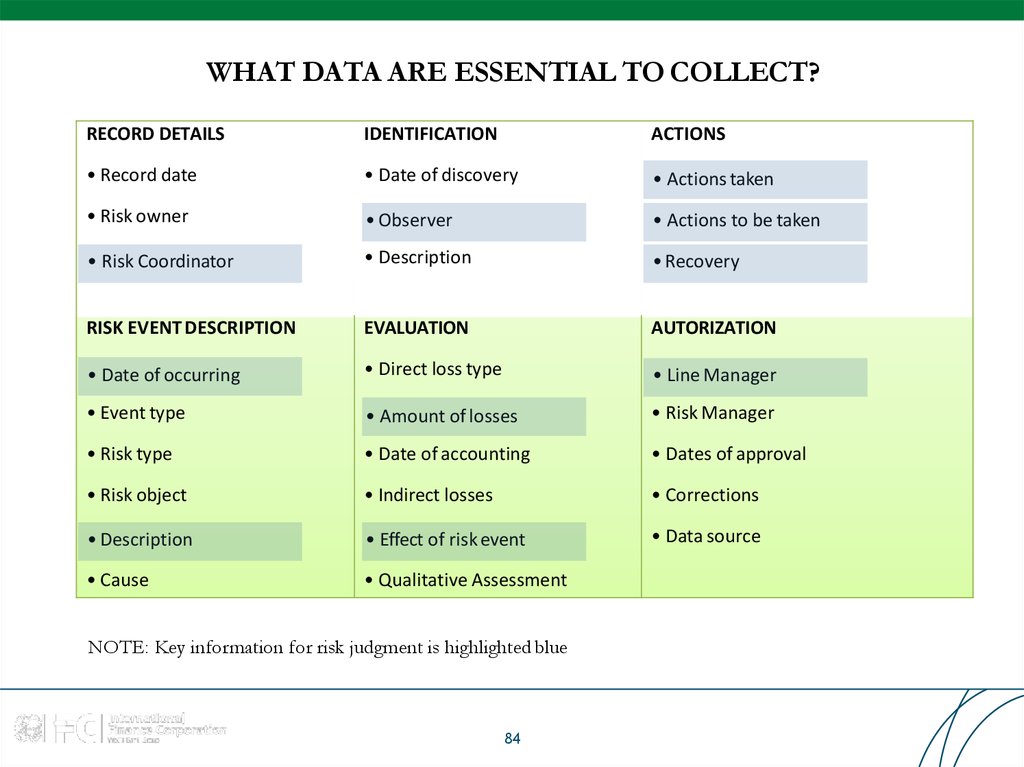

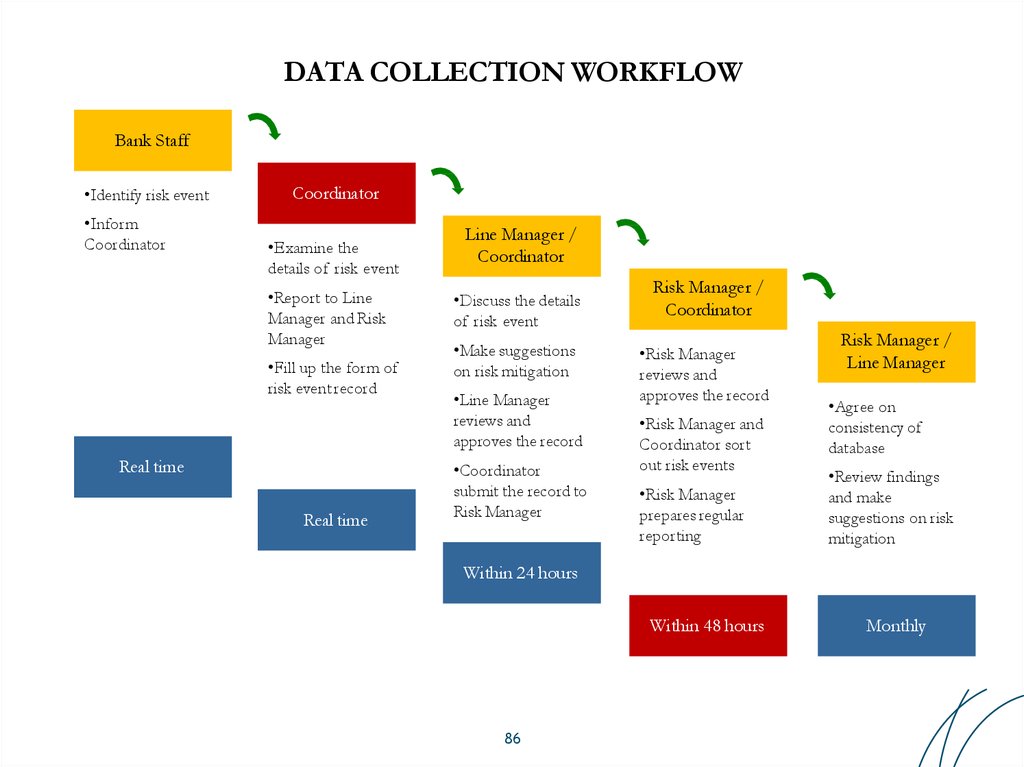
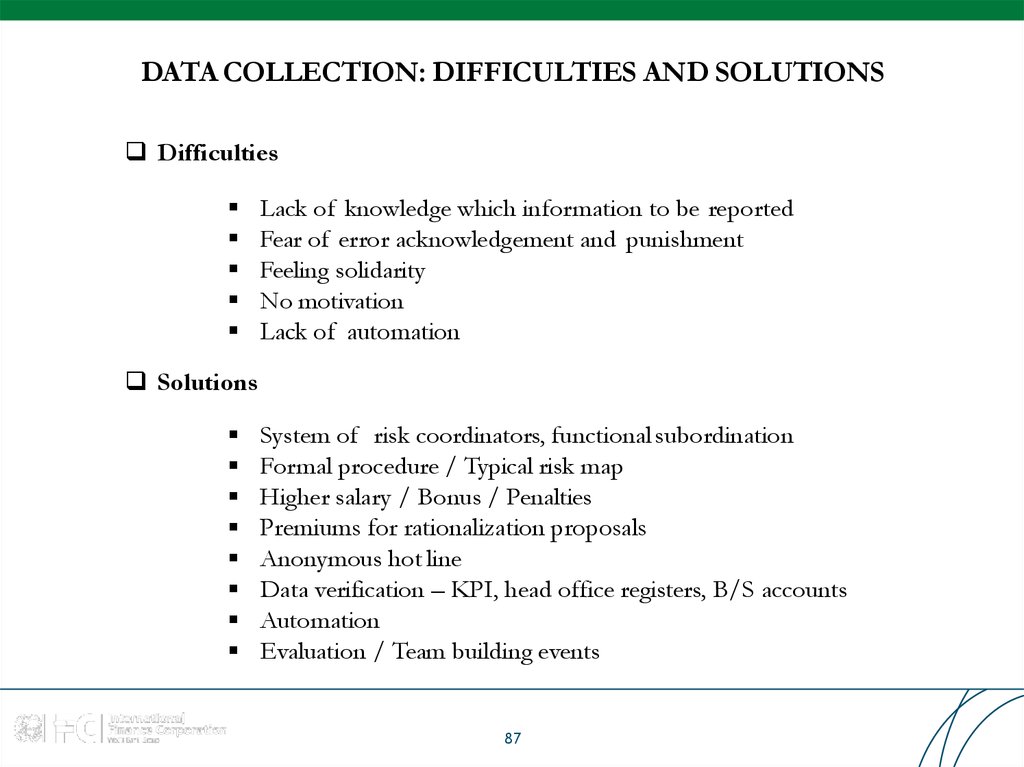
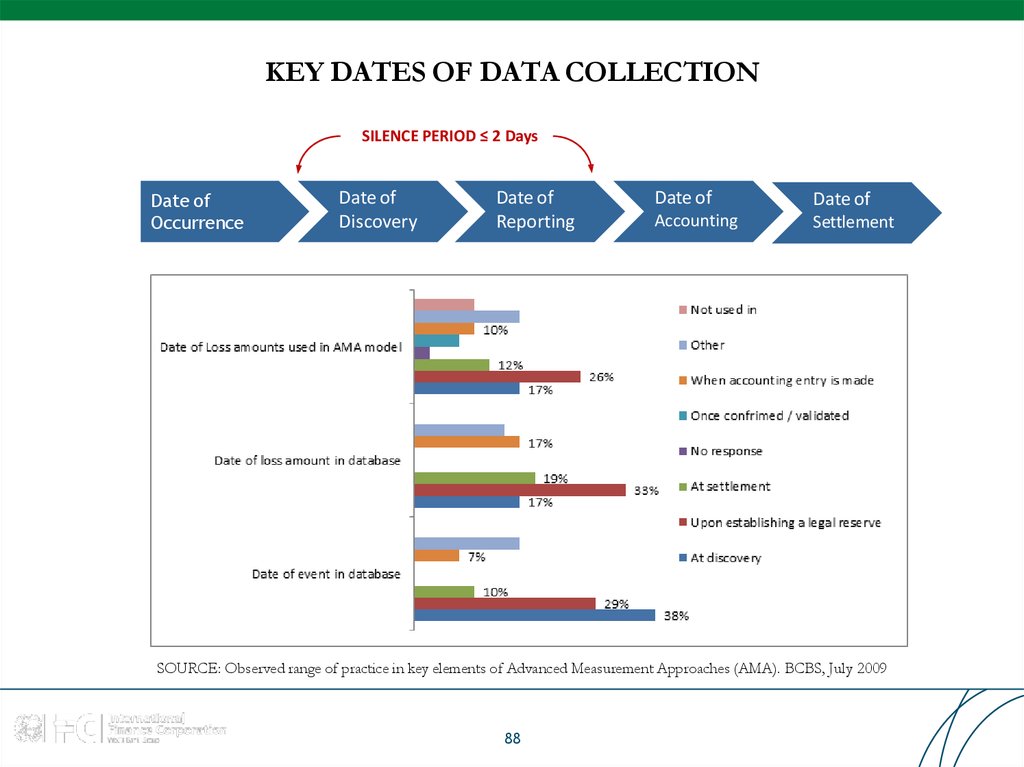

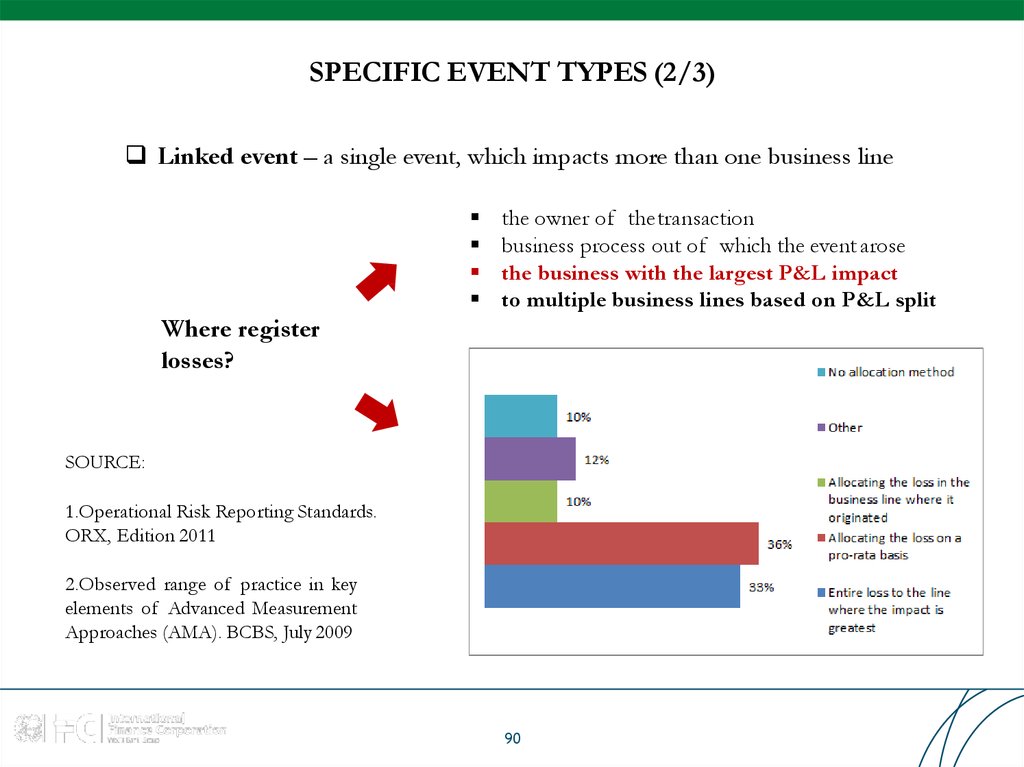
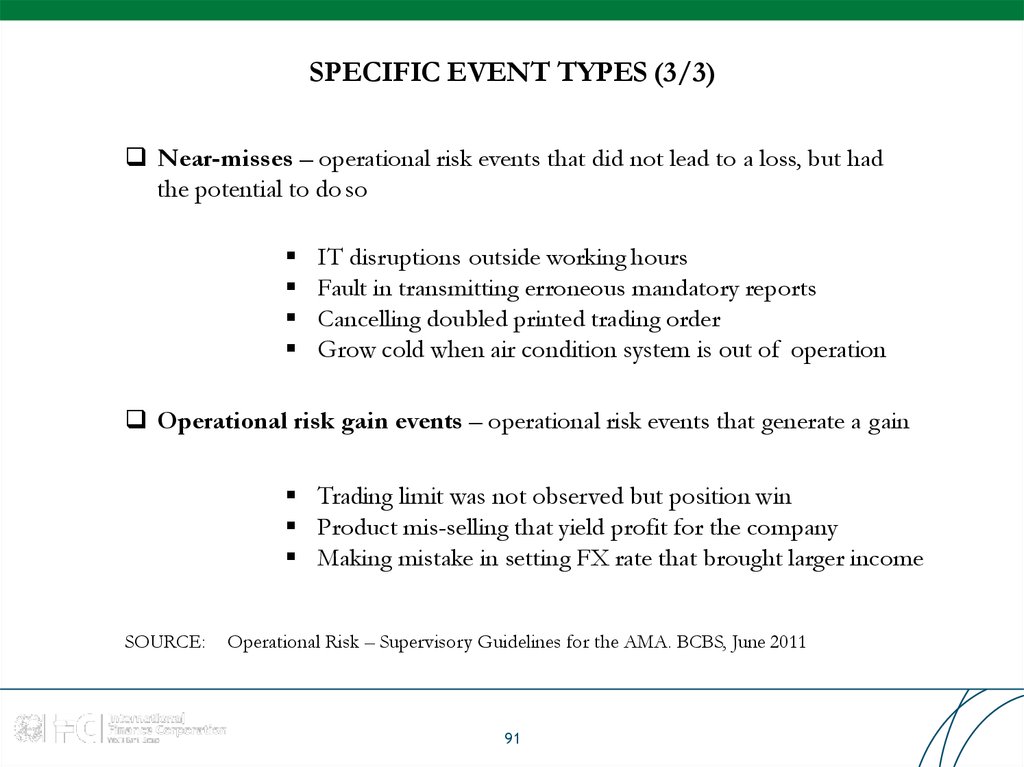
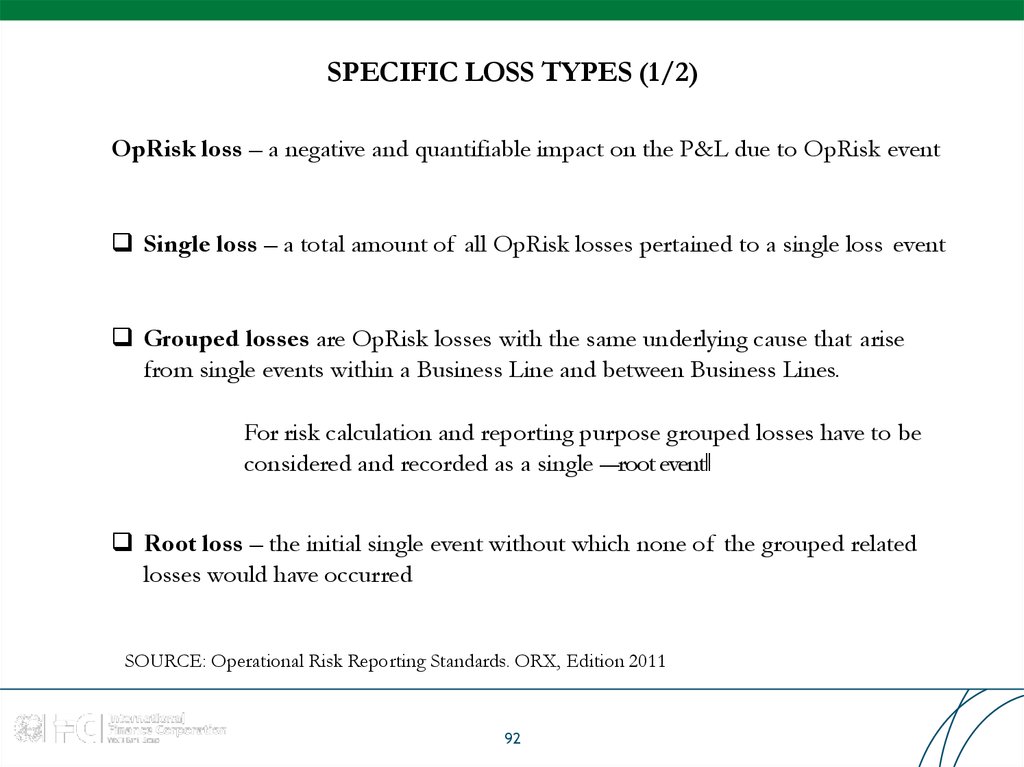
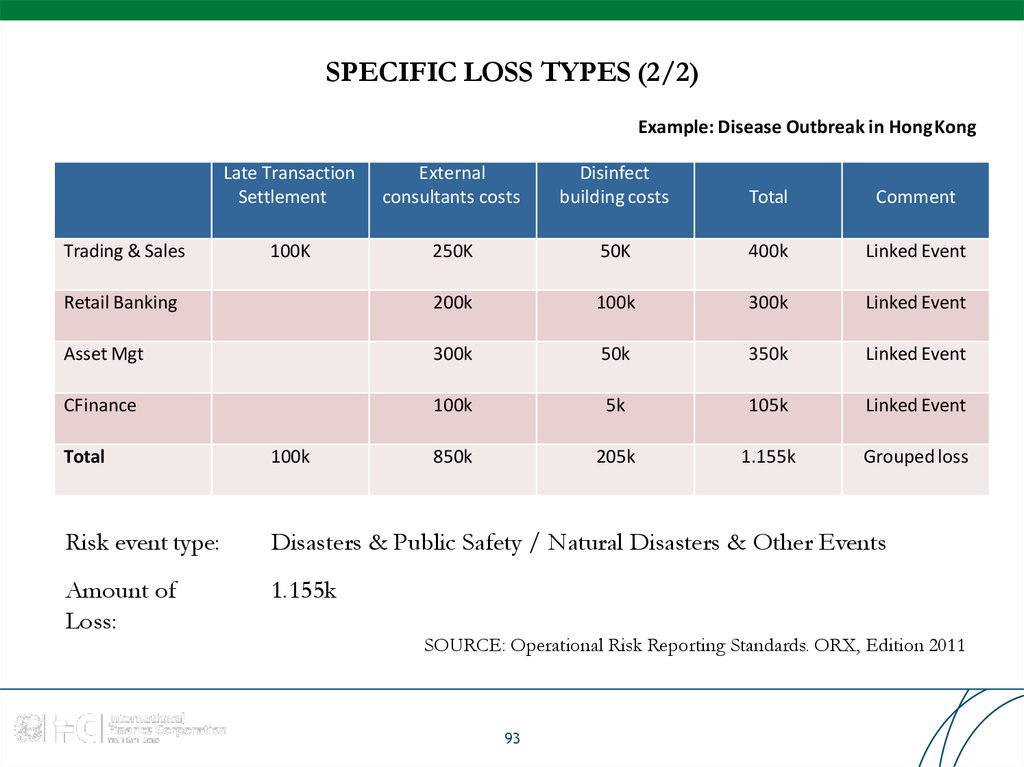
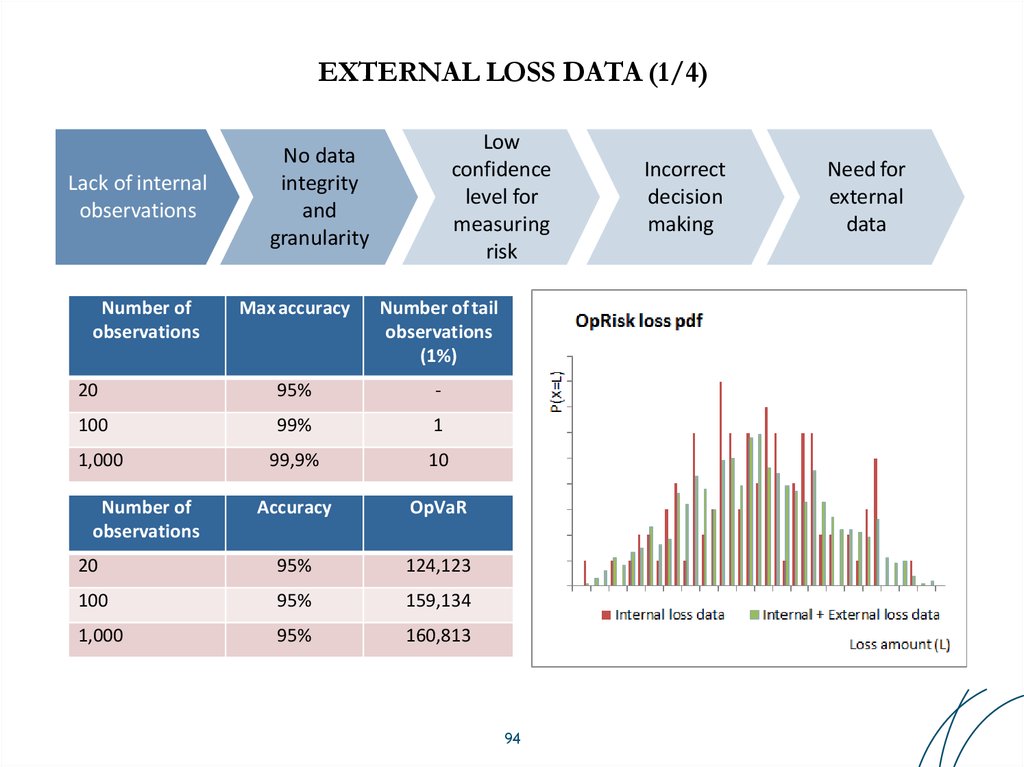
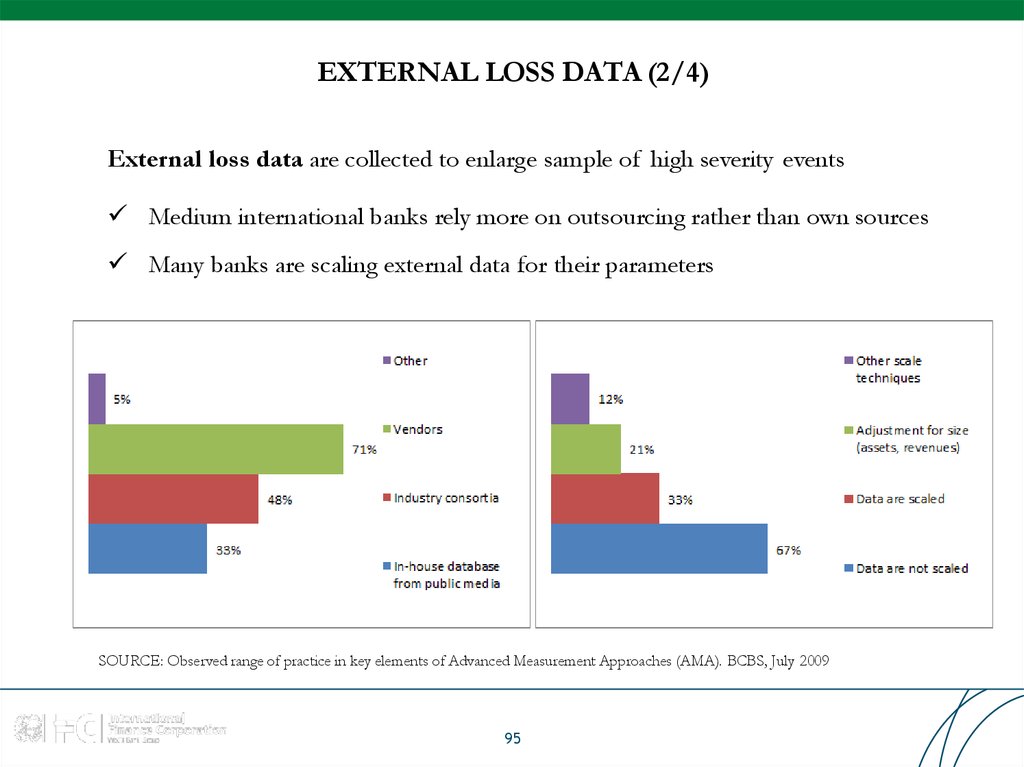
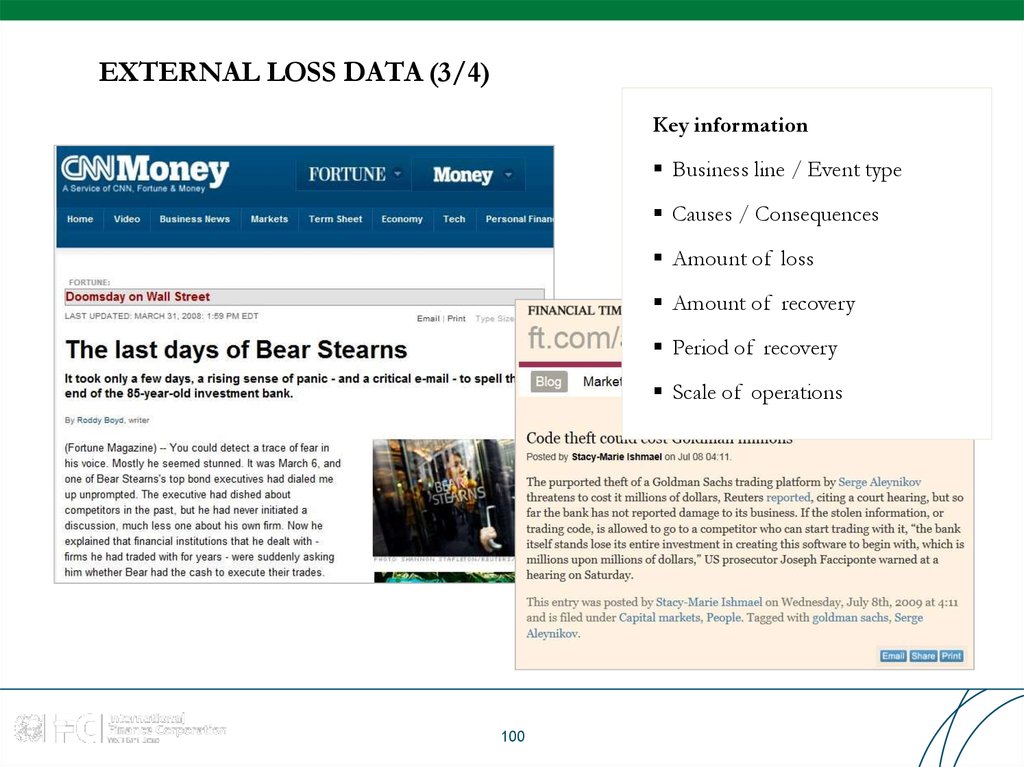
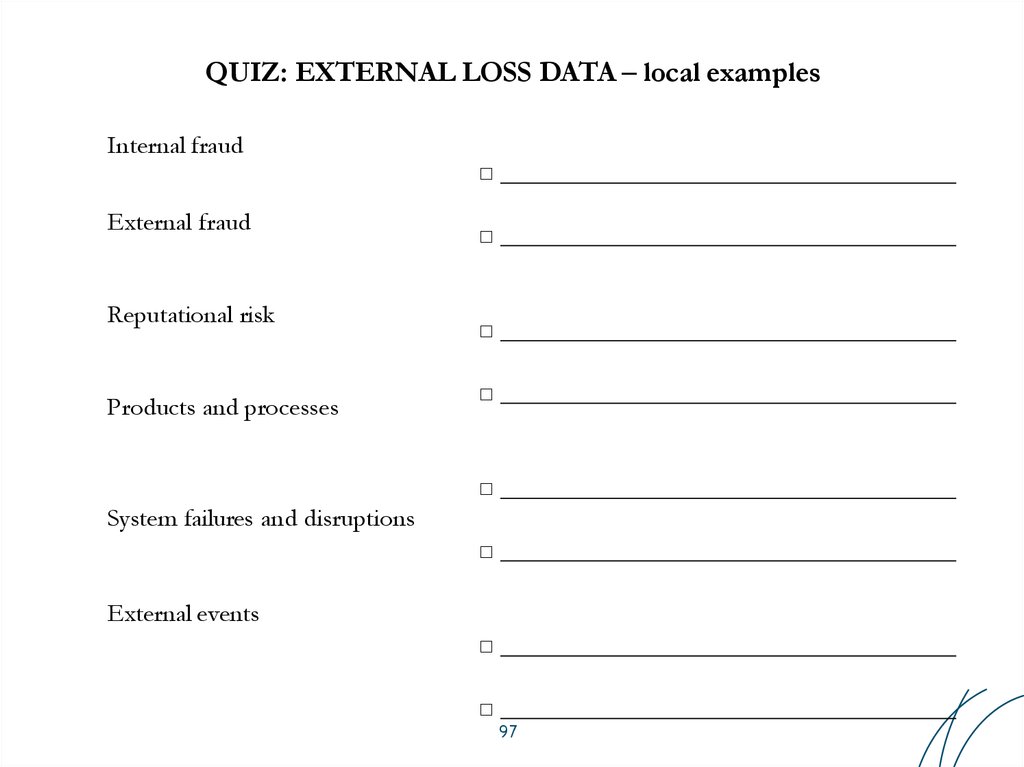
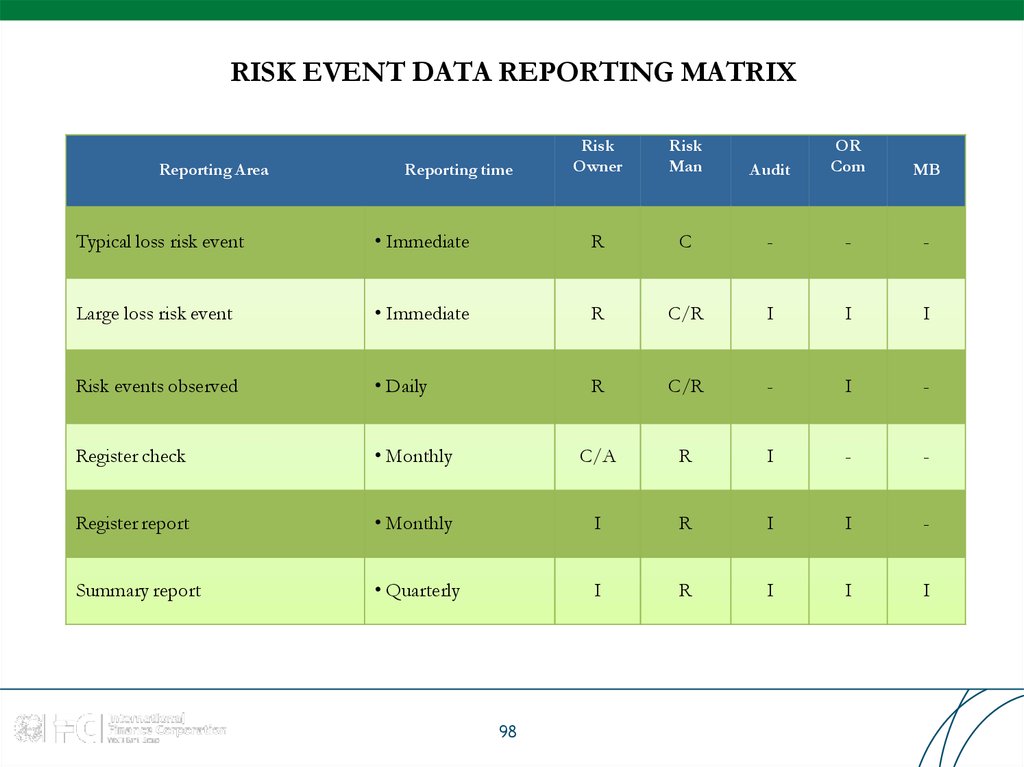
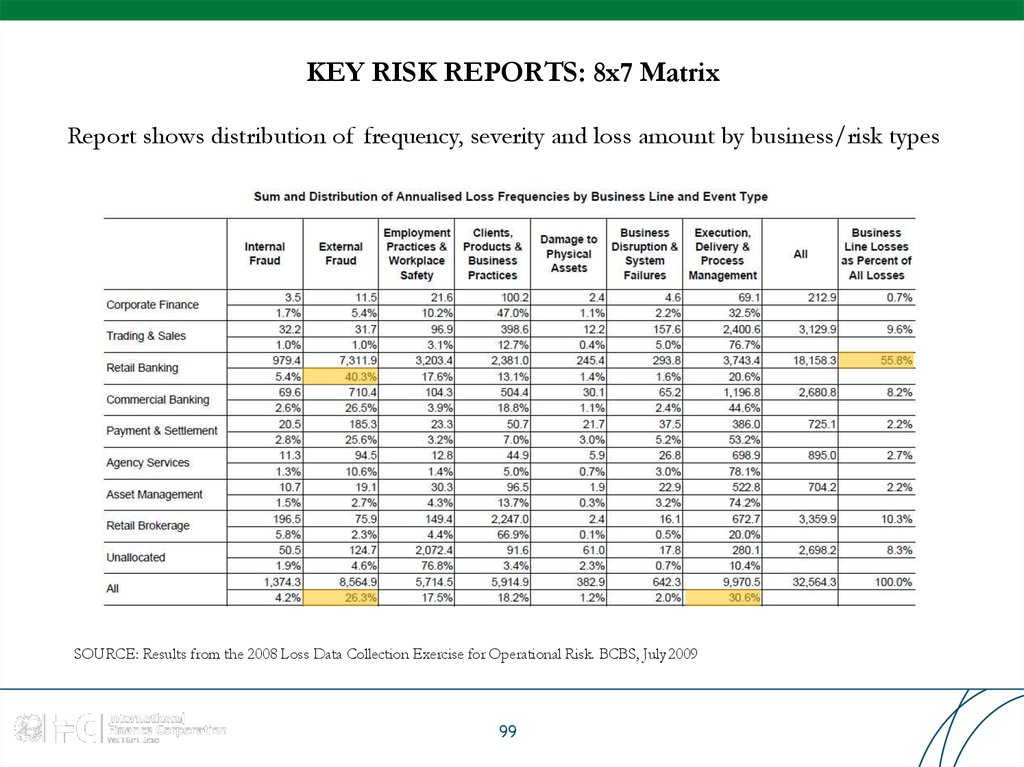
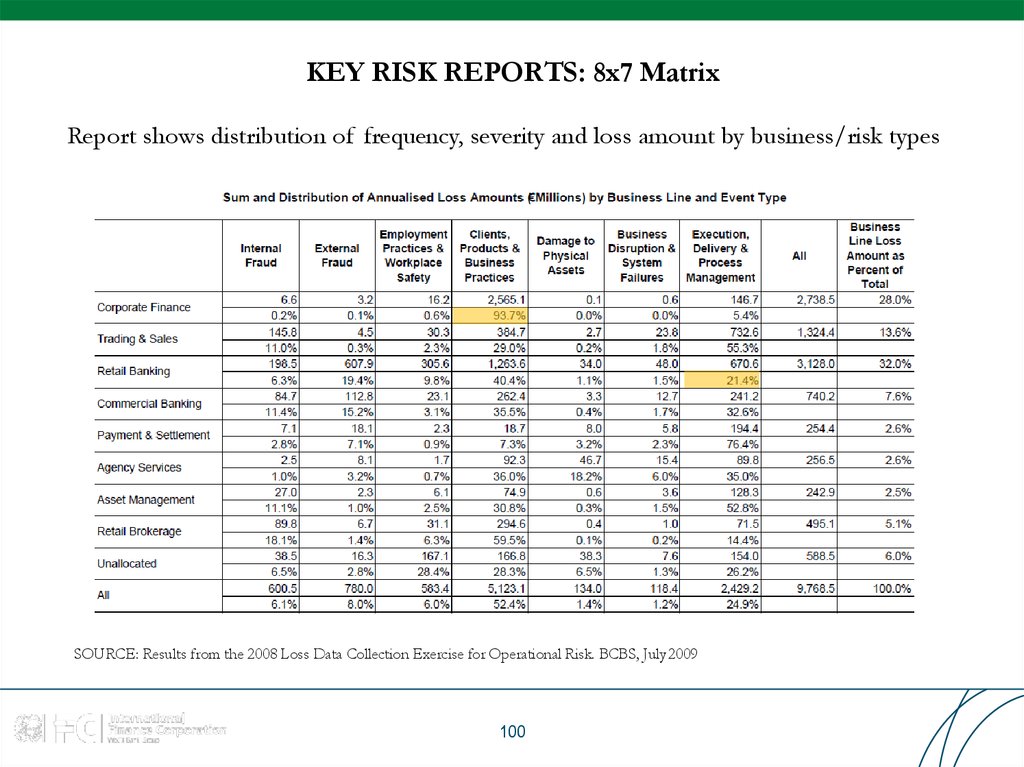
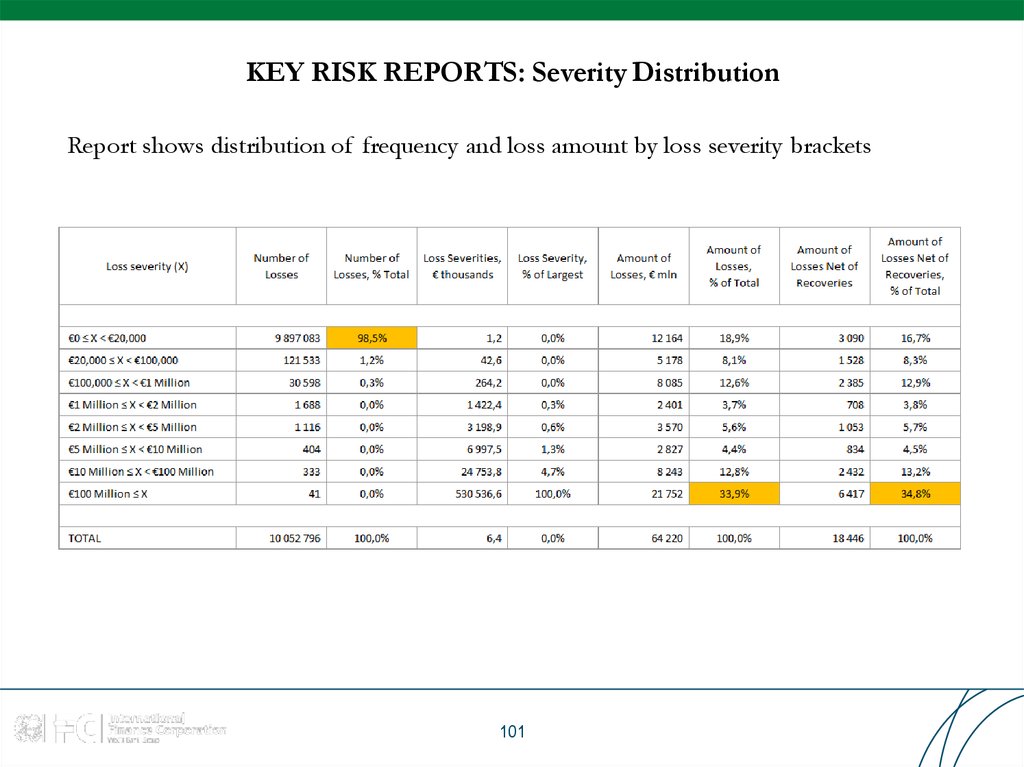
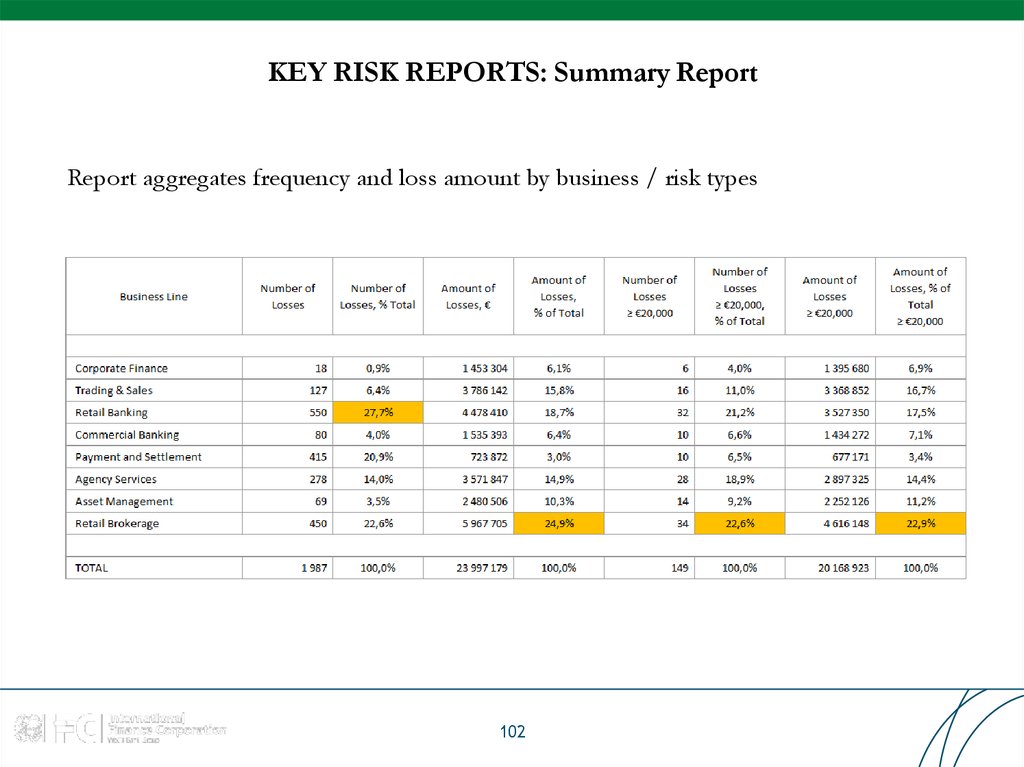
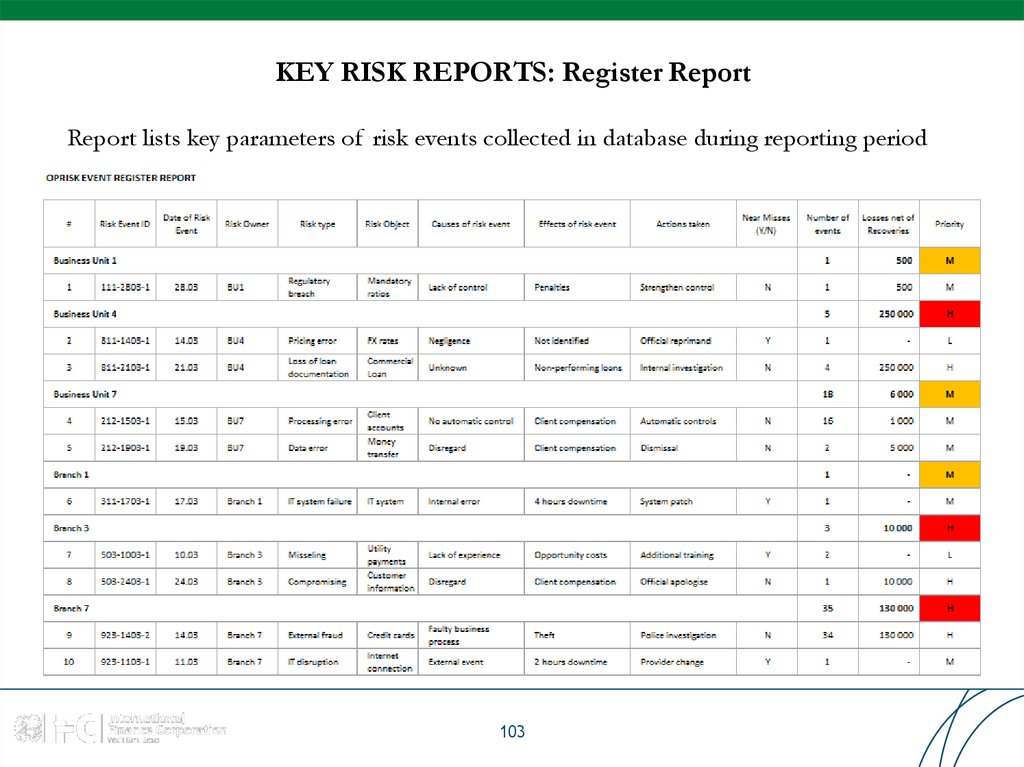
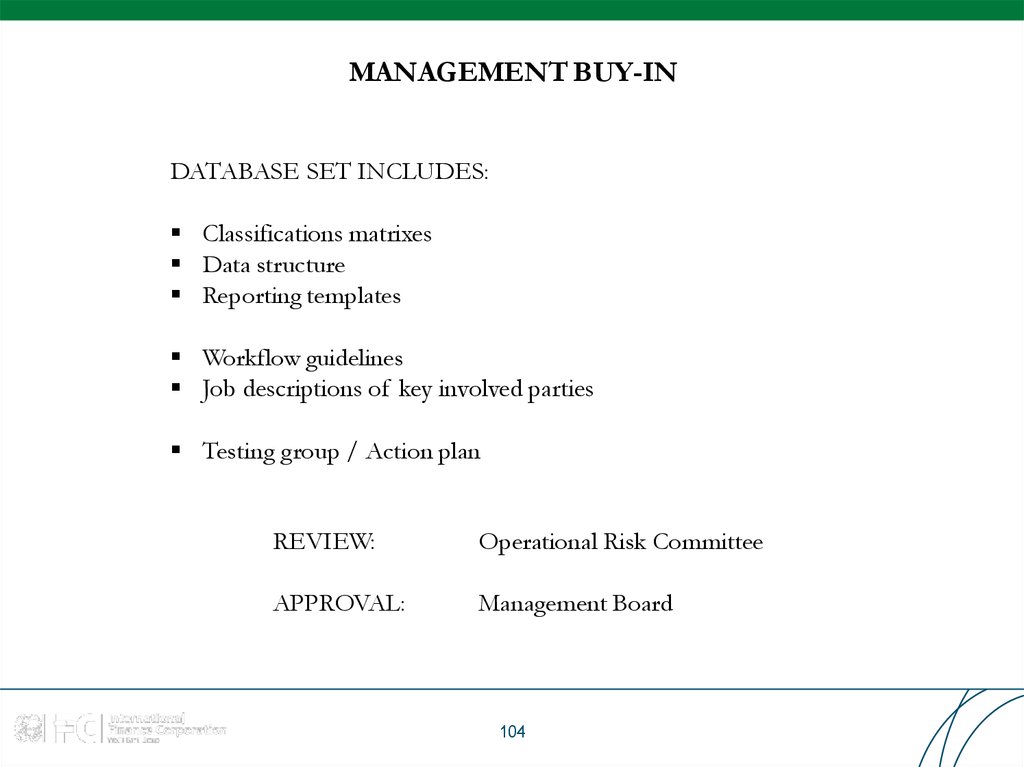
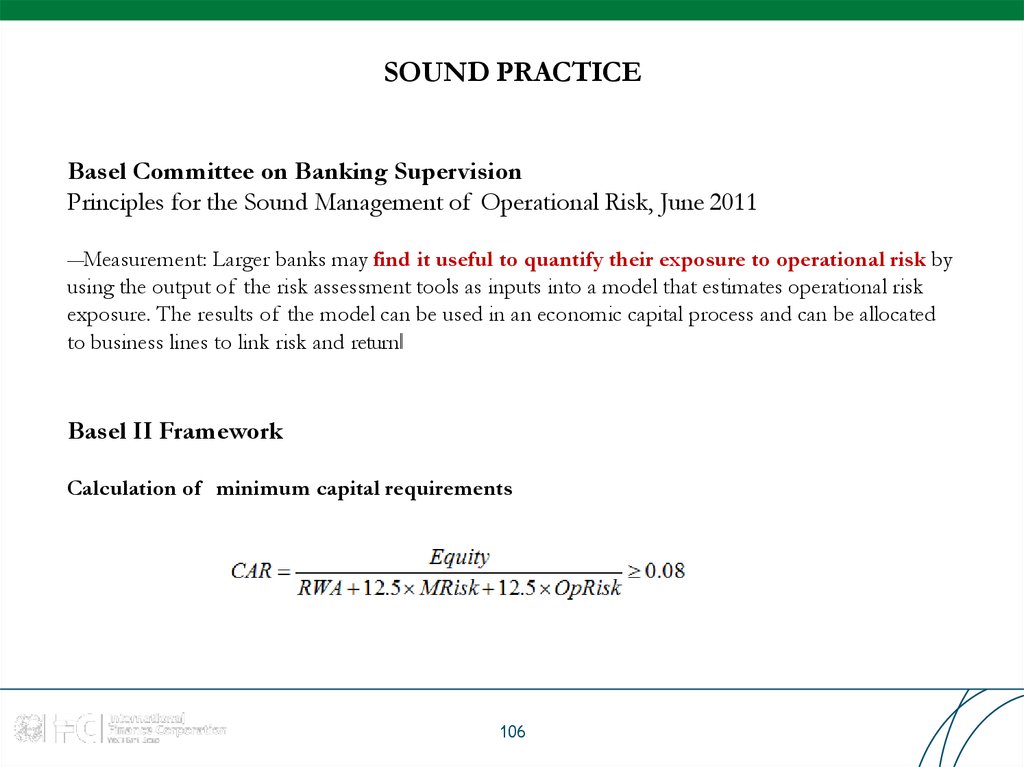
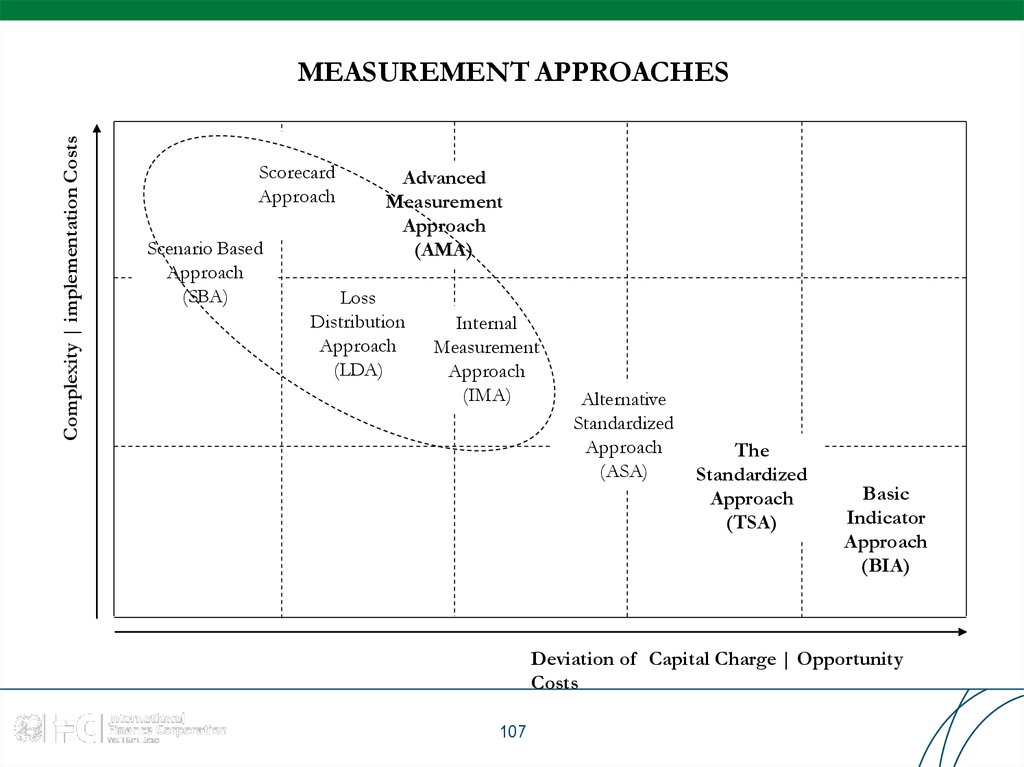
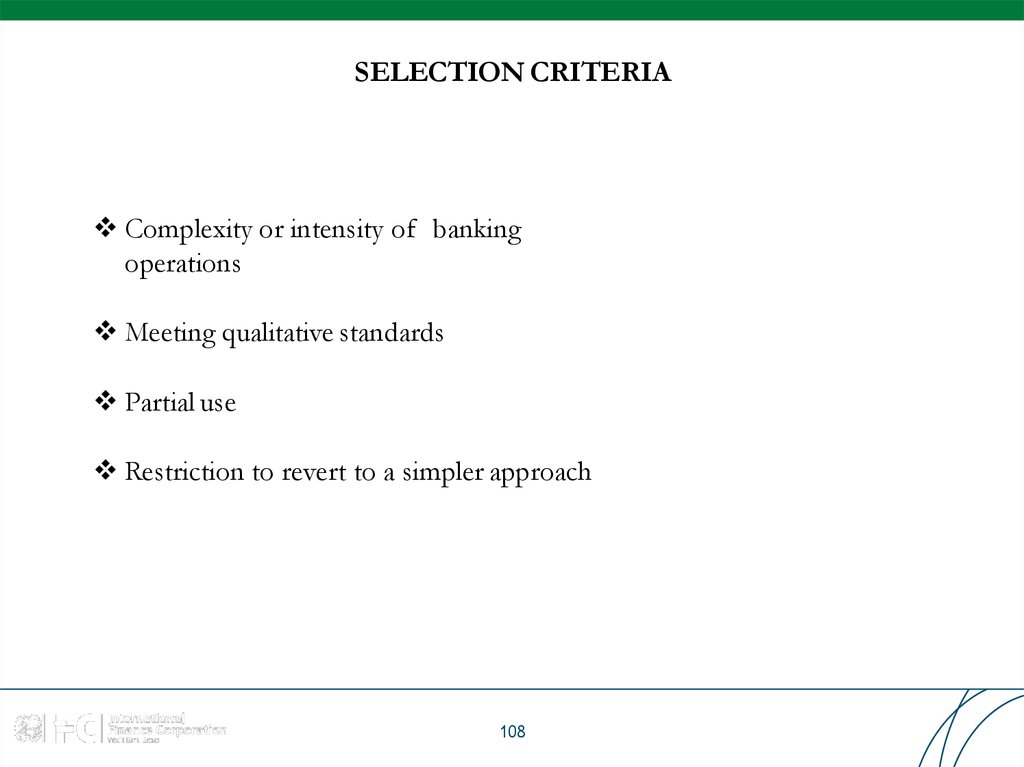
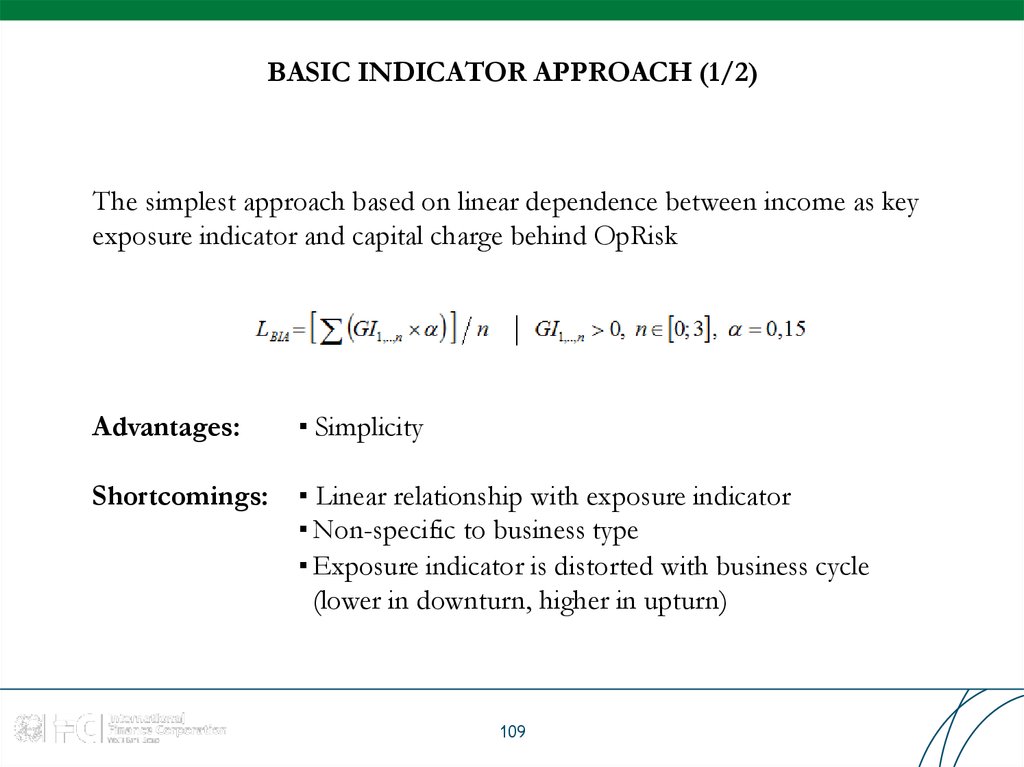
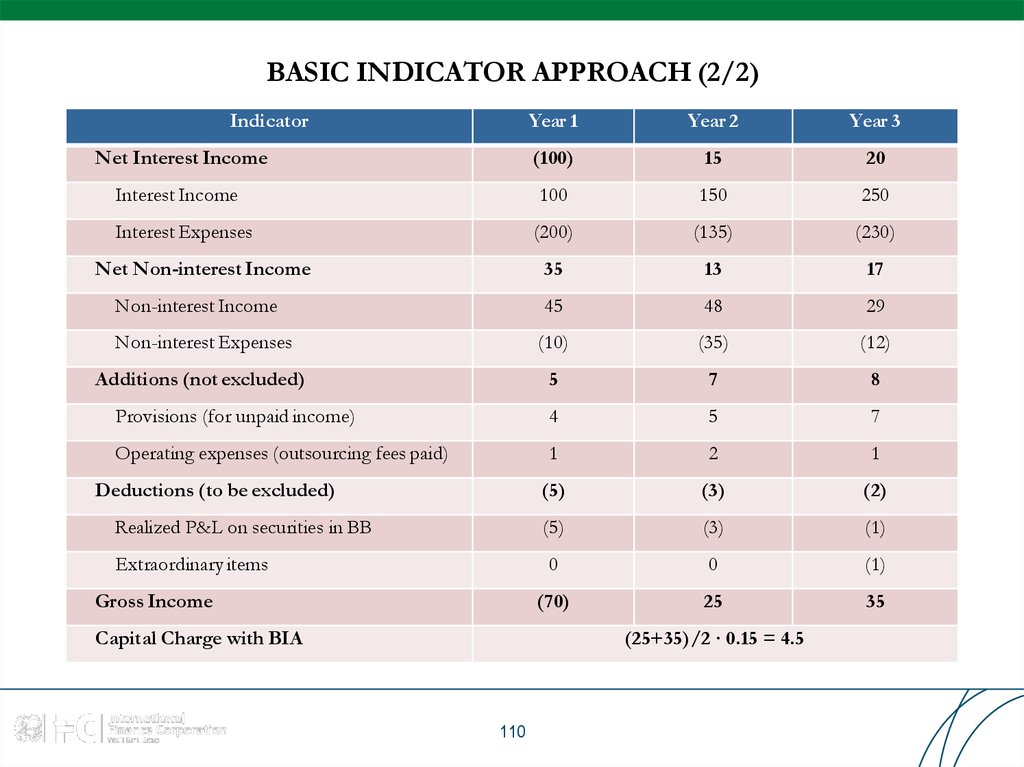
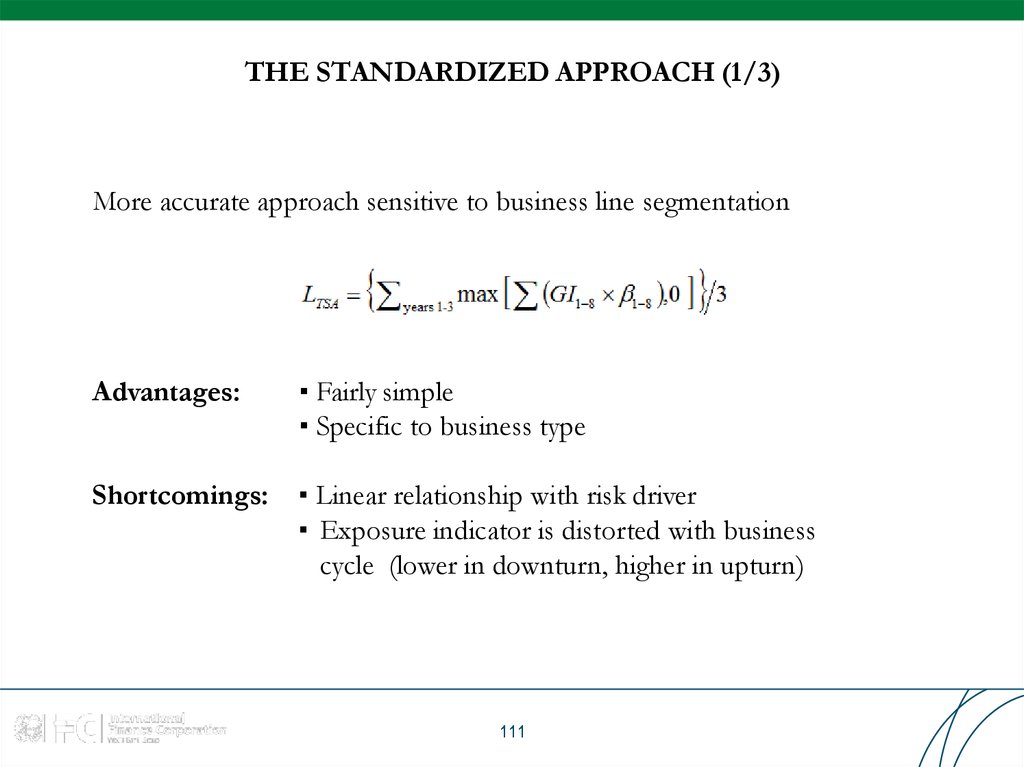
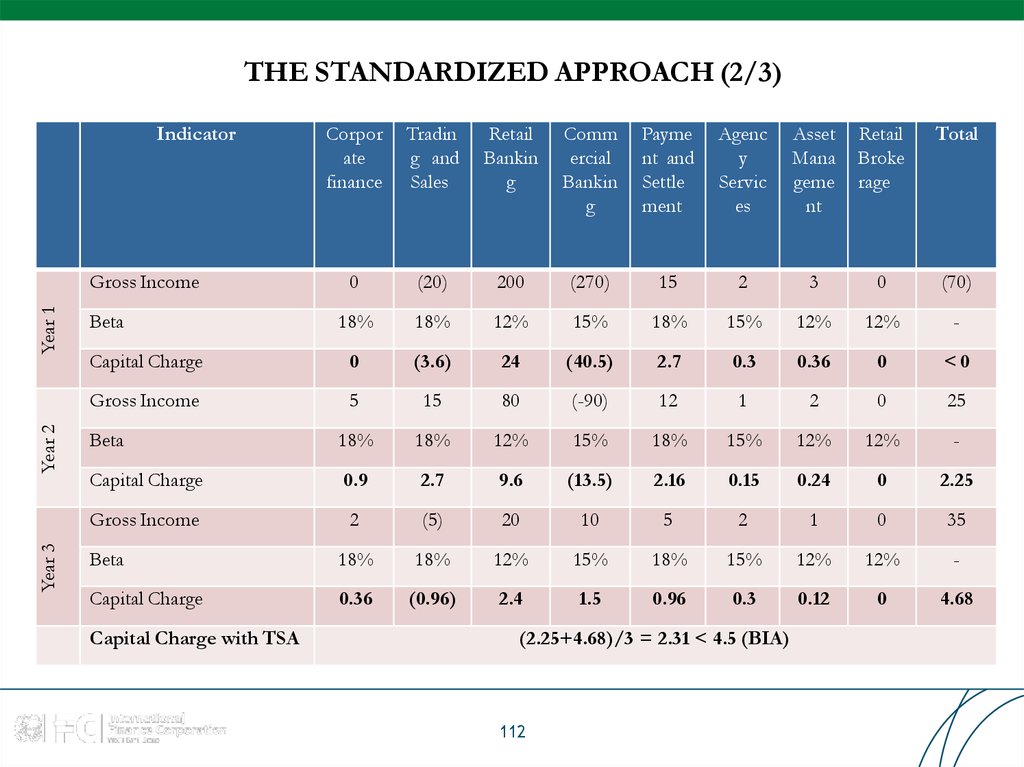
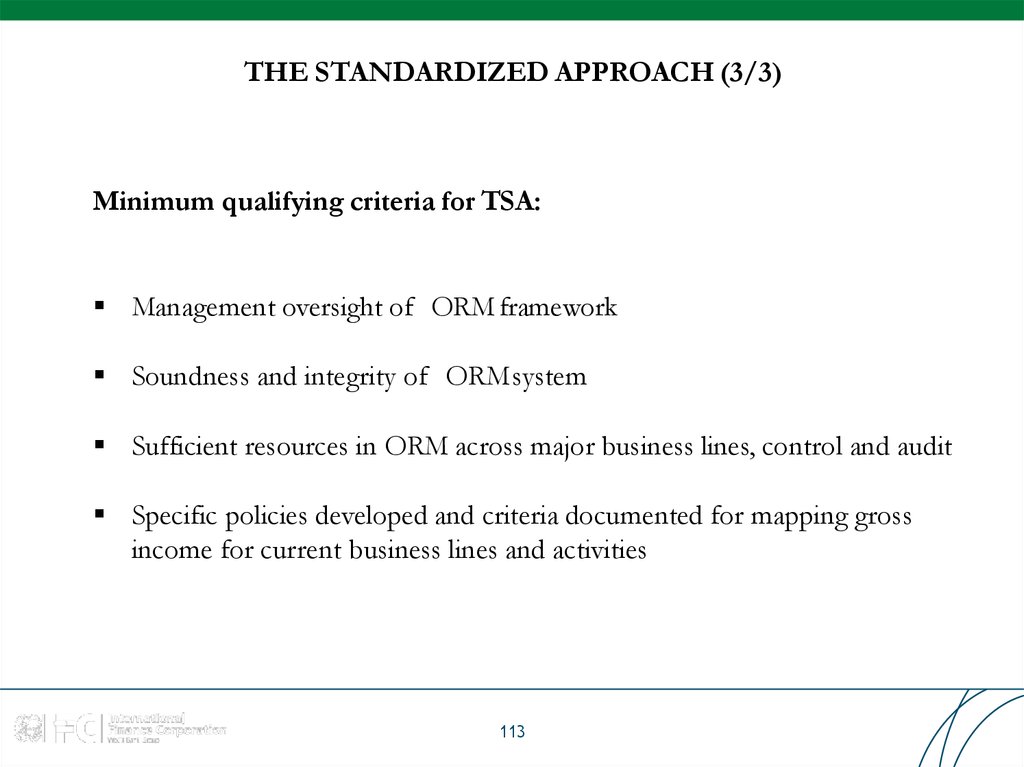

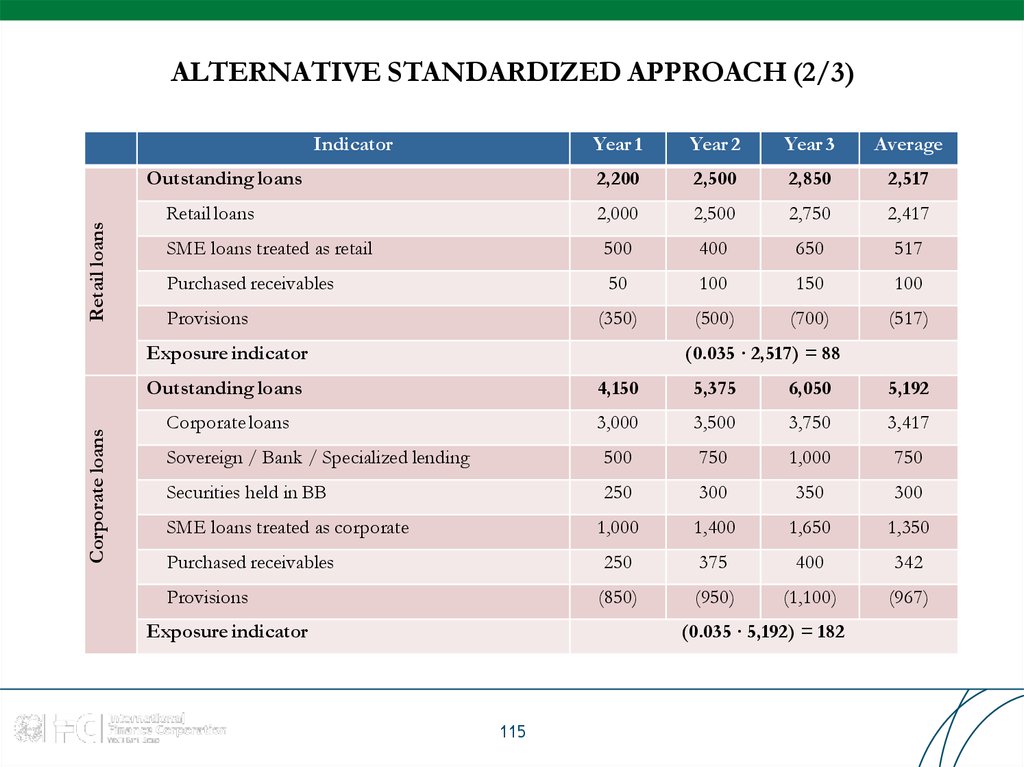
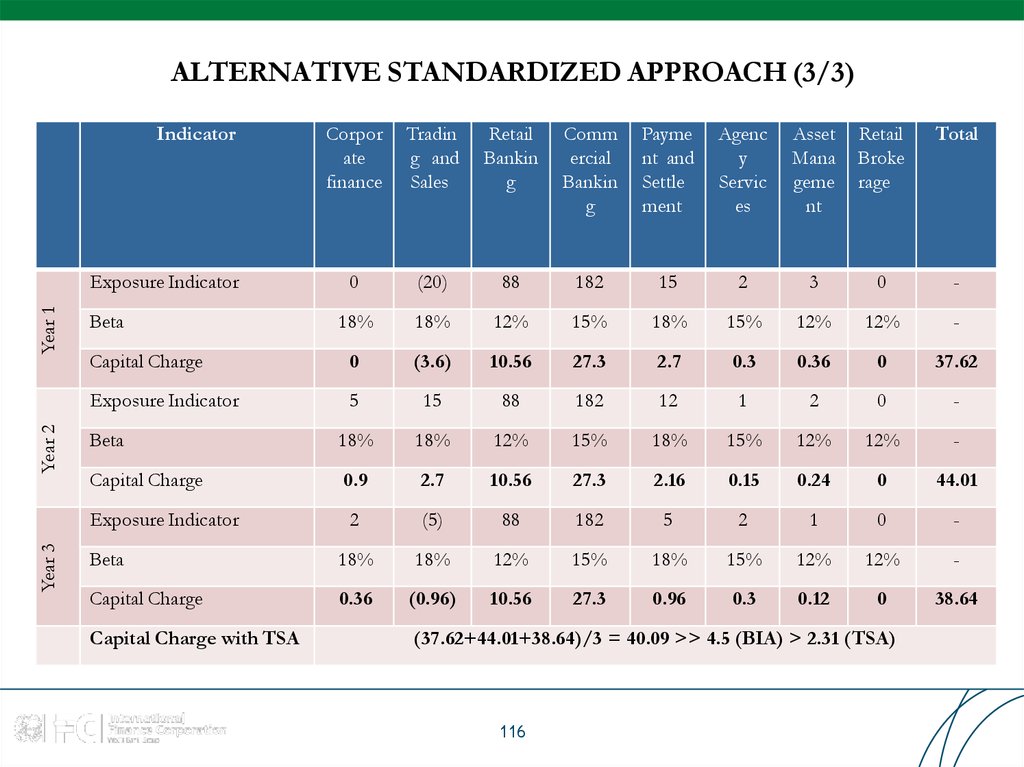
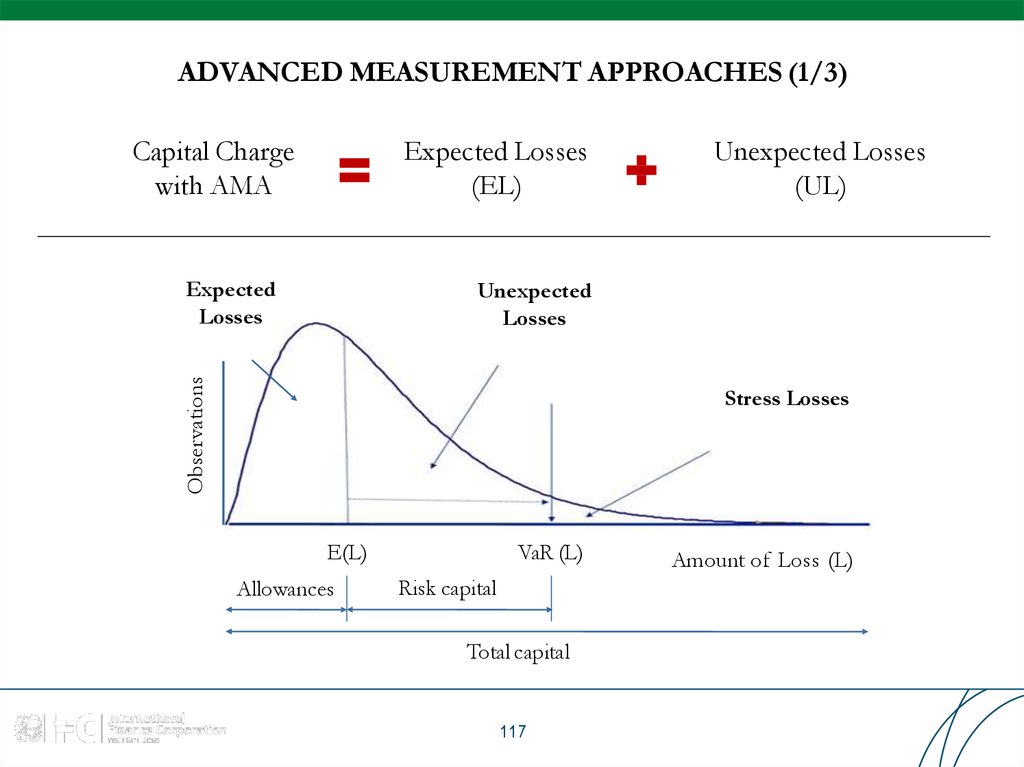
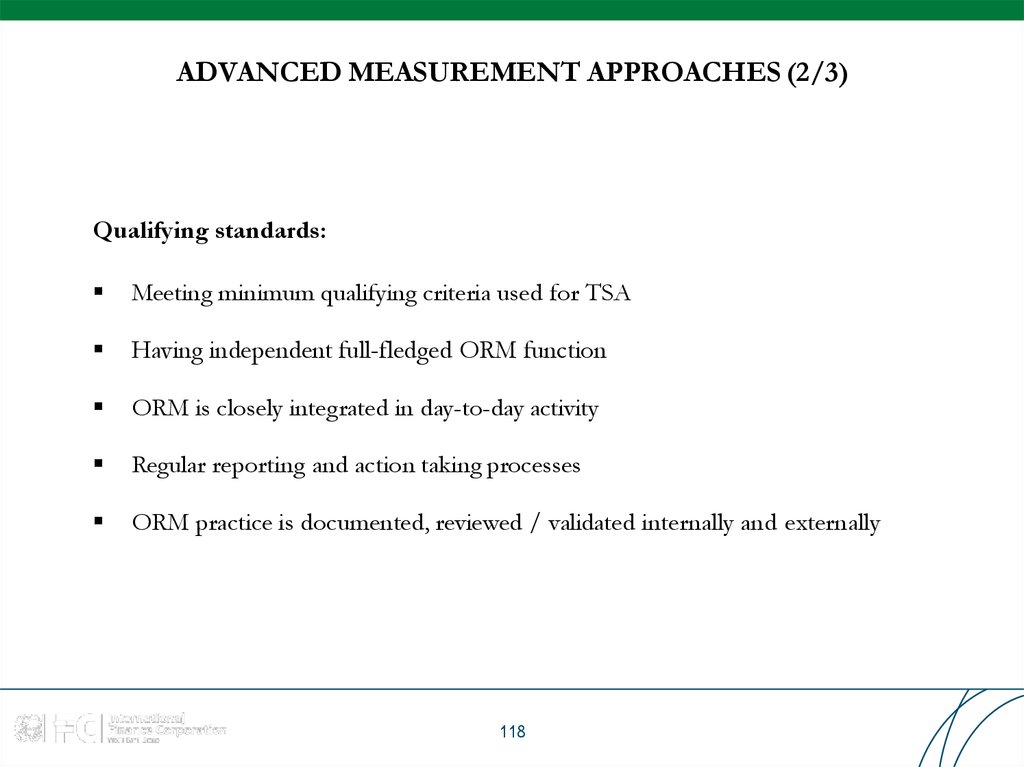
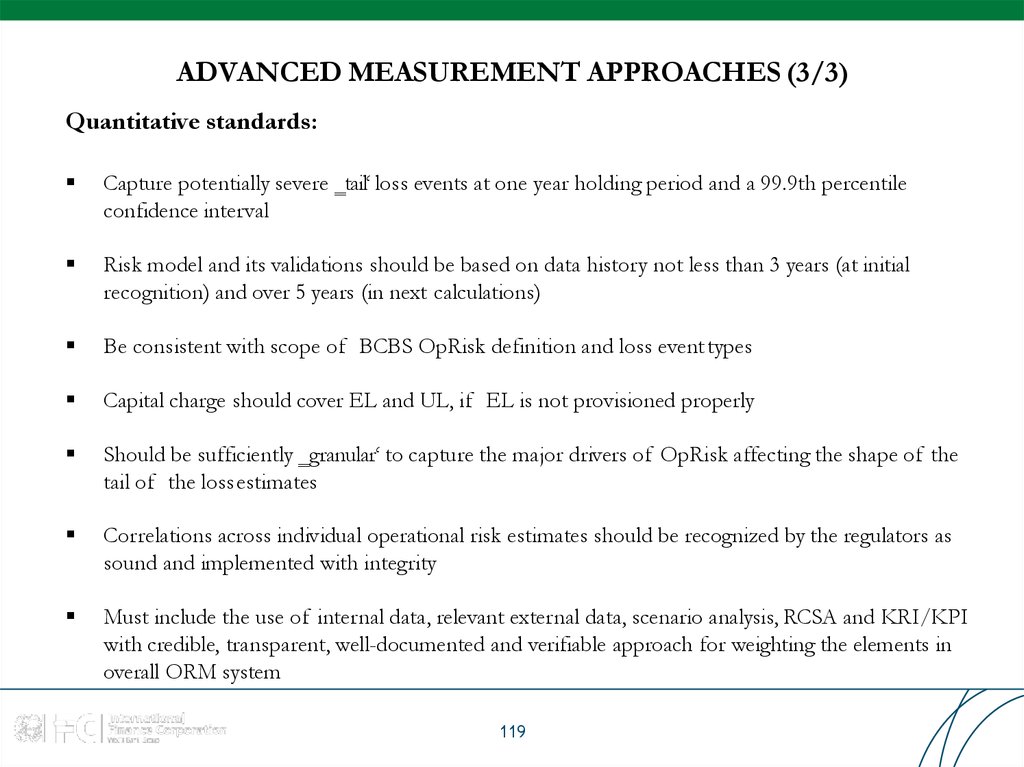
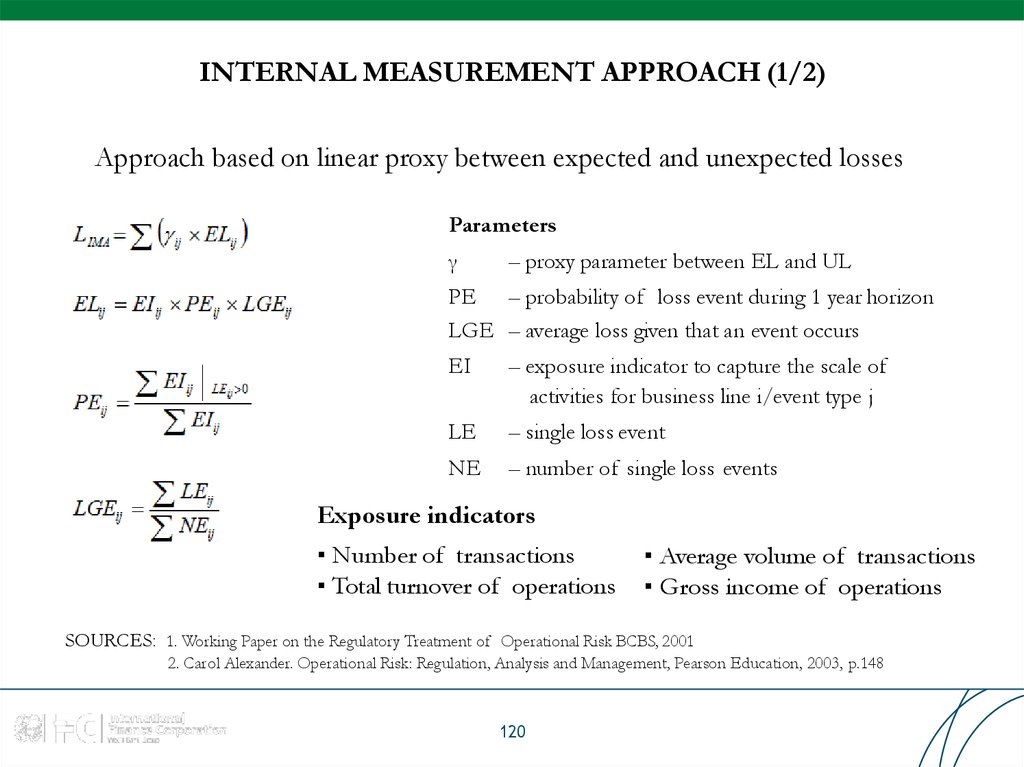
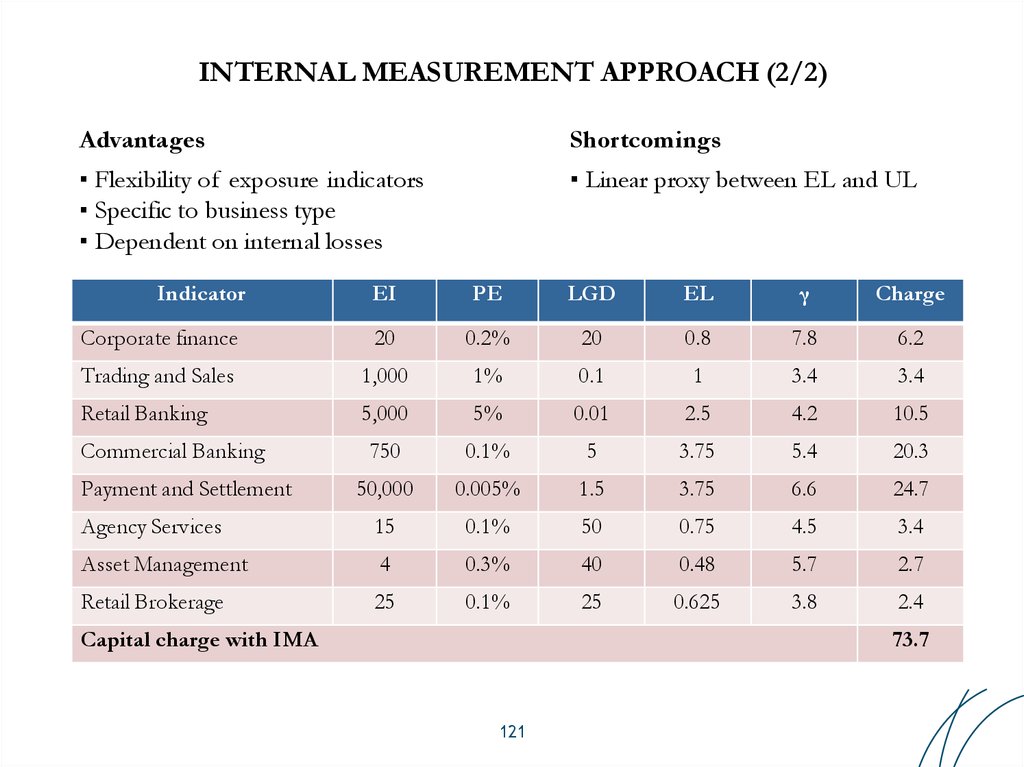

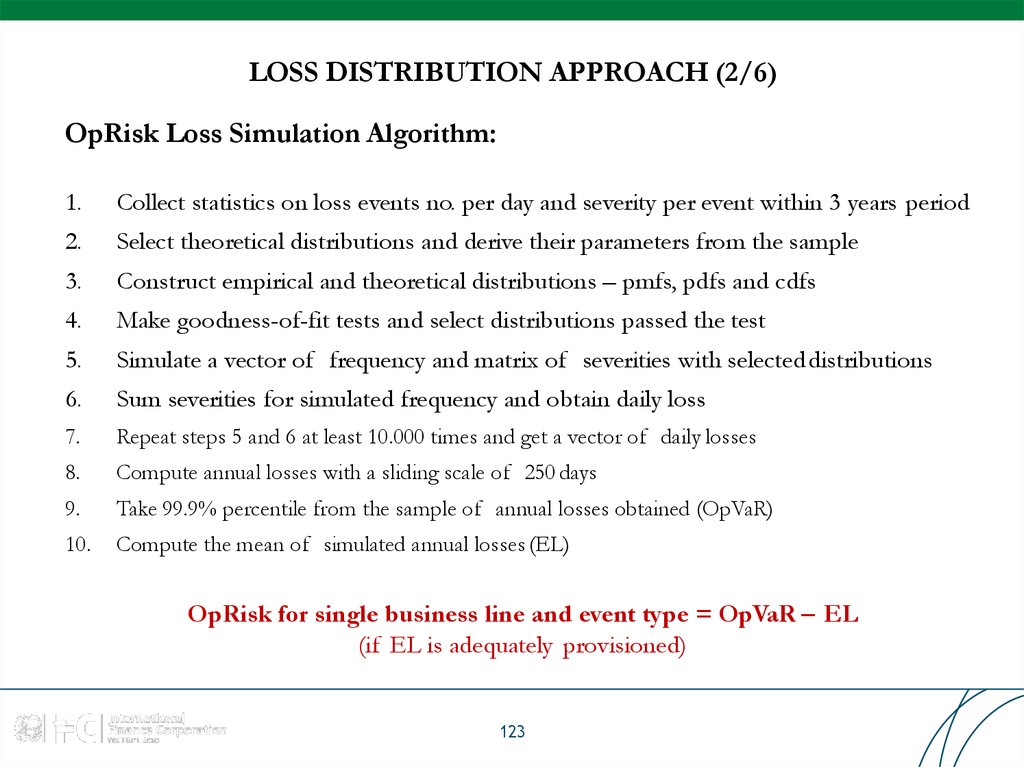
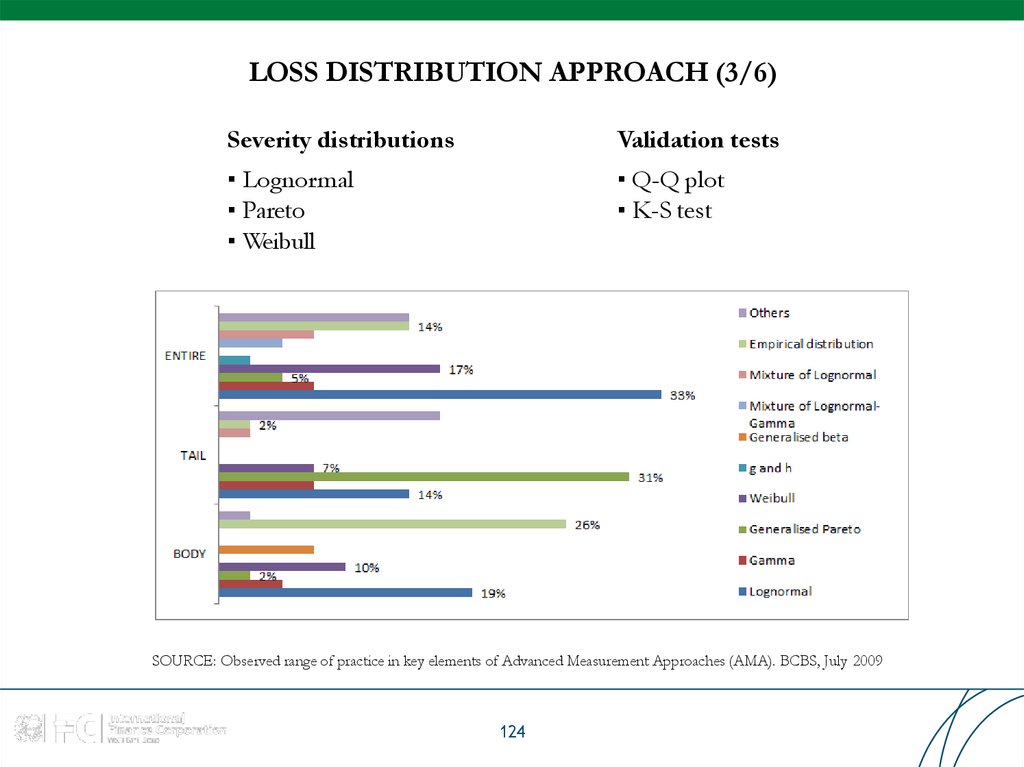
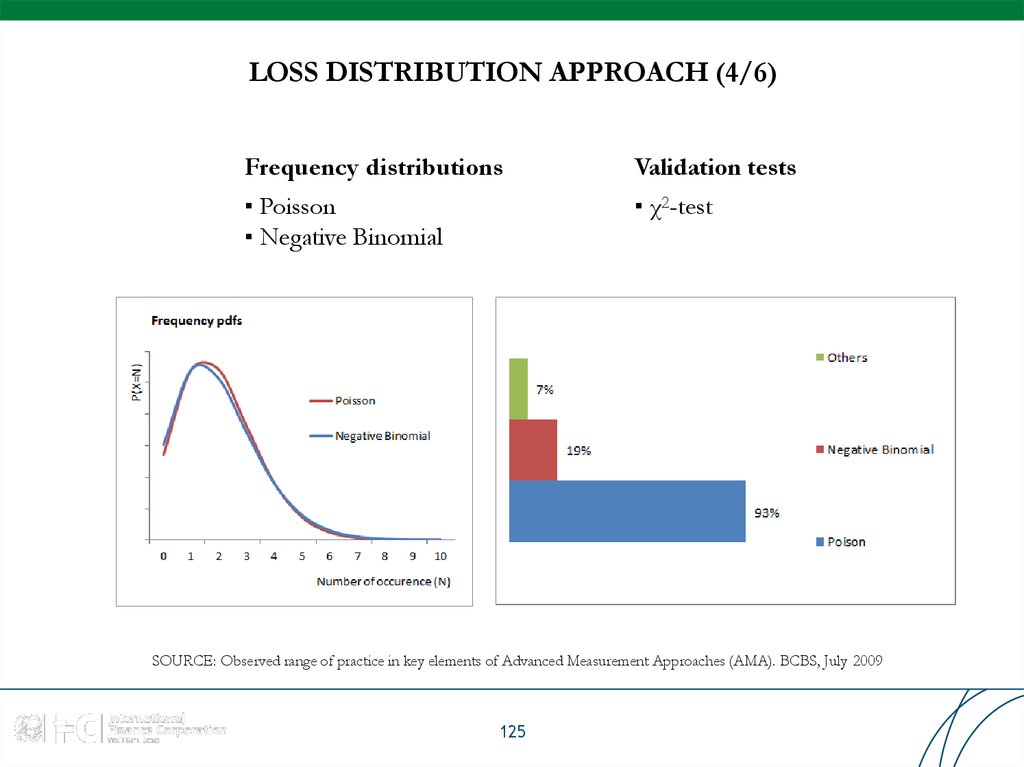


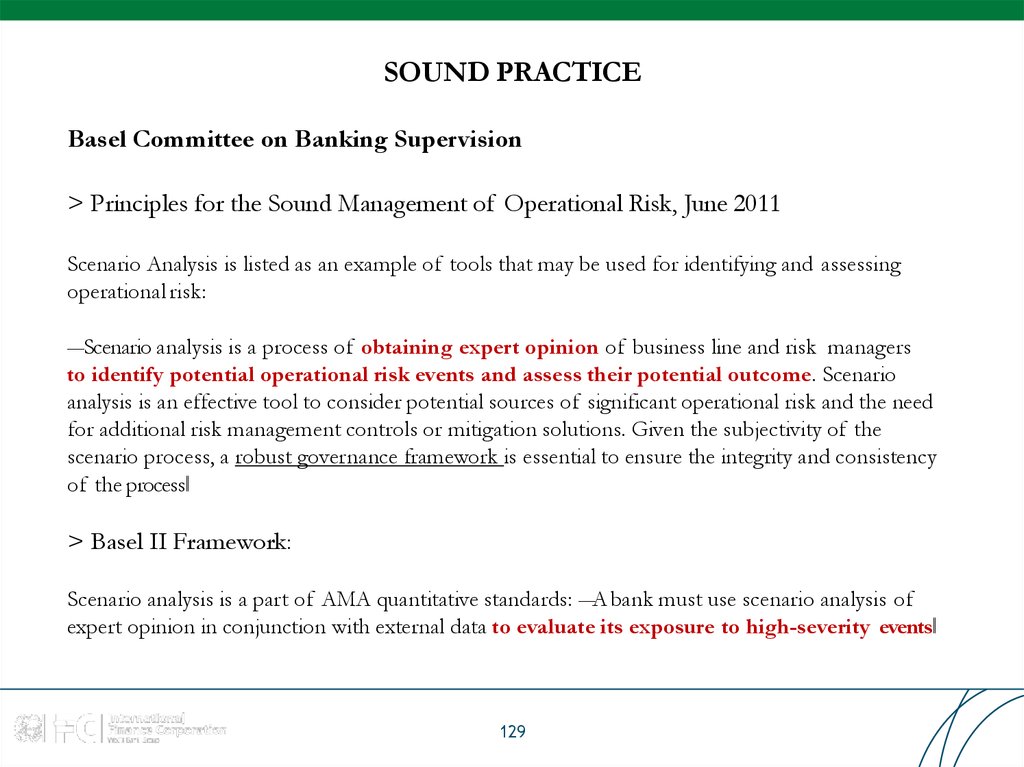
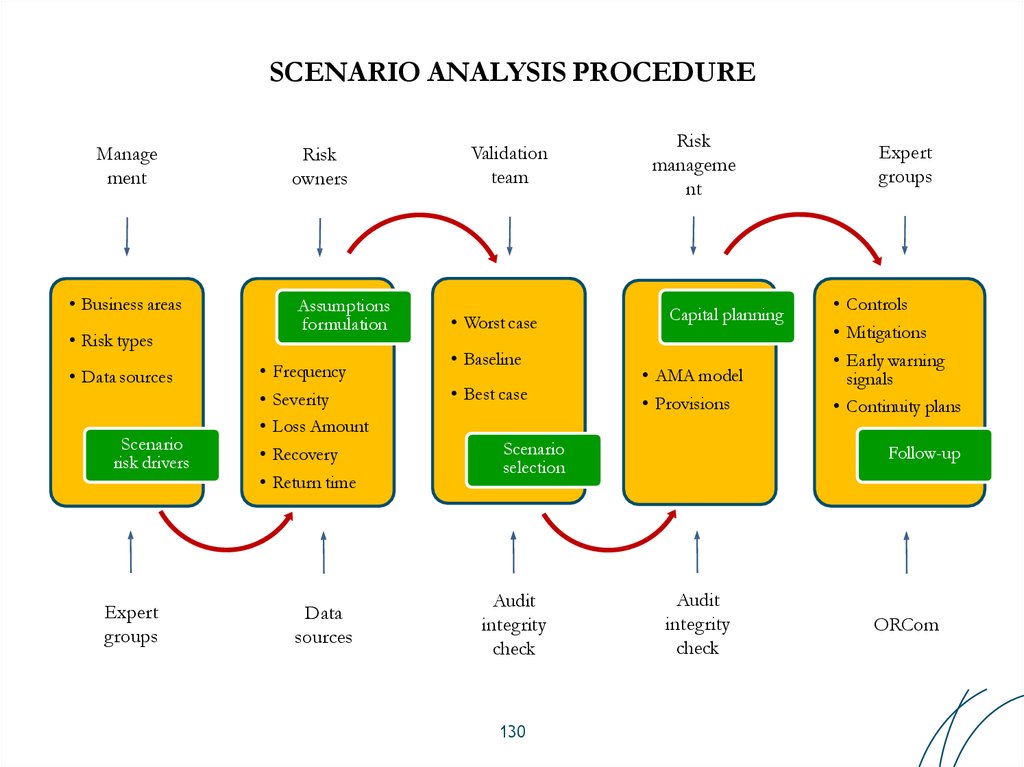
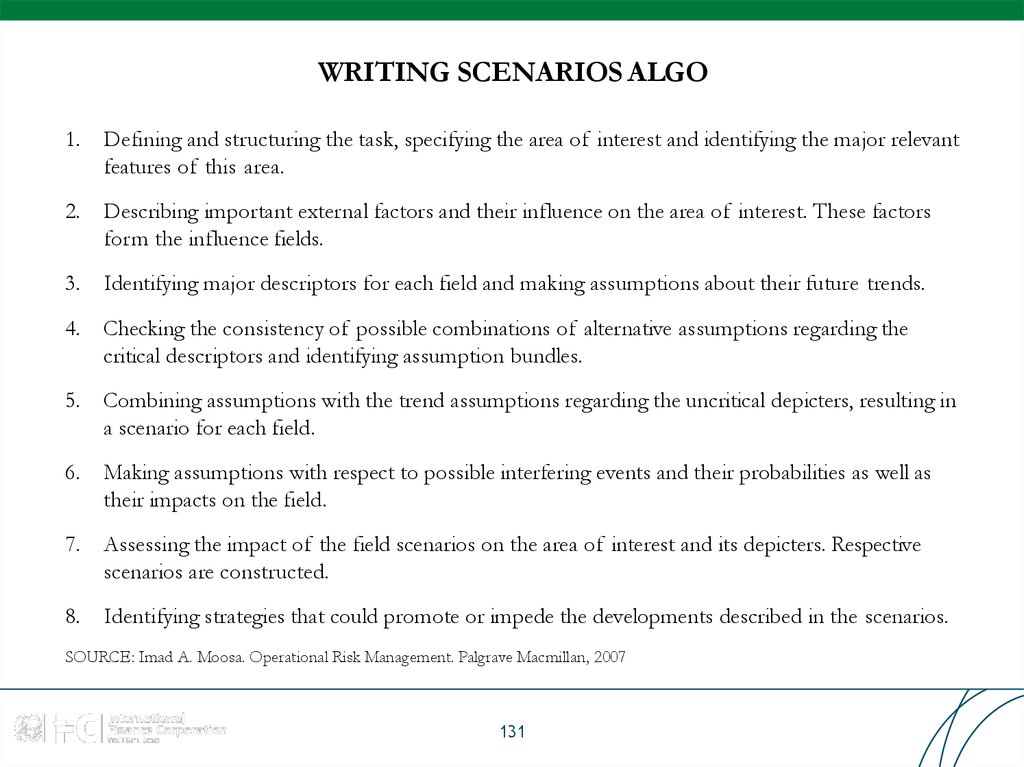
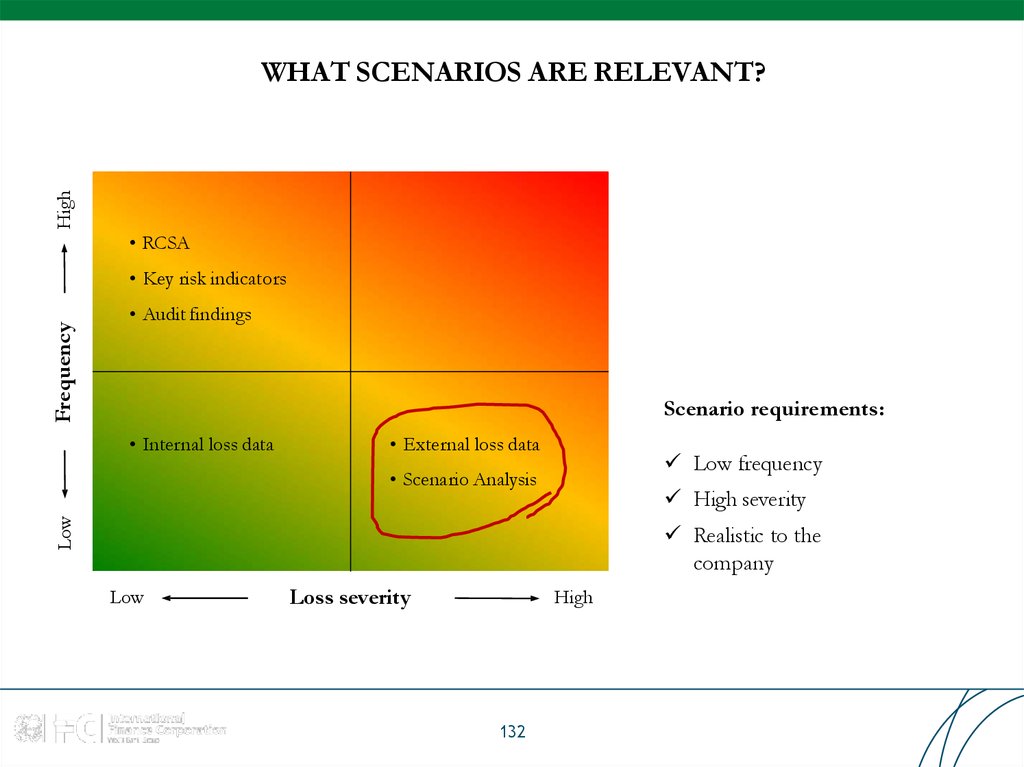
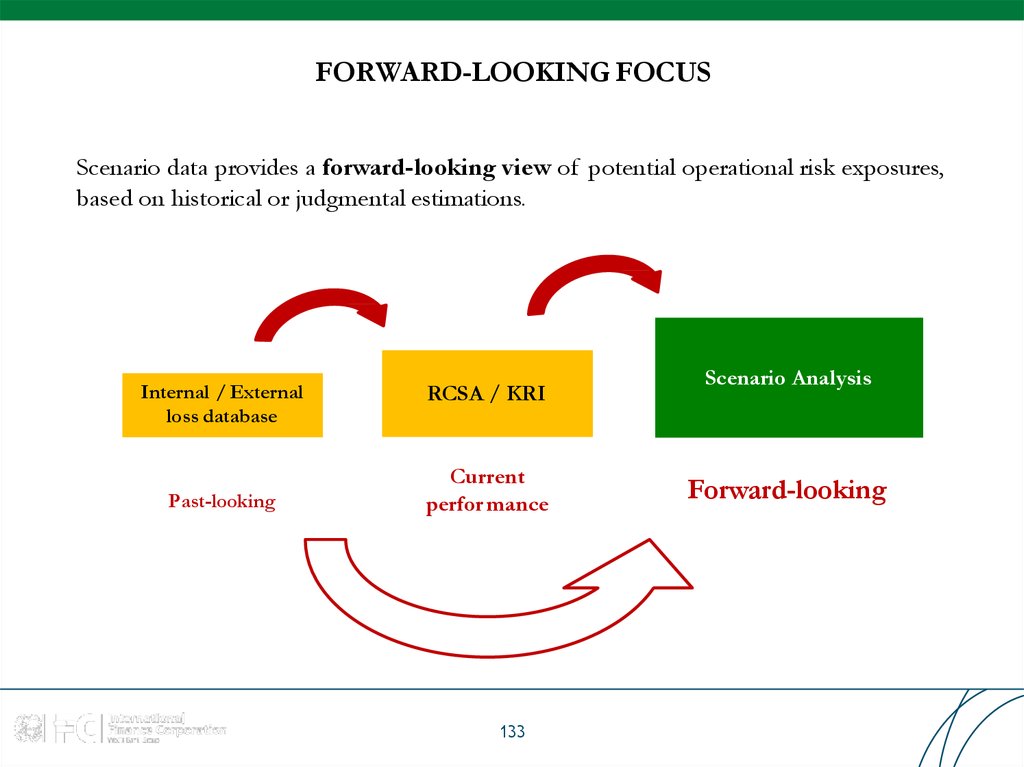
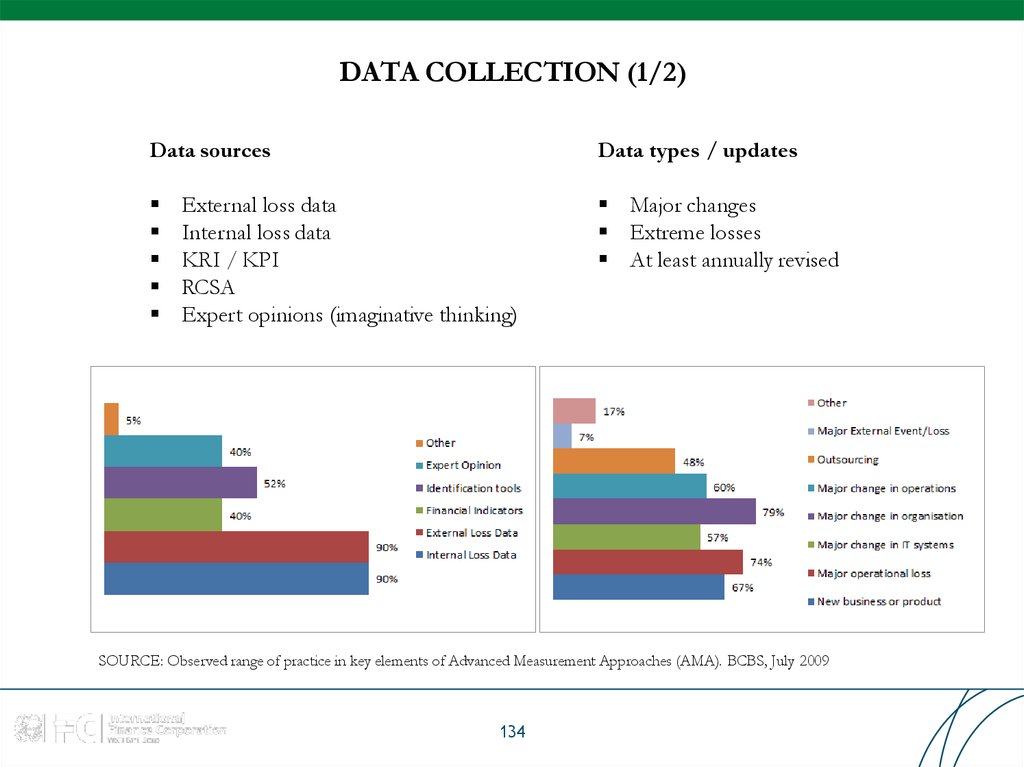
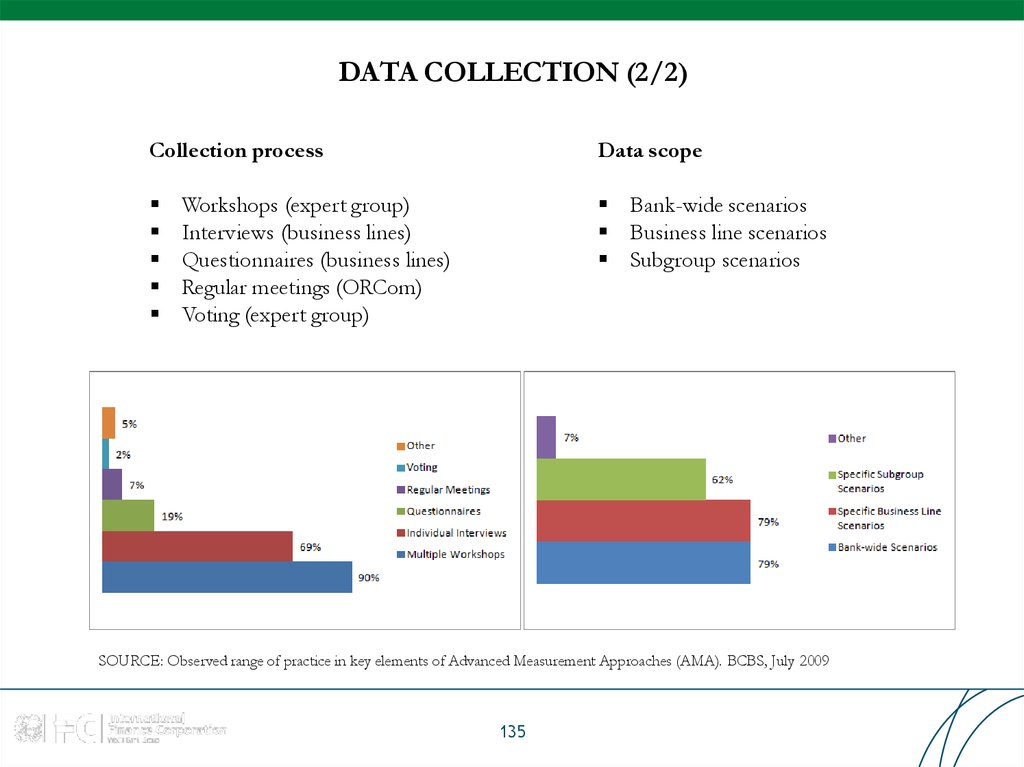
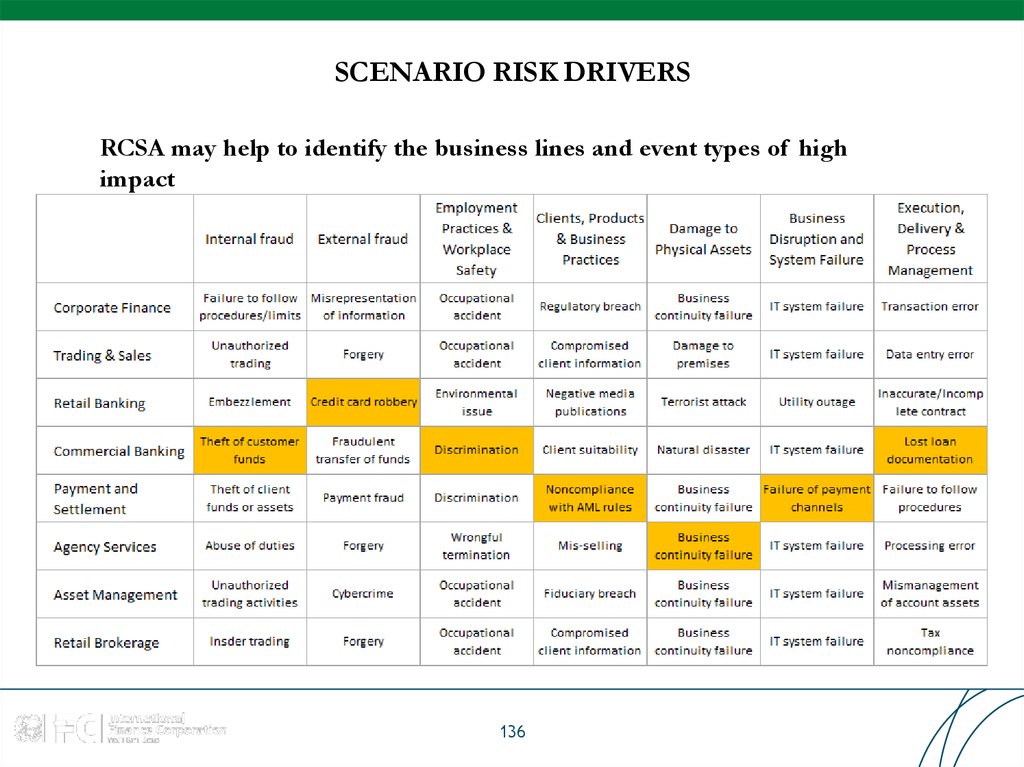
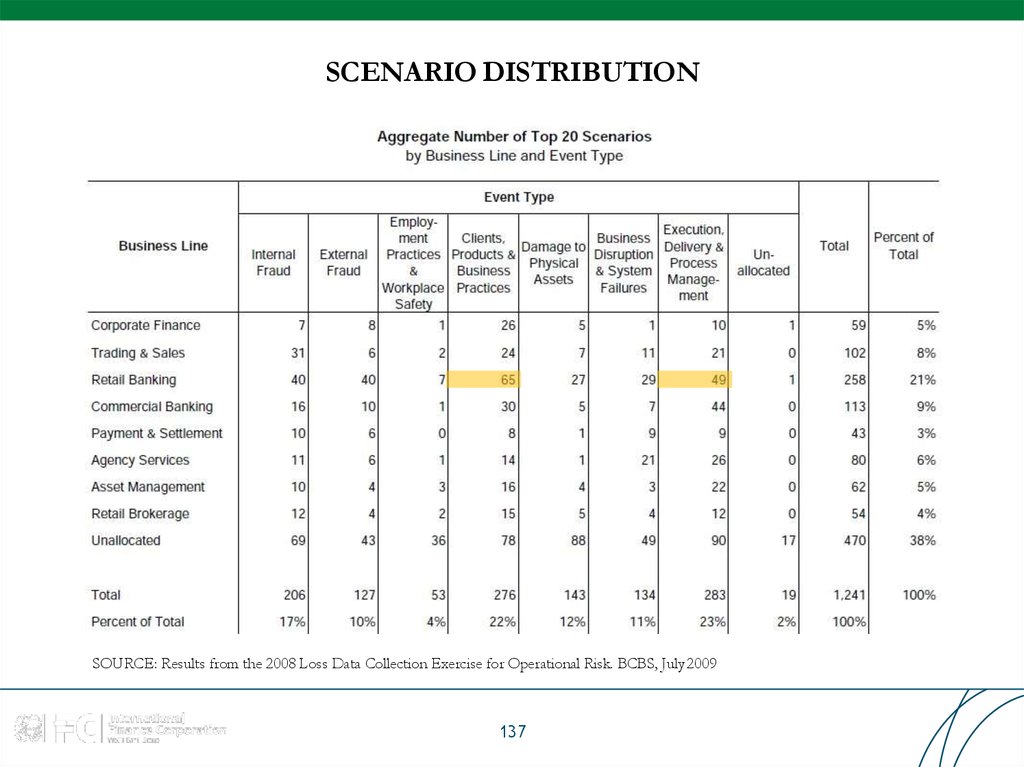
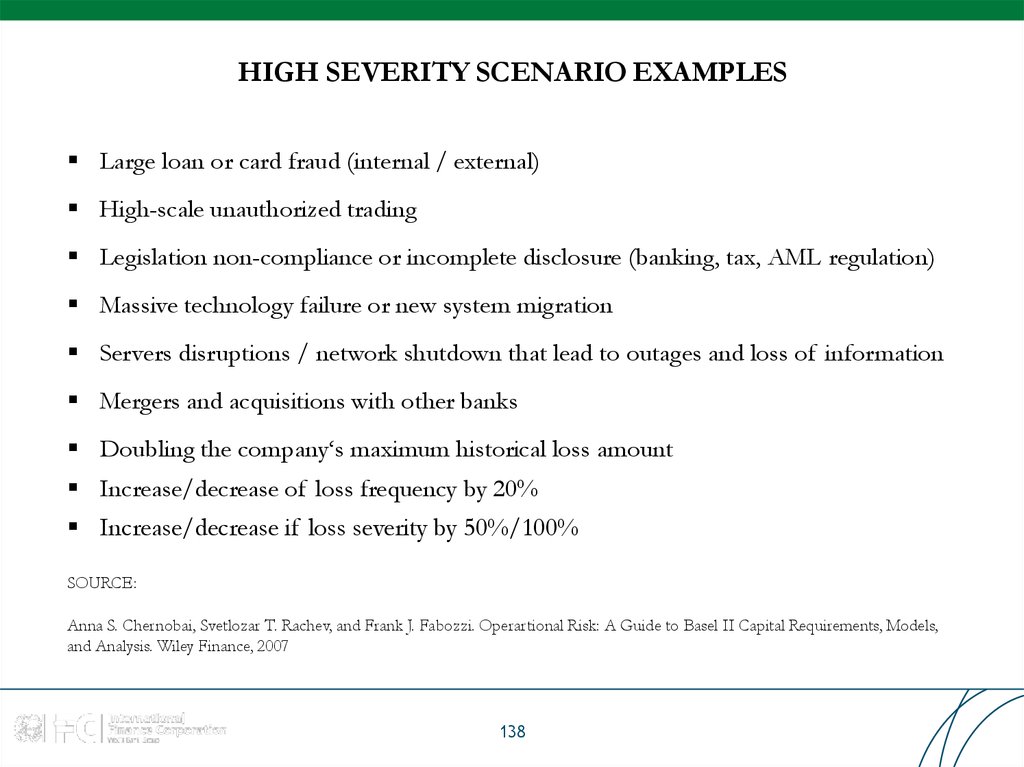
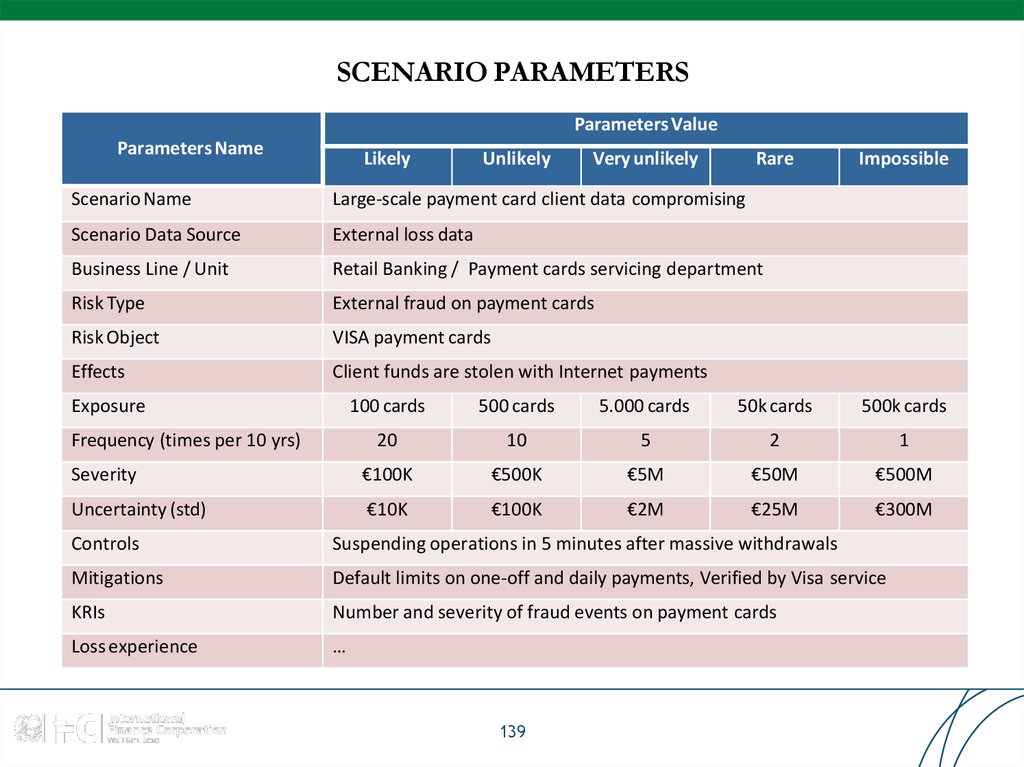
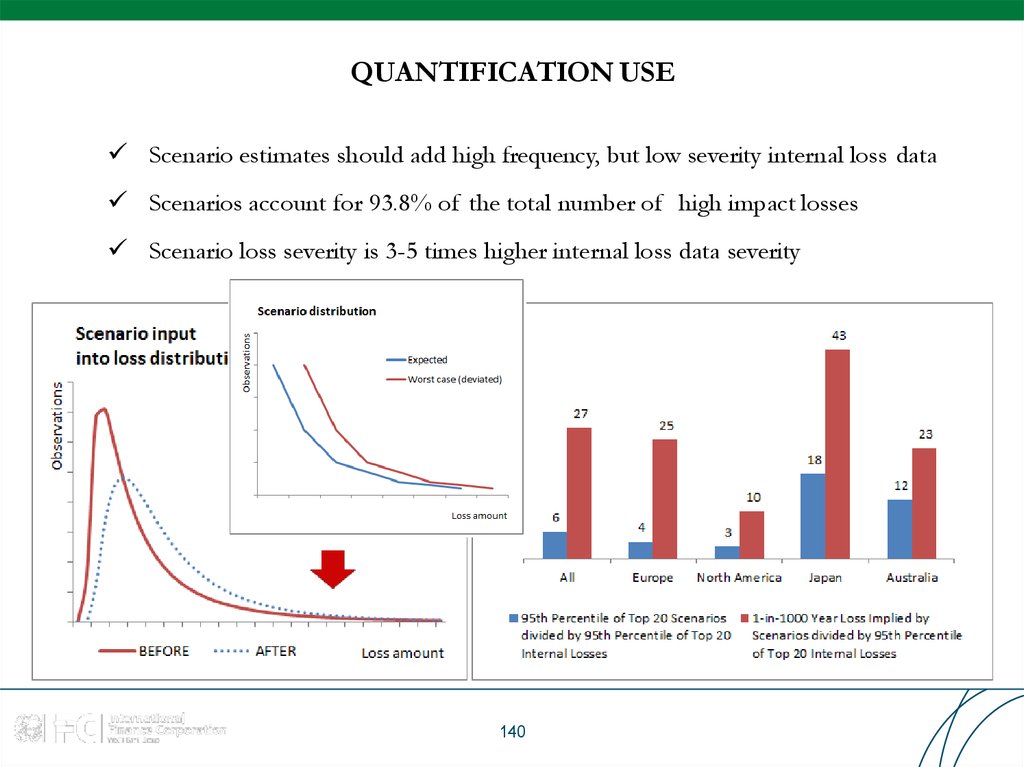
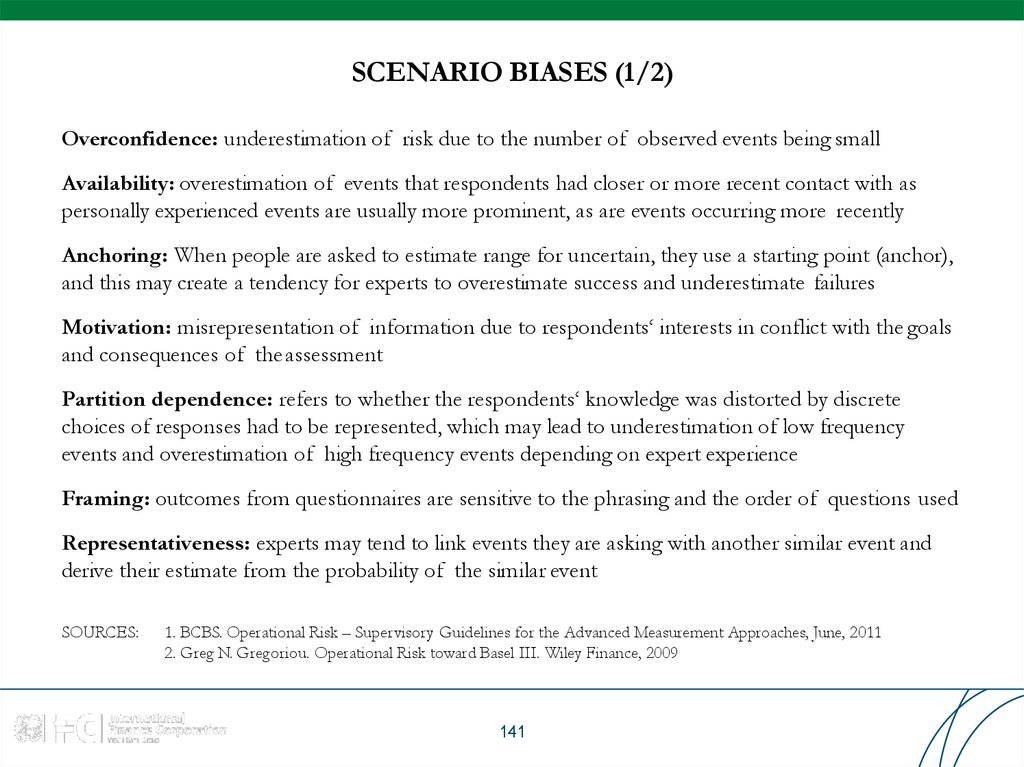
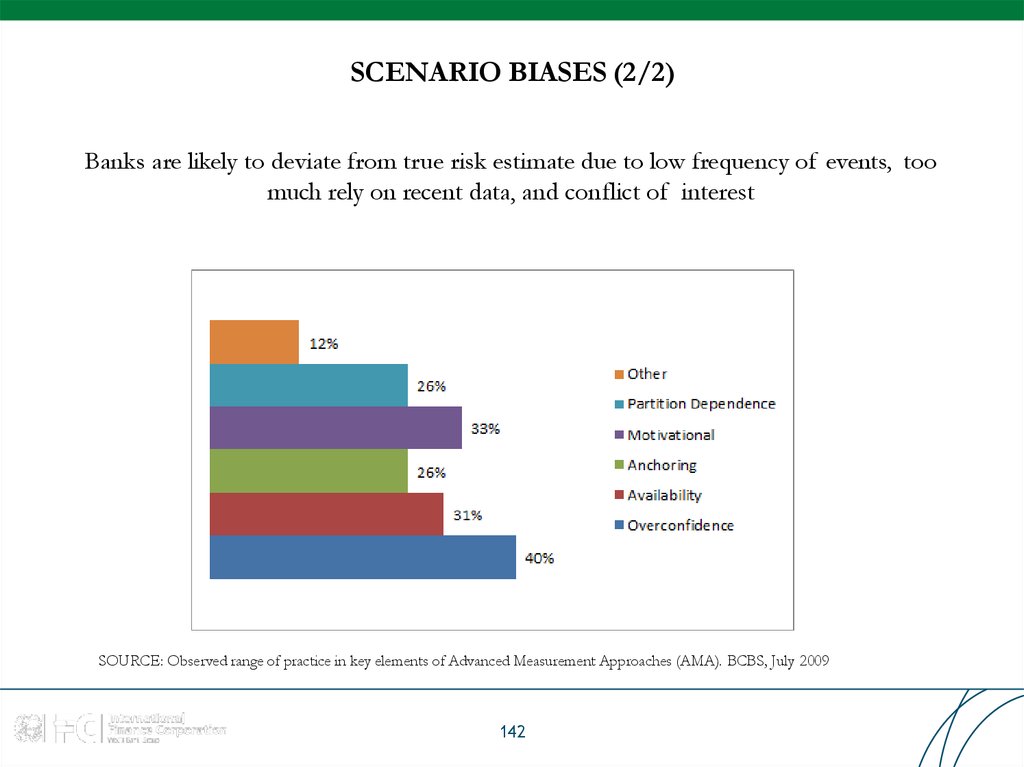
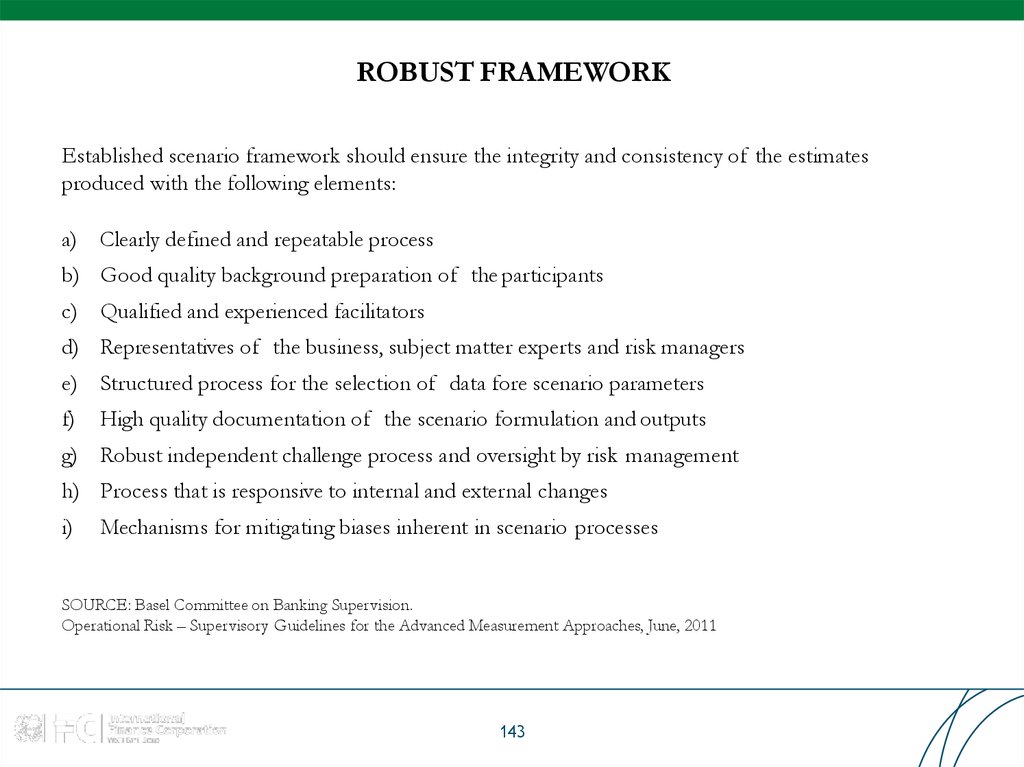
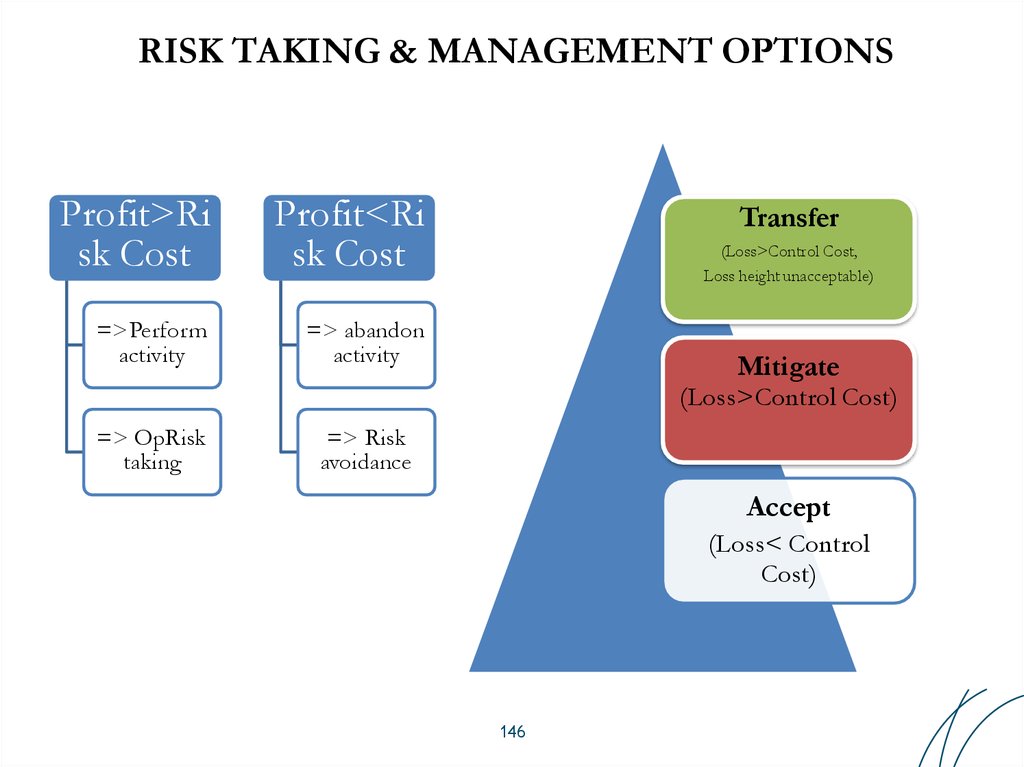
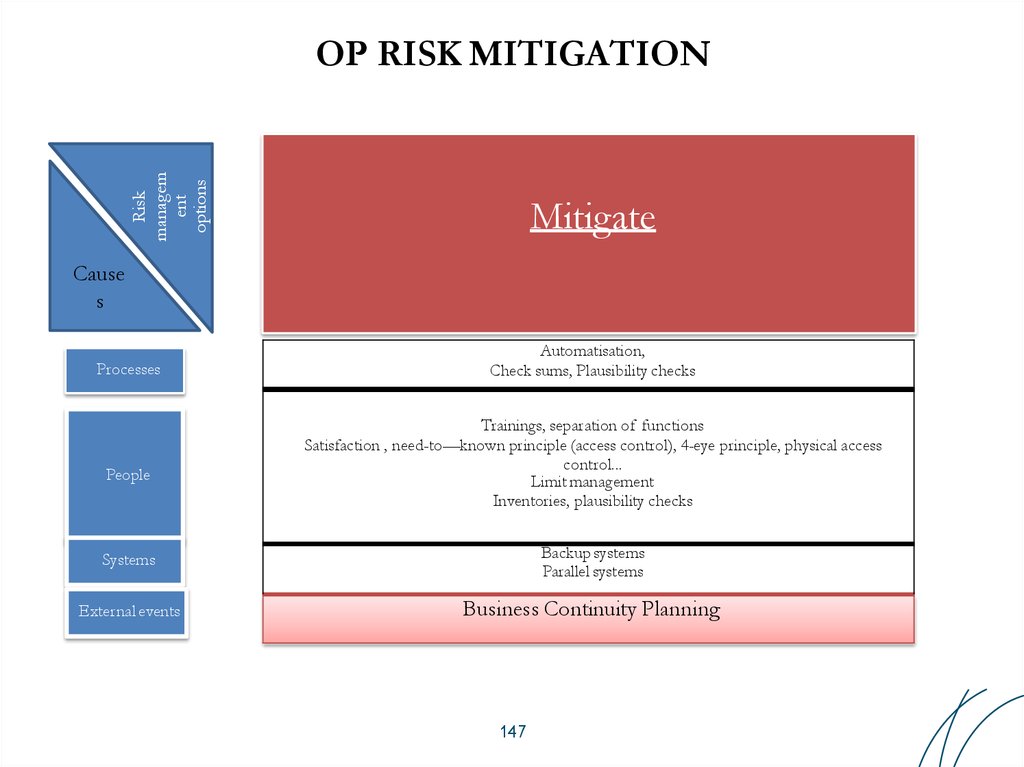
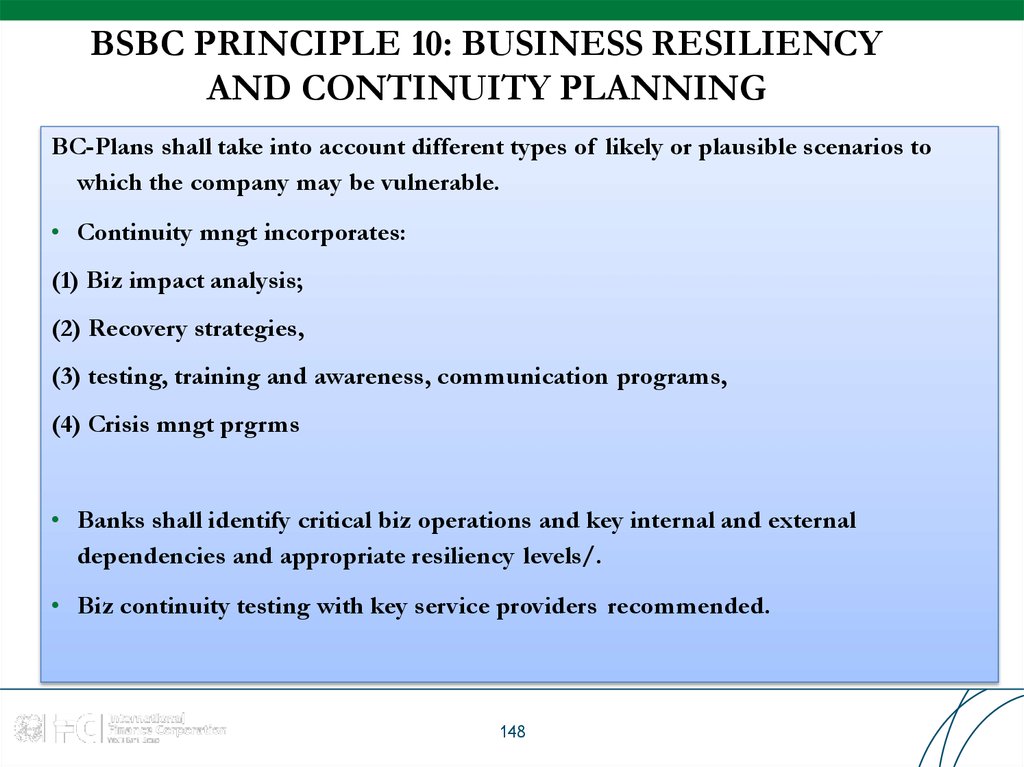
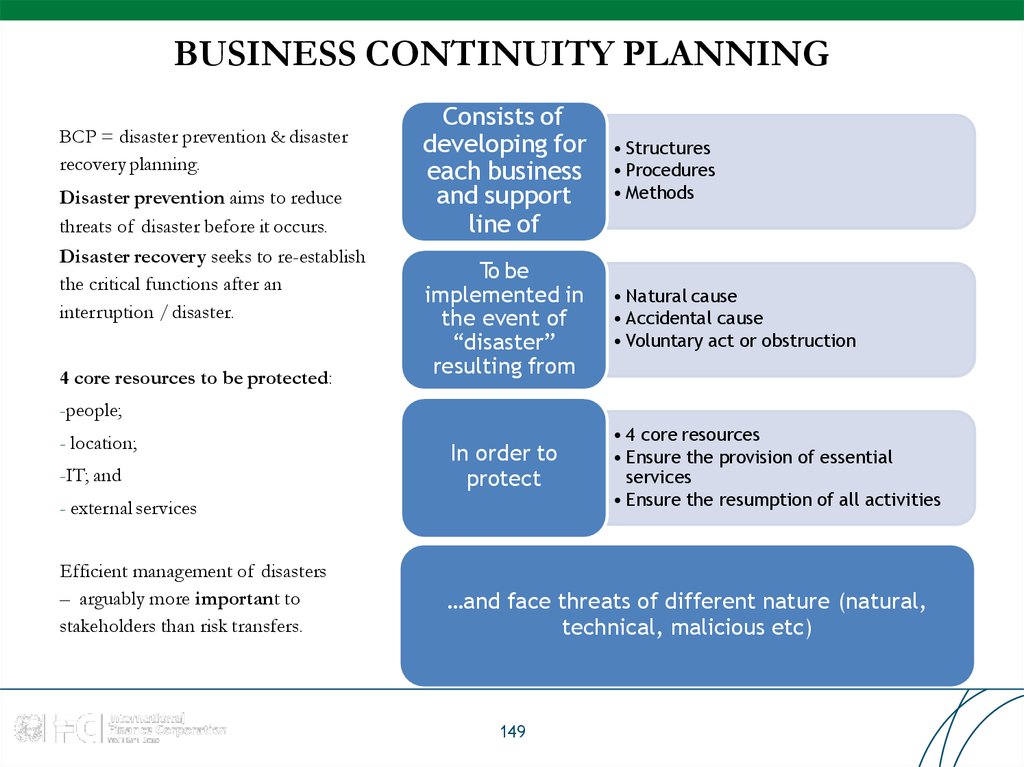
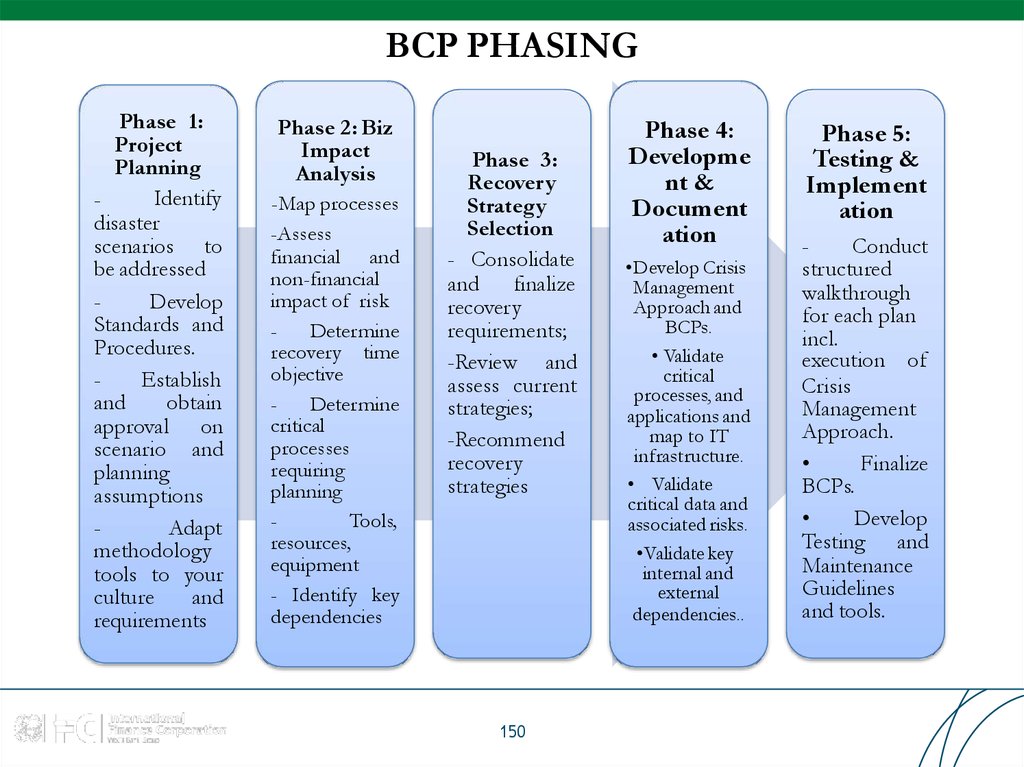
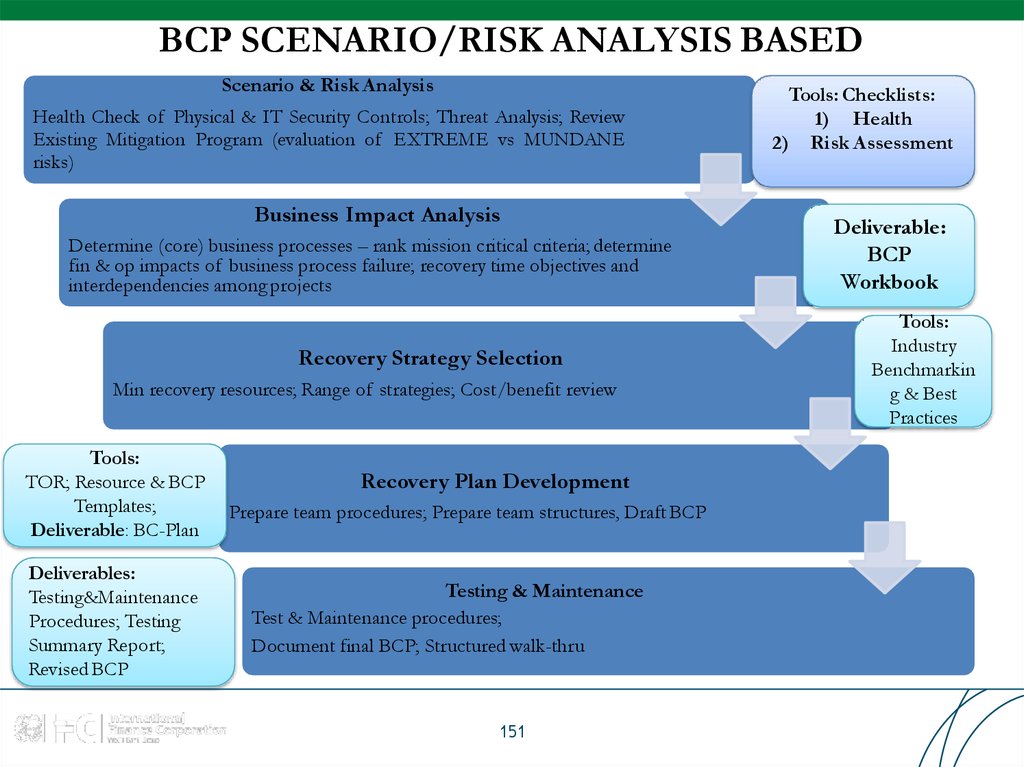
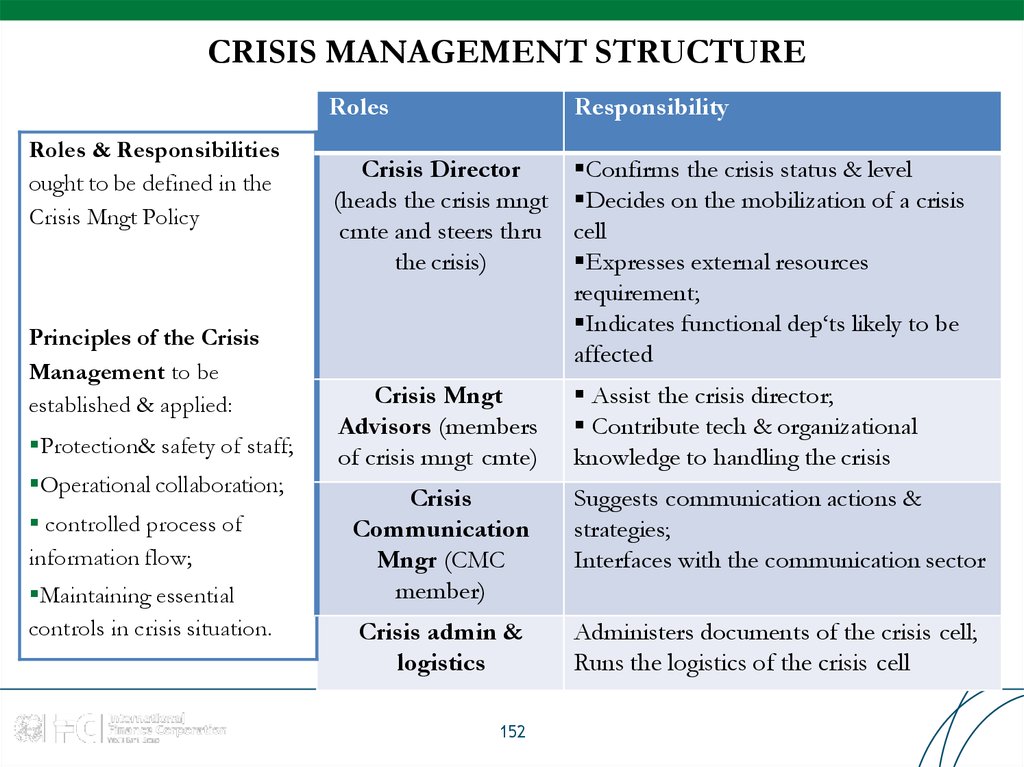
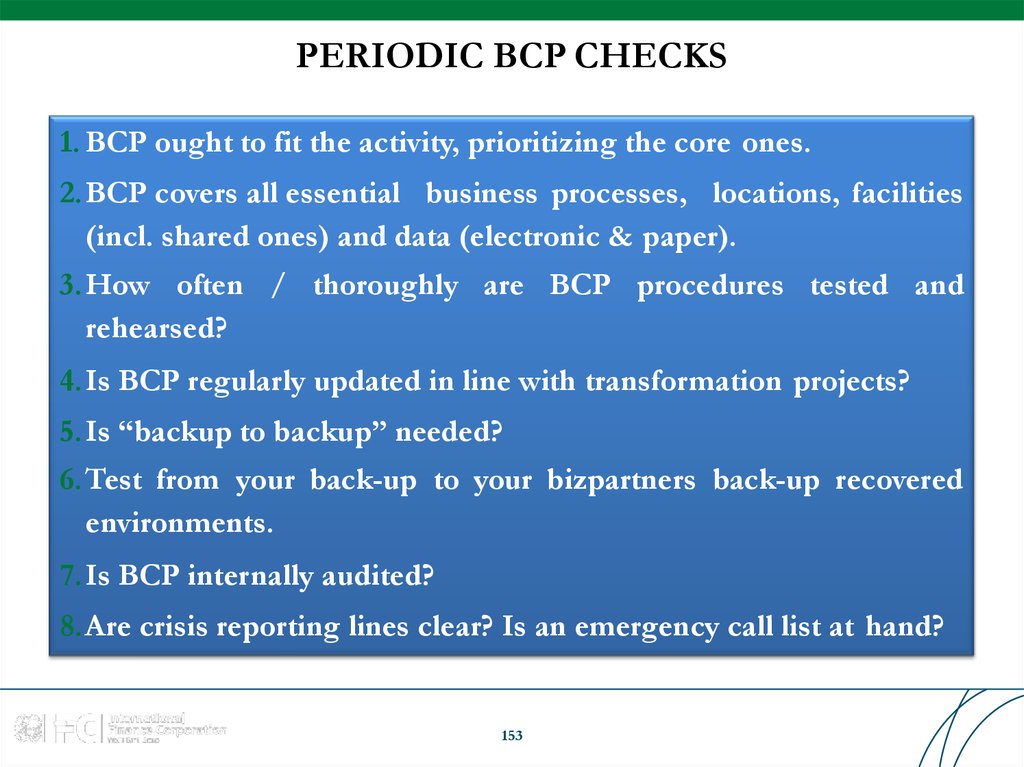
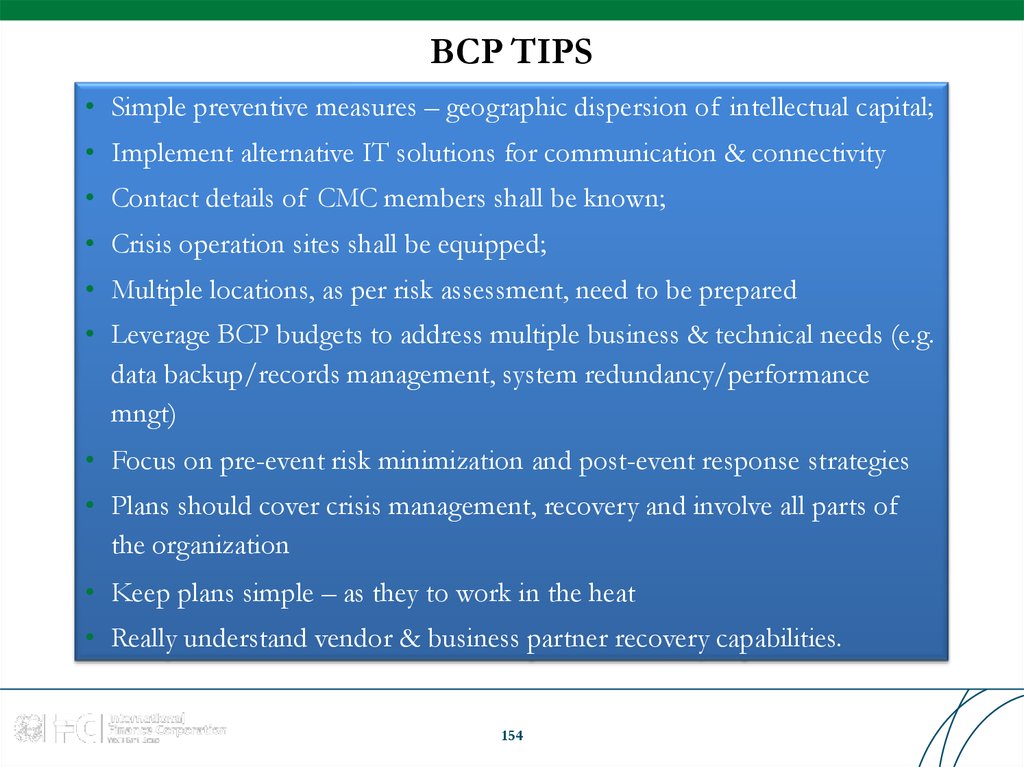
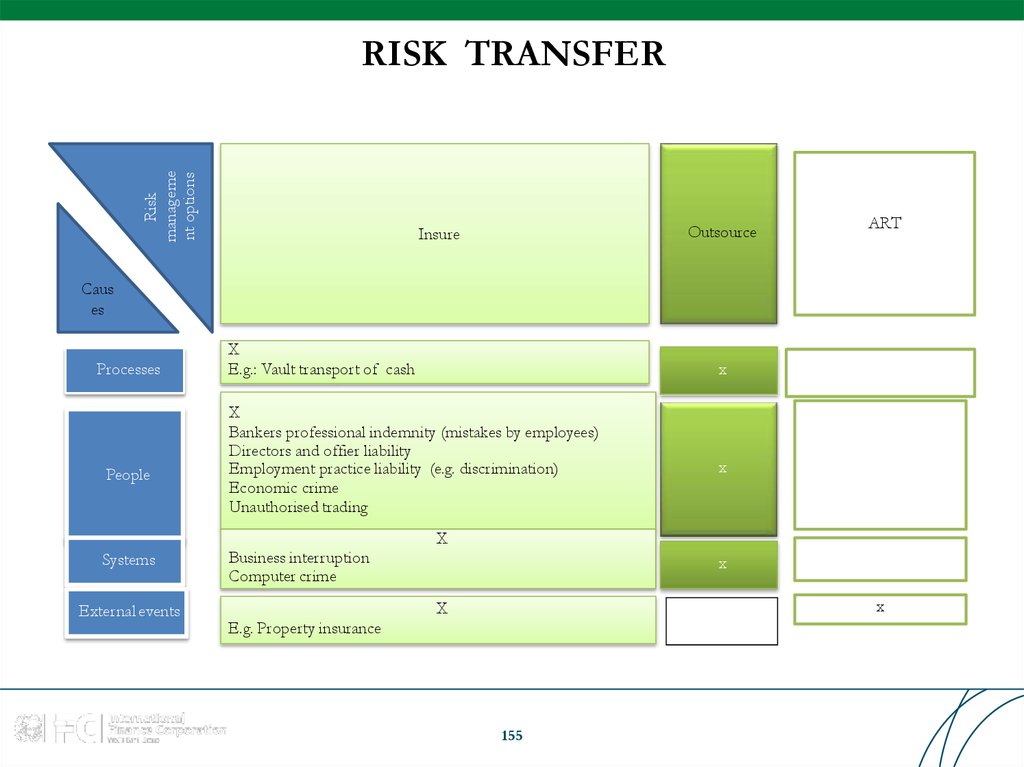
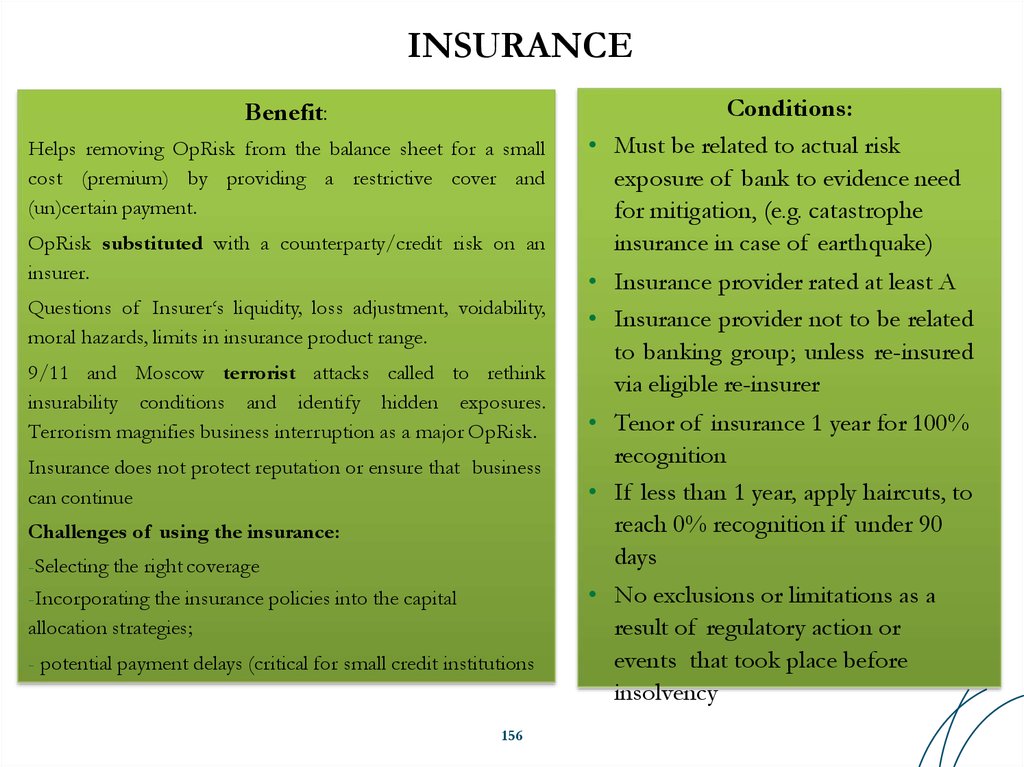
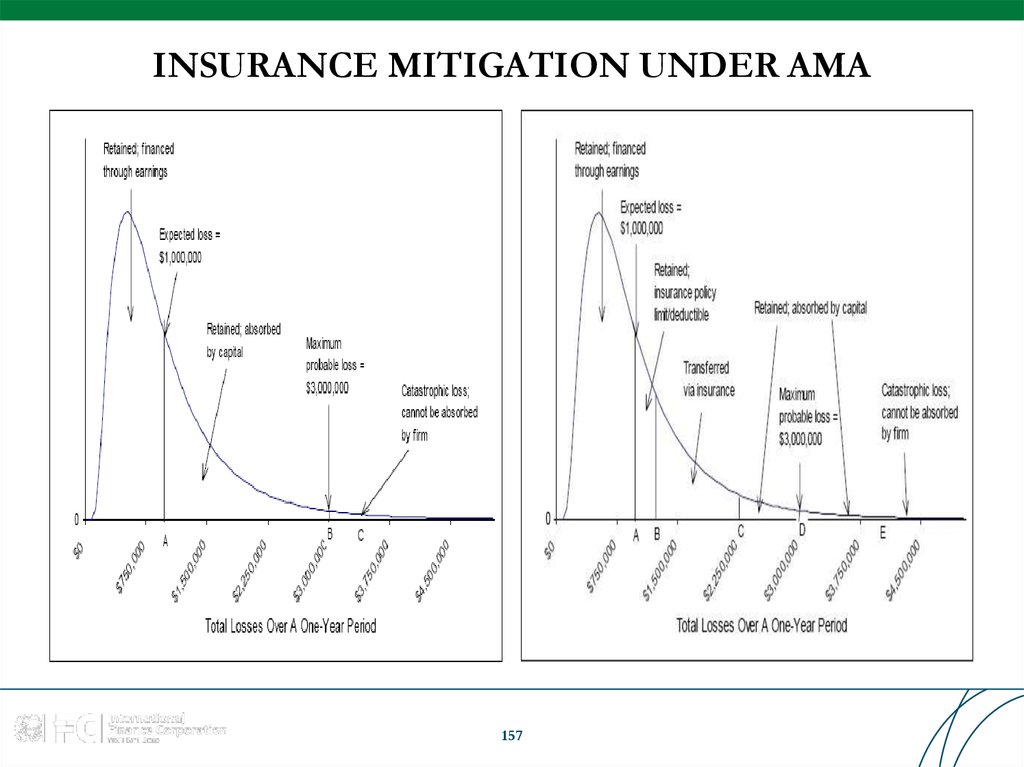
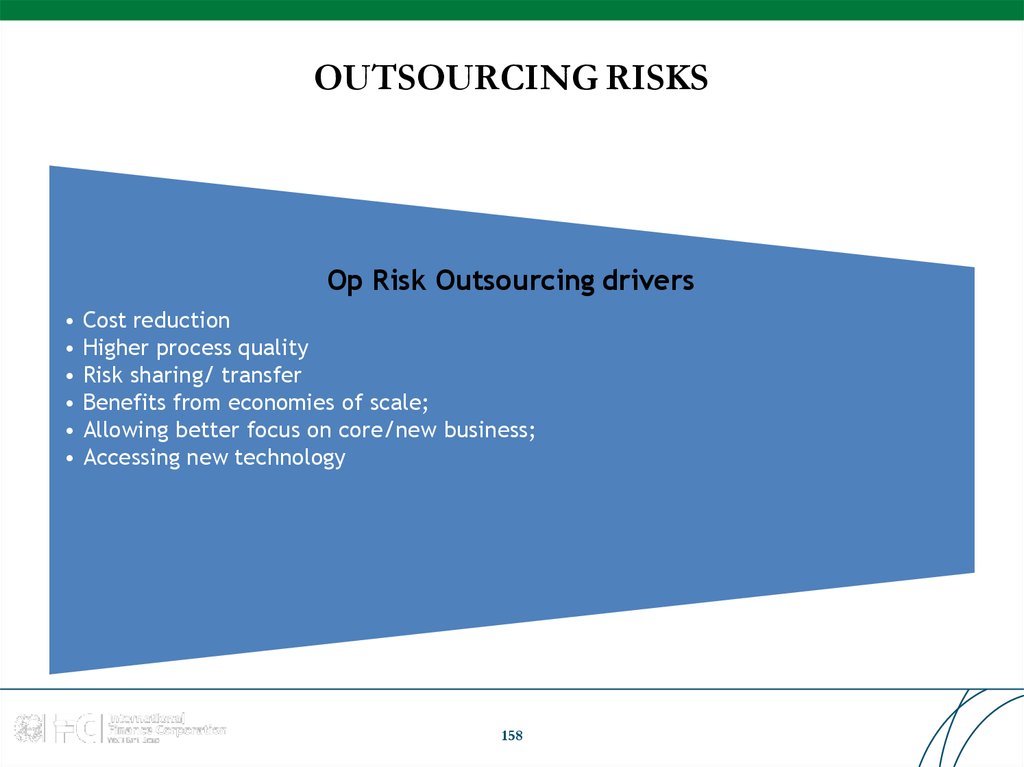
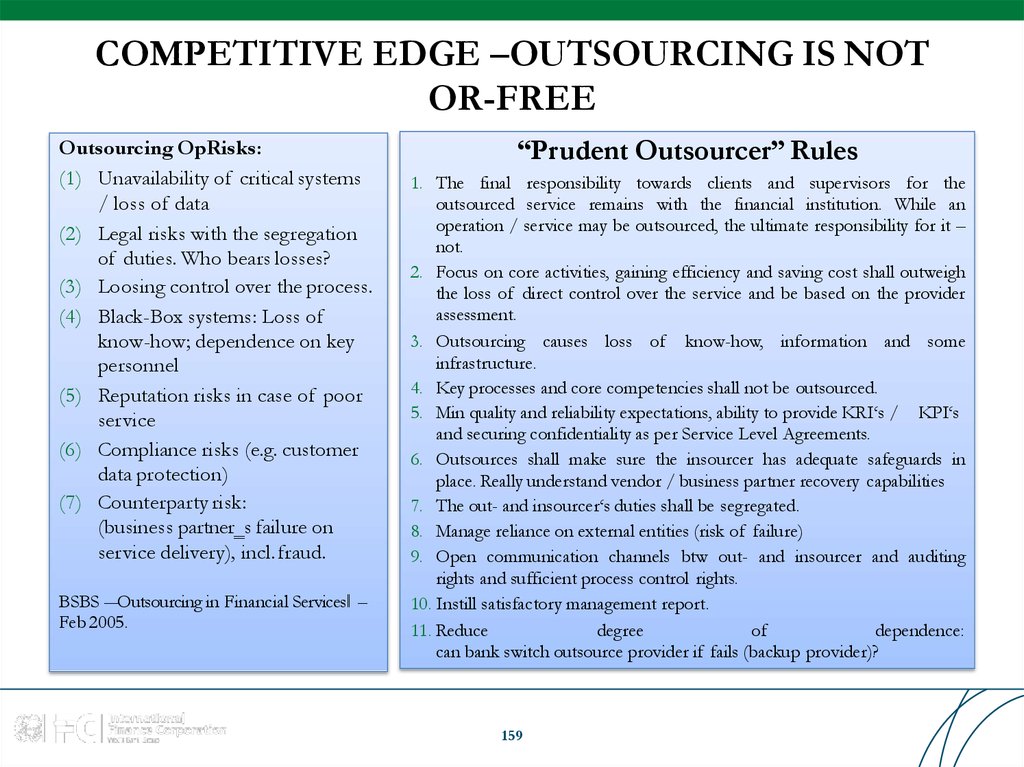
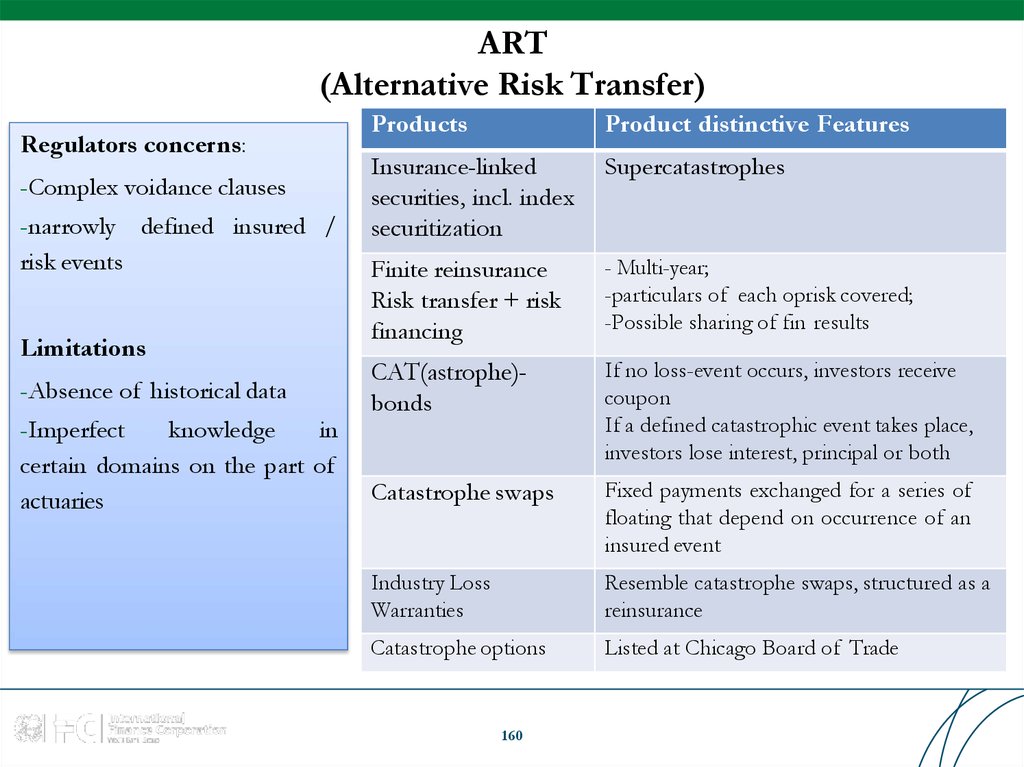
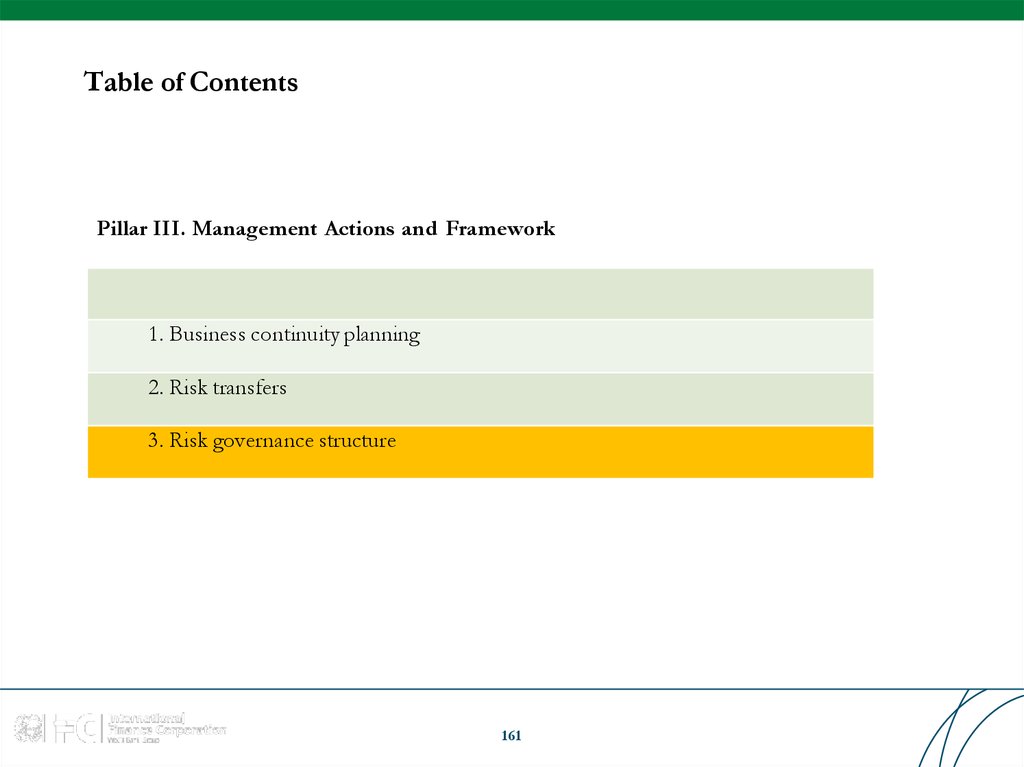
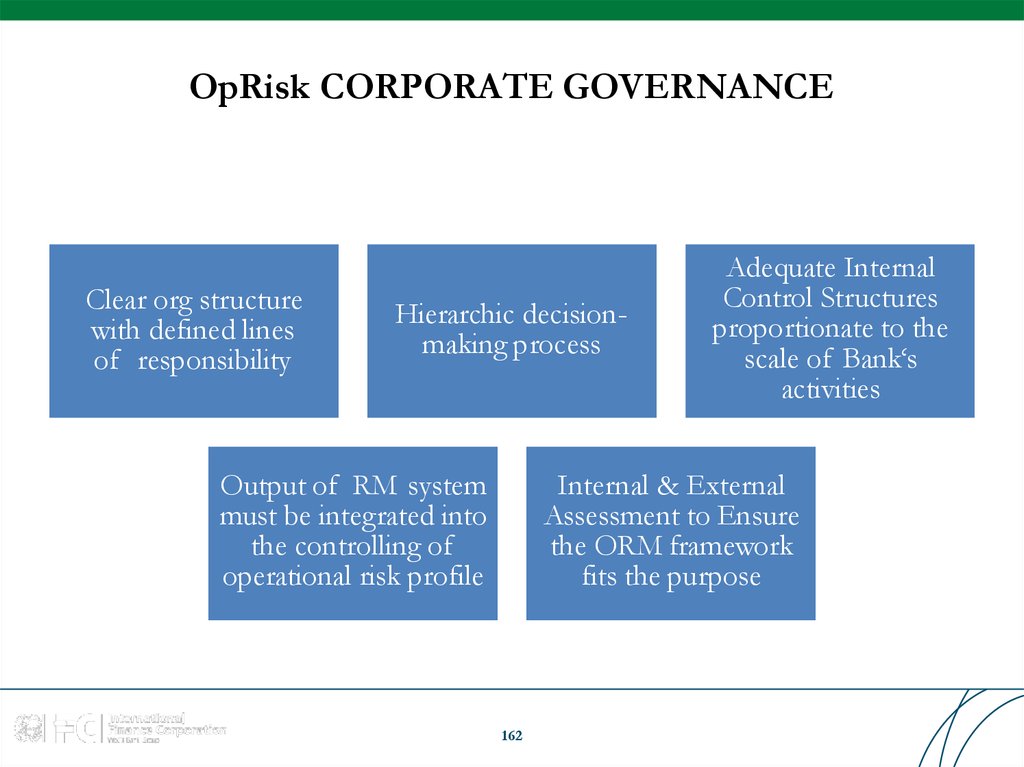
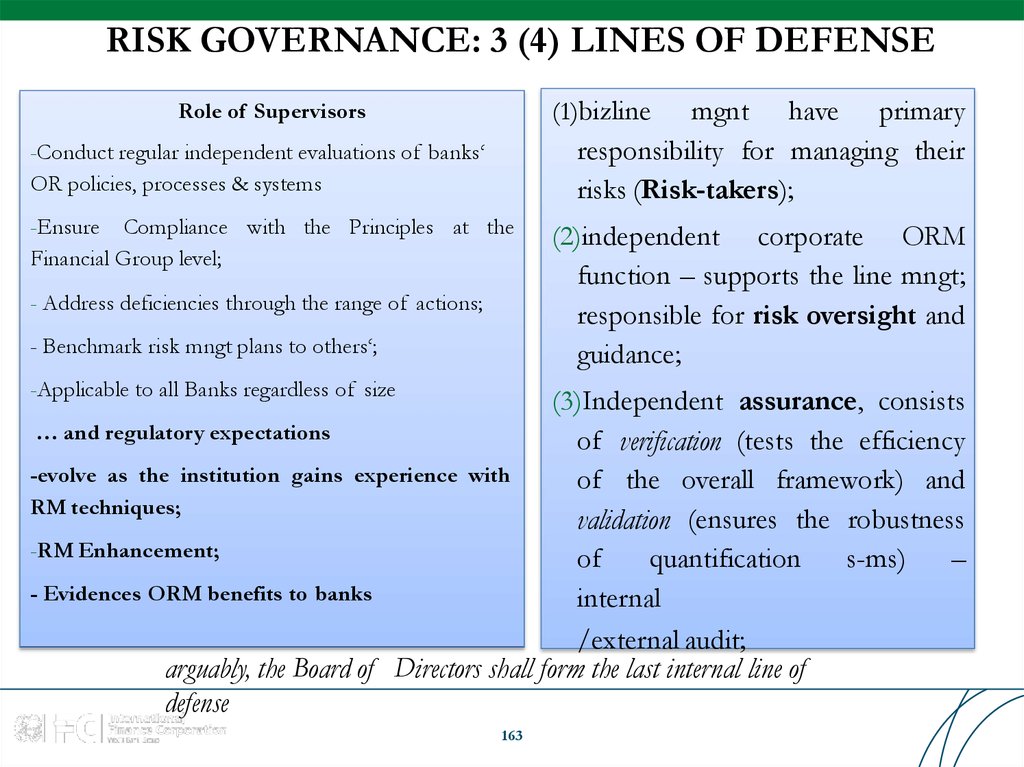
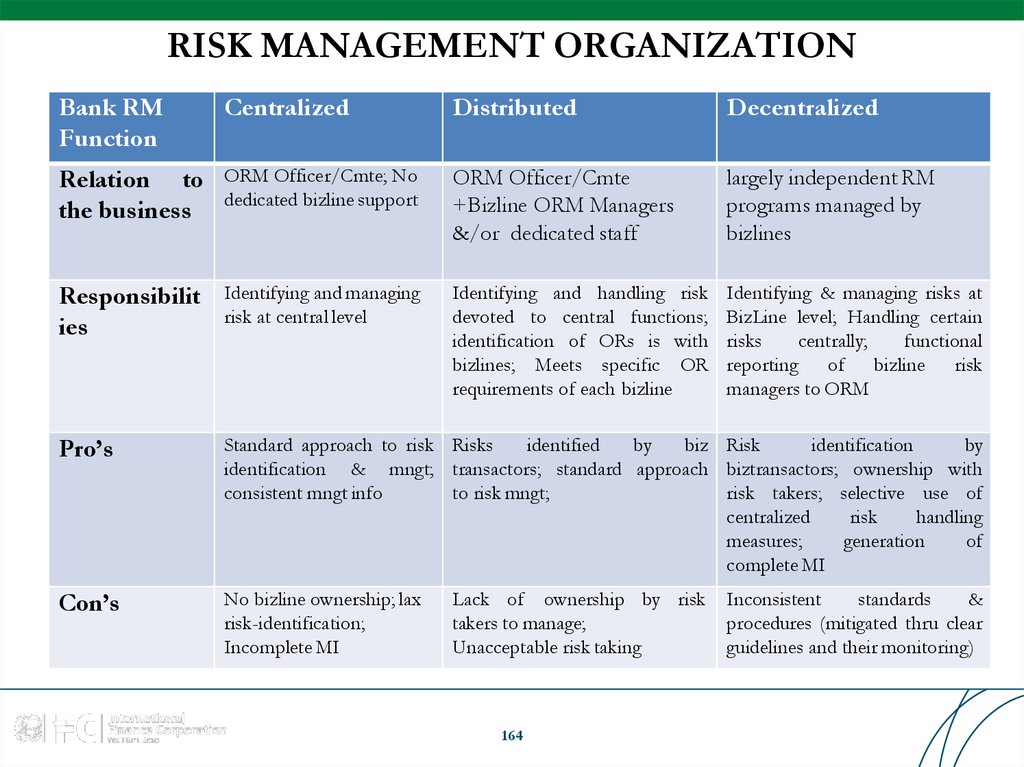
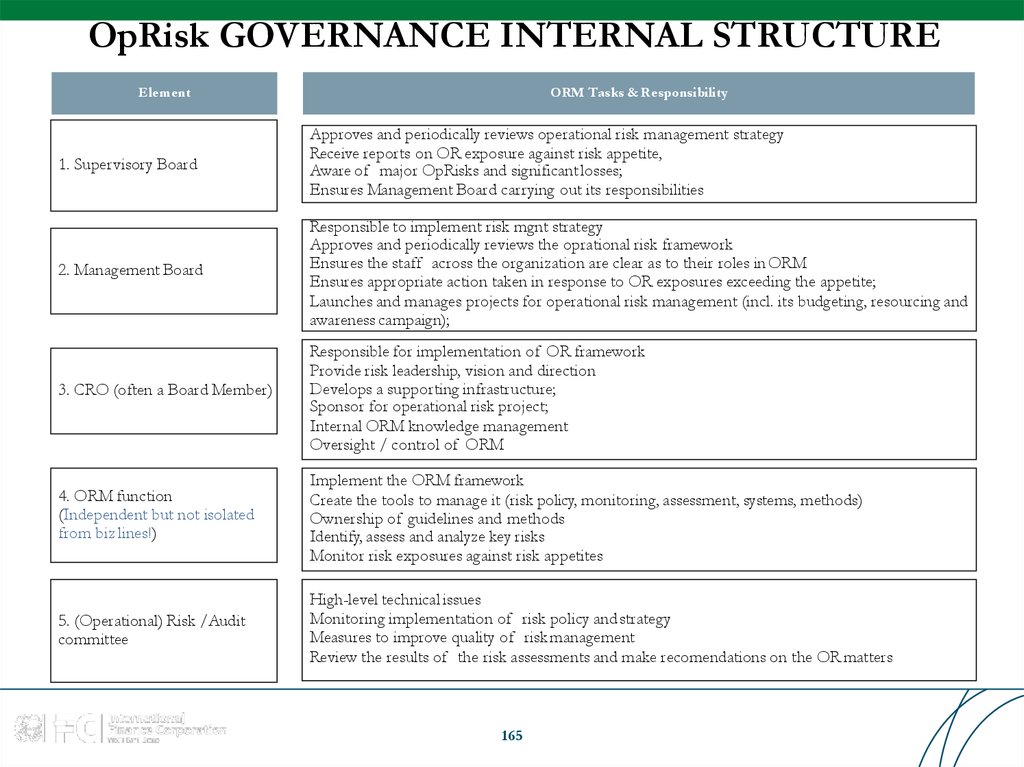
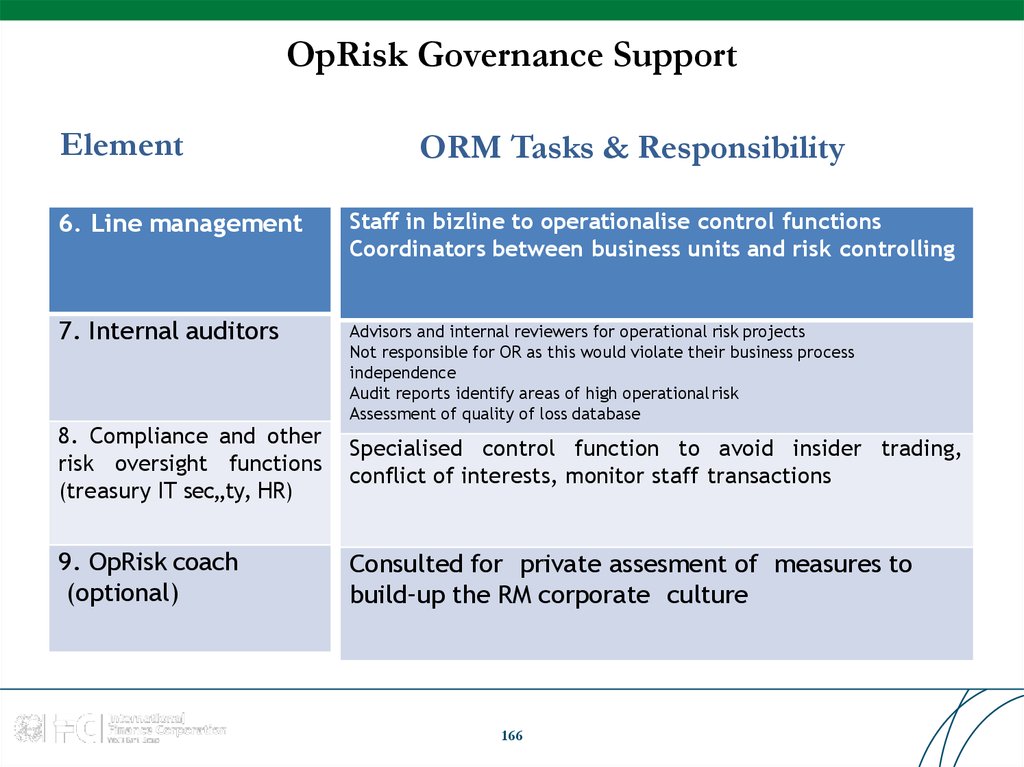


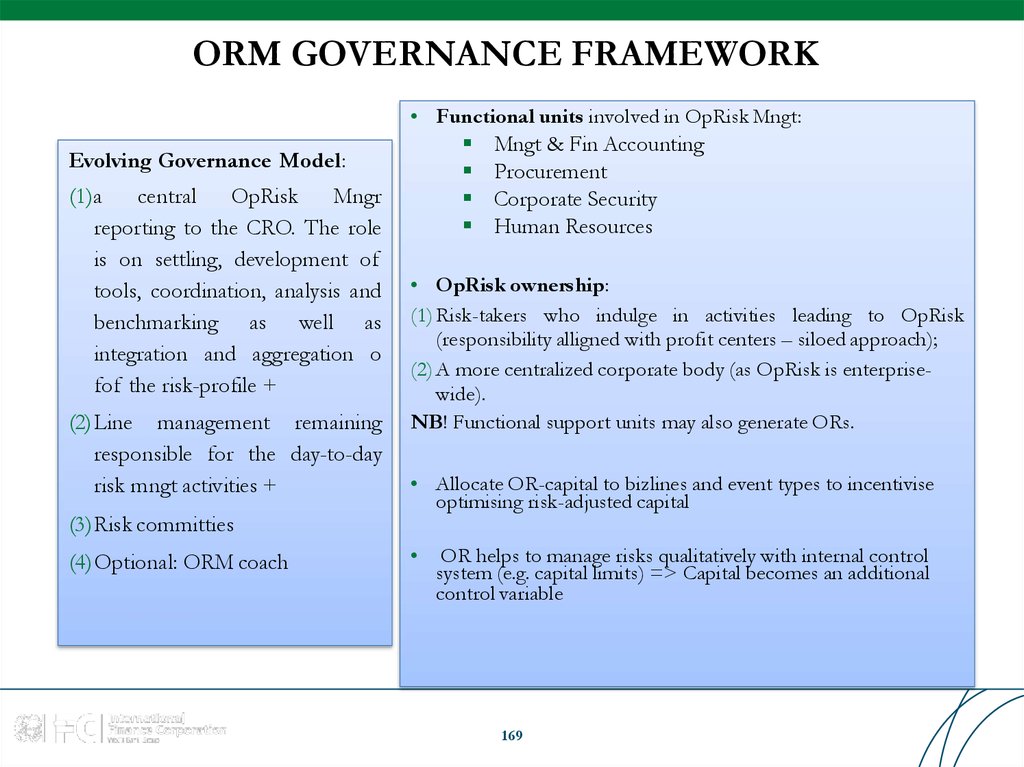
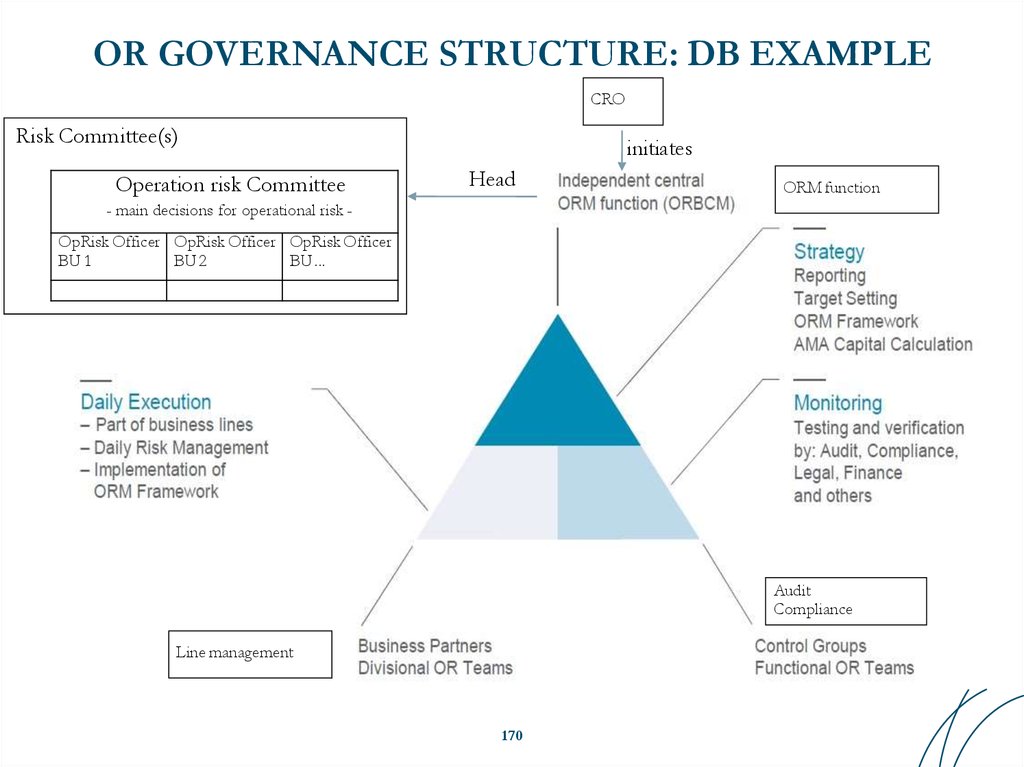
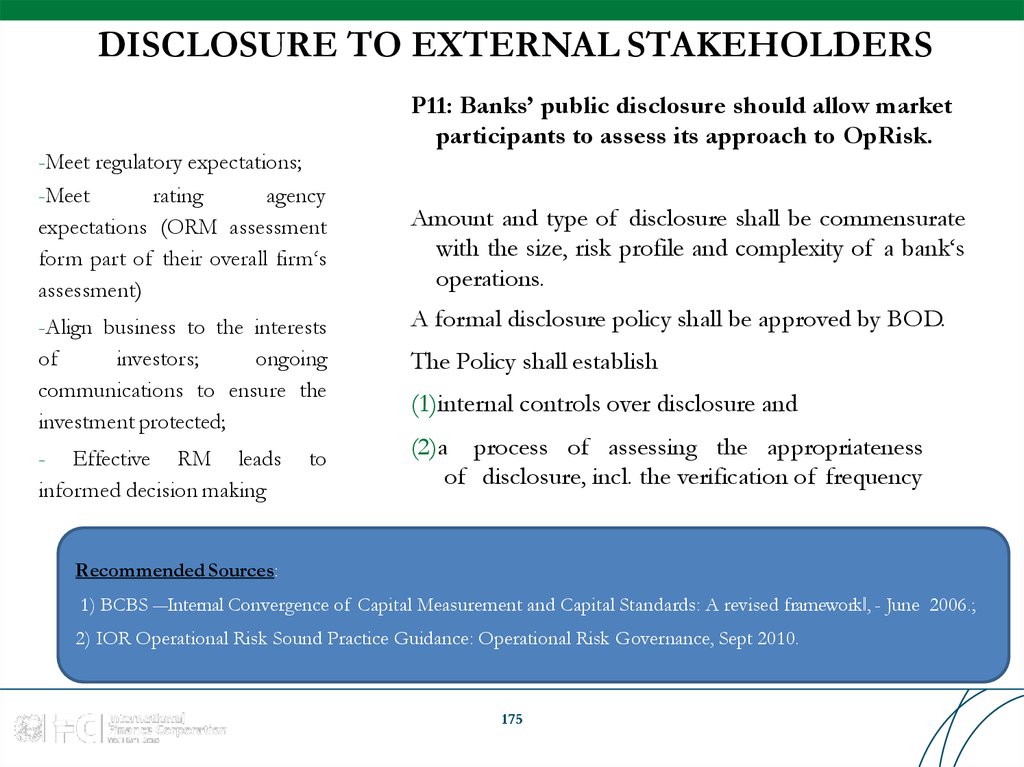
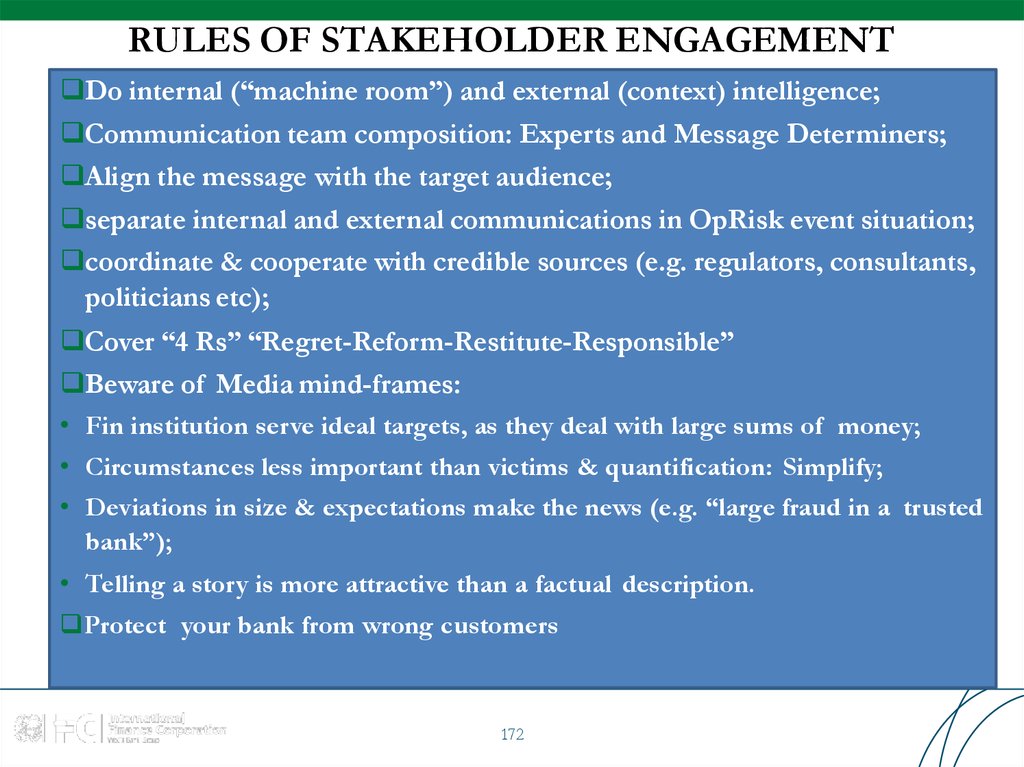
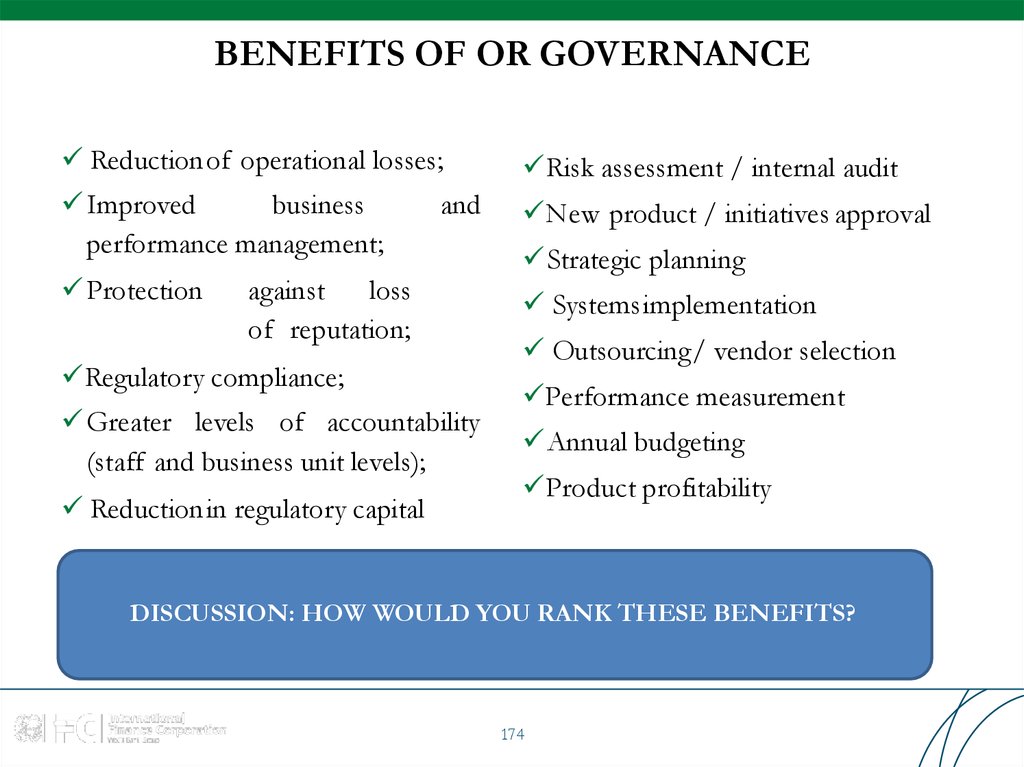

 Менеджмент


