


 Программное обеспечение
Похожие презентации:


Before and after
1.
This presentation shows transformations of slidesfrom the traditional to the assertion-evidence design
U.S. Resource Use
• The United States uses:
Before
–
–
–
–
–
–
42% of all the aluminum produced worldwide
31% of all the petroleum
29% of all the phosphate
27% of all the copper
Although the U.S. has 5% of the world's population,
27% of the nitrogen
we use an average of 30% of all resources
25% of the zinc
• Approximately 30% of all resources worldwide
After
United States use of specific resources
(percentage of worldwide use)
2.
A First StepTowards Automatic Verification
of PDE Code
Hans Petter Langtangen
Ola Skaghaug
Simula Research Laboratory
Oslo, Norway
[simula research laboratory]
3.
A First Step Towards AutomaticVerification of PDE Code
Hans Petter Langtangen
Ola Skaghaug
Simula Research Laboratory
Oslo, Norway
[simula research laboratory]
4.
5.
This presentation shows the evolution from amanual environment to one that is automated
MATLAB
somewhat
manual
Python
Fortran 77
C++
manual
automated
[simula research laboratory]
6.
OutlineIntroduction
Background
Pre-Combustion methods
– Coal switching
– Coal cleaning
Combustion method
– Atmospheric fluidized bed
Post-Combustion methods
– Absorption
– Adsorption
Conclusions
Acknowledgments
Questions
7.
This presentation compares methods for reducingemissions of sulfur dioxide from coal power plants
8.
Digital Acquisition SystemA
Accelerometer
outputs
A an analog voltage
B
A
B
Hardware
converts analog signal to digital
el
m
in
g
B
C
Computer samples a number of points
D
o Microsoft Excel
o Matlab
Ov
er
wh
D B is exported to C
D
Data
popular applications
C
C
D
?
9.
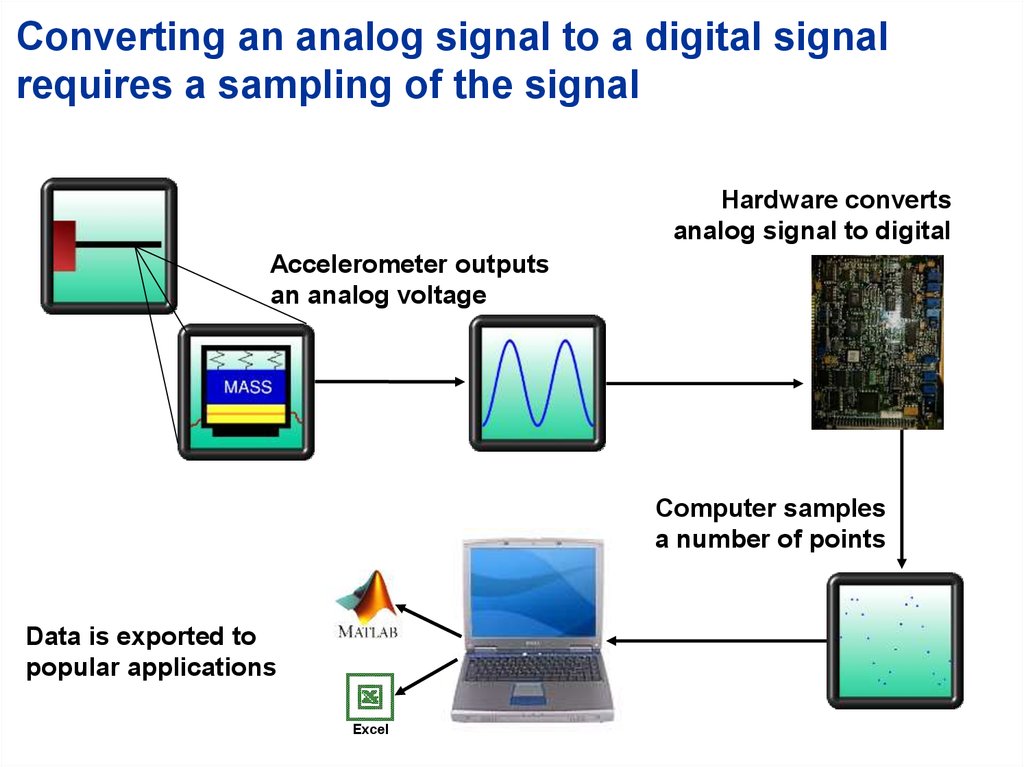
Converting an analog signal to a digital signalrequires a sampling of the signal
Hardware converts
analog signal to digital
Accelerometer outputs
an analog voltage
Computer samples
a number of points
Data is exported to
popular applications
Excel
10.
[simula research laboratory]11.
Although researchers give validation more attention,validation requires successful verification
Validation
Verification
Is the PDE model
appropriate?
Do we solve the
right equations?
Are the numerical models
correctly implemented?
Do we solve the
right equations?
[simula research laboratory]
12. Iron
• An abundant metal, makes up5.6% of earth’s crust
• Properties:
Iron Ore Distribution
– shaped, sharpened, welded
– strong, durable
• Accounts for >95% of metals
used
• Iron ores discovered in 1844
in Michigan’s Upper
Peninsula
• Soon found other ores in
upper Wisconsin and
Minnesota
Kesler 1994
13. Where is the largest concentration of iron ores in North America?
Iron oresWhere
is the
make
largest
up 5.6%
concentration
of the earth’s
of iron
crustores
in North
and
account
America?
for 95% of the metals used
Iron ore
[www.star-bits.com]
Iron
Iron Ore Distribution
Is strong
and durable
Can be shaped,
sharpened, and welded
[Kesler 1994]
14.
Students learning from the transformed slidescored higher on an identical test question
Q: How abundant is iron in the earth’s crust?
Iron ores
Where
is the
make
largest
up 5.6%
concentration
of the earth’s
of iron
crustores
in North
and
account
America?
for 95% of the metals used
Iron
• An abundant metal, makes
up 5.6% of earth’s crust
• Properties:
Iron ore
Iron Ore Distribution
– shaped, sharpened, welded
– strong, durable
• Accounts for >95% of
metals used
• Iron ores discovered in 1844
in Michigan’s Upper
Peninsula
• Soon found other ores in
upper Wisconsin and
Minnesota
[www.star-bits.com]
Iron
Iron Ore Distribution
Is strong
and durable
Kesler 1994
Led to 59% recall
Can be shaped,
sharpened, and welded
[Kesler 1994]
Led to 77% recall
p < 0.001
[Alley et al., 2006]
15.
U.S. Resource Use• The United States uses:
–
–
–
–
–
–
42% of all the aluminum produced worldwide
31% of all the petroleum
29% of all the phosphate
27% of all the copper
27% of the nitrogen
25% of the zinc
• Approximately 30% of all resources worldwide
16.
Although the U.S. has 5% of the world's population,we use an average of 30% of all resources
United States use of specific resources
(percentage of worldwide use)
17.
Students learning from the transformed slidescored higher on an identical test question
Q: Percentage of world’s resources that the U.S. uses?
Although the U.S. has 5% of the world's population,
we use an average of 30% of all resources
U.S. Resource Use
• The United States uses:
–
–
–
–
–
–
42% of all the aluminum produced worldwide
31% of all the petroleum
29% of all the phosphate
27% of all the copper
27% of the nitrogen
25% of the zinc
• Approximately 30% of all resources worldwide
United States use of specific resources
(percentage of worldwide use)
Led to 71% correct
Led to 82% correct
p < 0.025
[Alley et al., 2006]
18.
Why do the plates move?•Convection
•Heat is from nuclear fission.
•Uranium, Thorium, are large “unstable” atoms
which break down to produce, smaller atoms,
heat, and radioactivity
Miller, 2004
19.
Plates move because of convection caused by heatfrom decay of radioactive elements in the mantle
Ocean
Uranium and Thorium are large “unstable” atoms
break down to produce smaller atoms,
heat, and radioactivity
[Miller, 2004]
20.
Students learning from the transformed slidescored higher on an identical test question
Q: Heat source for movement of lithospheric plates?
Why
domove
the plates
move?
Plates
because
of convection caused by heat
from decay of radioactive elements in the mantle
Why do the plates move?
•Convection
•Heat is from nuclear fission.
Ocean
•Uranium, Thorium, are large “unstable” atoms
which break down to produce, smaller atoms,
heat, and radioactivity
Uranium and Thorium are large “unstable” atoms
break down to produce, smaller atoms,
heat, and radioactivity
Miller, 2004
[Miller, 2004]
Led to 54% correct
Led to 86% correct
p < .001
[Alley et al., 2006]
21. Fossil Fuels: Who has what?
22.
OPEC countries control about 75%of the world’s oil
23.
Students learning from the transformed slidescored higher on an identical test question
Q: Percentage of oil that non-OPEC countries control?
OPEC countries control about 75%
of the world’s oil
Fossil Fuels: Who has what?
Led to 63% correct
Led to 81% correct
p < .001
[Alley et al., 2006]