


 Менеджмент
Похожие презентации:


")
. Chapter 14")


Inventory management. Chapter 12
1.
CHAPTER 12:Inventory
Management
2. Introduction
• Basic question:– How much to order & when needed to arrive
• Functions of Inventory:
– To meet anticipated demand (customer orders)
– To protect against stock-outs
– To take advantage of volume discounts
– To smooth seasonal production requirements
– To hedge against expected price increases
3. Objectives of Inventory Control
Inventory turnover: Ratio of average cost of goods sold toaverage inventory investment
Inadequate control of inventories can result in both
under and overstocking of items
Under stocking results in:
–
Overstocking results in:
–
Missed deliveries, lost sales, dissatisfied customer,
production stoppage
Excessive cost of the inventory
Objectives of Inventory Control
–
Have the right goods, in sufficient quantitative, in the
right place, at the right time
4. Inventory Turn-over
Measurement of Inventory Performance – how often dowe use up our raw materials inventory on hand
Ex. We use $12 million worth of raw materials per year
Order and receive all on Jan 1st – warehouse is stuffed full
of inventory – takes whole year to use up
Inv Turn = 1 per year
Order monthly requirements only – only need a WH big
enough for this small amount
Inv Turn = 12 per year – much less $ tied up in inventory!
5. Requirements for Effective Inventory Management
1. A system to safely store and use inventorysecure warehouse2. A system to keep track of the inventory and a
replenishment system (computer software)
3. Reliable forecasts of demand and knowledge of
lead times (Chapter 3)
4. Reasonable estimate of inventory holding,
ordering, and shortage costs
5. ABC classification – prioritize each inventory item
6. ABC Classification
Classifying inventory according to some measure ofimportance and allocating control efforts accordingly.
A - very important
B - Important
High
A
Annual
$ volume
of items
B
C
Low
C - less important
Few
Many
Number of Items
7.
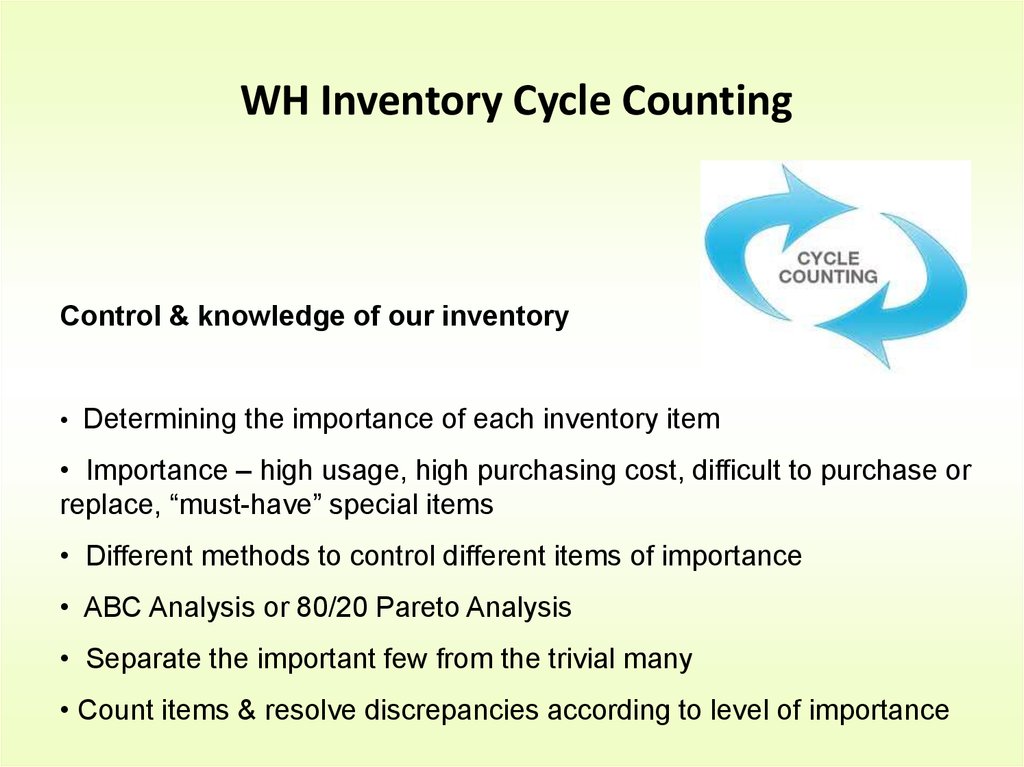
WH Inventory Cycle CountingControl & knowledge of our inventory
• Determining the importance of each inventory item
• Importance – high usage, high purchasing cost, difficult to purchase or
replace, “must-have” special items
• Different methods to control different items of importance
• ABC Analysis or 80/20 Pareto Analysis
• Separate the important few from the trivial many
• Count items & resolve discrepancies according to level of importance
8.
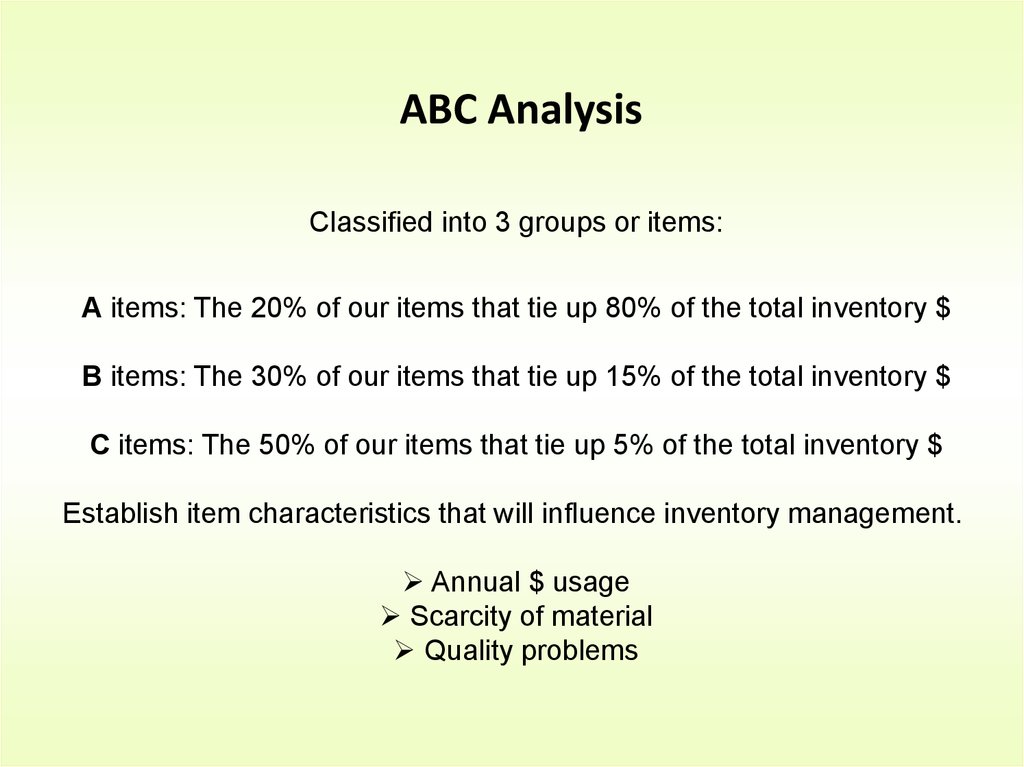
ABC AnalysisClassified into 3 groups or items:
A items: The 20% of our items that tie up 80% of the total inventory $
B items: The 30% of our items that tie up 15% of the total inventory $
C items: The 50% of our items that tie up 5% of the total inventory $
Establish item characteristics that will influence inventory management.
Annual $ usage
Scarcity of material
Quality problems
9.
ABC AnalysisHow to classify the items in our inventory:
• Determine the annual usage for each item
• Multiply annual usage of each item by its purchase cost to get total
annual money usage
• Rank the items according to their annual money usage.
• Calculate the cumulative annual
• $ usage and the cumulative % of items
• Examine the annual usage distribution and group items into A, B, and
C groups based on % of annual usage
10.
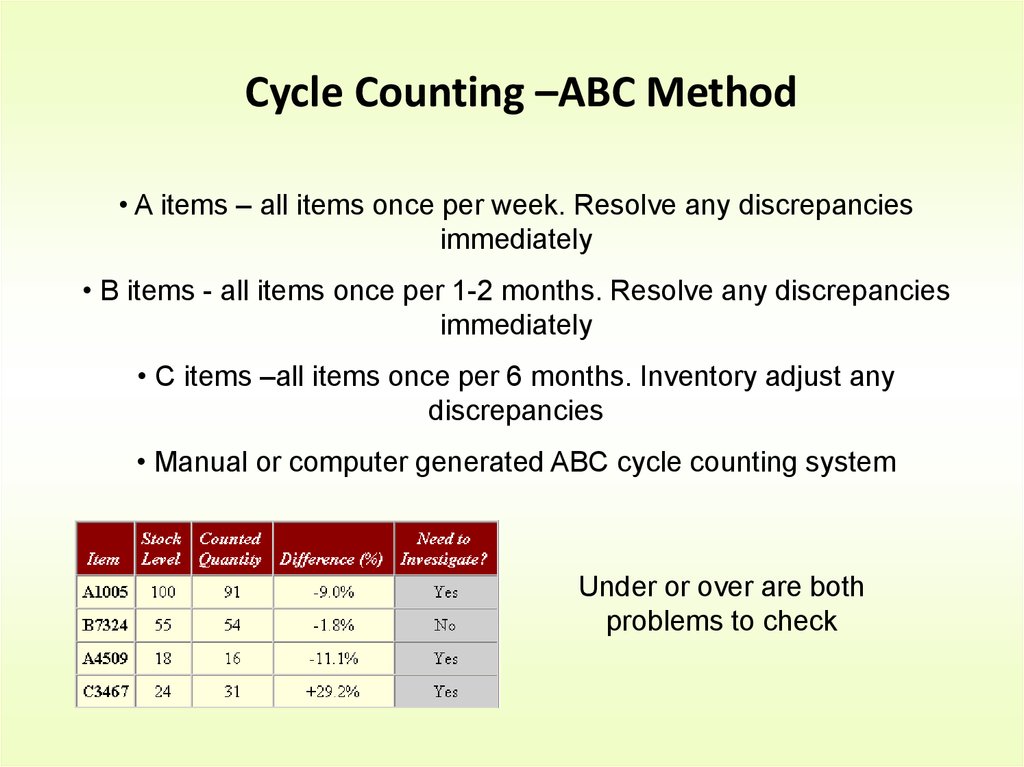
Cycle Counting –ABC Method• A items – all items once per week. Resolve any discrepancies
immediately
• B items - all items once per 1-2 months. Resolve any discrepancies
immediately
• C items –all items once per 6 months. Inventory adjust any
discrepancies
• Manual or computer generated ABC cycle counting system
Under or over are both
problems to check
11. Inventory Counting and Replenishment Models
• Periodic System– Physical count of all items usually once a year
– Usually done to satisfy external auditor requirements
– May need to shut down operations to count
• Perpetual Inventory System
– Continuous real-time updating in the computer of
inventory levels each time a movement is made –
finished good sold to customer, raw materials used
in production, new raw materials arrive
12. Inventory Counting and Replenishment Models
• Fixed Order Quantity/Reorder Point Model– An order of a fixed size is placed when the amount
on hand drops below a minimum quantity called
the reorder point
• Two-Bin System
– Two containers for each inventory item; reorder
when the first bin is empty
• Bar Coding
– A unique number assigned to an item or location,
made of a group of vertical bars of different
thickness that are readable by a scanner
13. Demand Forecast
• Lead Time– time interval between ordering and receiving the
order – supplier’s manufacturing time plus
shipping time to your location
• Point of Sale (POS)system
– Software for electronically recording sales and
updating inventory levels at the time and location
of sale (cash register)
14. Inventory Costs
• Holding (carrying) costs– cost to carry an item in inventory – warehouse staff
costs, security, taxes
• Ordering costs
– costs to determine need, place purchase order,
ensure delivery plus costs to receive, inspect &
stock in warehouse
• Setup costs
– Time spent preparing equipment for the job by
adjusting machine, changing tools
• Shortage costs
– costs when supply exceeds demand (stock-outs)
15. The Inventory Cycle
Profile of Inventory Level Over TimeQ
Demand
rate
Quantity
on hand
Reorder
point
Receive
order
Place Receive
order order
Lead time
Place Receive
order order
Time
Buyer orders Q at each
re-order point
16. Safety Stock
QuantitySafety Stock
Maximum probable demand
during lead time
Expected demand
during lead time
ROP
Safety stock
LT
Time
17. Fixed-Period Ordering
• Orders are placed at fixed time intervals (example –once per week like home milk delivery)
• Suppliers might encourage fixed intervals (their
scheduled delivery route)
• Ensure consistency in delivery times
18. Single Period Model
• Single period model– model for ordering of perishables and other
items with limited useful lives
• Shortage cost
– generally the unrealized profits per unit
• Excess cost
– difference between purchase cost and
salvage value of items left over at the end of
a period (grocery store throws away up to
50% of produce due to spoilage)
19. Fixed Quantity Model
Quantity cannot be changed– Supplier’s pre-determined batch size or case
size (example – carton of dozen eggs)
Shipments dates can change
– Can order as often as needed, even daily but
the shipment quantity is always in the predetermined batch size – but you can order as
many batches as you need
20. Operations Strategy
Too much inventory– Tends to hide problems – quality, efficiency
– Easier to live with problems than to eliminate them
– Costly to maintain – tie up company $$
Wise strategy
– Reduce purchase order sizes –order less more often
– Reduce safety stock (if possible)
21. Inventory
RawMaterials
WIP
Finished
Goods
When Production Order “released” to
Production RM becomes Work In Process
When order built WIP becomes the
finished products we sell to Customer