

 Экономика
Похожие презентации:


")
")


")
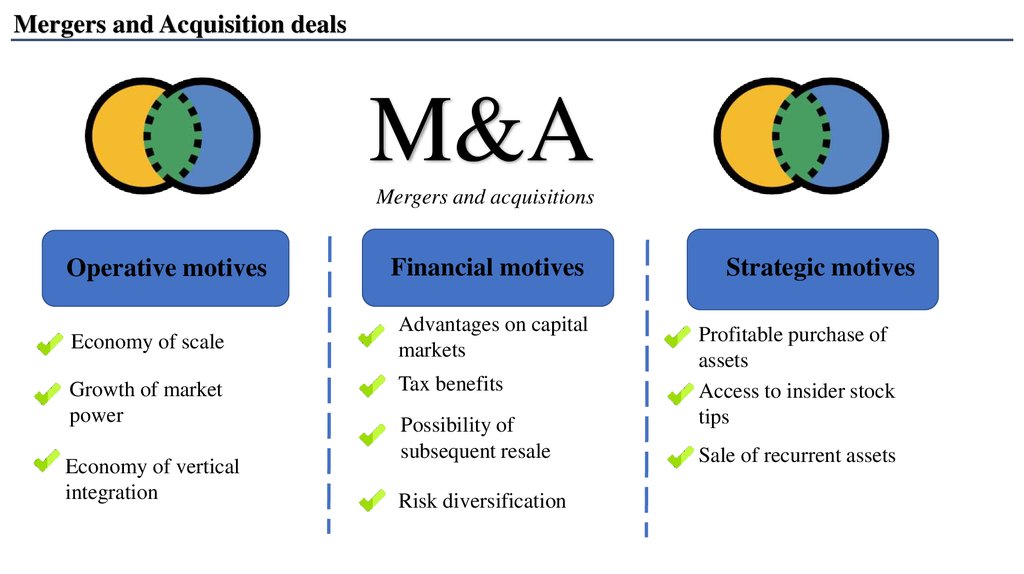
Mergers and Acquisition deals
1.
Mergers and Acquisition dealsM&A
Mergers and acquisitions
Operative motives
Economy of scale
Growth of market
power
Economy of vertical
integration
Financial motives
Advantages on capital
markets
Tax benefits
Possibility of
subsequent resale
Risk diversification
Strategic motives
Profitable purchase of
assets
Access to insider stock
tips
Sale of recurrent assets
2.
Principle of LBOAFTER DEAL
DEAL
Investor
Shareholders
100%
XYZ
Debt pass
$60 Equity
Capital dynamics
EV=$200 mln
CAGR=10%
Debt
170
60
1
Exit yield
EV=$270 mln
100
140
$200
XYZ
Investor
$200
Equity
100%
Debt
$140
$200
-Changed company
management
-Decreased costs
-Increased operating
efficiency
-Stable loan payments
2
Figure 2 – Capital structure changing during LBO
Exit EV
(-)Exit debt
Shareholders` exit equity
(-)Shareholders` entry equity
Profit:
IRR
$270 mln
($100 mln)
$170 mln
($60 mln)
$110 mln
41,5%
3.
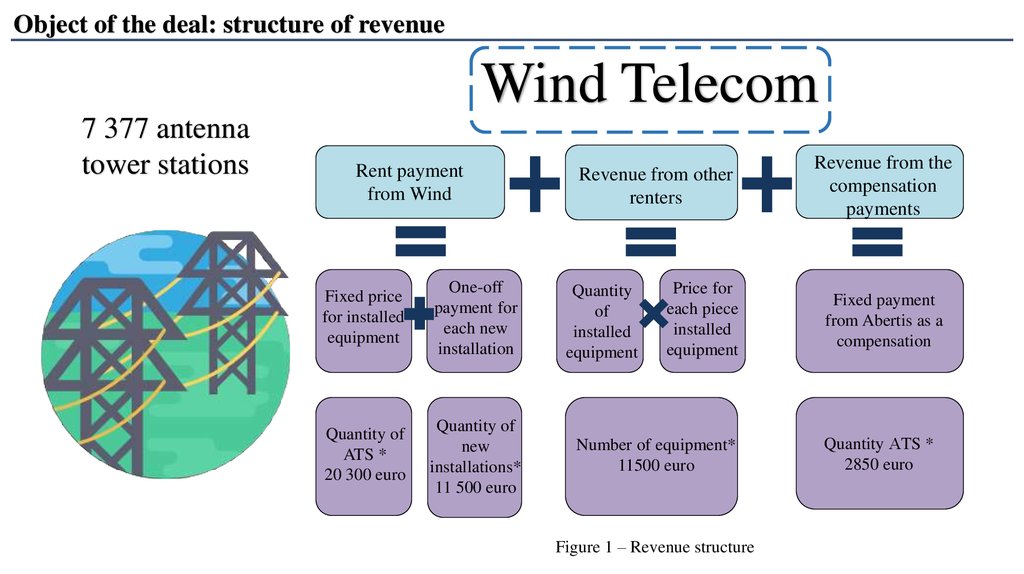
Object of the deal: structure of revenueWind Telecom
7 377 antenna
tower stations
Rent payment
from Wind
Fixed price
for installed
equipment
One-off
payment for
each new
installation
Quantity of
ATS *
20 300 euro
Quantity of
new
installations*
11 500 euro
Revenue from other
renters
Quantity
of
installed
equipment
Price for
each piece
installed
equipment
Number of equipment*
11500 euro
Figure 1 – Revenue structure
Revenue from the
compensation
payments
Fixed payment
from Abertis as a
compensation
Quantity АTS *
2850 euro
4.
Expected revenue calculationStructure of revenue in 2016
Rent payment from
Wind
Revenue dynamics
400
21,02
14,25
10,35
350
Revenue from new
renters
161,25
Revenue from the
compensation
payments
300
Revenue, mln euros
Revenue from other
renters
250
Figure 5 – Structure of revenue in 2016
200
Structure of revenue in 2031
150
Rent payment from
Wind
100
31,06
Revenue from new
renters
92,85
50
215,02
0
2016 2017 2018 2019 2020 2021 2022 2023 2024 2025 2026 2027 2028 2029 2030 2031
Year
Figure 4 – Revenue dynamics
89,99
Revenue from other
renters
Revenue from the
compensation payments
Figure 6 – Structure of revenue in 2031
5.
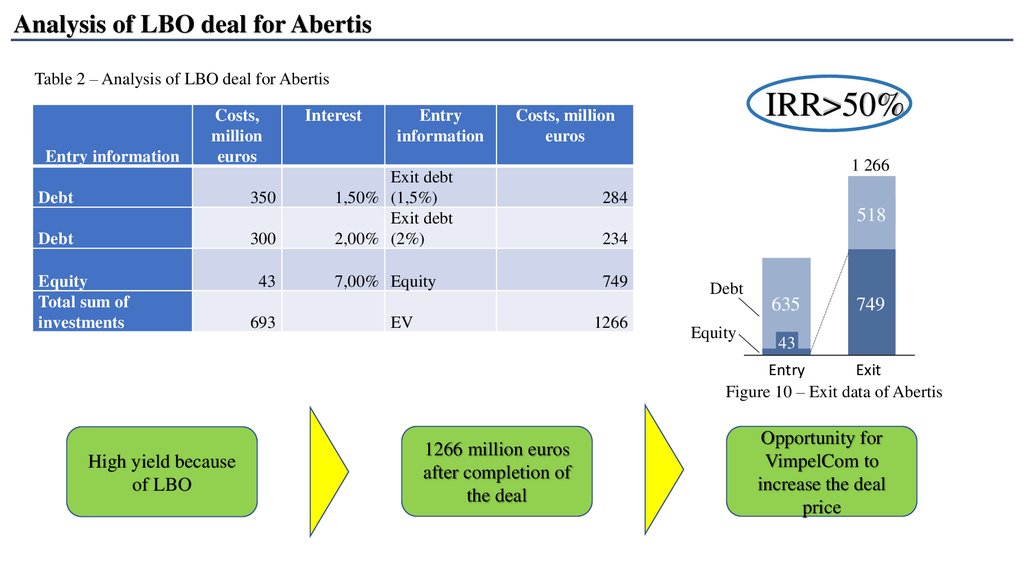
Analysis of LBO deal for AbertisTable 2 – Analysis of LBO deal for Abertis
Entry information
Costs,
million
euros
Debt
350
Debt
300
Equity
Total sum of
investments
43
693
Interest
Entry
information
IRR>50%
Costs, million
euros
Exit debt
1,50% (1,5%)
Exit debt
2,00% (2%)
7,00% Equity
EV
1 266
284
522
518
234
749
1266
Debt
Equity
650
635
753
749
43
Entry
Exit
Figure 10 – Exit data of Abertis
High yield because
of LBO
1266 million euros
after completion of
the deal
Opportunity for
VimpelCom to
increase the deal
price