


 Маркетинг
Похожие презентации:


")


")
Market research: consumer research and retail audit
1.
MARKET RESEARCH:CONSUMER RESEARCH
AND RETAIL AUDIT
ANASTASIYA KORNEEVA
2. ПЛАН РАБОТЫ
Copyright ©2012 The Nielsen Company. Confidential and proprietary.ПЛАН РАБОТЫ
1.
2.
3.
4.
5.
Что такое маркетинг?
История Nielsen
Сервисы Nielsen
Retail Audit
Практические задания
2
3. About marketing
ABOUT MARKETING4. Закон спроса и предложения
Copyright ©2012 The Nielsen Company. Confidential and proprietary.ЗАКОН СПРОСА И ПРЕДЛОЖЕНИЯ
Закон спроса и предложения — объективный экономический закон,
устанавливающий зависимость величины спроса и предложения товаров на
рынке от их цен. При прочих равных условиях, чем цена на товар ниже, тем
больше величина спроса (готовность покупать) и тем меньше величина
предложения (готовность продавать)
Цена Р
Цена
равновесия
Pr
Предложение S
R
Точка
равновесия
Потребление
товара Qr
Спрос D
Количество
товара, Q
4
5. Понятие и сущность маркетинга
Copyright ©2012 The Nielsen Company. Confidential and proprietary.ПОНЯТИЕ И СУЩНОСТЬ МАРКЕТИНГА
ИССЛЕДОВАНИЯ
И РАЗРАБОКИ
ЗАКУПКИ
ПРОИЗВОДСТВО
ПРОДАЖИ
FMCG
КОМПАНИЯ
МАРКЕТИНГ
УПРАВЛЕНИЕ
ПЕРСОНАЛОМ
ФИНАНСЫ
ИНФОРМАЦИОННЫЕ
ТЕХНОЛОГИИ
Маркетинг – это единый комплекс организации производства и сбыта товара
(услуги), направленный на выявление и удовлетворение потребностей
конкретной группы потребителей с целью получения прибыли
5
6. Функции маркетинга
Copyright ©2012 The Nielsen Company. Confidential and proprietary.ФУНКЦИИ МАРКЕТИНГА
АНАЛИЗ
ПРОИЗВОДСТВО
СБЫТ
УПРАВЛЕНИЕ
КОНТРОЛЬ
анализ рынков, потребителей, спроса, конкурентов
производство нового товара, снабжение и управление качеством
товародвижение, сервис, формирование спроса, сбыт, товарная
и ценовая политика
стратегия и планирование, информационное управление,
организация коммуникаций
контроль выполнения мероприятий и их результатов
6
7. Аналитическая функция маркетинга
Copyright ©2012 The Nielsen Company. Confidential and proprietary.АНАЛИТИЧЕСКАЯ ФУНКЦИЯ МАРКЕТИНГА
Маркетинговая информация – основа для принятия бизнес-решений
Источники
информации
Типы
исследований
Первичные
Количественные
Вторичные
Качественные
7
8. ЗНАЧИМОСТЬ ТИПОВ ИССЛЕДОВАНИЙ
3%10%
24%
16%
МИР
РОССИЯ
Copyright ©2012 The Nielsen Company. Confidential and proprietary.
74%
73%
Количественные
Качественные
Прочие
Source: ESOMAR Global Market Research 2014 (covering 2013)
8
9. Маркетинговый анализ
Copyright ©2012 The Nielsen Company. Confidential and proprietary.МАРКЕТИНГОВЫЙ АНАЛИЗ
Анализ внешней среды предприятия. Классификацию покупателей
Анализ внутренней среды предприятия. Анализ продаж, цен и затрат
SWOT - анализ. Стратегические факторы успеха. Оценка потенциала фирмы.
Оценка конкурентоспособности
Внутренняя
среда
Внешняя
среда
Strength
Weakness
Сильные
стороны
Слабые
стороны
Opportunities
Threats
Возможности
Угрозы
9
10. товар
Copyright ©2012 The Nielsen Company. Confidential and proprietary.ТОВАР
Все, что может быть предложено на рынке: как товар (производственного
назначения, повседневного спроса итд.), так и услуга (бытовая,
производственная и итд.)
Любой товар проходит ЖИЗНЕННЫЙ ЦИКЛ:
Зрелось
продукта
Рост
известности
Объем
продаж
Спад
продаж
Выведение
на рынок
Разработка
товара
Время
10
11. quiz
QUIZ12. ПРОЦЕНТ РОССИЙСКИХ ПОТРЕБИТЕЛЕЙ, ЖЕЛАЮЩИХ ПОПРОБОВАТЬ НОВЫЙ ТОВАР?
Copyright ©2012 The Nielsen Company. Confidential and proprietary.ПРОЦЕНТ РОССИЙСКИХ ПОТРЕБИТЕЛЕЙ, ЖЕЛАЮЩИХ
ПОПРОБОВАТЬ НОВЫЙ ТОВАР?
52%
76%
34%
12
13. ПО ДАННЫМ ОПРОСОВ ВО ВРЕМЯ КРИЗИСА ПОТРЕБИТЕЛИ В ПЕРВУЮ ОЧЕРЕДЬ ОТКАЗЫВАЮТСЯ ОТ…
Copyright ©2012 The Nielsen Company. Confidential and proprietary.ПО ДАННЫМ ОПРОСОВ ВО ВРЕМЯ КРИЗИСА
ПОТРЕБИТЕЛИ В ПЕРВУЮ ОЧЕРЕДЬ
ОТКАЗЫВАЮТСЯ ОТ…
Chocolate
13
14. ABOUT NIELSEN
15.
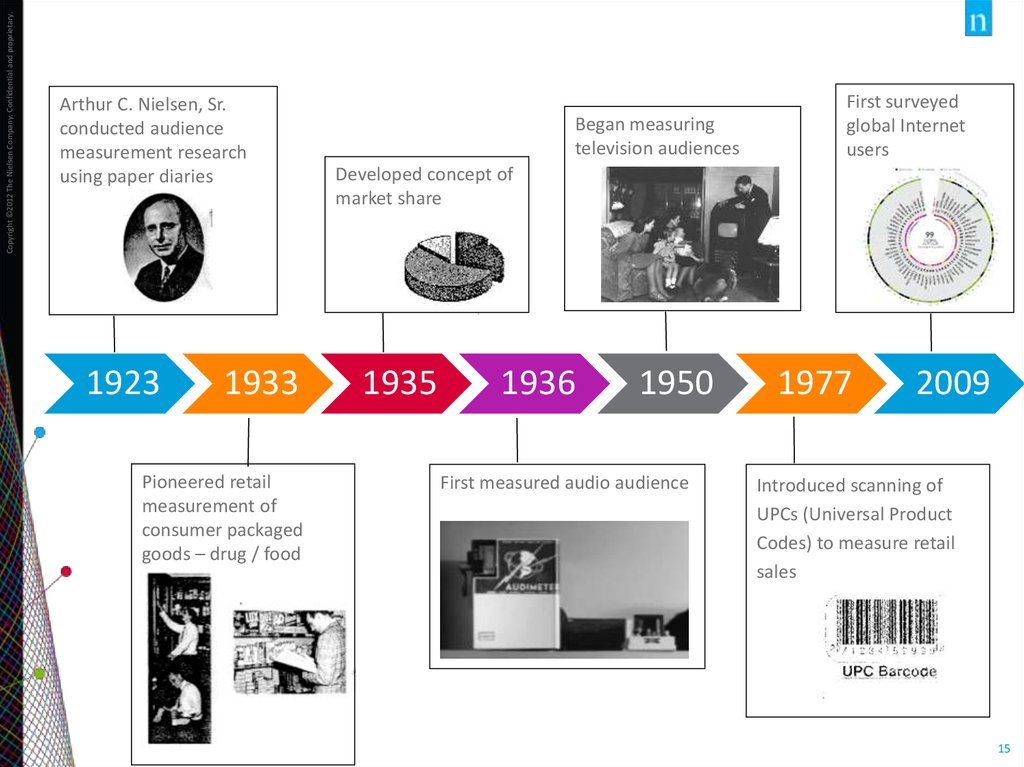
Copyright ©2012 The Nielsen Company. Confidential and proprietary.Arthur C. Nielsen, Sr.
conducted audience
measurement research
using paper diaries
1923
1933
Pioneered retail
measurement of
consumer packaged
goods – drug / food
Began measuring
television audiences
First surveyed
global Internet
users
Developed concept of
market share
1935
1936
1950
First measured audio audience
1977
2009
Introduced scanning of
UPCs (Universal Product
Codes) to measure retail
sales
15
16. Nielsen Moments in History
Copyright ©2012 The Nielsen Company. Confidential and proprietary.NIELSEN MOMENTS IN HISTORY
What was the first item scanned by UPC Code to record
a price for a retail transaction?
A) Coca-Cola Soda
B) Juicy Fruit Gum
C) Hershey Chocolate Bar
D) Skippy Peanut Butter
16
17.
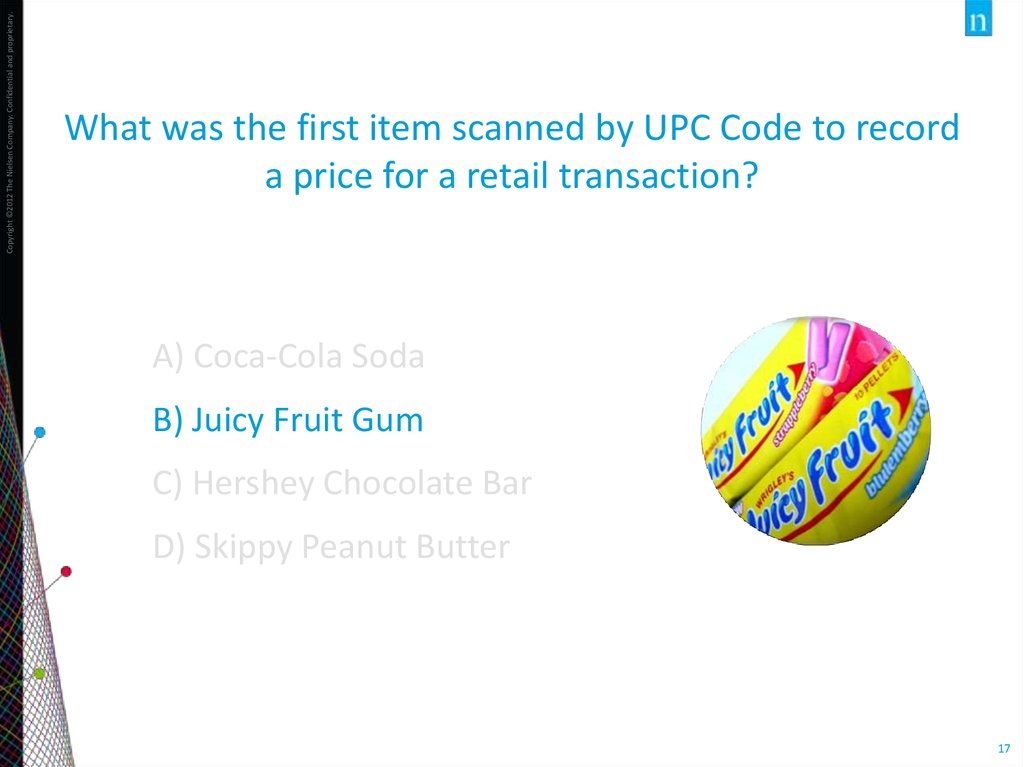
Copyright ©2012 The Nielsen Company. Confidential and proprietary.What was the first item scanned by UPC Code to record
a price for a retail transaction?
A) Coca-Cola Soda
B) Juicy Fruit Gum
C) Hershey Chocolate Bar
D) Skippy Peanut Butter
17
18.
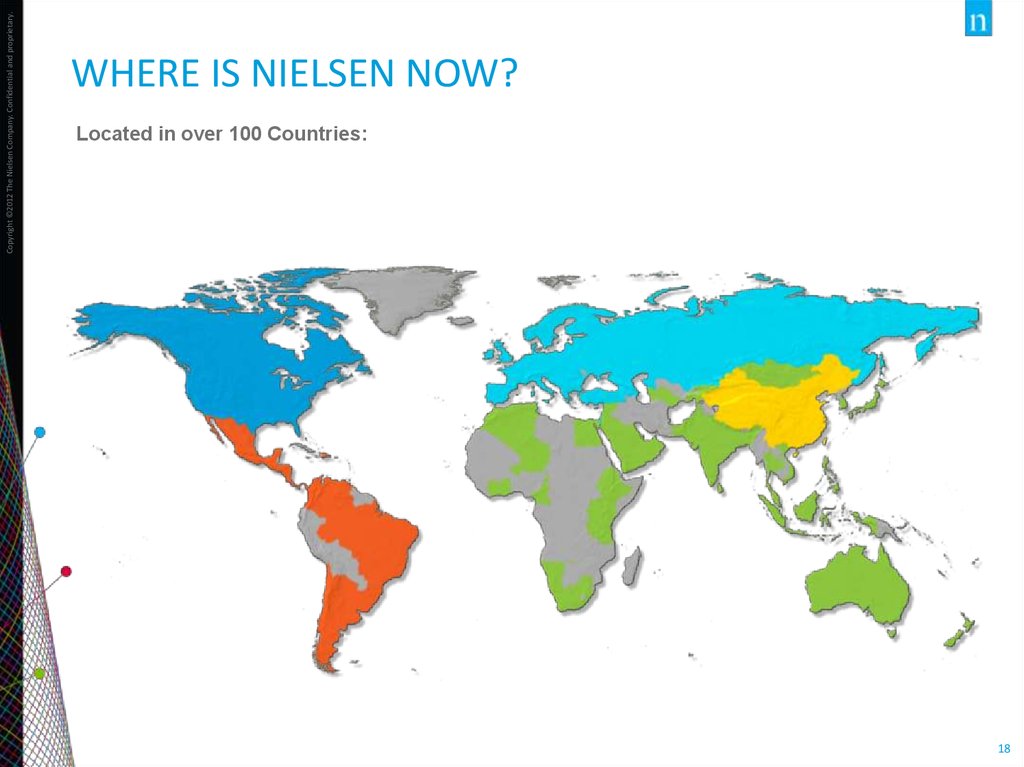
Copyright ©2012 The Nielsen Company. Confidential and proprietary.WHERE IS NIELSEN NOW?
Located in over 100 Countries:
18
19.
Copyright ©2012 The Nielsen Company. Confidential and proprietary.WHERE DO WE PLAY?
WATCH
BUY
19
20. Nielsen services
NIELSEN SERVICES21. THE CONSUMER’S WORLD
Copyright ©2012 The Nielsen Company. Confidential and proprietary.THE CONSUMER’S WORLD
Every action is a data point
21
22. From data to information
Copyright ©2012 The Nielsen Company. Confidential and proprietary.FROM DATA TO INFORMATION
Simplifying the complex
22
23.
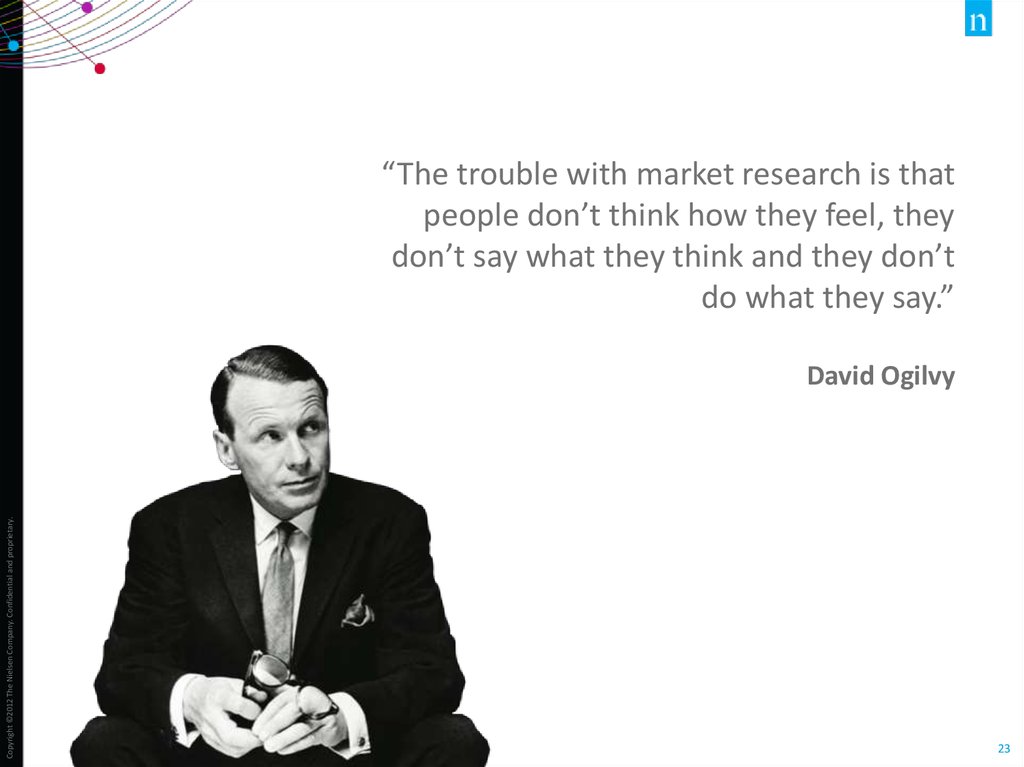
“The trouble with market research is thatpeople don’t think how they feel, they
don’t say what they think and they don’t
do what they say.”
Copyright ©2012 The Nielsen Company. Confidential and proprietary.
David Ogilvy
23
24.
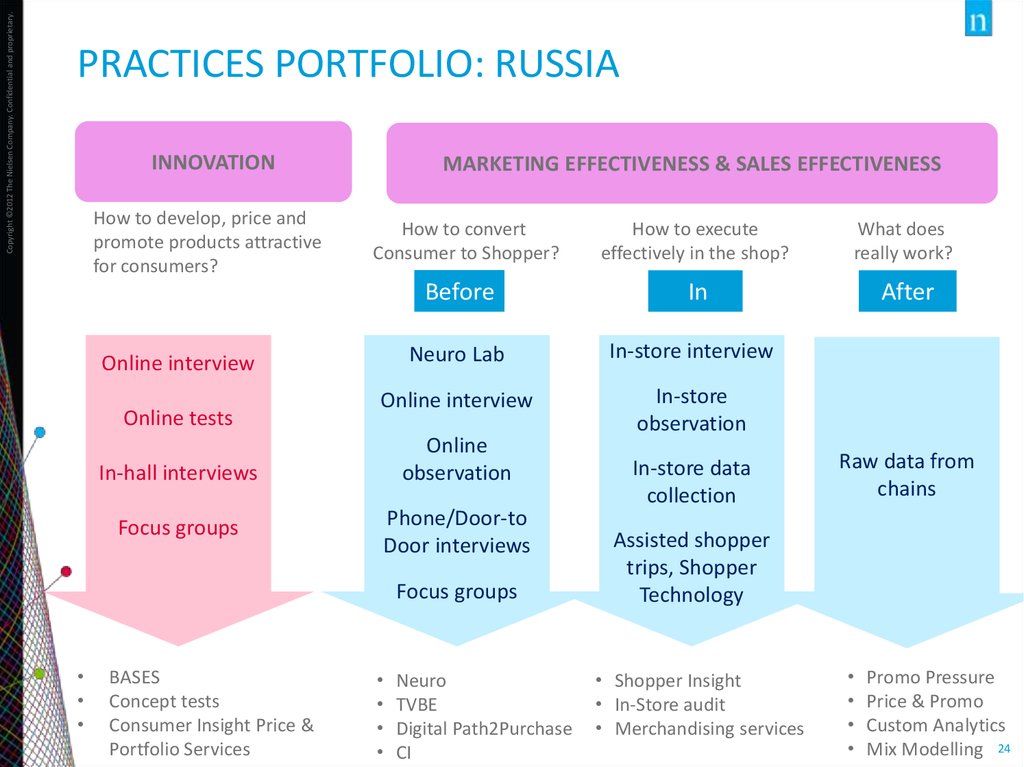
Copyright ©2012 The Nielsen Company. Confidential and proprietary.PRACTICES PORTFOLIO: RUSSIA
INNOVATION
How to develop, price and
promote products attractive
for consumers?
MARKETING EFFECTIVENESS & SALES EFFECTIVENESS
How to convert
Consumer to Shopper?
How to execute
effectively in the shop?
What does
really work?
Before
In
After
Neuro Lab
In-store interview
Online interview
In-store
observation
Online interview
Online tests
Online
observation
In-hall interviews
Focus groups
Phone/Door-to
Door interviews
Focus groups
BASES
Concept tests
Consumer Insight Price &
Portfolio Services
Neuro
TVBE
Digital Path2Purchase
CI
In-store data
collection
Raw data from
chains
Assisted shopper
trips, Shopper
Technology
• Shopper Insight
• In-Store audit
• Merchandising services
Promo Pressure
Price & Promo
Custom Analytics
Mix Modelling 24
25. RETAIL AUDIT
26. RUSSIA
Copyright ©2012 The Nielsen Company. Confidential and proprietary.RUSSIA
RUSSIA
1989
RMS
≈1400 FTE
200+
CATEGORIES
PRACTICES
150+ CONTRACT
BASED CLIENTS
26
27.
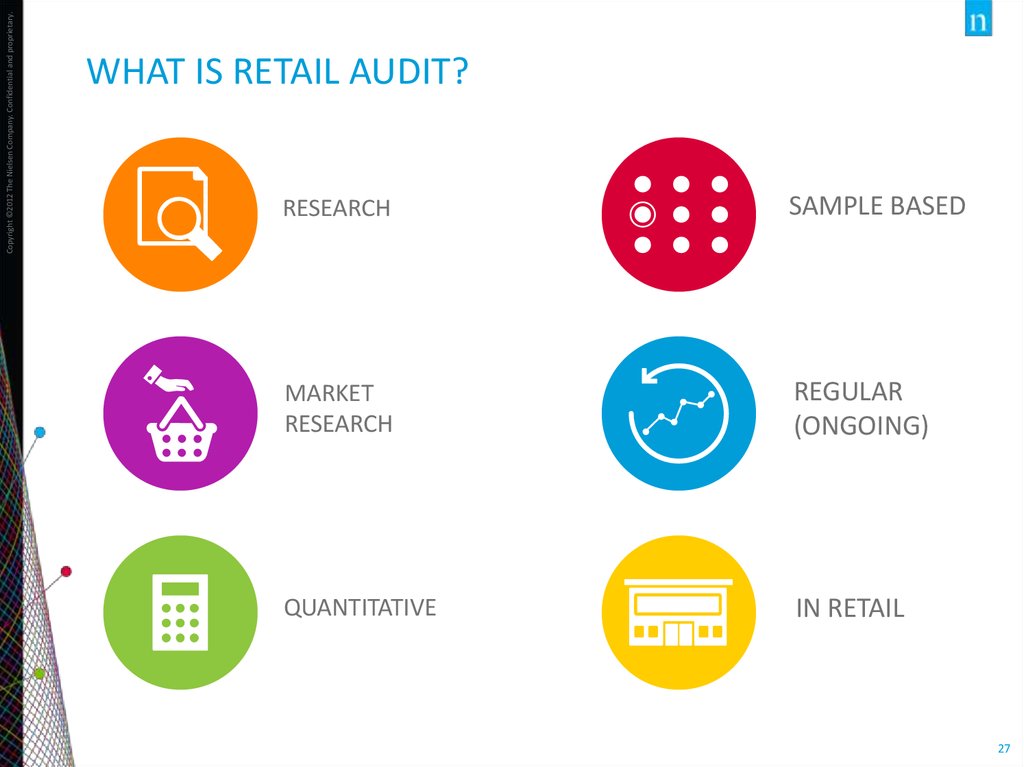
Copyright ©2012 The Nielsen Company. Confidential and proprietary.WHAT IS RETAIL AUDIT?
RESEARCH
SAMPLE BASED
MARKET
RESEARCH
REGULAR
(ONGOING)
QUANTITATIVE
IN RETAIL
27
28.
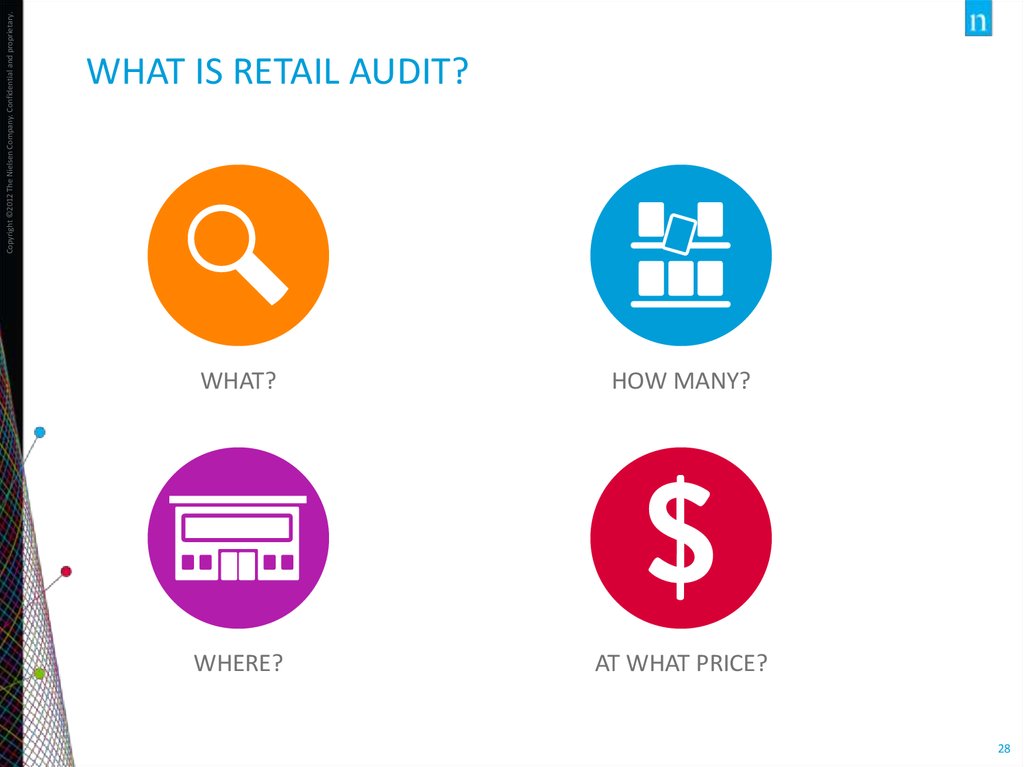
Copyright ©2012 The Nielsen Company. Confidential and proprietary.WHAT IS RETAIL AUDIT?
WHAT?
HOW MANY?
WHERE?
AT WHAT PRICE?
28
29. clients ask… and we answer
Copyright ©2012 The Nielsen Company. Confidential and proprietary.CLIENTS ASK… AND WE ANSWER
What questions could Retail Measurement Data answer?
What is the category
size? Does it grow or
decline?
How is our innovation
performing in the first
6 months of launch?
Did price increase
affect sales of my
brand?
How does my brand
stand compared with
the competition?
Are there any
opportunities for my
brand to grow share?
What segments are
driving category
performance?
29
30. How do Manufacturers use RMS?
Copyright ©2012 The Nielsen Company. Confidential and proprietary.HOW DO MANUFACTURERS USE RMS?
Senior Management
• Review top line company
performance
• Establishing and monitoring KPIs
• Setting strategic direction
Marketing
• Observe performance of internal
and competitive brands
• Identify opportunities for growth or
NPD
• Brand Planning
• Forecasting
Insights team
• Planning
• Reporting
Finance
• Budgeting
Trade Marketing / Sales
• Examine performance of promotions
• Monitor distribution/ product
availability
• Develop channel strategy
Production
• Monthly trends help plan
production more accurately
30
31. How do retailers use RMS?
Copyright ©2012 The Nielsen Company. Confidential and proprietary.HOW DO RETAILERS USE RMS?
Marketing
• Tracking promotions /
pricing
• House brand / Own
brand development and
tracking
Merchandising /
Buyer
• Ranging
• Product Assortment
Space planning
• Managing shelf space
Supply chain
• Demand forecasting
• Stock management
31
32.
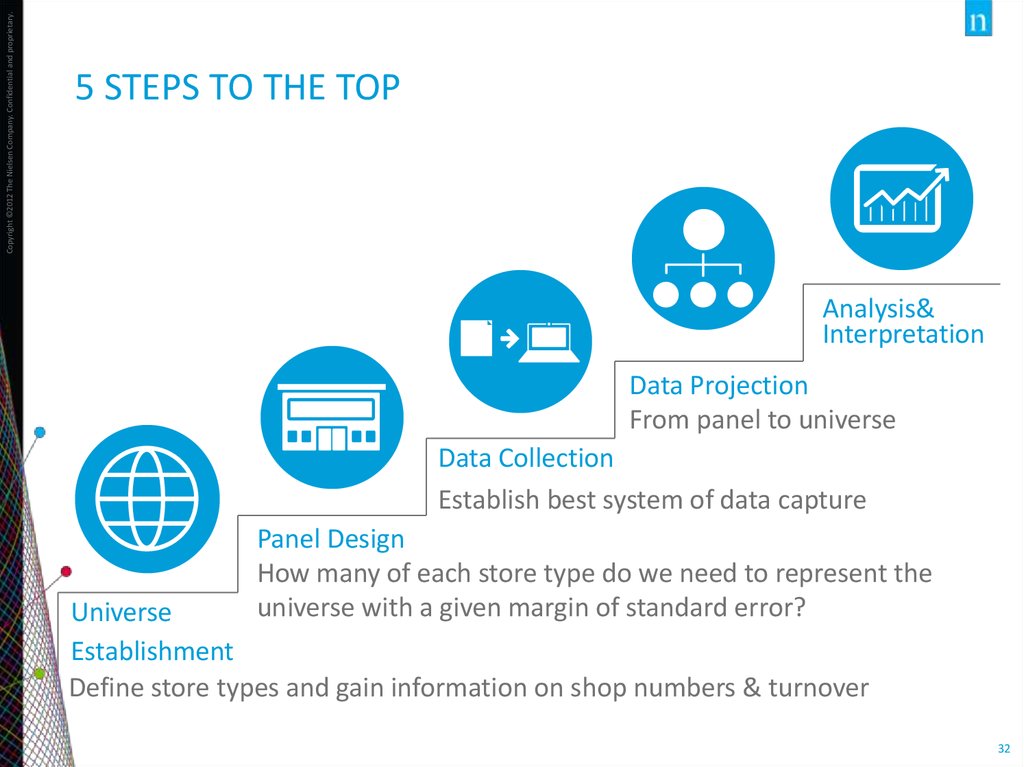
Copyright ©2012 The Nielsen Company. Confidential and proprietary.5 STEPS TO THE TOP
Analysis&
Interpretation
Data Projection
From panel to universe
Data Collection
Establish best system of data capture
Panel Design
How many of each store type do we need to represent the
universe with a given margin of standard error?
Universe
Establishment
Define store types and gain information on shop numbers & turnover
32
33. 4 Inf*Act Data Base dimensions
Copyright ©2012 The Nielsen Company. Confidential and proprietary.4 INF*ACT DATA BASE DIMENSIONS
Periods
Facts
Products
Markets
33
34. Data analysis and interpretation
DATA ANALYSIS AND INTERPRETATION35.
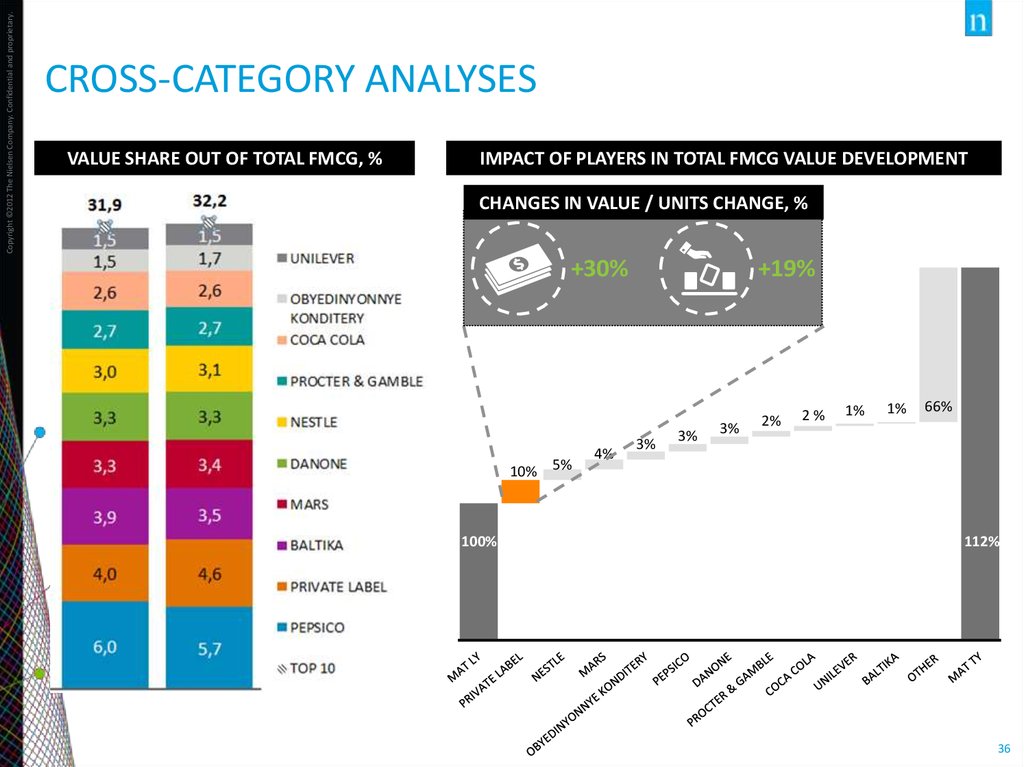
Copyright ©2012 The Nielsen Company. Confidential and proprietary.CROSS-CATEGORY ANALYSES
Source: Nielsen Retail Audit
VALUE SHARE OUT OF TOTAL FMCG, %
IMPACT OF PLAYERS IN TOTAL FMCG VALUE DEVELOPMENT
CHANGES IN VALUE / UNITS CHANGE, %
4000,0
+19%
+30%
3900,0
3800,0
3700,0
10% 5%
3600,0
4%
3%
3%
3%
2%
2%
1%
1%
66%
3500,0
100%
112%
3400,0
3300,0
36
36. Cross-category analyses
PRACTICE37. practice
Copyright ©2012 The Nielsen Company. Confidential and proprietary.QUESTIONS
• Why it’s important to explain reasons of sales/share change?
• What is better: higher price and smaller market share or lower price and bigger
market share?
• Which product is cheaper?
Product 1: volume share > value share
Product 2: volume share < value share
• If manufacturer’s sales increased, does it mean its share in category also increased?
38