


 Финансы
Похожие презентации:


")


Price Equilibrium 11.2a
1. Price Equilibrium 11.2a
03/09/2018Sonali Sinha Roy
1
2. Learning Objectives
By the end of the lesson the learners will be able to :Define and understand the terms
Equilibrium Price
Change in equilibrium price
Analyse and apply the concept to real world situation .
(1 min)
3.
(2 min)Supply and Demand are the
two fundamental forces that
guide an economy. Many
games feature these two
forces in either a selfcontained or player-driven
fashion.
The concept of Supply and Demand came into widespread
usage and acceptance due to the writings of Adam Smith,
specifically his The Wealth of Nations. Smith described the
two forces as the driving factors-Invisible hands behind any
economy, necessary for its survival.
03/09/2018
Sonali Sinha Roy
3
4. Price Equilibrium
03/09/2018Sonali Sinha Roy
4
5. Price Equilibrium
03/09/2018Sonali Sinha Roy
5
6.
Price Disequilibrium03/09/2018
Sonali Sinha Roy
6
7. Excess Demand/ Shortage
03/09/2018Sonali Sinha Roy
7
8. Excess Supply/Surplus
03/09/2018Sonali Sinha Roy
8
9. Shifts in supply and demand
03/09/2018Sonali Sinha Roy
9
10.
The original equilibrium price is P1, quantity Q1. We are at a 'state ofrest'. Now assume that one of the determinants of demand changes. For
instance, there may have been an increase in advertising in the industry.
This will shift the demand curve to the right, ceteris paribus (D2). The
price will not stay at P1 for much longer. We have an excess demand
situation (A to C). This will cause the price to be bid up, and this will
keep going until we reach the new equilibrium price where the new
demand curve crosses the supply curve (at point B). Note that there has
been a shift in the demand curve, but only a movement along the
supply curve. None of the determinants of supply have changed.
This process is called the 'price mechanism'. we can see that the price
itself has the most important role. The rising price has acted as a signal
to possible new firms who might want to join this expanding industry. It
acted as an incentive, encouraging existing firms to produce more (the
movement along the supply curve). It also acted as a sort of rationing
device in the sense that it put off some existing buyers and helped make
sure03/09/2018
that demand matched supply.
Sonali Sinha Roy
10
11. Supply curve shifts to the right
Why might the supplycurve shift to the right?
•Fall in wage costs
•Fall in raw material costs
•Improved labour productivity
•Reduced indirect taxes
•Increased subsidies
•Improved technology
•Entry of new firms into the
industry
Initial equilibrium: P1, Q1 (A)
New equilibrium: P4, Q6 (G)
03/09/2018
Sonali Sinha Roy
11
12. Supply curve shifts to the left
Why might the supplycurve shift to the left?
•Rise in wage costs
•Rise in raw material costs
•Reduced labour productivity
•An increase in indirect taxes
•Reduced, or elimination of,
subsidies
•The exit of existing firms
from the industry
Initial equilibrium: P1, Q1 (A)
New equilibrium: P5, Q8 (J)
03/09/2018
Sonali Sinha Roy
12
13. Demand curve shifts to the left
Why might the demand curve shiftto the left?
•Fall in real incomes
• Reduced preferences for the good
• Fall in the price of a substitute
•Rise in the price of a complement
•Fall in population numbers
•Reduced advertising and
marketing
Initial equilibrium: P1, Q1 (A)
New equilibrium: P3, Q4 (E)
03/09/2018
Sonali Sinha Roy
13
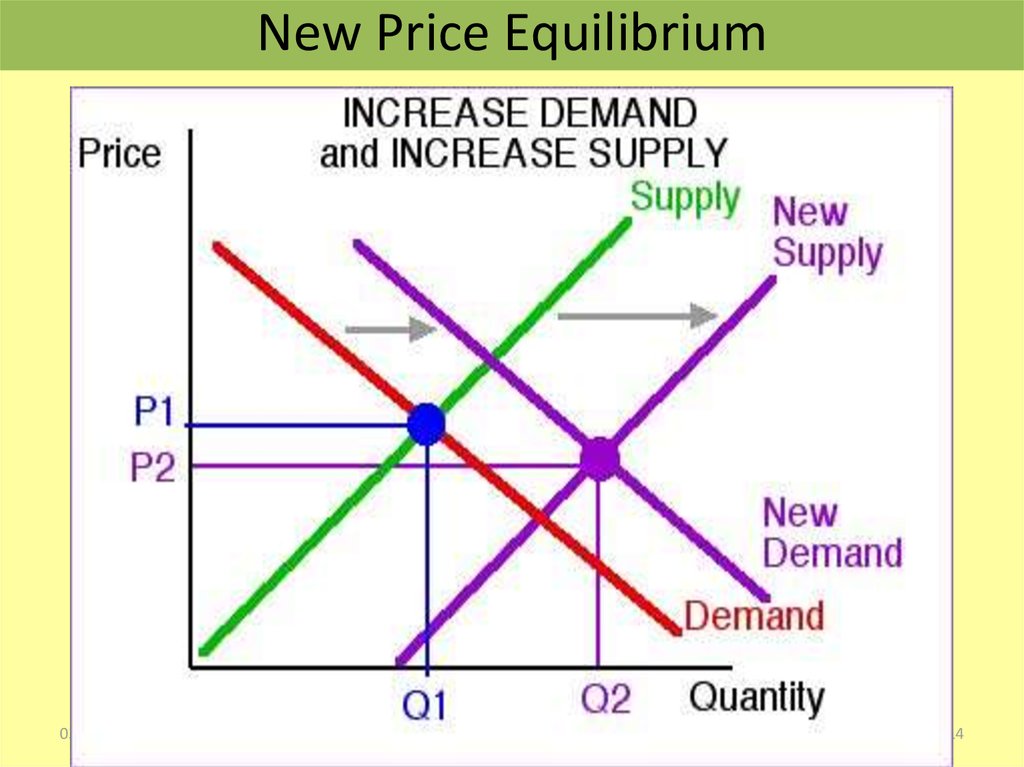
14.
New Price Equilibrium03/09/2018
Sonali Sinha Roy
14
15. In Class Activity
For each of the following scenarios, use a supply and demand diagramto illustrate the effect of the given shock on the equilibrium price and
quantity in the specified competitive market. Explain whether there is
a shift in the demand curve, the supply curve, or neither.
1. An unexpected temporary heat wave hits the East Coast. Show the
effect in the ice cream market in New England.
2. The government introduces a tax on ice cream which is paid by
producers. What is the effect in the ice cream market?
3. China and Mexico are major producers of textiles. Workers in Mexico
decide to go on strike. Show the effect on the market for Mexican
textiles.
4. Show the effect of the situation described in (c) on the market for
Chinese textiles.
5. Suppose the government imposes a price cap on bottled water. Show
the effect in the bottled water market.
03/09/2018
Sonali Sinha Roy
15
16. Recap of Today’s Lesson
03/09/2018Sonali Sinha Roy
16
17. Reflection
03/09/2018Sonali Sinha Roy
17
18. Price Equilibrium function 11.2a
03/09/2018Sonali Sinha Roy
18
19. Learning Objectives
(1 min)By the end of the lesson the learners will be able to :
Define and understand the terms
Equilibrium Price function
Plot equilibrium price from given demand and supply function
Analyse and apply the concept to real world situation .
20. Equilibrium Price Function
Demand FunctionQd = a – bP
Qd = quantity of a good demanded
P is the price of the good
a = vertical intercept (Max QD )
b = the slope of the demand curve
Supply Function
Qs = c + dP
Qs = quantity of a good supplied
P = is the price of the good
c = vertical intercept (max supply)
d = the slope of the supply curve
21. In Class Activity
Consider the market for apple juice. In this market, the supply curve isgiven by QS = 10PJ −5PA and the demand curve is given by QD =
100−15PJ +10PT , where J denotes apple juice, A denotes apples,
and T denotes tea.
•Assume that PA is fixed at $1 and PT = 5. Calculate the equilibrium
price and quantity in the apple juice market.
•Suppose that a poor harvest season raises the price of apples to PA =
2. Find the new equilibrium price and quantity of apple juice. Draw a
graph to illustrate your answer.
•Suppose PA = 1 but the price of tea drops to PT = 3. Find the new
equilibrium price and quantity of apple juice.
•Suppose PA = 1, PT = 5, and there is a price ceiling on apple juice of
P∗ = 5. What is the excess demand for apple juice as a result? Draw a
graph to illustrate your answer.
03/09/2018
Sonali Sinha Roy
21
22. Recap of Today’s Lesson
03/09/2018Sonali Sinha Roy
22
23. Reflection
03/09/2018Sonali Sinha Roy
23