


 Экономика
Похожие презентации:


")


The phillips curve, the natural rate of unemployment and inflation
1. CHAPTER 10: THE PHILLIPS CURVE, THE NATURAL RATE OF UNEMPLOYMENT AND INFLATION
Blanchard, Amighini and Giavazzi, Macroeconomics: A European Perspective PowerPoints on the Web, 2nd edition © Pearson Education Limited 20142. The Natural Rate of Unemployment and the Phillips Curve
Slide10.2
Inflation versus unemployment in the USA, 1900–1960
During the period 1900–1960 in the USA, a low unemployment rate was typically
associated with a high inflation rate, and a high unemployment rate was typically
associated with a low or negative inflation rate.
Figure 10.1
The Phillips curve, based on the data above, shows a
negative relation between inflation and unemployment.
Blanchard, Amighini and Giavazzi, Macroeconomics: A European Perspective PowerPoints on the Web, 2nd edition © Pearson Education Limited 2014
3. 10.1 Inflation, Expected Inflation and Unemployment
Slide10.3
P P (1 ) F (u, z )
e
The above equation is the aggregate supply
relation derived in Chapter 8. This relation can
be rewritten to establish a relation between
inflation, expected inflation and the
unemployment rate.
First, the function F, assumes the form:
F (u, z) 1 u z
Then, replace this function in the one above:
P P (1 ) (1 u z )
e
Blanchard, Amighini and Giavazzi, Macroeconomics: A European Perspective PowerPoints on the Web, 2nd edition © Pearson Education Limited 2014
4.
10.1 Inflation, Expected Inflationand Unemployment (Continued)
Slide
10.4
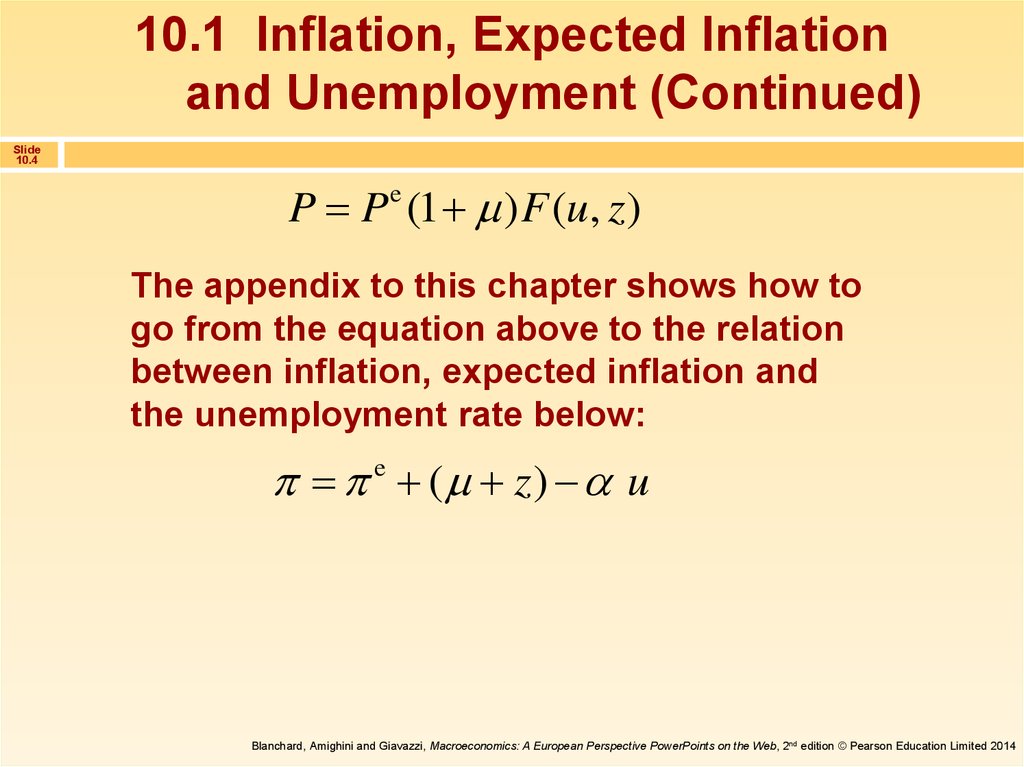
P P (1 ) F (u, z )
e
The appendix to this chapter shows how to
go from the equation above to the relation
between inflation, expected inflation and
the unemployment rate below:
( z) u
e
Blanchard, Amighini and Giavazzi, Macroeconomics: A European Perspective PowerPoints on the Web, 2nd edition © Pearson Education Limited 2014
5.
10.1 Inflation, Expected Inflationand Unemployment (Continued)
Slide
10.5
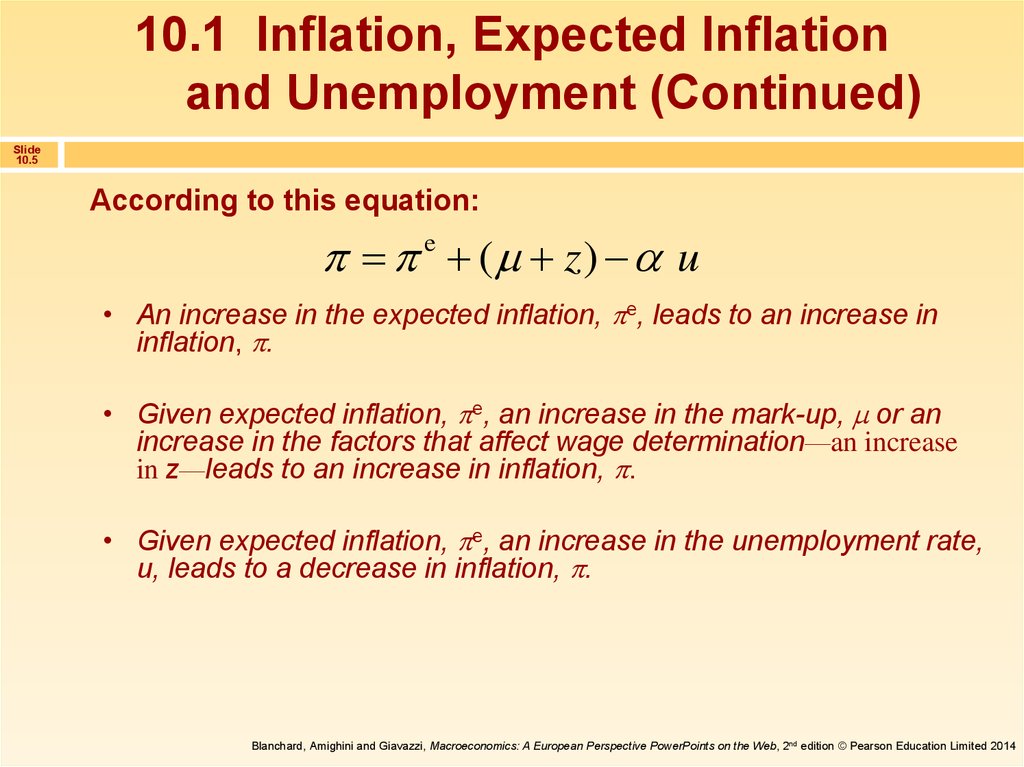
According to this equation:
e ( z) u
• An increase in the expected inflation, e, leads to an increase in
inflation, .
• Given expected inflation, e, an increase in the mark-up, or an
increase in the factors that affect wage determination—an increase
in z—leads to an increase in inflation, .
• Given expected inflation, e, an increase in the unemployment rate,
u, leads to a decrease in inflation, .
Blanchard, Amighini and Giavazzi, Macroeconomics: A European Perspective PowerPoints on the Web, 2nd edition © Pearson Education Limited 2014
6.
10.1 Inflation, Expected Inflationand Unemployment (Continued)
Slide
10.6
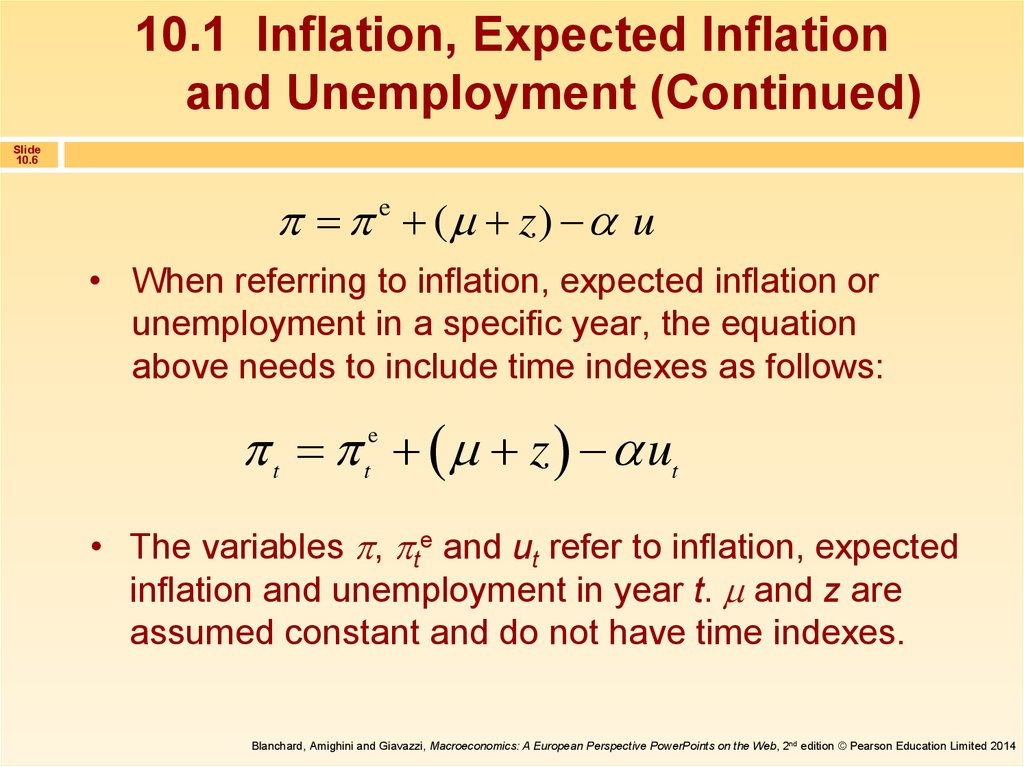
( z) u
e
• When referring to inflation, expected inflation or
unemployment in a specific year, the equation
above needs to include time indexes as follows:
t t z ut
e
• The variables , te and ut refer to inflation, expected
inflation and unemployment in year t. and z are
assumed constant and do not have time indexes.
Blanchard, Amighini and Giavazzi, Macroeconomics: A European Perspective PowerPoints on the Web, 2nd edition © Pearson Education Limited 2014
7. 10.2 The Phillips Curve
Slide10.7
The early incarnation
If we set te = 0, then:
t ( z ) ut
This is the negative relation between unemployment and inflation that
Phillips found for the United Kingdom, and Solow and Samuelson
found for the United States (or the original Phillips curve).
Blanchard, Amighini and Giavazzi, Macroeconomics: A European Perspective PowerPoints on the Web, 2nd edition © Pearson Education Limited 2014
8.
10.2 The Phillips Curve (Continued)Slide
10.8
The early incarnation
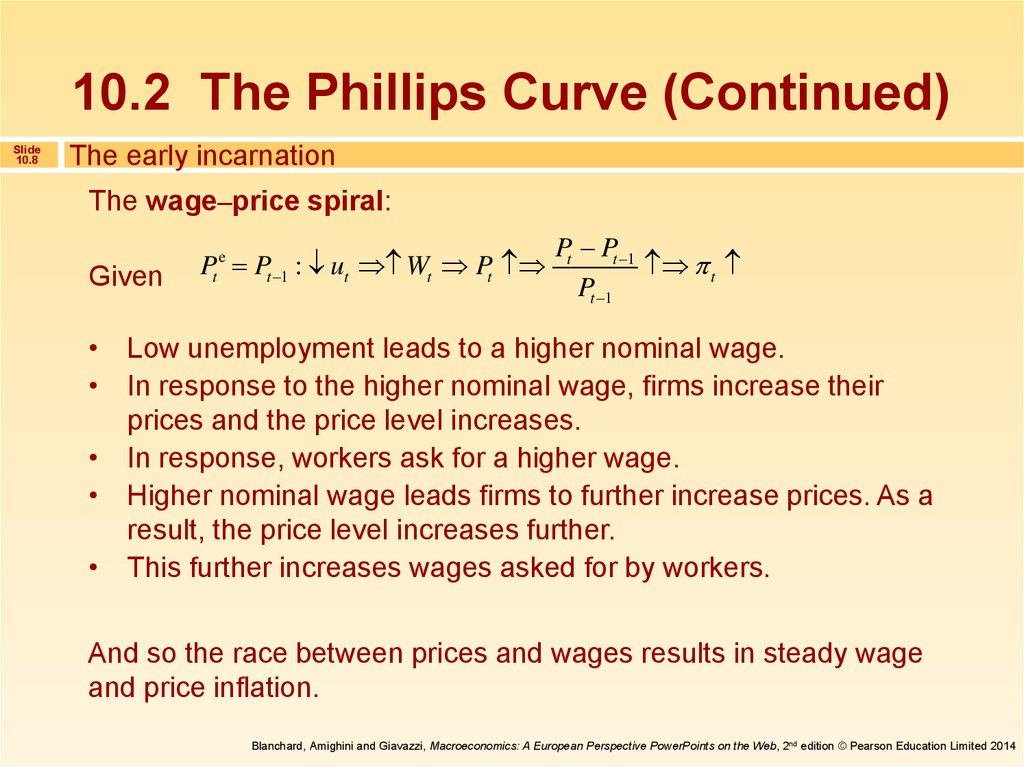
The wage–price spiral:
Given
Pt e Pt 1 : ut Wt Pt
Pt Pt 1
t
Pt 1
• Low unemployment leads to a higher nominal wage.
• In response to the higher nominal wage, firms increase their
prices and the price level increases.
• In response, workers ask for a higher wage.
• Higher nominal wage leads firms to further increase prices. As a
result, the price level increases further.
• This further increases wages asked for by workers.
And so the race between prices and wages results in steady wage
and price inflation.
Blanchard, Amighini and Giavazzi, Macroeconomics: A European Perspective PowerPoints on the Web, 2nd edition © Pearson Education Limited 2014
9.
10.2 The Phillips Curve (Continued)Slide
10.9
Mutations
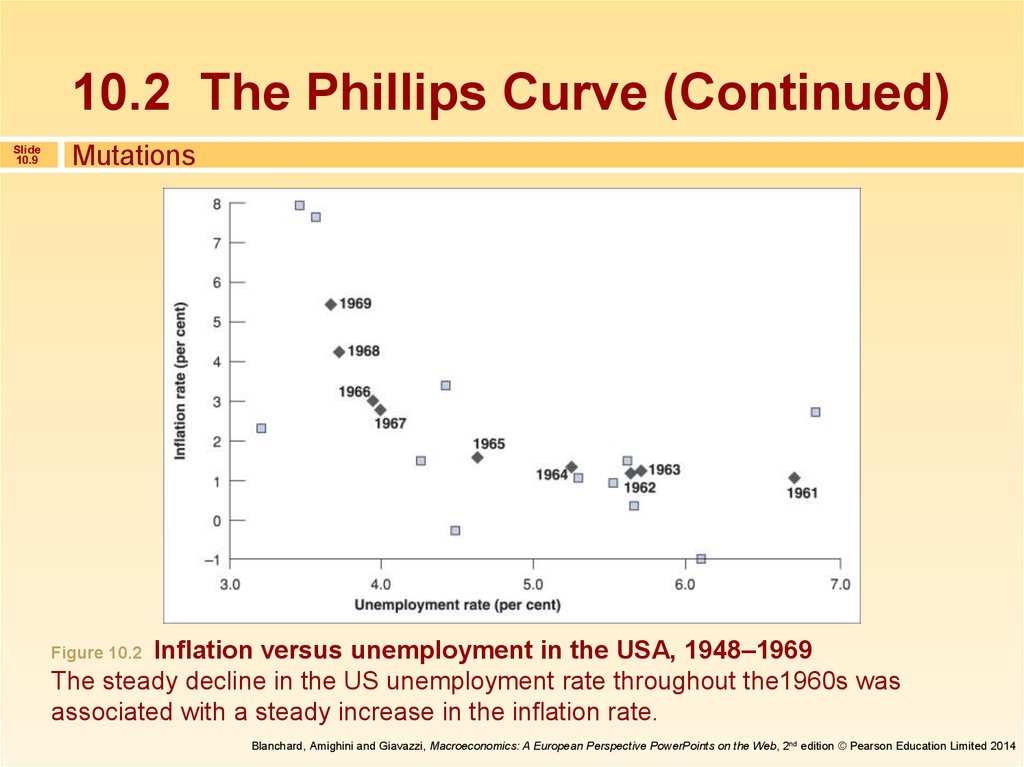
Inflation versus unemployment in the USA, 1948–1969
The steady decline in the US unemployment rate throughout the1960s was
associated with a steady increase in the inflation rate.
Figure 10.2
Blanchard, Amighini and Giavazzi, Macroeconomics: A European Perspective PowerPoints on the Web, 2nd edition © Pearson Education Limited 2014
10.
10.2 The Phillips Curve (Continued)Slide
10.10
Mutations
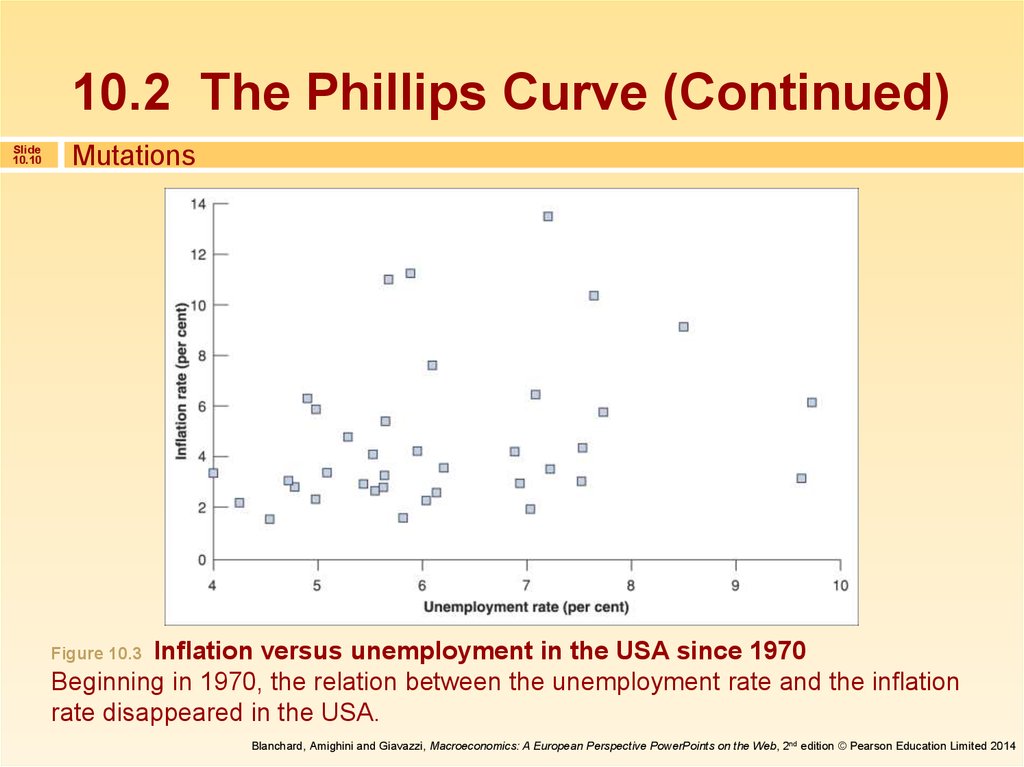
Inflation versus unemployment in the USA since 1970
Beginning in 1970, the relation between the unemployment rate and the inflation
rate disappeared in the USA.
Figure 10.3
Blanchard, Amighini and Giavazzi, Macroeconomics: A European Perspective PowerPoints on the Web, 2nd edition © Pearson Education Limited 2014
11.
10.2 The Phillips Curve (Continued)Slide
10.11
Mutations
The negative relation between unemployment and
inflation held throughout the 1960s, but it
vanished after that for two reasons:
• An increase in the price of oil, but more importantly,
• Change in the way wage setters formed expectations due
to a change in the behaviour of the rate of inflation.
− The inflation rate became consistently positive and
− Inflation became more persistent.
Blanchard, Amighini and Giavazzi, Macroeconomics: A European Perspective PowerPoints on the Web, 2nd edition © Pearson Education Limited 2014
12.
10.2 The Phillips Curve (Continued)Slide
10.12
Mutations
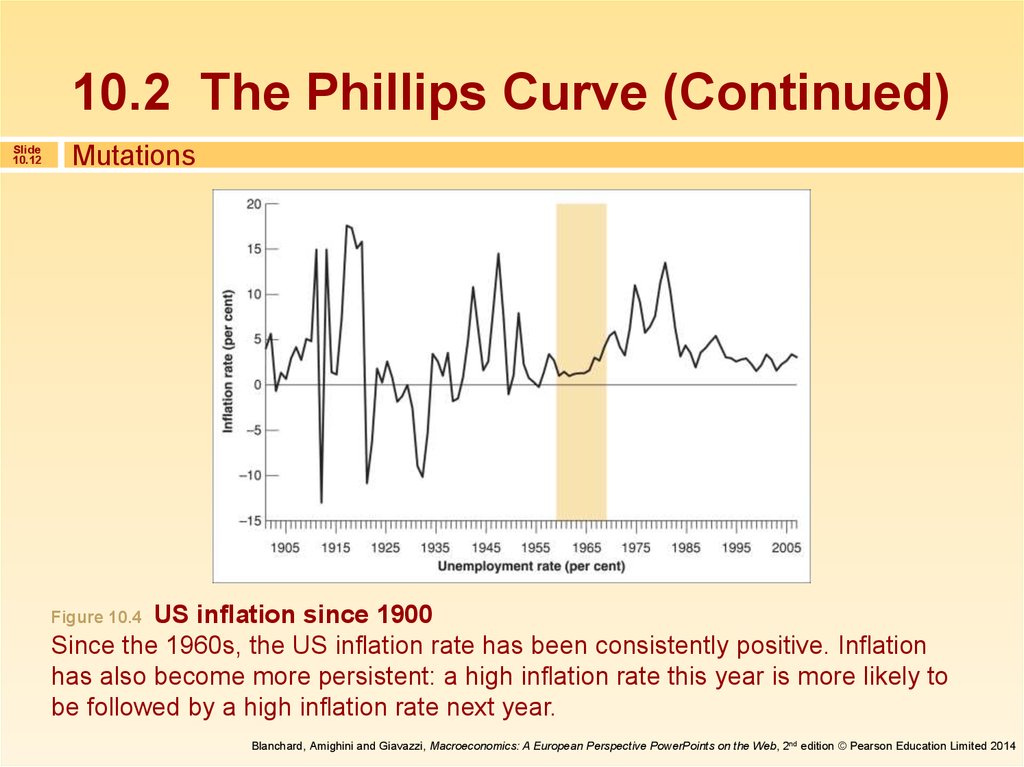
US inflation since 1900
Since the 1960s, the US inflation rate has been consistently positive. Inflation
has also become more persistent: a high inflation rate this year is more likely to
be followed by a high inflation rate next year.
Figure 10.4
Blanchard, Amighini and Giavazzi, Macroeconomics: A European Perspective PowerPoints on the Web, 2nd edition © Pearson Education Limited 2014
13.
10.2 The Phillips Curve (Continued)Slide
10.13
Mutations
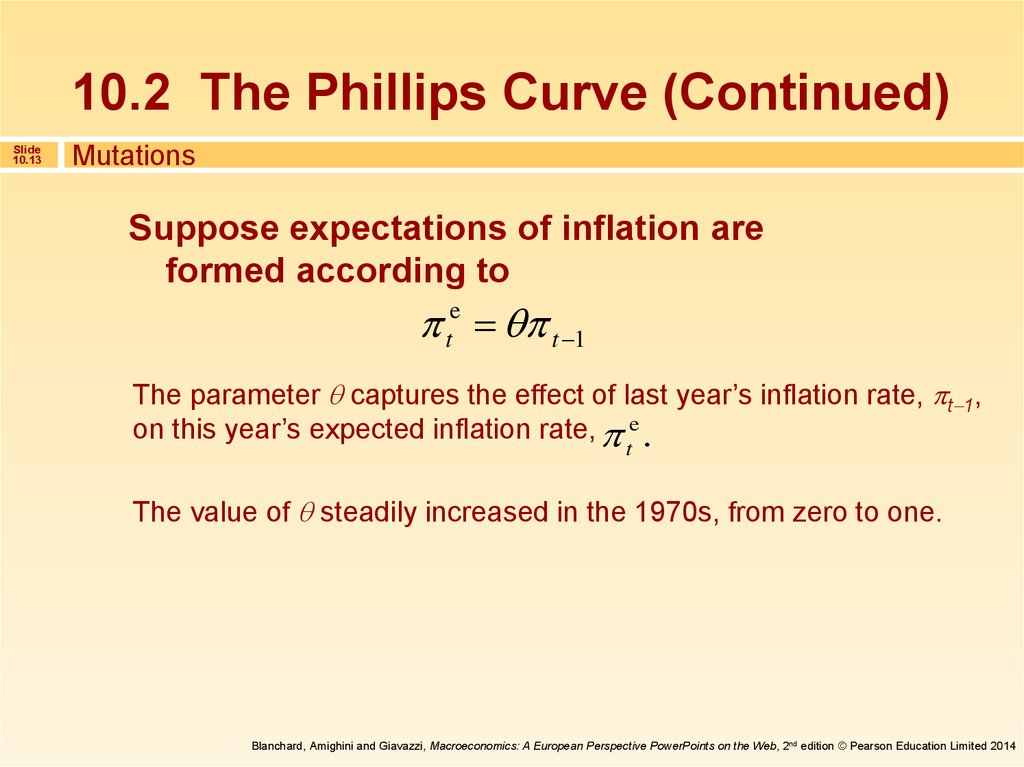
Suppose expectations of inflation are
formed according to
te t 1
The parameter captures the effect of last year’s inflation rate, t 1,
on this year’s expected inflation rate, e .
t
The value of steadily increased in the 1970s, from zero to one.
Blanchard, Amighini and Giavazzi, Macroeconomics: A European Perspective PowerPoints on the Web, 2nd edition © Pearson Education Limited 2014
14.
10.2 The Phillips Curve (Continued)Slide
10.14
Mutations
We can think of what happened in the 1970s as an
increase in the value of over time:
• As long as inflation was low and not very persistent, it was
reasonable for workers and firms to ignore past inflation
and to assume that the price level this year would be
roughly the same as the price level last year.
• But, as inflation became more persistent, workers and firms
started changing the ways they formed expectations.
Blanchard, Amighini and Giavazzi, Macroeconomics: A European Perspective PowerPoints on the Web, 2nd edition © Pearson Education Limited 2014
15.
10.2 The Phillips Curve (Continued)Slide
10.15
Mutations
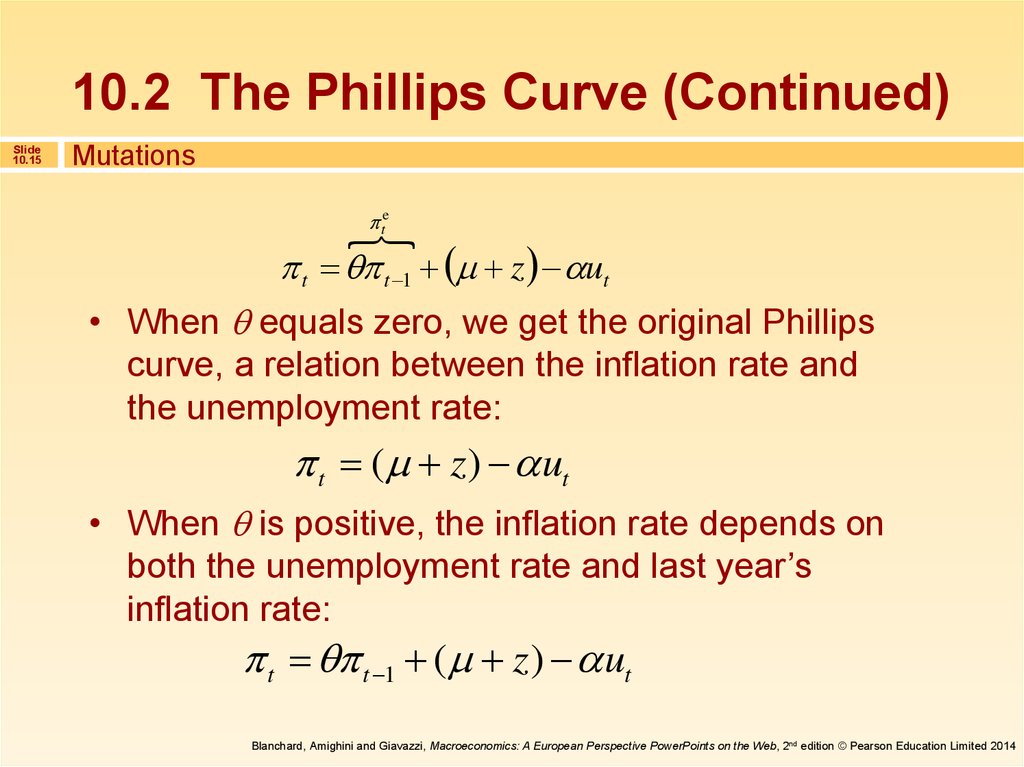
te
t t 1 z ut
• When equals zero, we get the original Phillips
curve, a relation between the inflation rate and
the unemployment rate:
t ( z ) ut
• When is positive, the inflation rate depends on
both the unemployment rate and last year’s
inflation rate:
t t 1 ( z ) ut
Blanchard, Amighini and Giavazzi, Macroeconomics: A European Perspective PowerPoints on the Web, 2nd edition © Pearson Education Limited 2014
16.
10.2 The Phillips Curve (Continued)Slide
10.16
Mutations
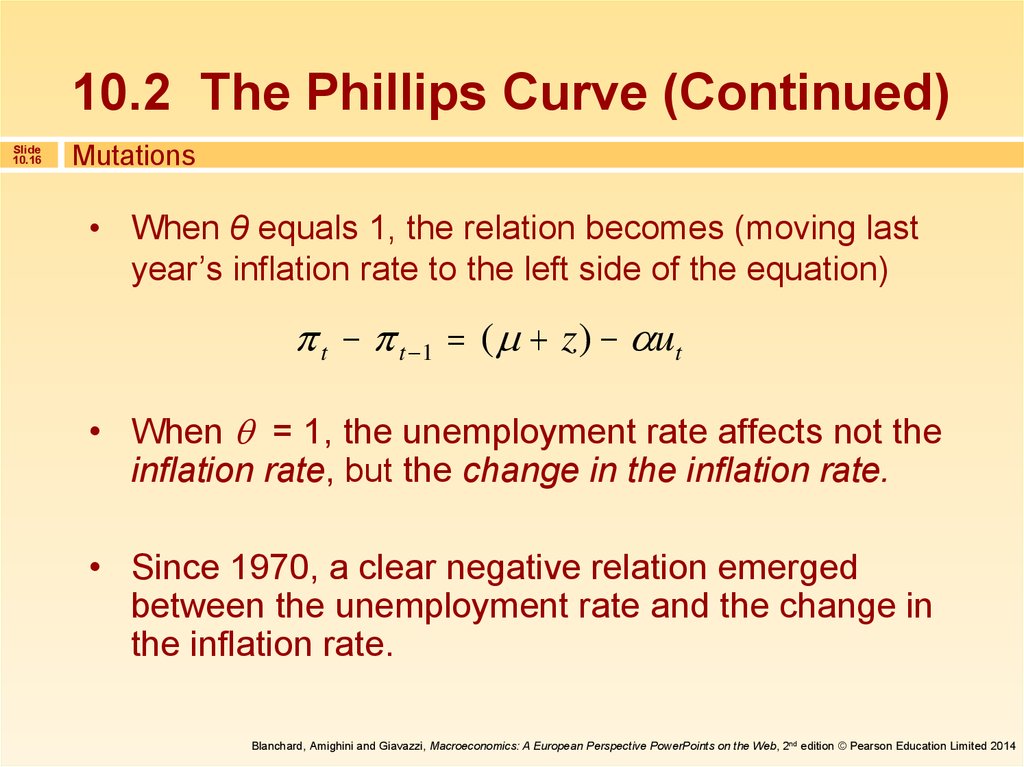
• When θ equals 1, the relation becomes (moving last
year’s inflation rate to the left side of the equation)
t t 1 ( z) ut
• When = 1, the unemployment rate affects not the
inflation rate, but the change in the inflation rate.
• Since 1970, a clear negative relation emerged
between the unemployment rate and the change in
the inflation rate.
Blanchard, Amighini and Giavazzi, Macroeconomics: A European Perspective PowerPoints on the Web, 2nd edition © Pearson Education Limited 2014
17.
10.2 The Phillips Curve (Continued)Slide
10.17
Mutations
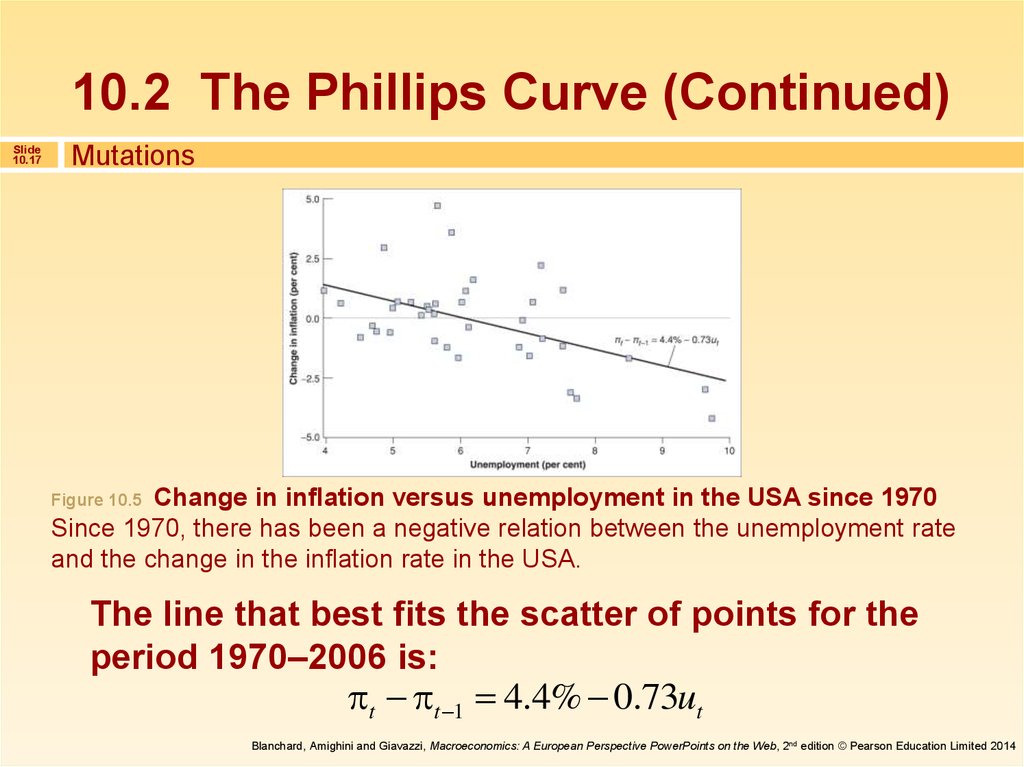
Change in inflation versus unemployment in the USA since 1970
Since 1970, there has been a negative relation between the unemployment rate
and the change in the inflation rate in the USA.
Figure 10.5
The line that best fits the scatter of points for the
period 1970–2006 is:
t t 1 4.4% 0.73ut
Blanchard, Amighini and Giavazzi, Macroeconomics: A European Perspective PowerPoints on the Web, 2nd edition © Pearson Education Limited 2014
18.
10.2 The Phillips Curve (Continued)Slide
10.18
Mutations
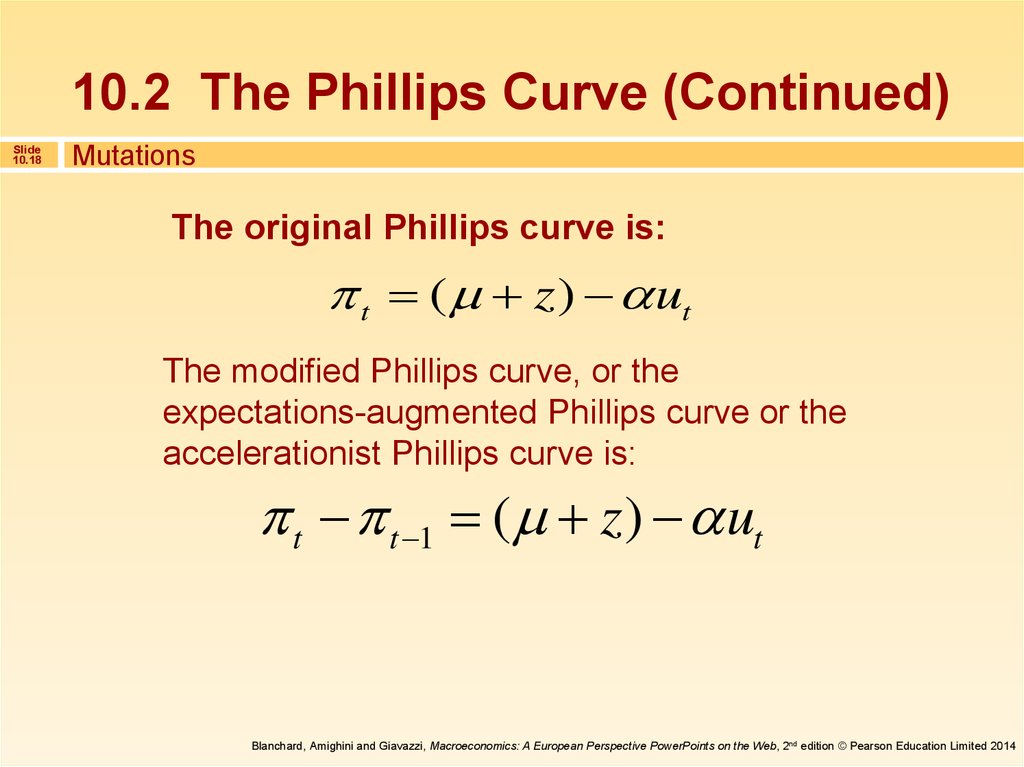
The original Phillips curve is:
t ( z ) ut
The modified Phillips curve, or the
expectations-augmented Phillips curve or the
accelerationist Phillips curve is:
t t 1 ( z ) ut
Blanchard, Amighini and Giavazzi, Macroeconomics: A European Perspective PowerPoints on the Web, 2nd edition © Pearson Education Limited 2014
19.
10.2 The Phillips Curve (Continued)Slide
10.19
Back to the natural rate of unemployment
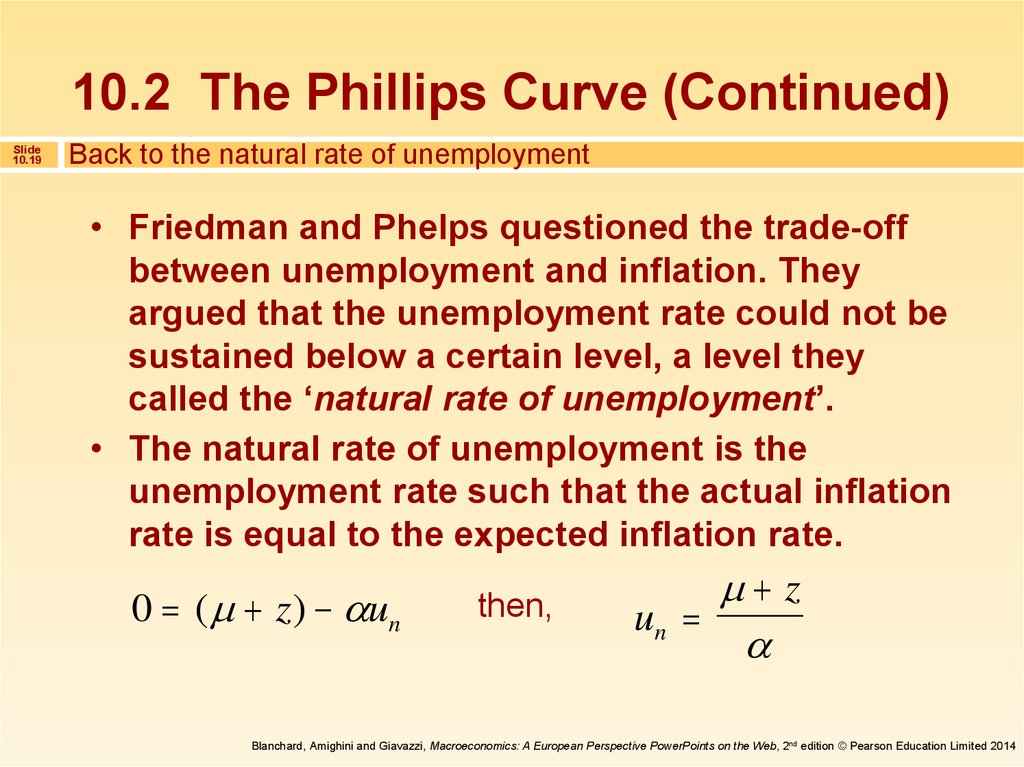
• Friedman and Phelps questioned the trade-off
between unemployment and inflation. They
argued that the unemployment rate could not be
sustained below a certain level, a level they
called the ‘natural rate of unemployment’.
• The natural rate of unemployment is the
unemployment rate such that the actual inflation
rate is equal to the expected inflation rate.
0 ( z) un
then,
z
un
Blanchard, Amighini and Giavazzi, Macroeconomics: A European Perspective PowerPoints on the Web, 2nd edition © Pearson Education Limited 2014
20.
10.2 The Phillips Curve (Continued)Slide
10.20
Back to the natural rate of unemployment
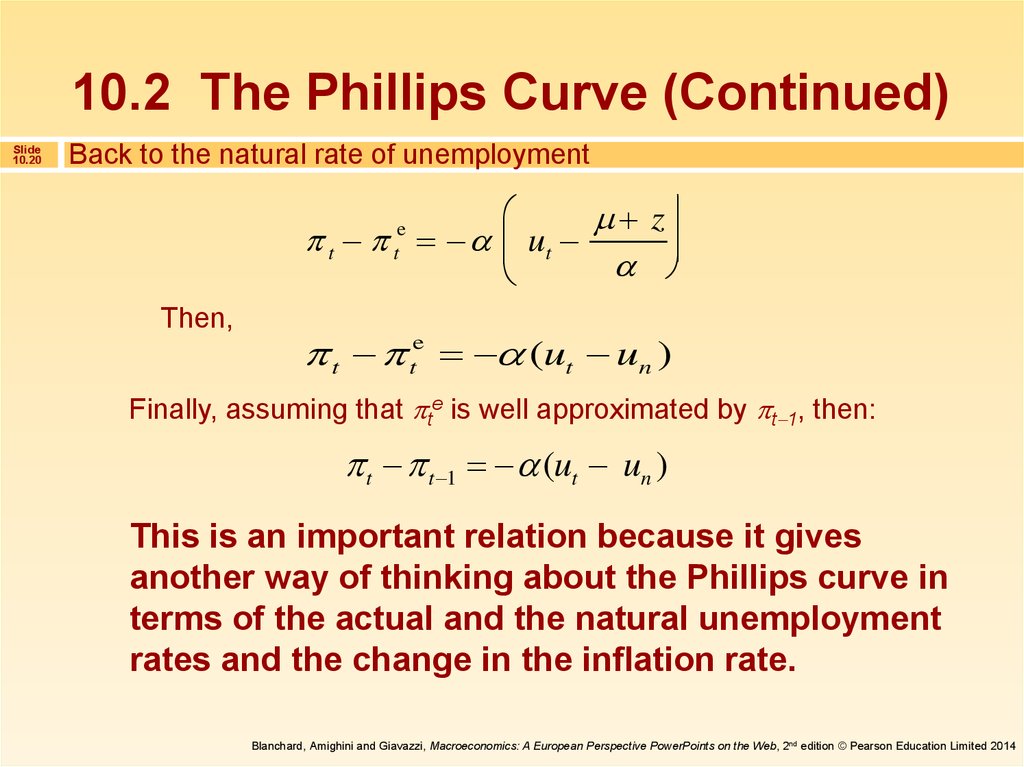
t
e
t
Then,
z
ut
t te (ut un )
Finally, assuming that te is well approximated by t 1, then:
t t 1 (ut un )
This is an important relation because it gives
another way of thinking about the Phillips curve in
terms of the actual and the natural unemployment
rates and the change in the inflation rate.
Blanchard, Amighini and Giavazzi, Macroeconomics: A European Perspective PowerPoints on the Web, 2nd edition © Pearson Education Limited 2014
21.
10.2 The Phillips Curve (Continued)Slide
10.21
Back to the natural rate of unemployment
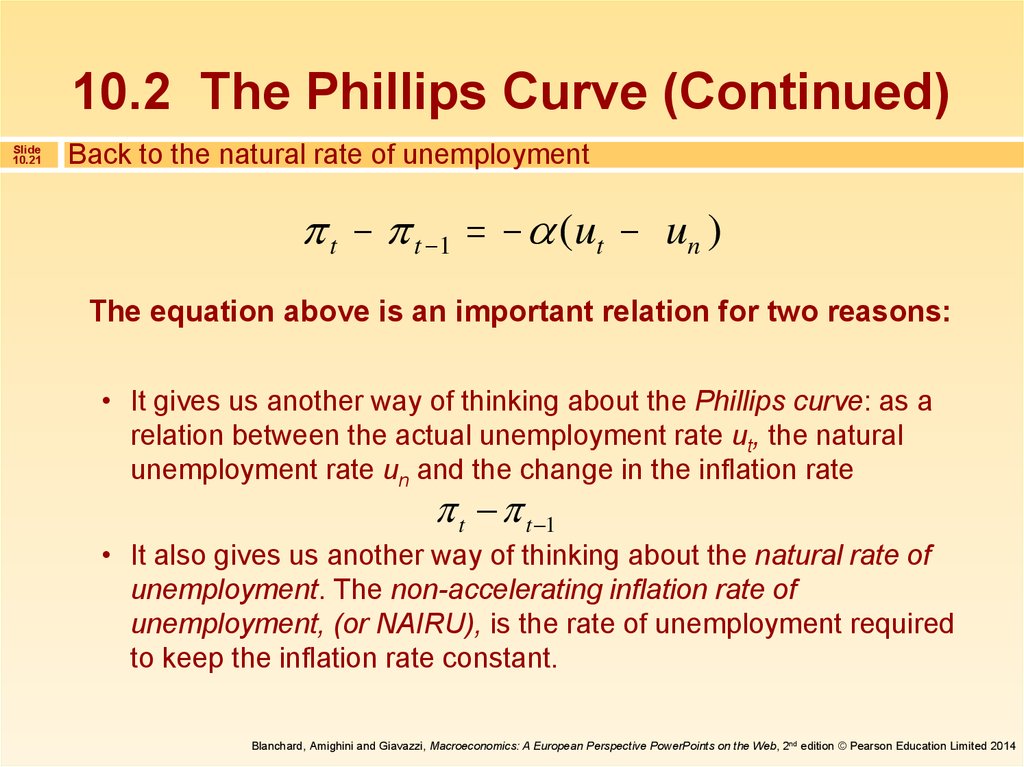
t t 1 (ut un )
The equation above is an important relation for two reasons:
• It gives us another way of thinking about the Phillips curve: as a
relation between the actual unemployment rate ut, the natural
unemployment rate un and the change in the inflation rate
t t 1
• It also gives us another way of thinking about the natural rate of
unemployment. The non-accelerating inflation rate of
unemployment, (or NAIRU), is the rate of unemployment required
to keep the inflation rate constant.
Blanchard, Amighini and Giavazzi, Macroeconomics: A European Perspective PowerPoints on the Web, 2nd edition © Pearson Education Limited 2014
22.
10.2 The Phillips Curve (Continued)Slide
10.22
A summary and many warnings
Let’s summarize what we have learned so far:
• When the unemployment rate exceeds the natural
rate of unemployment, the inflation rate decreases.
When the unemployment rate is below the natural
rate of unemployment, the inflation rate increases.
Blanchard, Amighini and Giavazzi, Macroeconomics: A European Perspective PowerPoints on the Web, 2nd edition © Pearson Education Limited 2014
23. 10.3 The Phillips Curve and the Natural Rate of Unemployment in Europe
Slide10.23
Variations in the natural rate across countries
z
un
The factors that affect the natural rate of
unemployment above differ across countries.
Therefore, there is no reason to expect all countries
to have the same natural rate of unemployment.
Blanchard, Amighini and Giavazzi, Macroeconomics: A European Perspective PowerPoints on the Web, 2nd edition © Pearson Education Limited 2014
24.
10.3 The Phillips Curve and the Natural Rateof Unemployment in Europe (Continued)
Slide
10.24
t t 1 ( z) ut
• In the equation above, the terms and z may
not be constant but, in fact, vary over time,
leading to changes in the natural rate of
unemployment.
• In Europe, the natural unemployment rate has
increased a lot since the 1960s. In the United
States, the natural unemployment rate
increased by 1–2% from the 1960s to the 1980s,
and appears to have decreased since then.
Blanchard, Amighini and Giavazzi, Macroeconomics: A European Perspective PowerPoints on the Web, 2nd edition © Pearson Education Limited 2014
25.
10.3 The Phillips Curve and the Natural Rateof Unemployment in Europe (Continued)
Slide
10.25
What explains European unemployment?
Labour market rigidities:
• A generous system of unemployment insurance
• A high degree of employment protection
• Minimum wages
• Bargaining rules
Blanchard, Amighini and Giavazzi, Macroeconomics: A European Perspective PowerPoints on the Web, 2nd edition © Pearson Education Limited 2014
26.
10.3 The Phillips Curve and the Natural Rateof Unemployment in Europe (Continued)
Slide
10.26
High inflation and the Phillips curve relation
• The relation between unemployment and inflation is
likely to change with the level and the persistence
of inflation.
• When inflation is high, it is also more variable.
• The form of wage agreements also changes with
the level of inflation. Wage indexation, a rule that
automatically increases wages in line with inflation,
becomes more prevalent when inflation is high.
Blanchard, Amighini and Giavazzi, Macroeconomics: A European Perspective PowerPoints on the Web, 2nd edition © Pearson Education Limited 2014
27.
10.3 The Phillips Curve and the Natural Rateof Unemployment in Europe (Continued)
Slide
10.27
High inflation and the Phillips curve relation
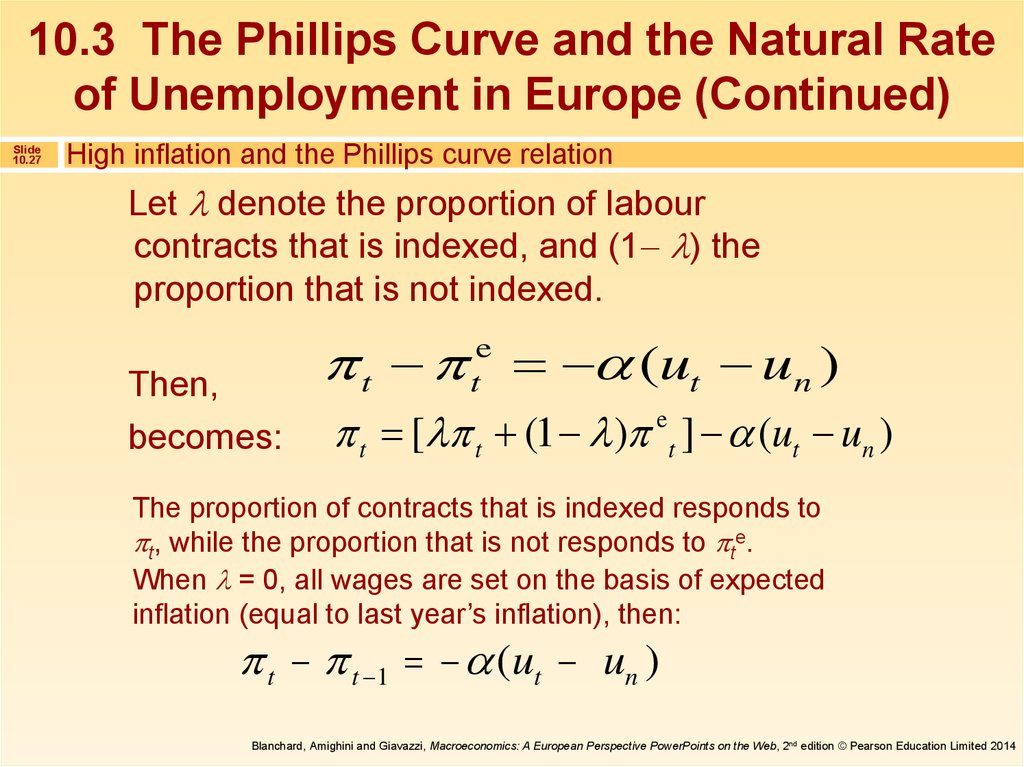
Let denote the proportion of labour
contracts that is indexed, and (1 ) the
proportion that is not indexed.
Then,
becomes:
t (ut un )
e
t
t [ t (1 ) et ] (ut un )
The proportion of contracts that is indexed responds to
t, while the proportion that is not responds to te.
When = 0, all wages are set on the basis of expected
inflation (equal to last year’s inflation), then:
t t 1 (ut un )
Blanchard, Amighini and Giavazzi, Macroeconomics: A European Perspective PowerPoints on the Web, 2nd edition © Pearson Education Limited 2014
28.
10.3 The Phillips Curve and the Natural Rateof Unemployment in Europe (Continued)
Slide
10.28
High inflation and the Phillips curve relation
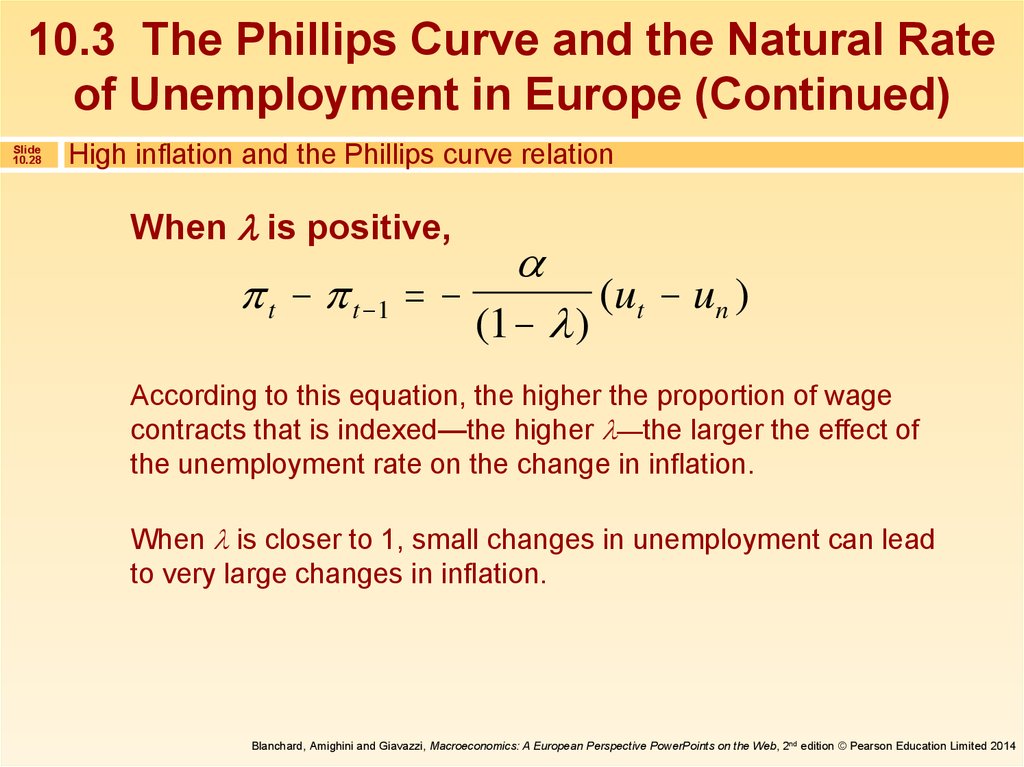
When is positive,
t t 1
(1 )
(ut un )
According to this equation, the higher the proportion of wage
contracts that is indexed—the higher —the larger the effect of
the unemployment rate on the change in inflation.
When is closer to 1, small changes in unemployment can lead
to very large changes in inflation.
Blanchard, Amighini and Giavazzi, Macroeconomics: A European Perspective PowerPoints on the Web, 2nd edition © Pearson Education Limited 2014