


 Экология
Похожие презентации:


")


Global Warming 20 Years Later: Tipping Points Near
1.
Global Warming 20 Years Later:Tipping Points Near
Jim Hansen
23 June 2008
National Press Club, and
House Select Committee on
Energy Independence & Global Warming
Washington, DC
2.
1988 Testimony: Conclusions1. Earth is warmer in 1988 than at any time in
the history of instrumental measurements
2. Global warming is now large enough that
we can ascribe with a high degree of
confidence a cause and effect relationship
to the greenhouse effect
3. Greenhouse effect is already large enough
to effect the probability of extreme events
such as summer heat waves
3.
4.
5.
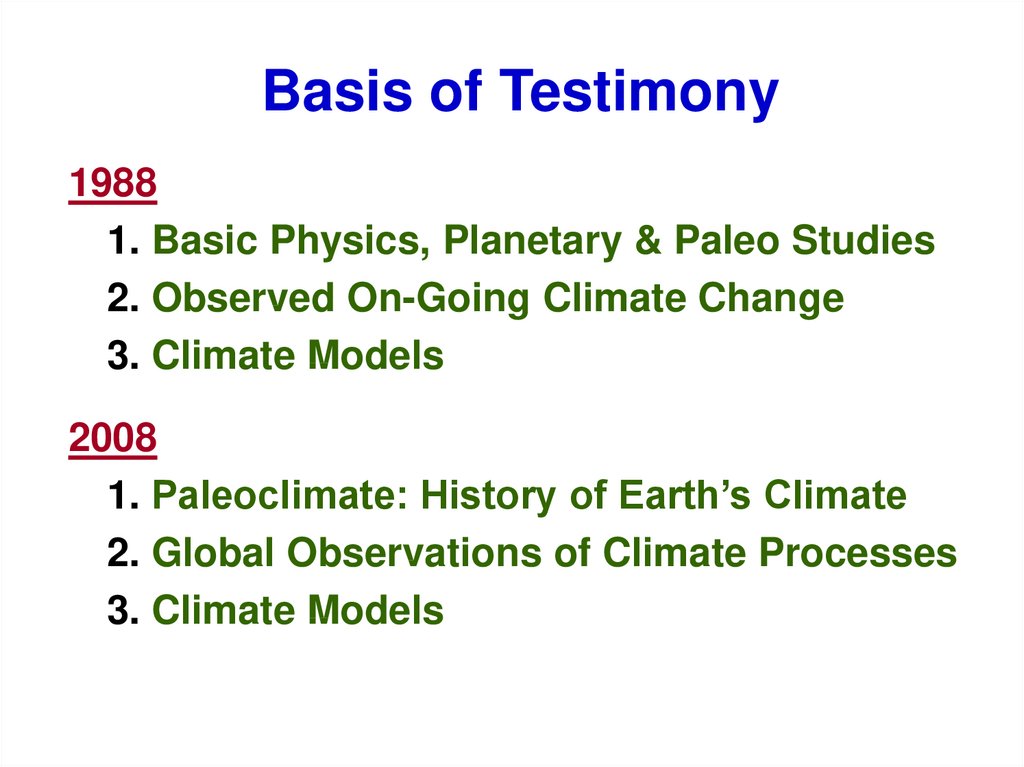
Basis of Testimony1988
1. Basic Physics, Planetary & Paleo Studies
2. Observed On-Going Climate Change
3. Climate Models
2008
1. Paleoclimate: History of Earth’s Climate
2. Global Observations of Climate Processes
3. Climate Models
6.
Major Flaws in 1988 TestimonyDid Not Emphasize Warming vs Chaos
- Weather Variations >> Climate Trend
- Small Change of Mean Has Big Effects
Did Not Emphasize That Global Warming
Enhances Both Extremes of Water Cycle
- More Intense Droughts, Heat Waves, Fires
- Heavier Rainfall, Greater Floods, Stronger
Storms Driven by Latent Heat (Thunder
Storms, Tornados, Tropical Storms)
7.
8.
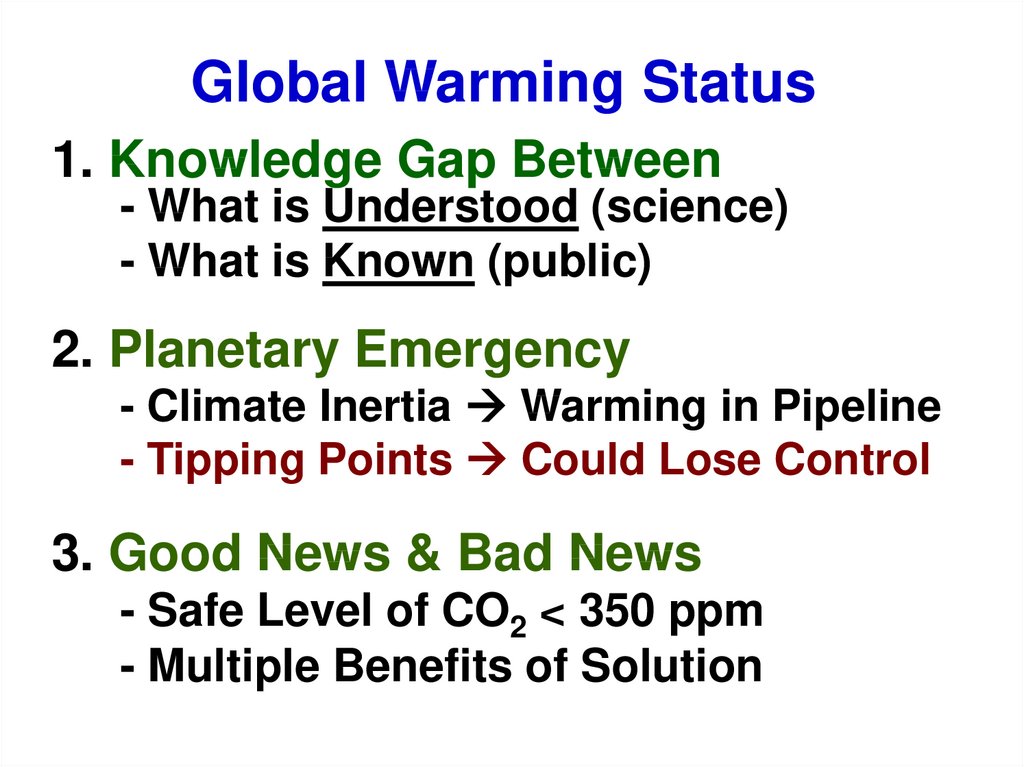
Global Warming Status1. Knowledge Gap Between
- What is Understood (science)
- What is Known (public)
2. Planetary Emergency
- Climate Inertia Warming in Pipeline
- Tipping Points Could Lose Control
3. Good News & Bad News
- Safe Level of CO2 < 350 ppm
- Multiple Benefits of Solution
9.
United NationsFramework Convention on Climate Change
Aim is to stabilize greenhouse gas emissions…
“…at a level that would prevent
dangerous anthropogenic interference
with the climate system.”
10.
Metrics for “Dangerous” ChangeExtermination of Animal & Plant Species
1. Extinction of Polar and Alpine Species
2. Unsustainable Migration Rates
Ice Sheet Disintegration: Global Sea Level
1. Long-Term Change from Paleoclimate Data
2. Ice Sheet Response Time
Regional Climate Disruptions
1. Increase of Extreme Events
2. Shifting Zones/Freshwater Shortages
11.
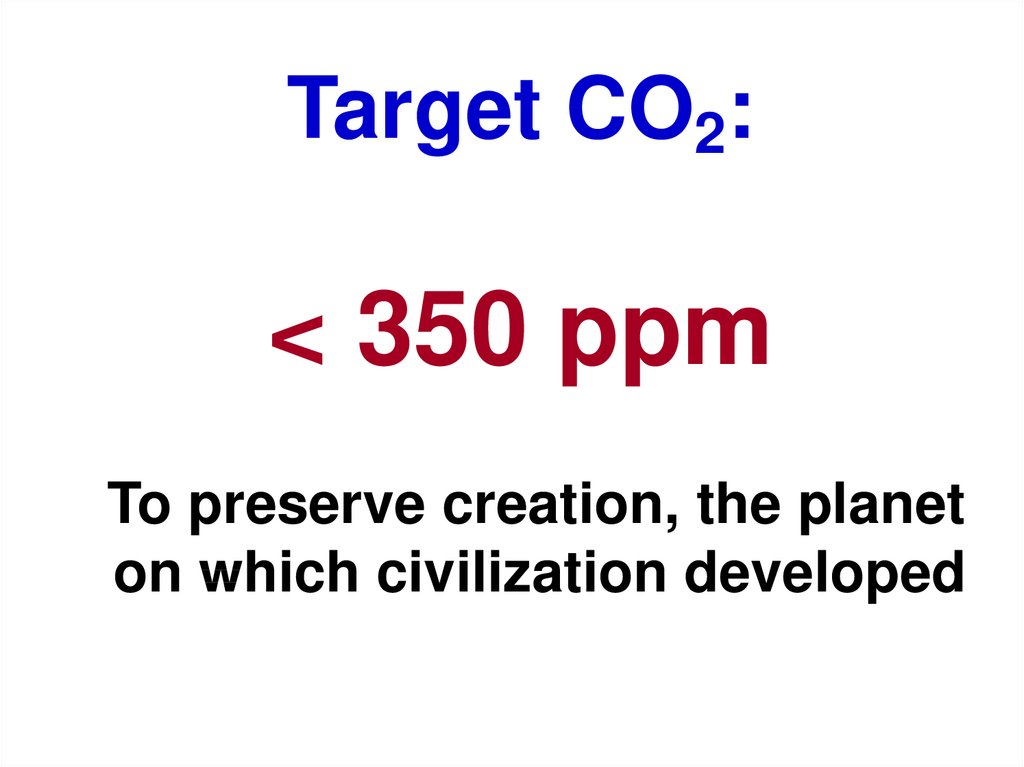
Target CO2:< 350 ppm
To preserve creation, the planet
on which civilization developed
12.
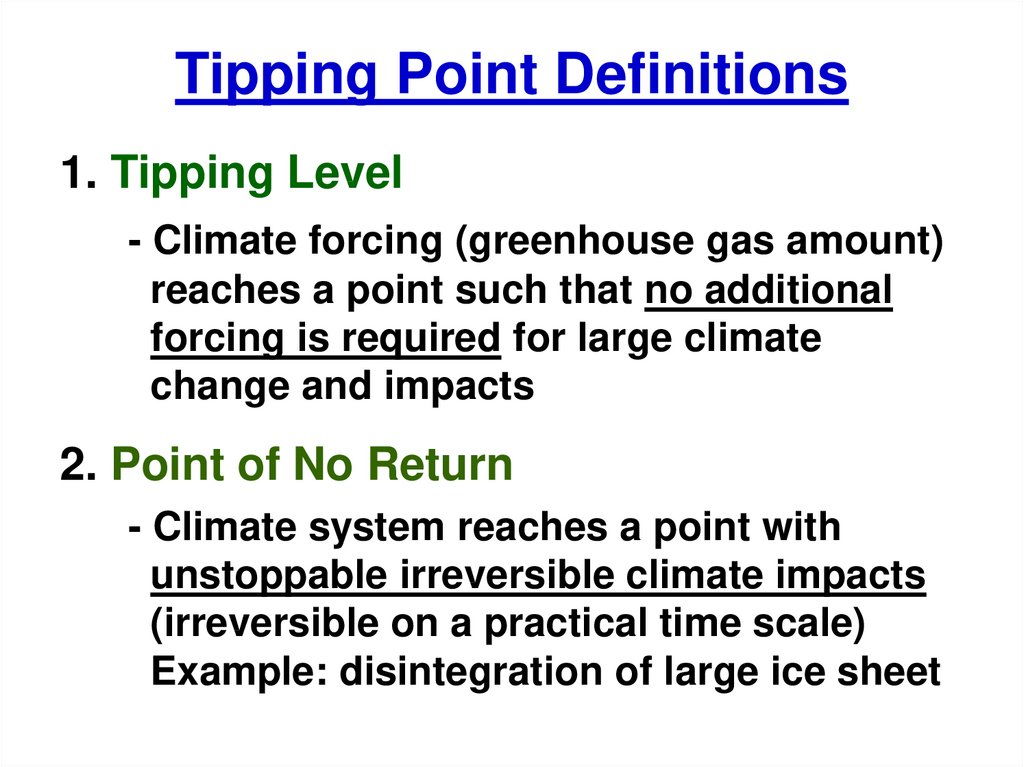
Tipping Point Definitions1. Tipping Level
- Climate forcing (greenhouse gas amount)
reaches a point such that no additional
forcing is required for large climate
change and impacts
2. Point of No Return
- Climate system reaches a point with
unstoppable irreversible climate impacts
(irreversible on a practical time scale)
Example: disintegration of large ice sheet
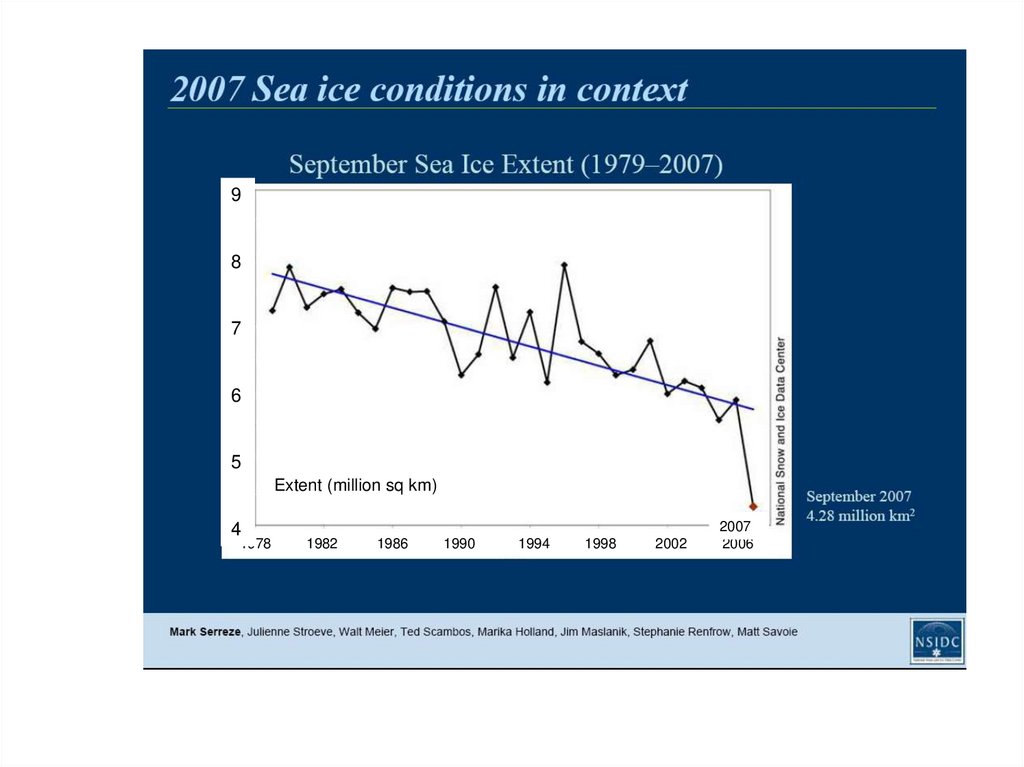
13.
98
7
6
5
Extent (million sq km)
4
1978
1982
1986
1990
1994
1998
2002
2007
2006
14.
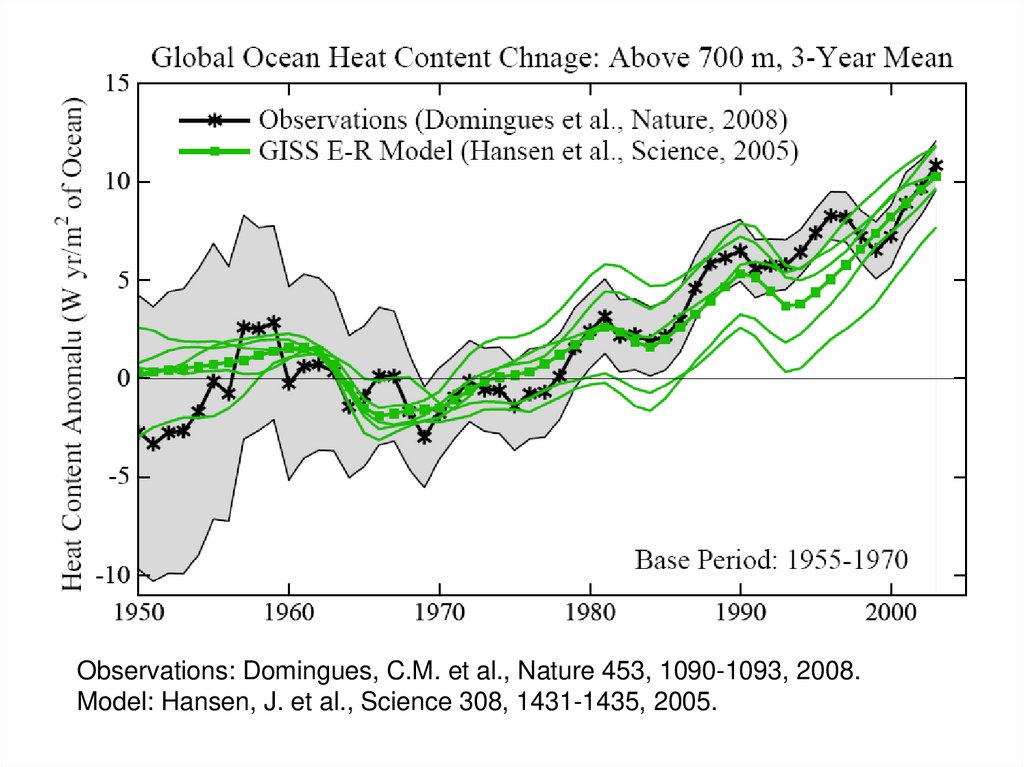
15.
Observations: Domingues, C.M. et al., Nature 453, 1090-1093, 2008.Model: Hansen, J. et al., Science 308, 1431-1435, 2005.
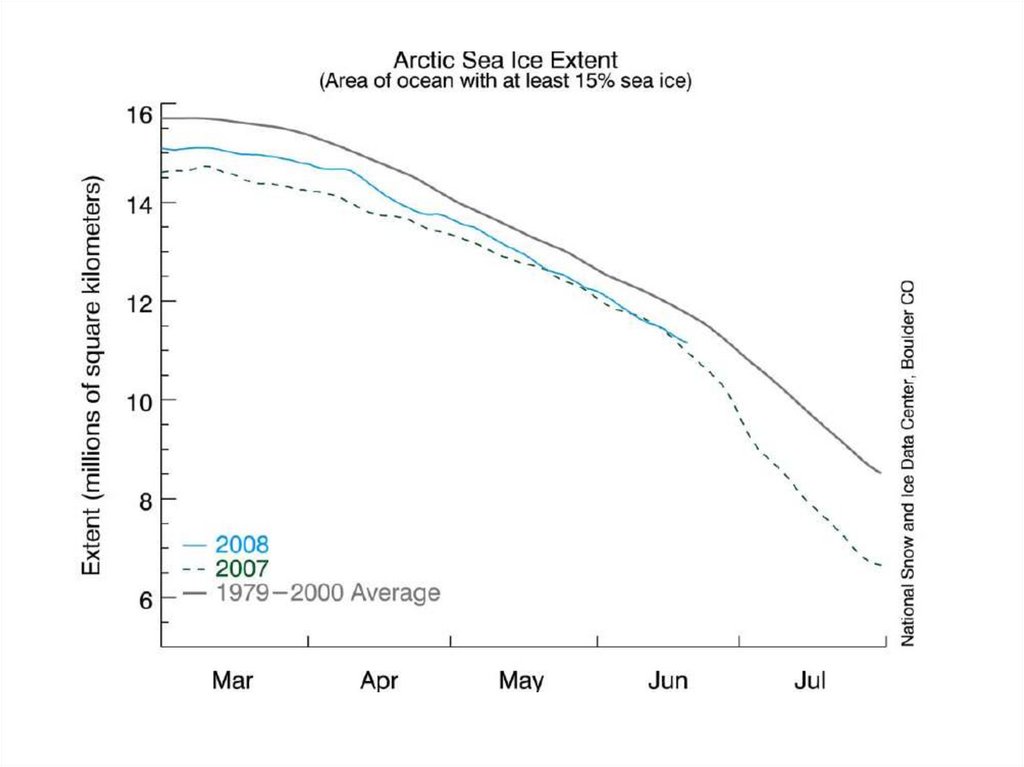
16. Arctic Sea Ice Criterion*
1. Restore Planetary Energy BalanceCO2: 385 ppm 325-355 ppm
2. Restore Sea Ice: Aim for -0.5 W/m2
CO2: 385 ppm 300-325 ppm
Range based on uncertainty in present planetary
energy imbalance (between 0.5 and 1 W/m2)
*Assuming near-balance among non-CO
2
forcings
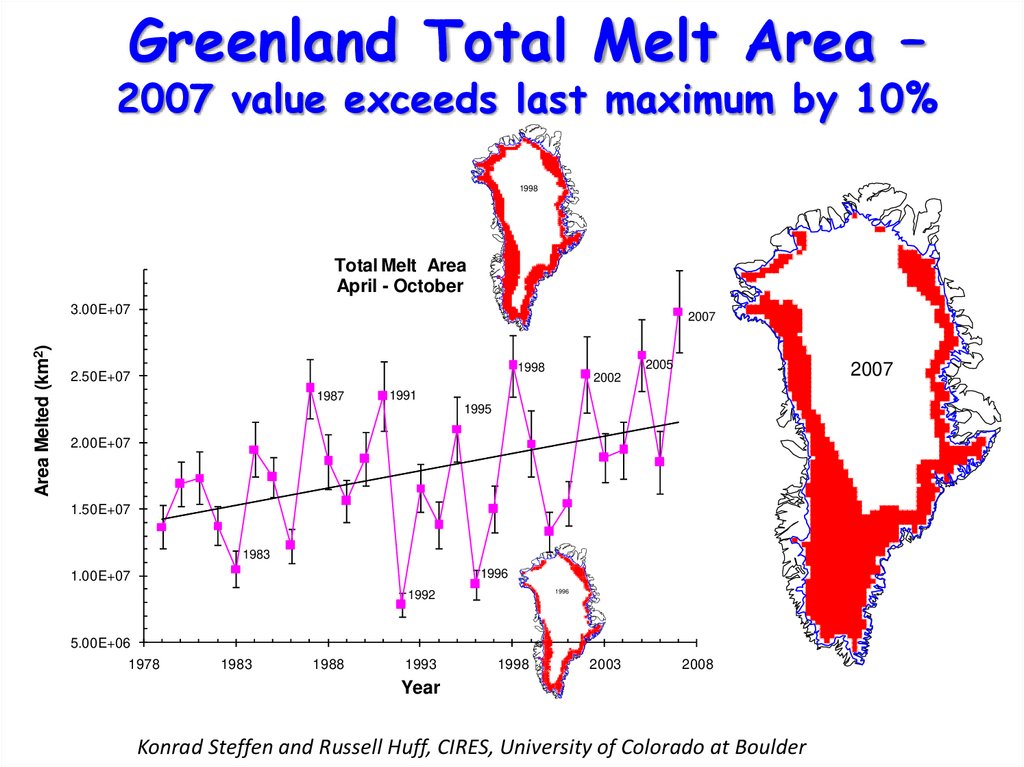
17.
Greenland Total Melt Area –2007 value exceeds last maximum by 10%
1998
Total Melt Area
April - October
Area Melted (km2)
3.00E+07
2007
2005
1998
2.50E+07
1987
2007
2002
1991
1995
2.00E+07
1.50E+07
1983
1996
1.00E+07
1996
1992
5.00E+06
1978
1983
1988
1993
1998
2003
2008
Year
Konrad Steffen and Russell Huff, CIRES, University of Colorado at Boulder
18.
Surface Melt on GreenlandMelt descending
into a moulin,
a vertical shaft
carrying water
to ice sheet base.
Source: Roger Braithwaite,
University of Manchester (UK)
19.
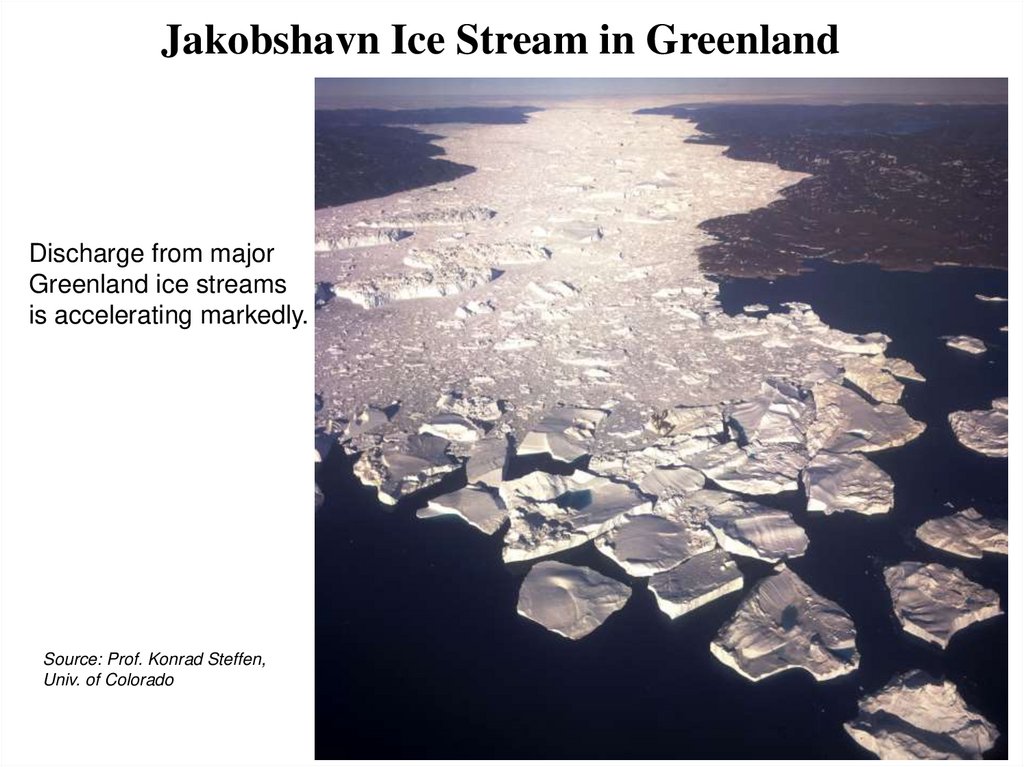
Jakobshavn Ice Stream in GreenlandDischarge from major
Greenland ice streams
is accelerating markedly.
Source: Prof. Konrad Steffen,
Univ. of Colorado
20.
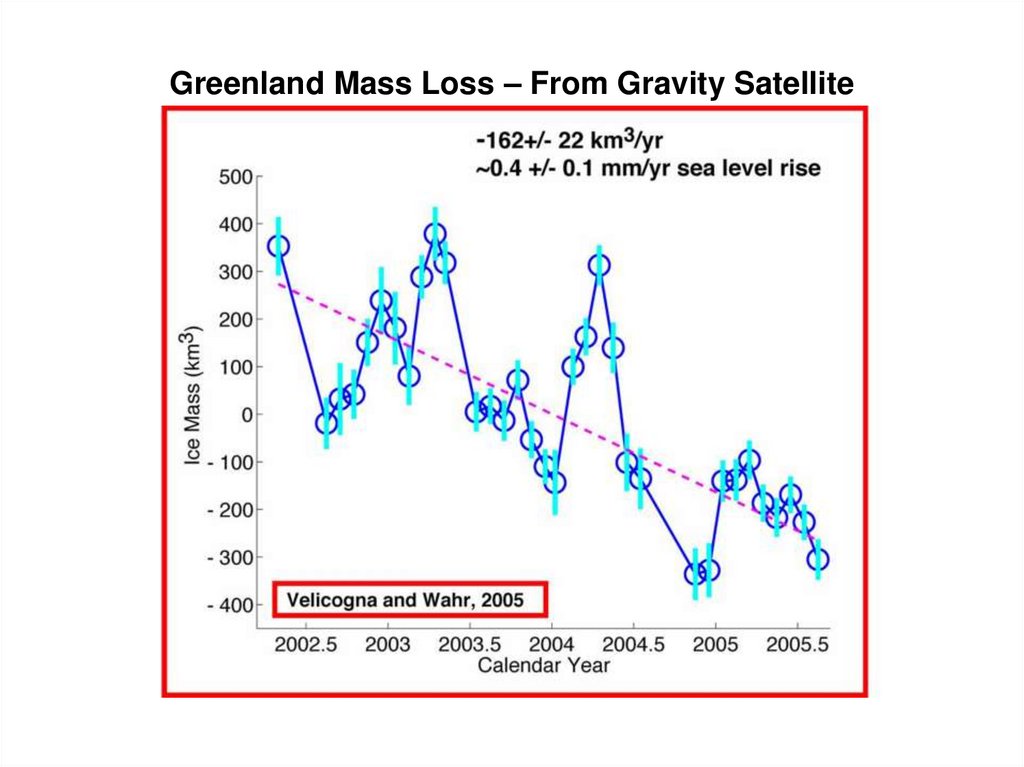
Greenland Mass Loss – From Gravity Satellite21.
22. Sea Level Criterion*
1. Prior Interglacial PeriodsCO2 <~ 300 ppm
2. Cenozoic Era
CO2 <~ 300 ppm
3. Ice Sheet Observations
CO2 < 385 ppm
*Assuming near-balance among non-CO
2
forcings
23.
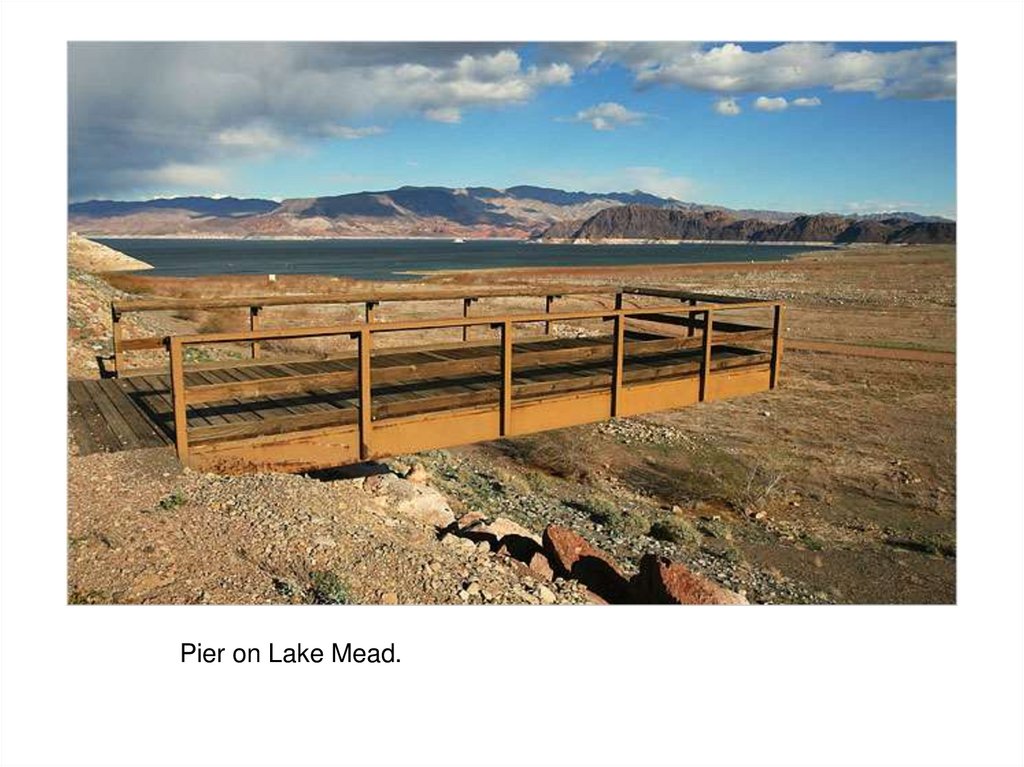
Pier on Lake Mead.24. Rongbuk Glacier
Rongbuk glacier in 1968 (top) and 2007. The largest glacieron Mount Everest’s northern slopes feeds Rongbuk River.
25.
Ice Loss1973-1998
Black bar: ice loss in 1973-1998. Curve:years until ice gone, at that loss rate.
Paul, F. et al., Geophys. Res. Lett. 31, L21402, 2004.
26.
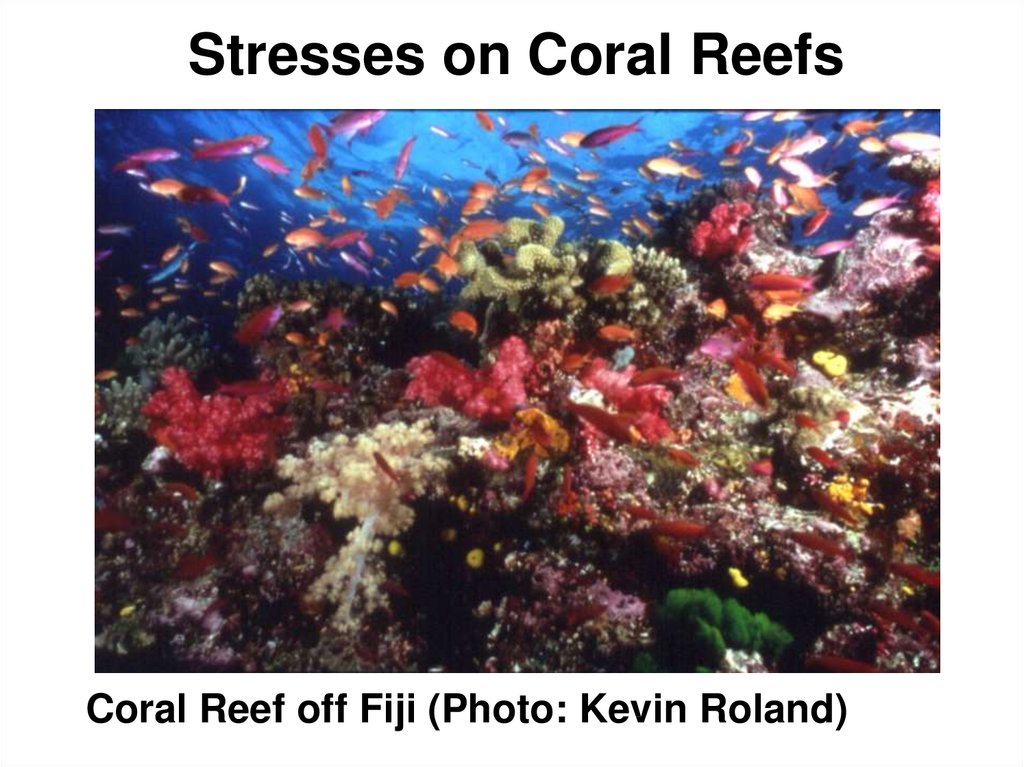
Stresses on Coral ReefsCoral Reef off Fiji (Photo: Kevin Roland)
27.
Assessment of Target CO2Phenomenon
Target CO2 (ppm)
1. Arctic Sea Ice
300-325
2. Ice Sheets/Sea Level
300-350
3. Shifting Climatic Zones
300-350
4. Alpine Water Supplies
300-350
5. Avoid Ocean Acidification
300-350
Initial Target CO2 = 350* ppm
*assumes CH4, O3, Black Soot decrease
28.
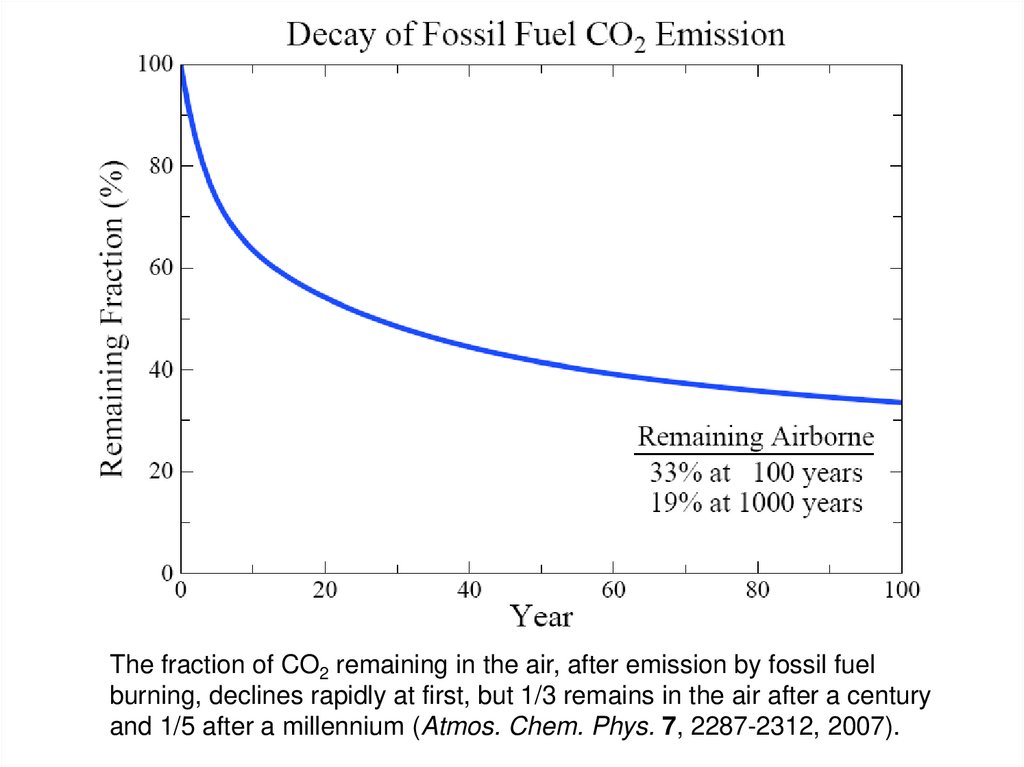
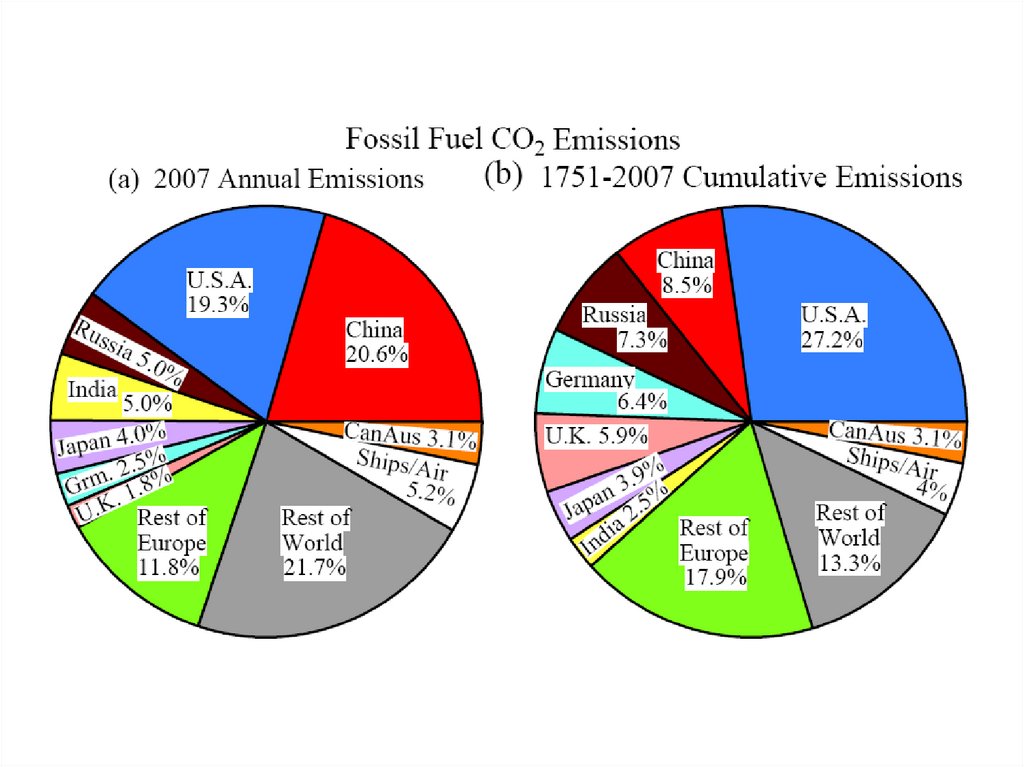
The fraction of CO2 remaining in the air, after emission by fossil fuelburning, declines rapidly at first, but 1/3 remains in the air after a century
and 1/5 after a millennium (Atmos. Chem. Phys. 7, 2287-2312, 2007).
29.
30. Initial Target CO2: 350 ppm
Technically Feasible(but not if business-as-usual continues)
Quick Coal Phase-Out Critical
(long lifetime of atmospheric CO2)
(must halt construction of any new coal
plants that do not capture & store CO2)
31. “Free Will” Alternative
1. Phase Out Coal CO2 Emissions- by 2025/2030 developed/developing countries
2. Rising Carbon Price
- discourages unconventional fossil fuels &
extraction of every last drop of oil (Arctic, etc.)
3. Soil & Biosphere CO2 Sequestration
- improved farming & forestry practices
4. Reduce non-CO2 Forcings
- reduce CH4, O3, trace gases, black soot
32. Carbon Tax & 100% Dividend
Carbon Tax & 100% Dividend1. Tax Large & Growing (but get it in place!)
- tap efficiency potential & life style choices
2. Entire Tax Returned
- equal monthly deposits in bank accounts
3. Limited Government Role
- keep hands off money!
- eliminate fossil subsidies
- let marketplace choose winners
- change profit motivation of utilities
- watch U.S. modernize & emissions fall!
33. Key Elements in Transformation
Low-Loss Electric GridClean Energy by 2020 (West) & 2030
Allows Renewable Energy Ascendancy
Carbon Tax and 100% Dividend
Tax at First Sale of Coal/Oil/Gas
Tax Can Rise & Spur Transformations
“100% or Fight! No Alligator-Shoes!”
34.
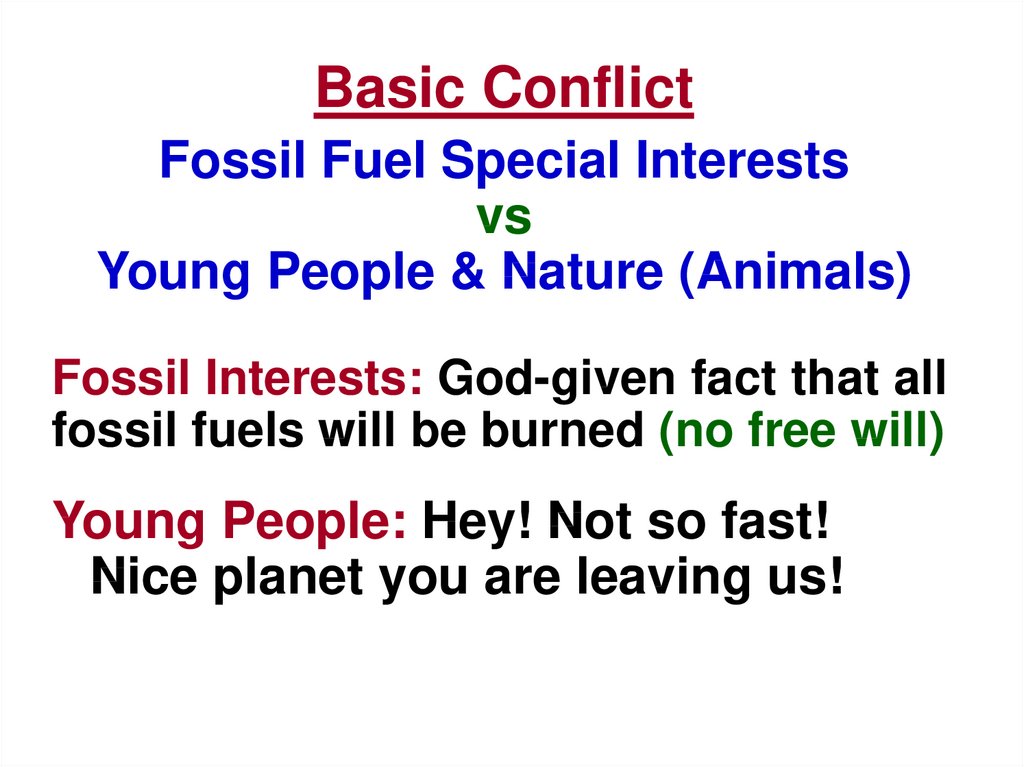
Basic ConflictFossil Fuel Special Interests
vs
Young People & Nature (Animals)
Fossil Interests: God-given fact that all
fossil fuels will be burned (no free will)
Young People: Hey! Not so fast!
Nice planet you are leaving us!
35. What are the Odds?
Fossil Interests: have influence incapitals world-wide
Young People: need to organize, enlist
others (parents, e.g.), impact elections
Animals: not much help (don’t vote, don’t
talk)
36. The Challenge
We can avoid destroying creation!(+cleaner planet, + good jobs!)
We have to figure out how to live
without fossil fuels someday…
Why not now?
37.
Web Sitewww.columbia.edu/~jeh1
includes
Global Warming Twenty Years Later:
Tipping Points Near (today’s statement)
Target Atmospheric CO2: Where Should
Humanity Aim?
38.
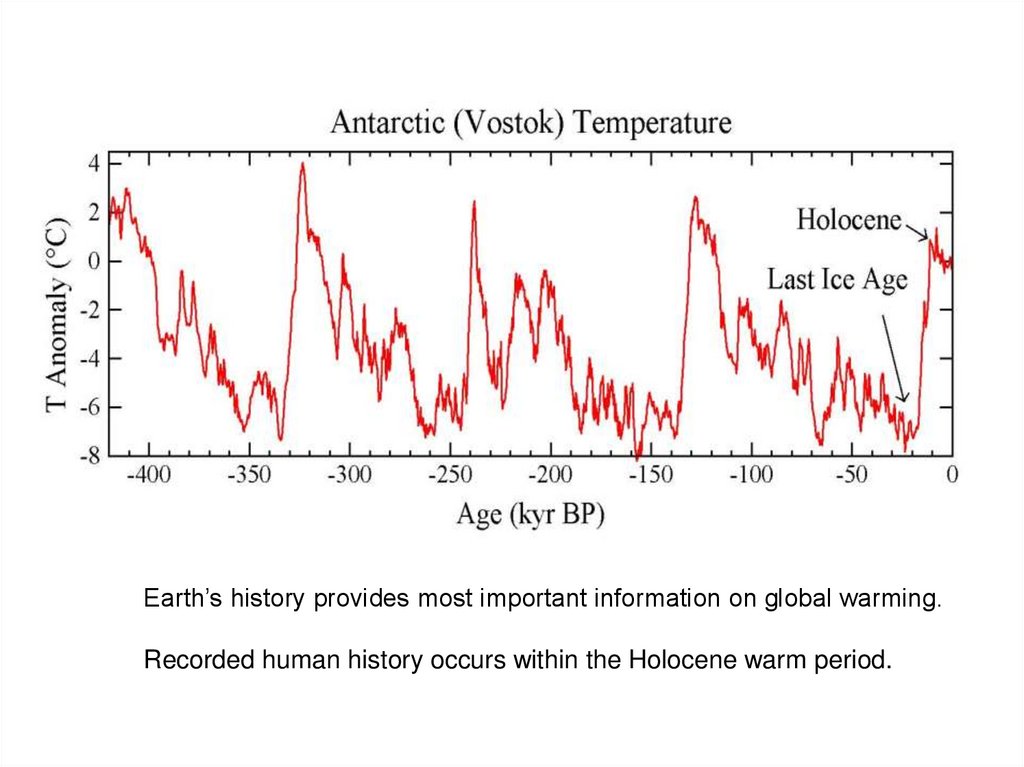
Earth’s history provides most important information on global warming.Recorded human history occurs within the Holocene warm period.
39.
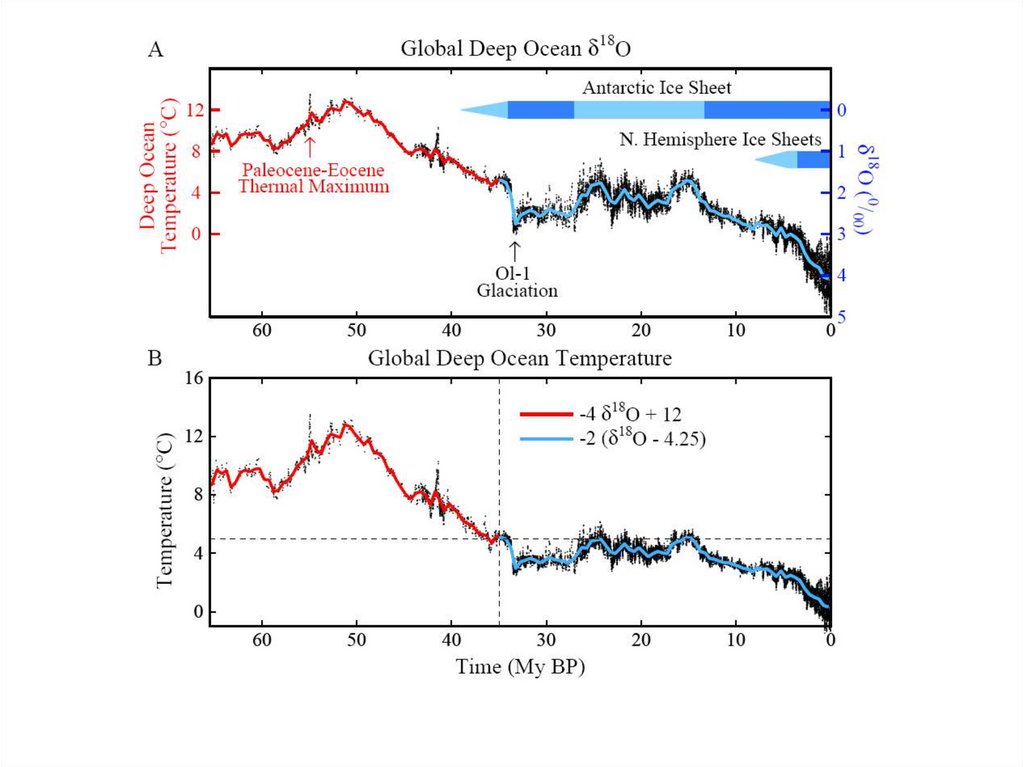
40. Cenozoic Era
65 Million Years AgoGlobal Climate Forcings
External (solar irradiance): +1 W/m2
Surface (continent locations): ~1 W/m2
Atmosphere (CO2 changes): > 10 W/m2
Present Day
41.
42.
Summary: Cenozoic Era1. Dominant Forcing: Natural ΔCO2
- Rate ~100 ppm/My (0.0001 ppm/year)
- Human-made rate today: ~2 ppm/year
Humans Overwhelm Slow Geologic Changes
2. Climate Sensitivity High
- Antarctic ice forms if CO2 < ~450 ppm
- Ice sheet formation reversible
Humans Could Produce “A Different Planet”