


 Экономика
Похожие презентации:


The Market Forces of Supply and Demand
1.
The Market Forces of Supplyand Demand
Chapter 4
2.
The Market Forces ofSupply and Demand
Supply and demand are the two words
that economists use most often.
Supply and demand are the forces that
make market economies work.
Modern microeconomics is about
supply, demand, and market
equilibrium.
3.
MarketsA market is a group of buyers and
sellers of a particular good or service.
The terms supply and demand refer to
the behavior of people . . . as they
interact with one another in markets.
4.
MarketsBuyers determine demand.
Sellers determine
supply.
5.
Market Type:A Competitive Market
A competitive market is a market. . .
with many buyers and sellers.
that is not controlled by any one person.
in which a narrow range of prices are established that buyers and sellers act
upon.
6.
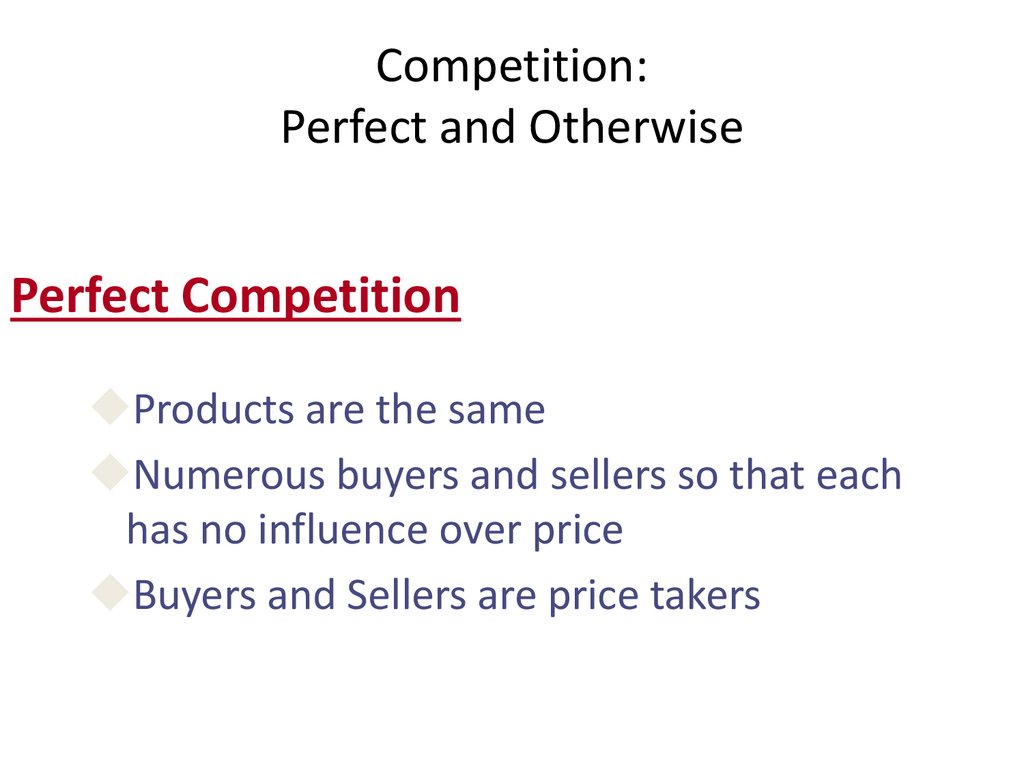
Competition:Perfect and Otherwise
Perfect Competition
Products are the same
Numerous buyers and sellers so that each
has no influence over price
Buyers and Sellers are price takers
7.
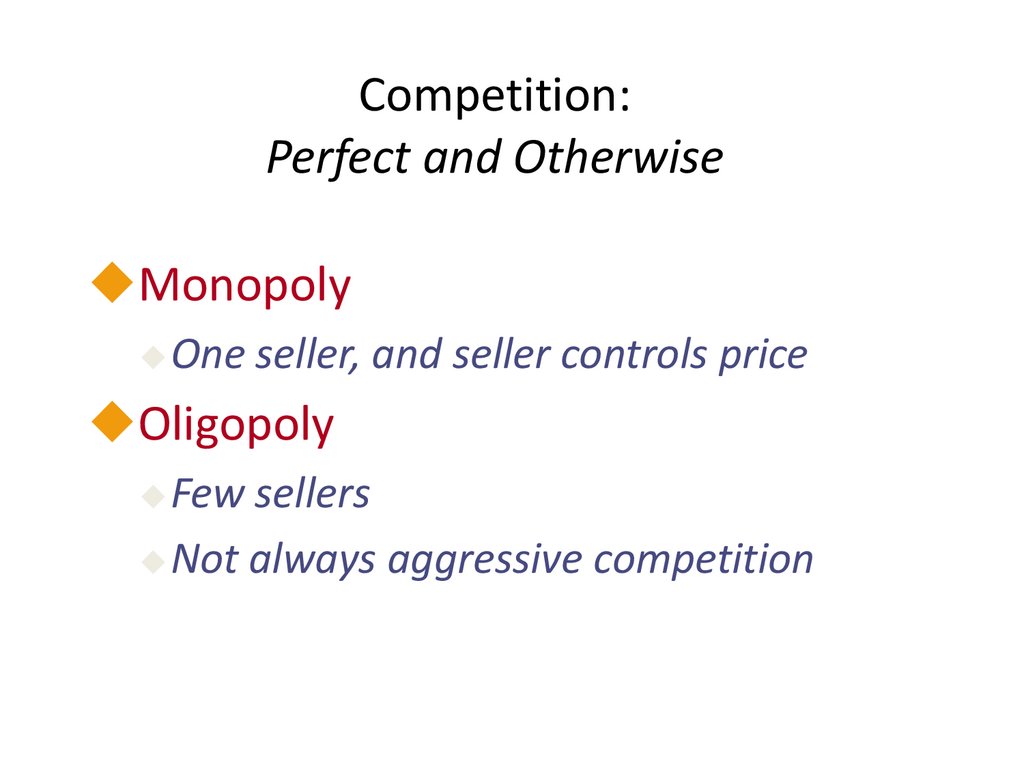
Competition:Perfect and Otherwise
Monopoly
One
seller, and seller controls price
Oligopoly
Few
sellers
Not always aggressive competition
8.
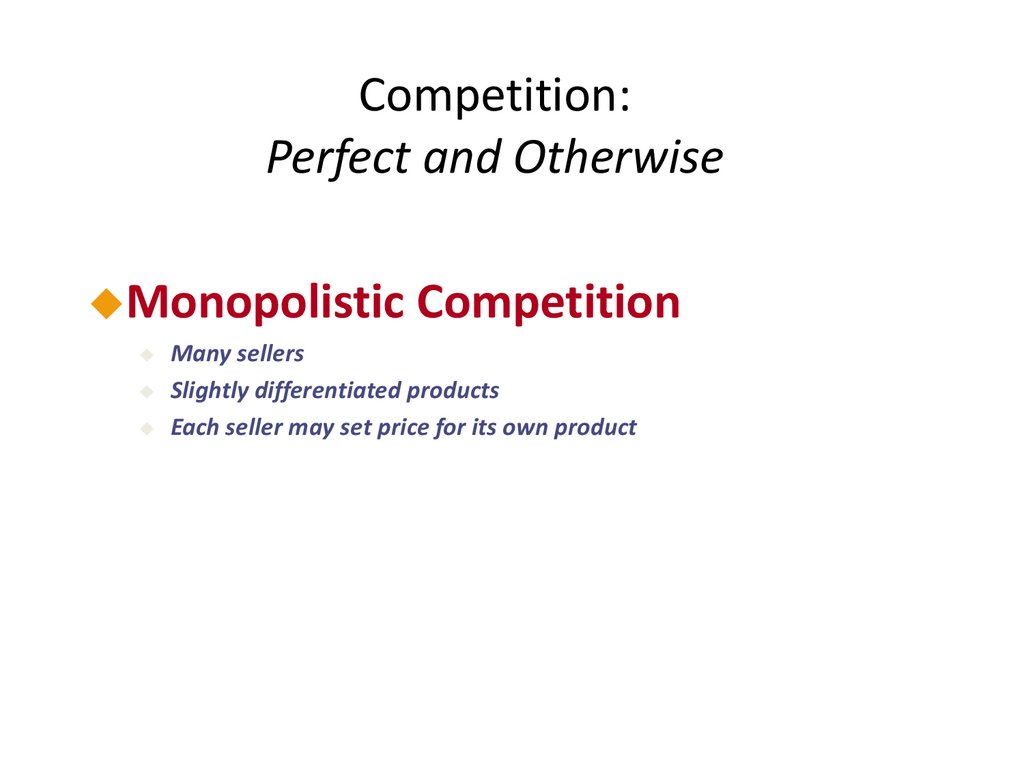
Competition:Perfect and Otherwise
Monopolistic
Competition
Many sellers
Slightly differentiated products
Each seller may set price for its own product
9.
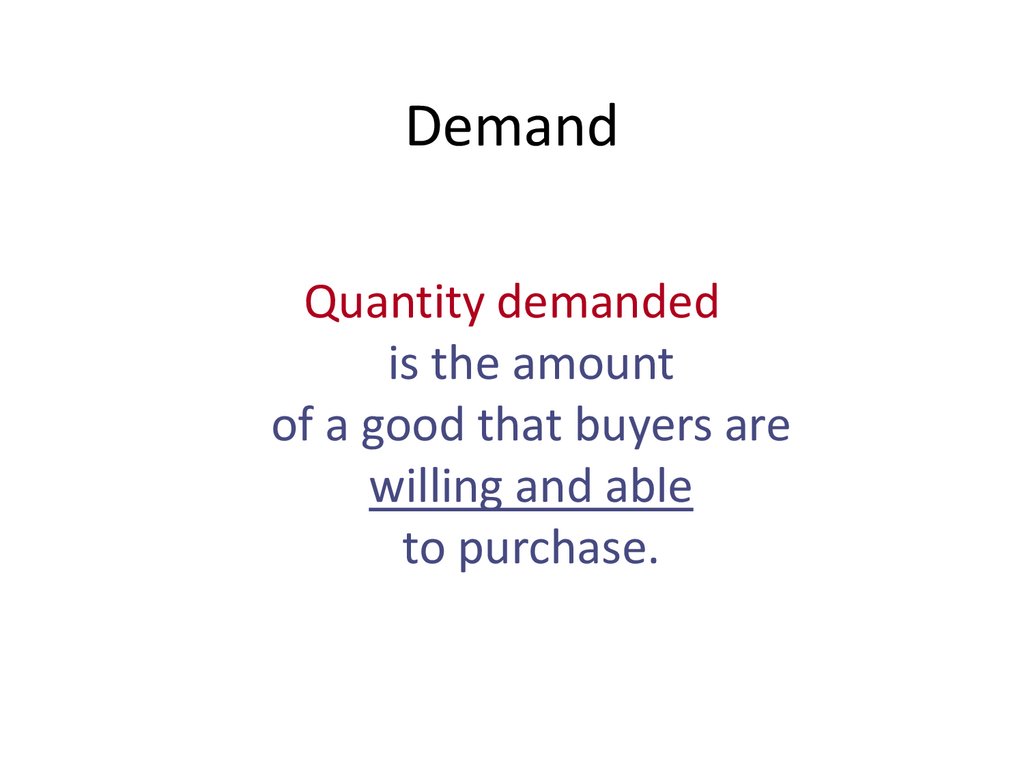
DemandQuantity demanded
is the amount
of a good that buyers are
willing and able
to purchase.
10.
Law of DemandThe law of demand states that
there is an inverse
relationship between price
and quantity demanded.
11.
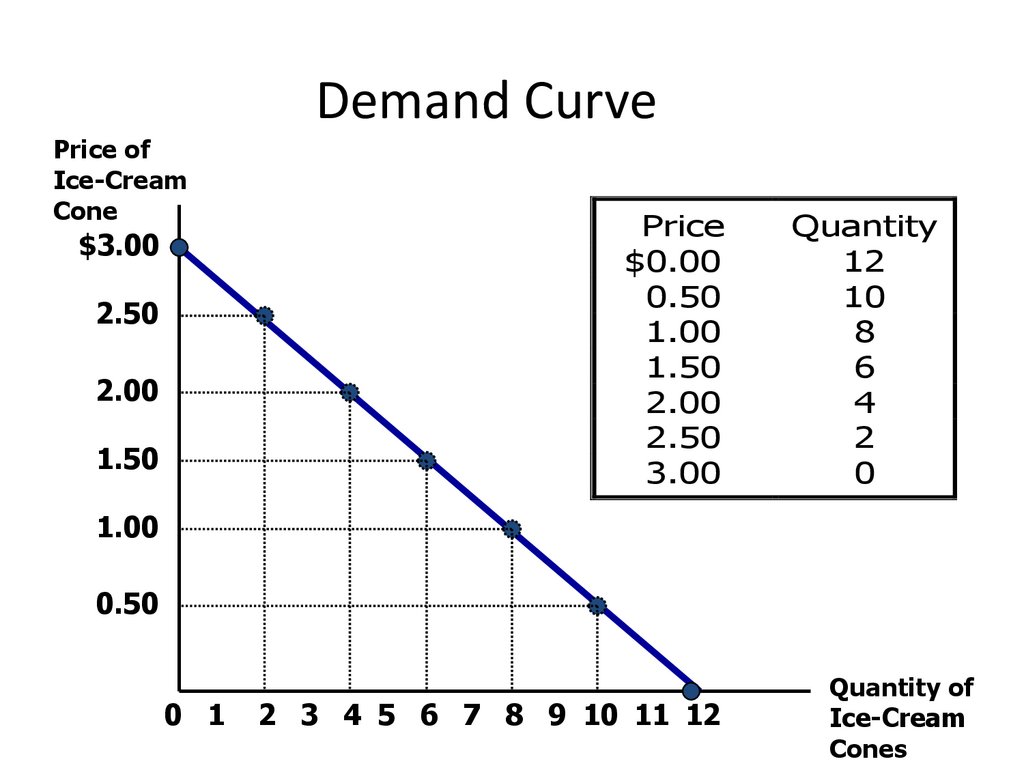
Demand ScheduleThe demand schedule is a table
that shows the relationship
between the price of the good
and the quantity demanded.
12.
Demand SchedulePrice
$0.00
0.50
1.00
1.50
2.00
2.50
3.00
Quantity
12
10
8
6
4
2
0
13.
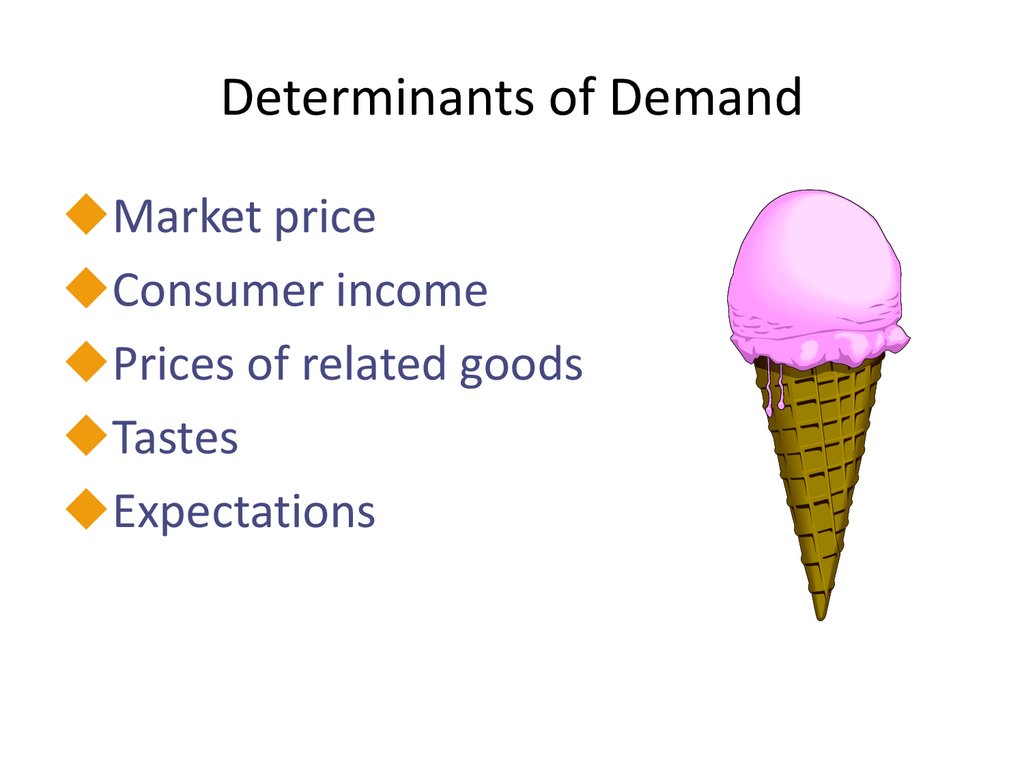
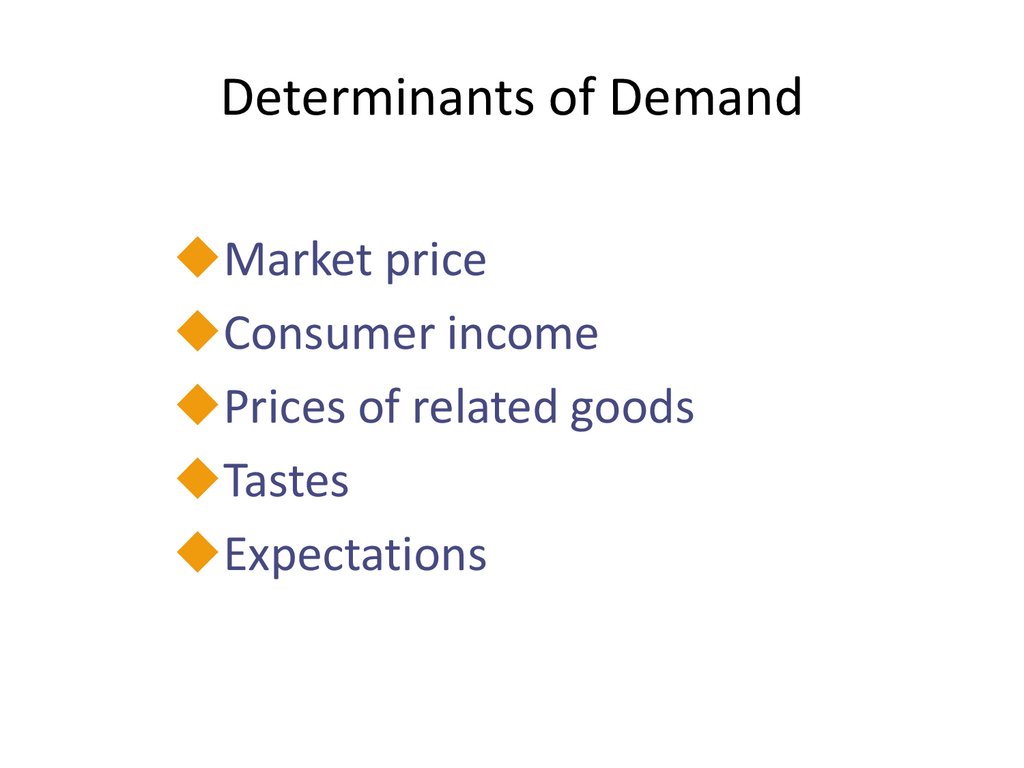
Determinants of DemandMarket price
Consumer income
Prices of related goods
Tastes
Expectations
14.
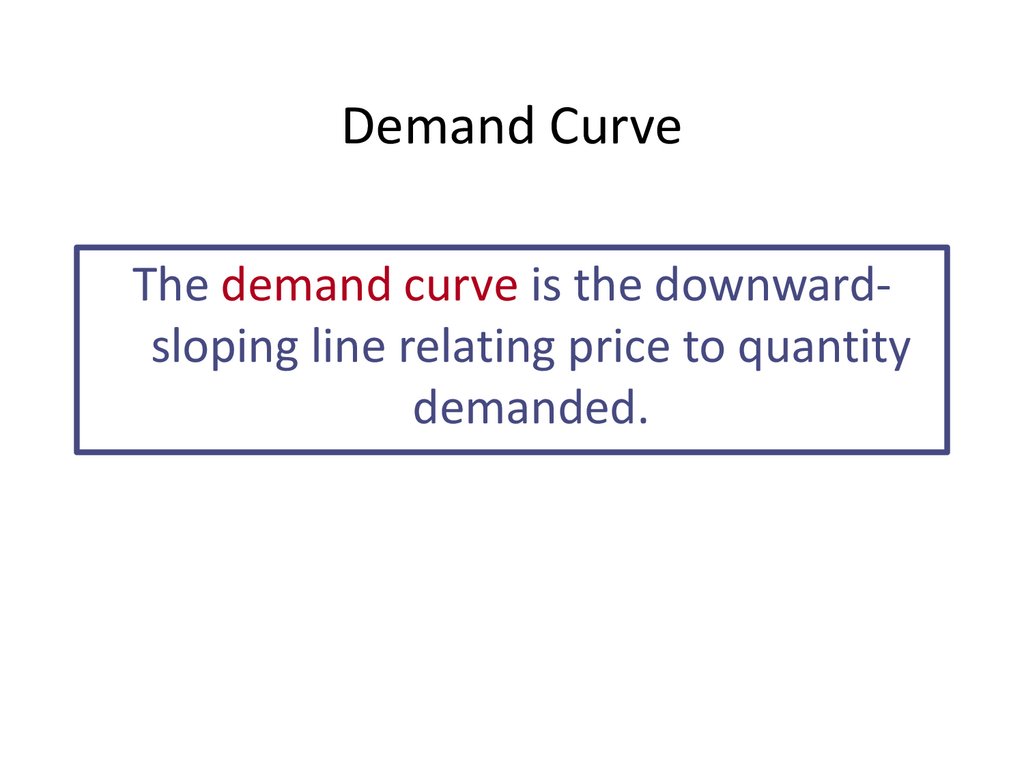
Demand CurveThe demand curve is the downwardsloping line relating price to quantity
demanded.
15.
Demand CurvePrice of
Ice-Cream
Cone
$3.00
2.50
2.00
1.50
Price
$0.00
0.50
1.00
1.50
2.00
2.50
3.00
Quantity
12
10
8
6
4
2
0
1.00
0.50
0 1
2 3 4 5 6 7 8 9 10 11 12
Quantity of
Ice-Cream
Cones
16.
Ceteris ParibusCeteris paribus is a Latin phrase that
means all variables other than the ones
being studied are assumed to be
constant. Literally, ceteris paribus
means “other things being equal.”
The demand curve slopes downward
because, ceteris paribus, lower prices
imply a greater quantity demanded!
17.
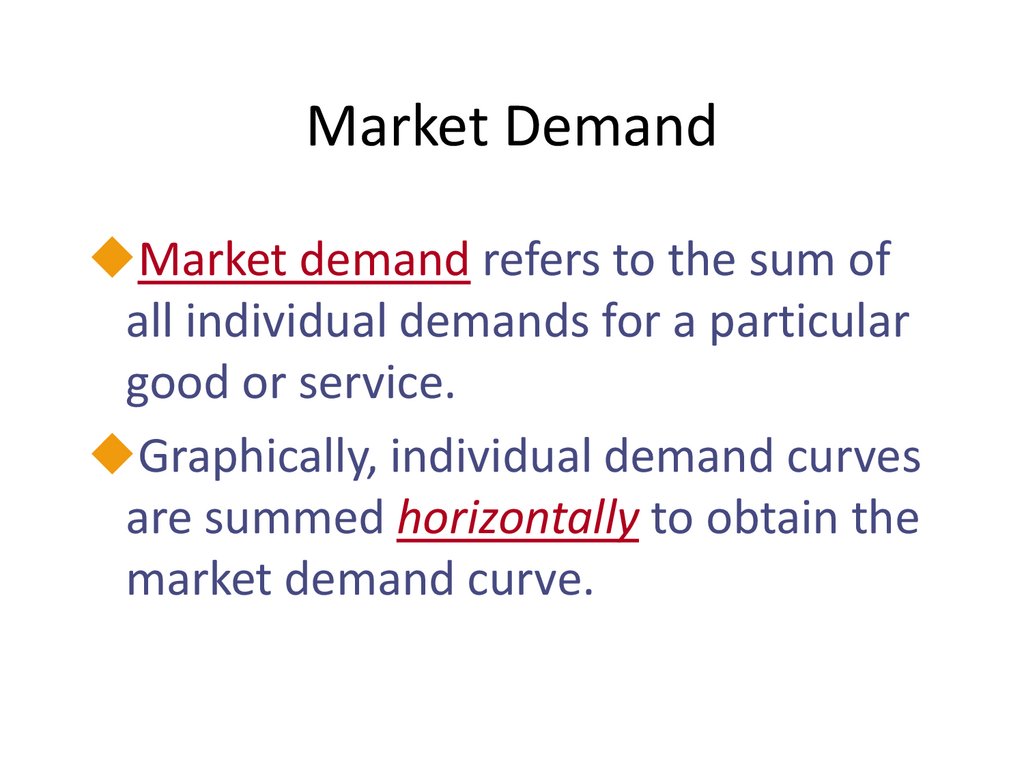
Market DemandMarket demand refers to the sum of
all individual demands for a particular
good or service.
Graphically, individual demand curves
are summed horizontally to obtain the
market demand curve.
18.
Determinants of DemandMarket price
Consumer income
Prices of related goods
Tastes
Expectations
19.
Change in Quantity Demandedversus Change in Demand
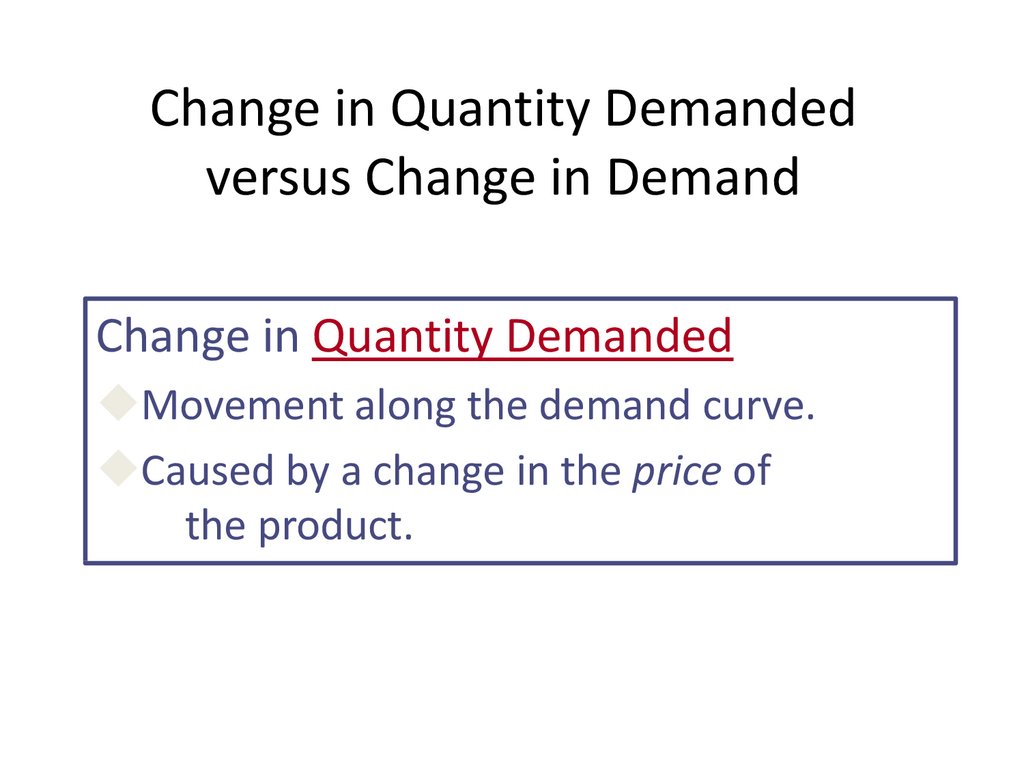
Change in Quantity Demanded
Movement along the demand curve.
Caused by a change in the price of
the product.
20.
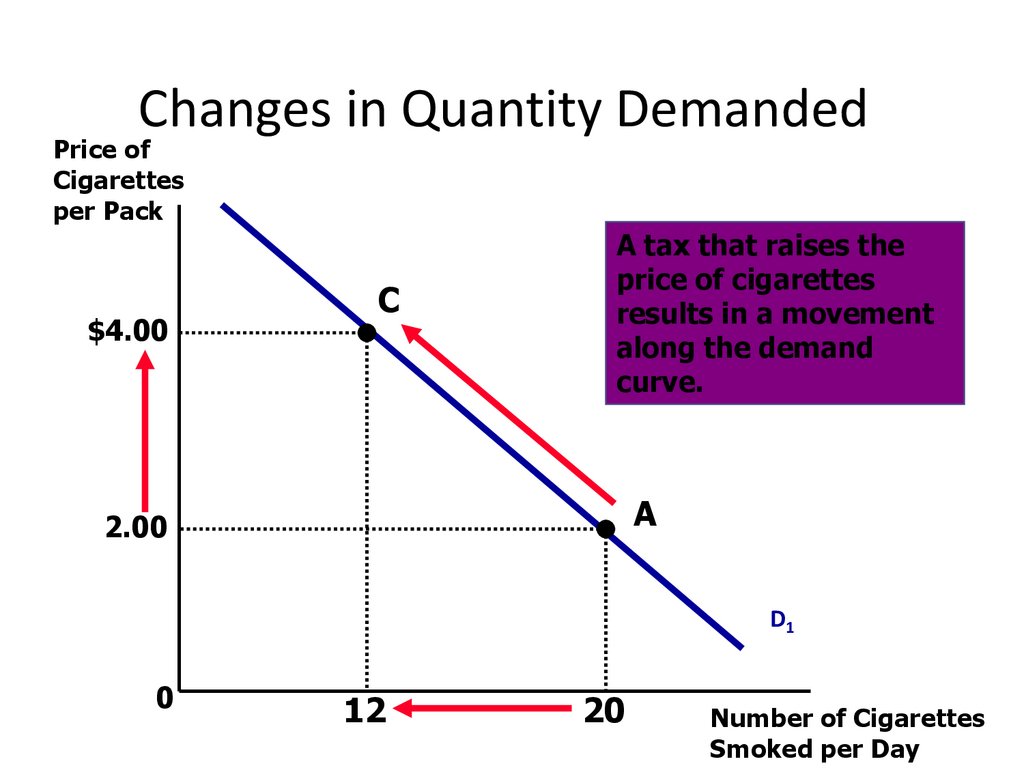
Changes in Quantity DemandedPrice of
Cigarettes
per Pack
$4.00
C
A tax that raises the
price of cigarettes
results in a movement
along the demand
curve.
A
2.00
D1
0
12
20
Number of Cigarettes
Smoked per Day
21.
Change in Quantity Demandedversus Change in Demand
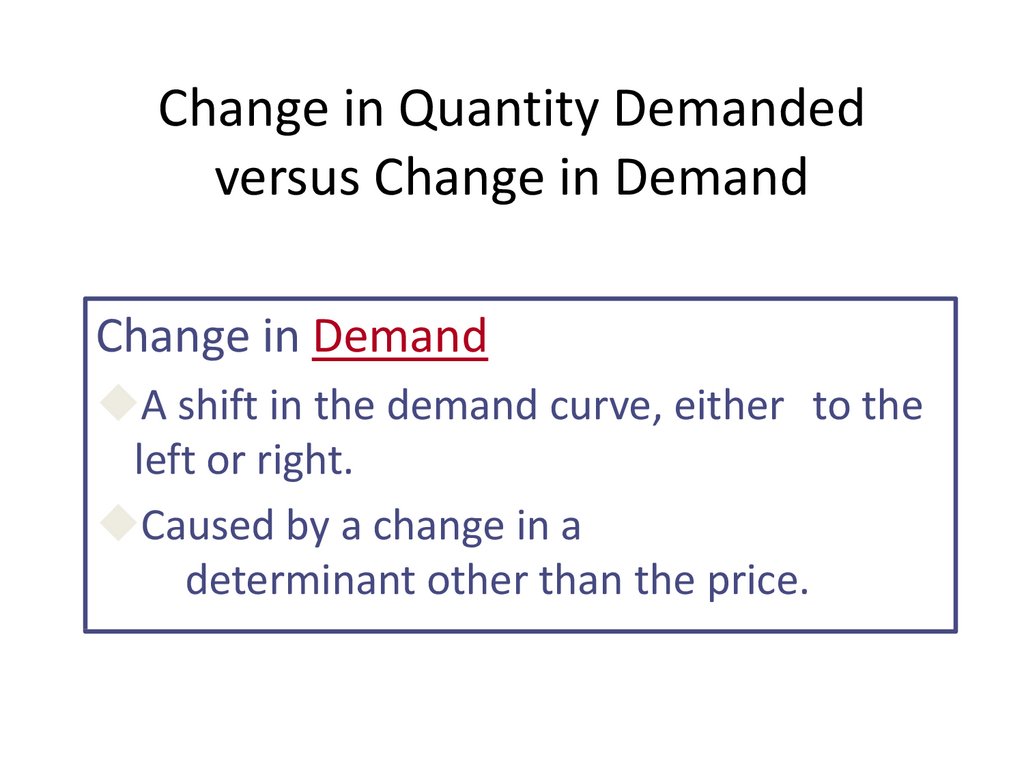
Change in Demand
A shift in the demand curve, either to the
left or right.
Caused by a change in a
determinant other than the price.
22.
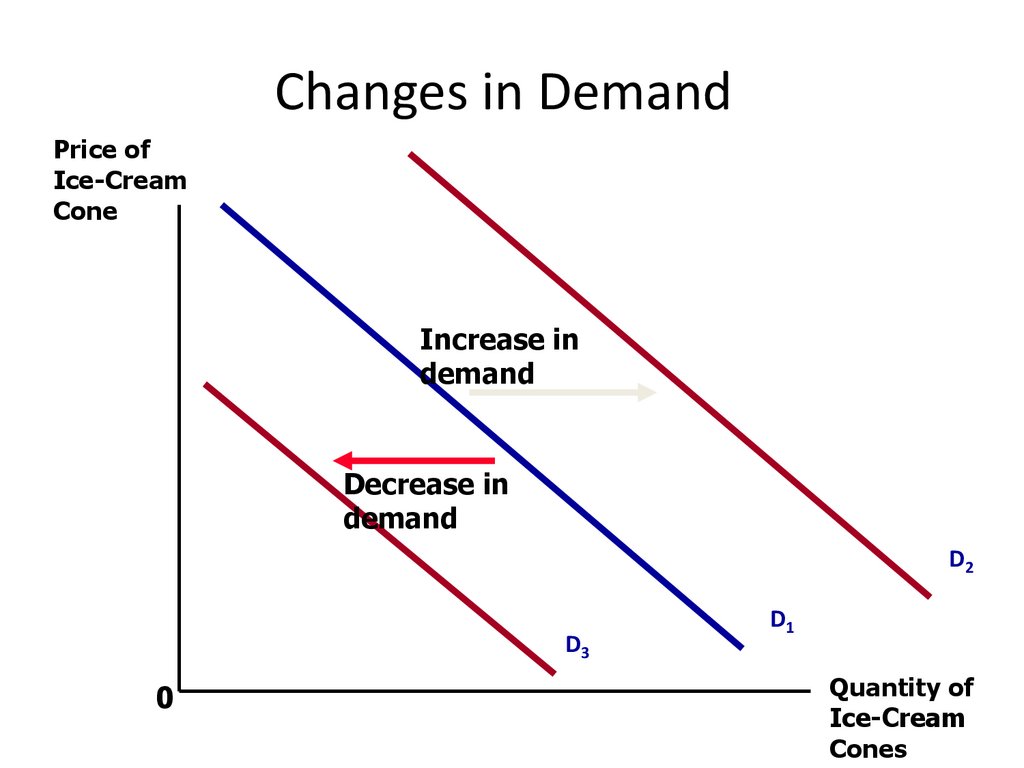
Changes in DemandPrice of
Ice-Cream
Cone
Increase in
demand
Decrease in
demand
D2
D3
0
D1
Quantity of
Ice-Cream
Cones
23.
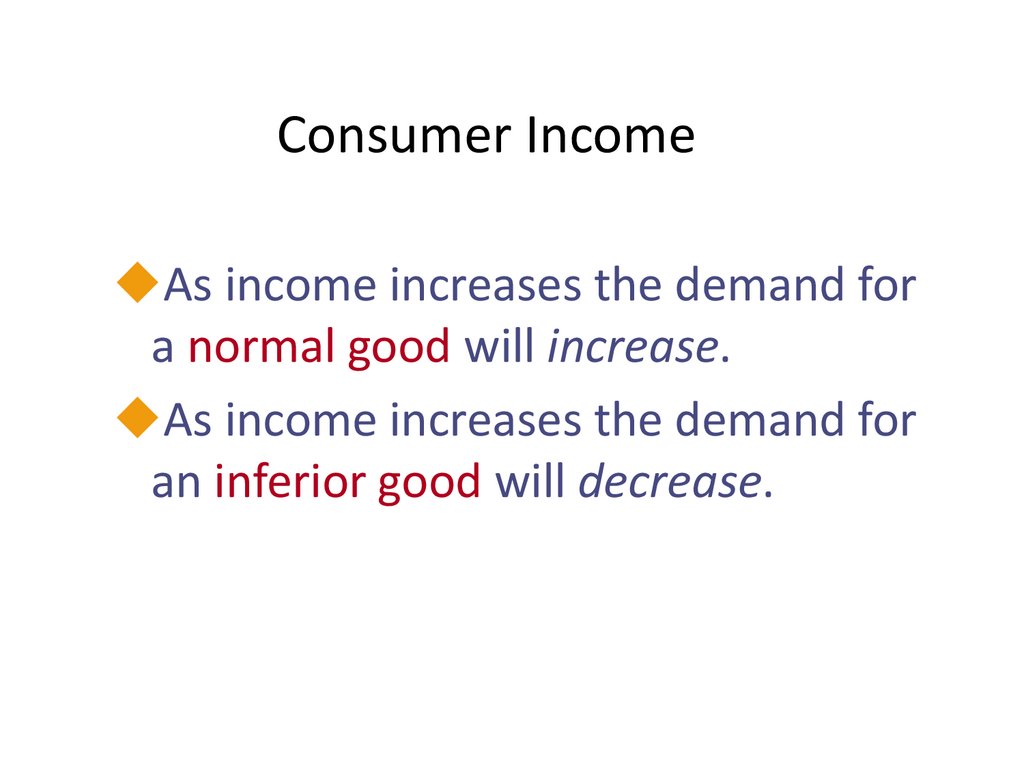
Consumer IncomeAs income increases the demand for
a normal good will increase.
As income increases the demand for
an inferior good will decrease.
24.
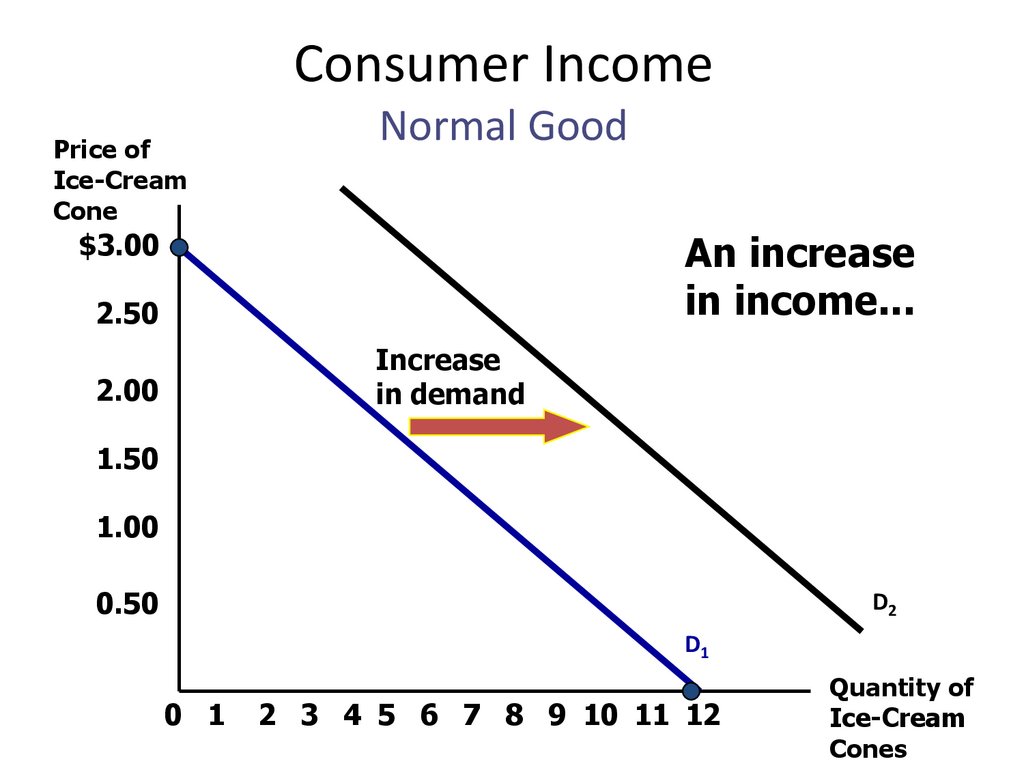
Consumer IncomePrice of
Ice-Cream
Cone
Normal Good
An increase
in income...
$3.00
2.50
Increase
in demand
2.00
1.50
1.00
0.50
D2
D1
0 1
2 3 4 5 6 7 8 9 10 11 12
Quantity of
Ice-Cream
Cones
25.
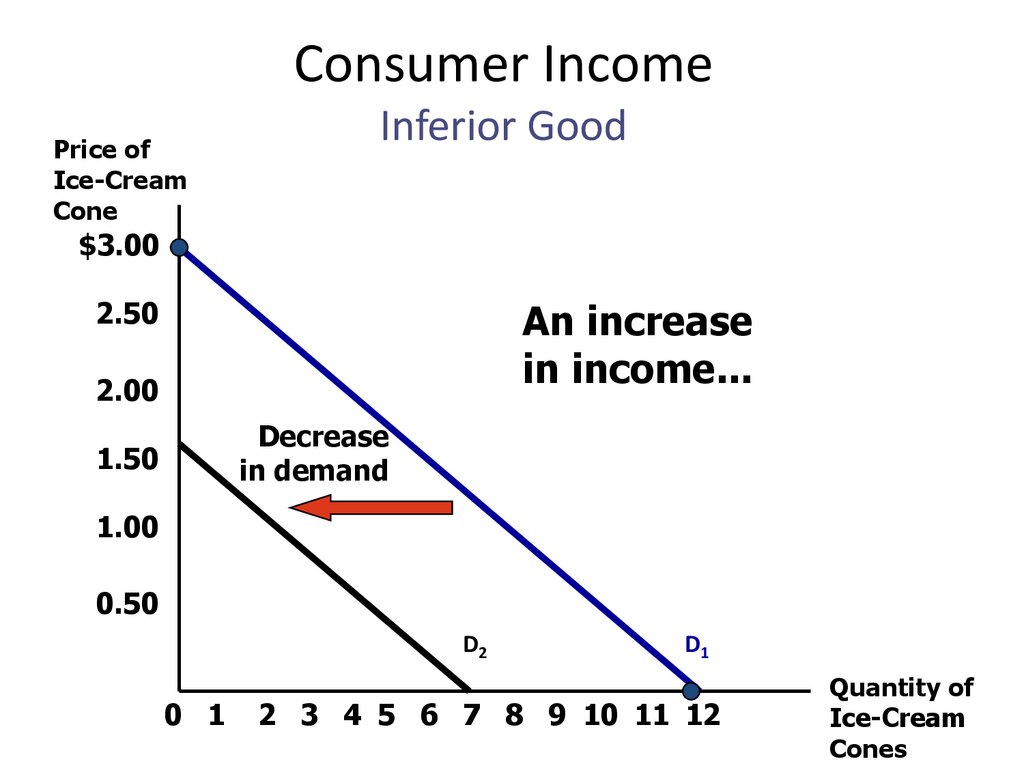
Consumer IncomePrice of
Ice-Cream
Cone
Inferior Good
$3.00
An increase
in income...
2.50
2.00
Decrease
in demand
1.50
1.00
0.50
D2
0 1
D1
2 3 4 5 6 7 8 9 10 11 12
Quantity of
Ice-Cream
Cones
26.
Prices of Related GoodsSubstitutes & Complements
When a fall in the price of one good
reduces the demand for another good,
the two goods are called substitutes.
When a fall in the price of one good
increases the demand for another good,
the two goods are called complements.
27.
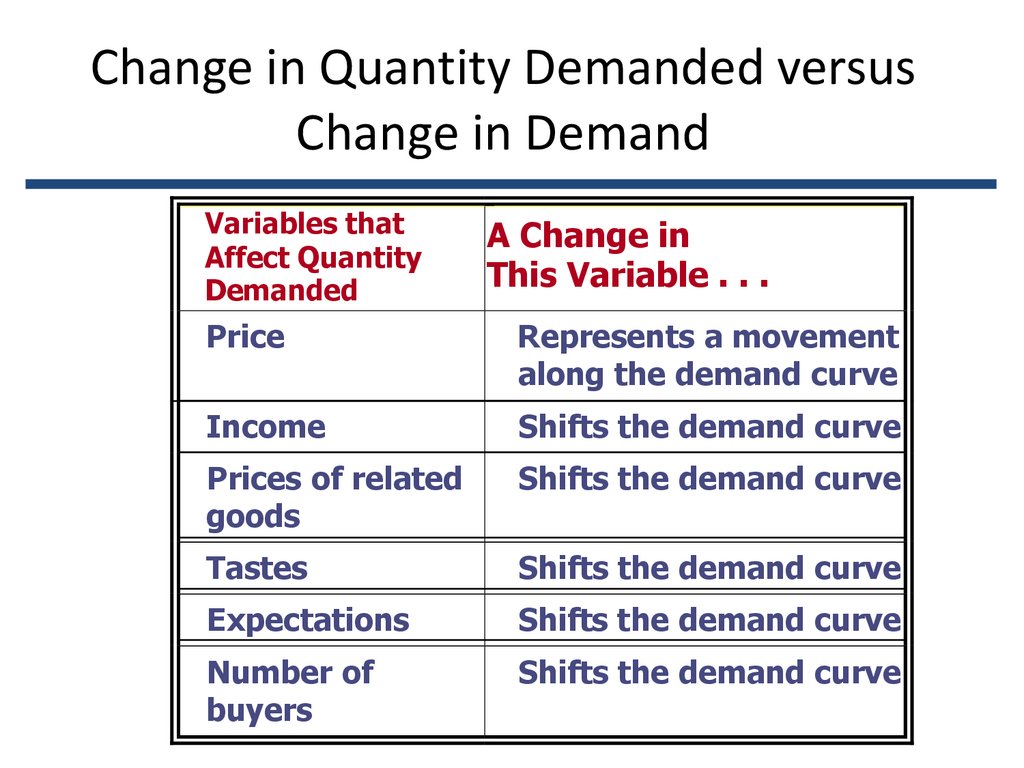
Change in Quantity Demanded versusChange in Demand
Variables that
Affect Quantity
Demanded
A Change in
This Variable . . .
Price
Represents a movement
along the demand curve
Income
Shifts the demand curve
Prices of related
goods
Shifts the demand curve
Tastes
Shifts the demand curve
Expectations
Shifts the demand curve
Number of
buyers
Shifts the demand curve
28.
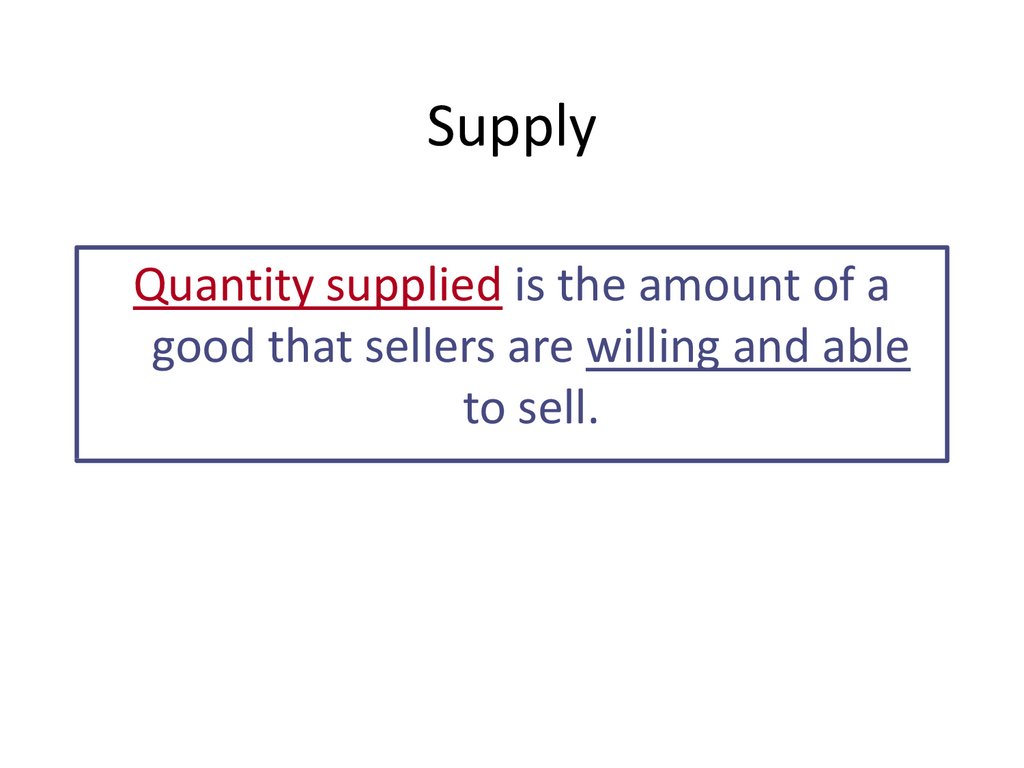
SupplyQuantity supplied is the amount of a
good that sellers are willing and able
to sell.
29.
Law of SupplyThe law of supply states that there is a
direct (positive) relationship between
price and quantity supplied.
30.
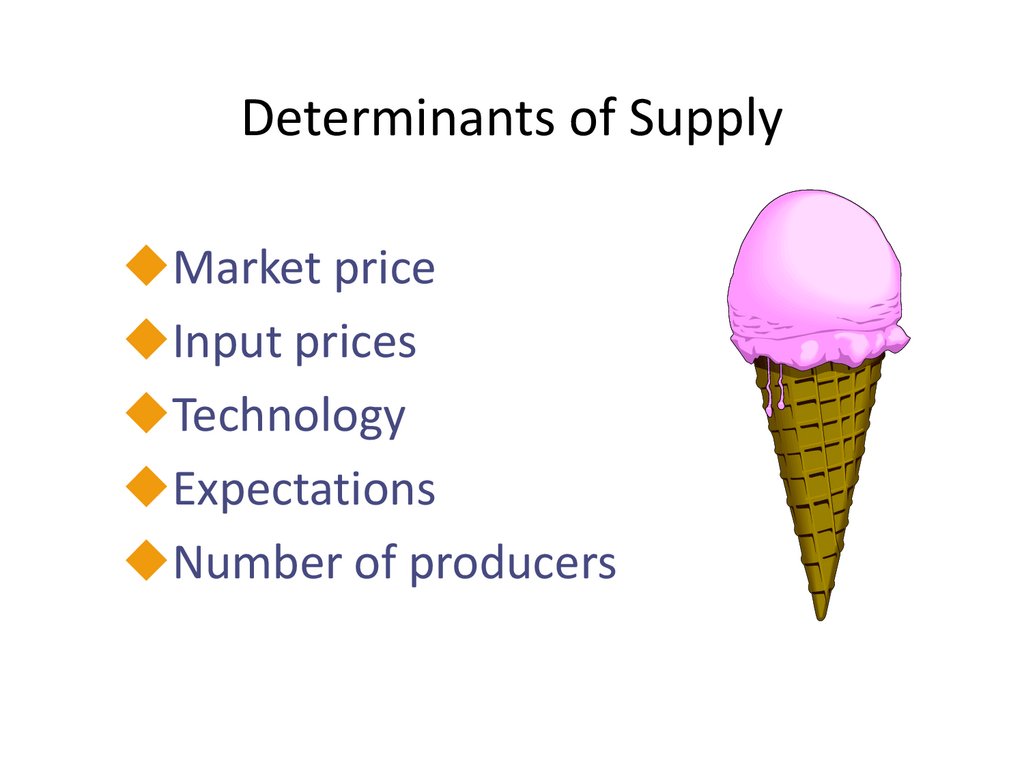
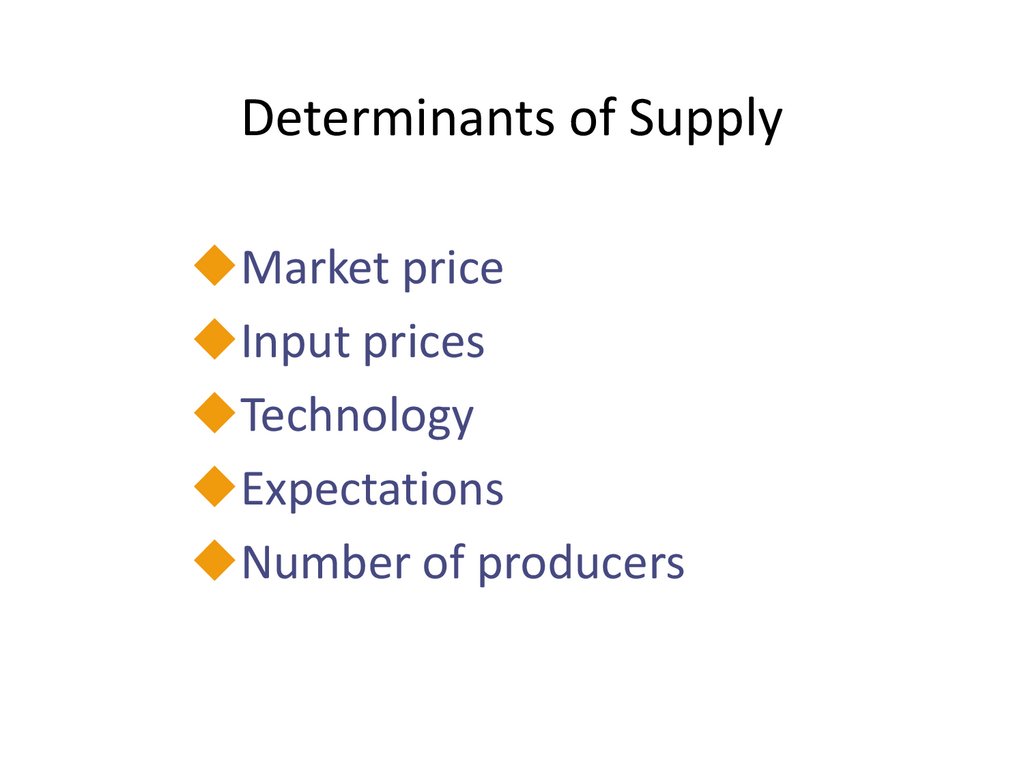
Determinants of SupplyMarket price
Input prices
Technology
Expectations
Number of producers
31.
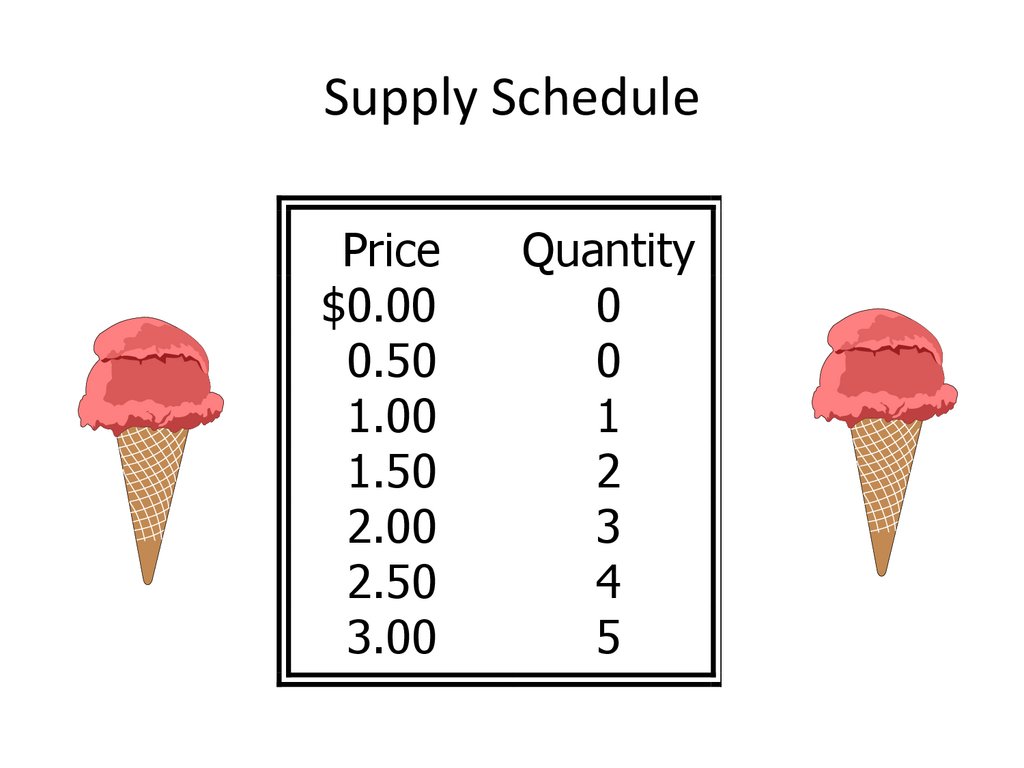
Supply ScheduleThe supply schedule is a table that
shows the relationship between the
price of the good and the quantity
supplied.
32.
Supply SchedulePrice
$0.00
0.50
1.00
1.50
2.00
2.50
3.00
Quantity
0
0
1
2
3
4
5
33.
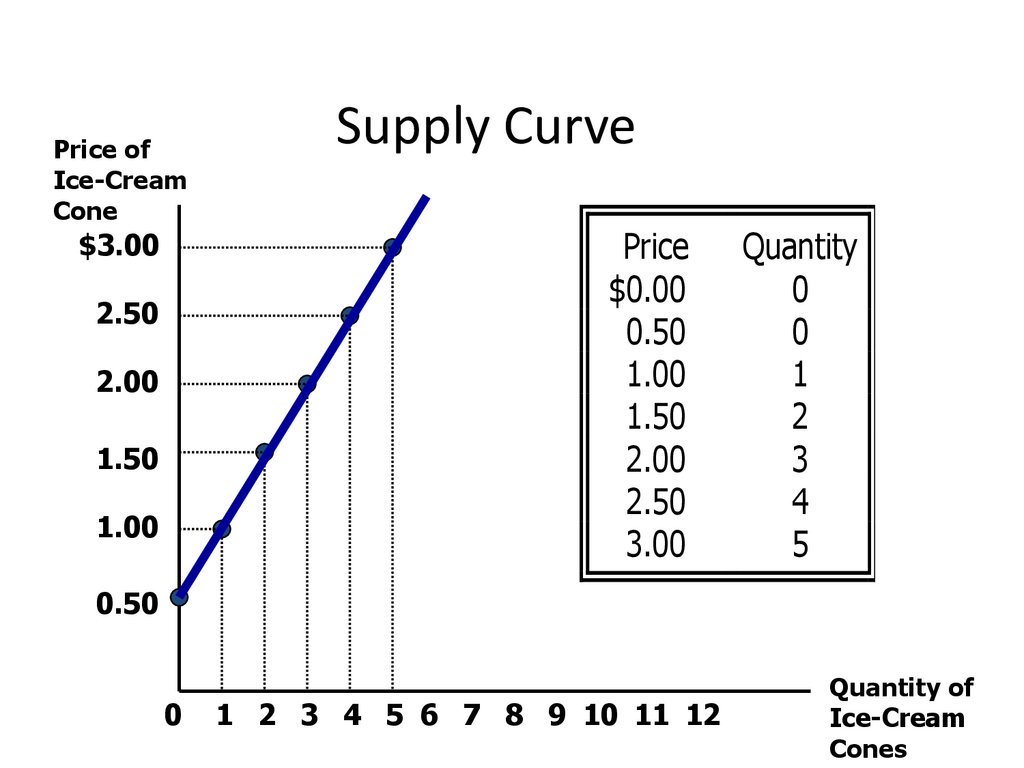
Supply CurveThe supply curve is the upward-sloping
line relating price to quantity supplied.
34.
Price ofIce-Cream
Cone
$3.00
2.50
2.00
1.50
1.00
Supply Curve
Price
$0.00
0.50
1.00
1.50
2.00
2.50
3.00
Quantity
0
0
1
2
3
4
5
0.50
0
1 2 3 4 5 6 7 8 9 10 11 12
Quantity of
Ice-Cream
Cones
35.
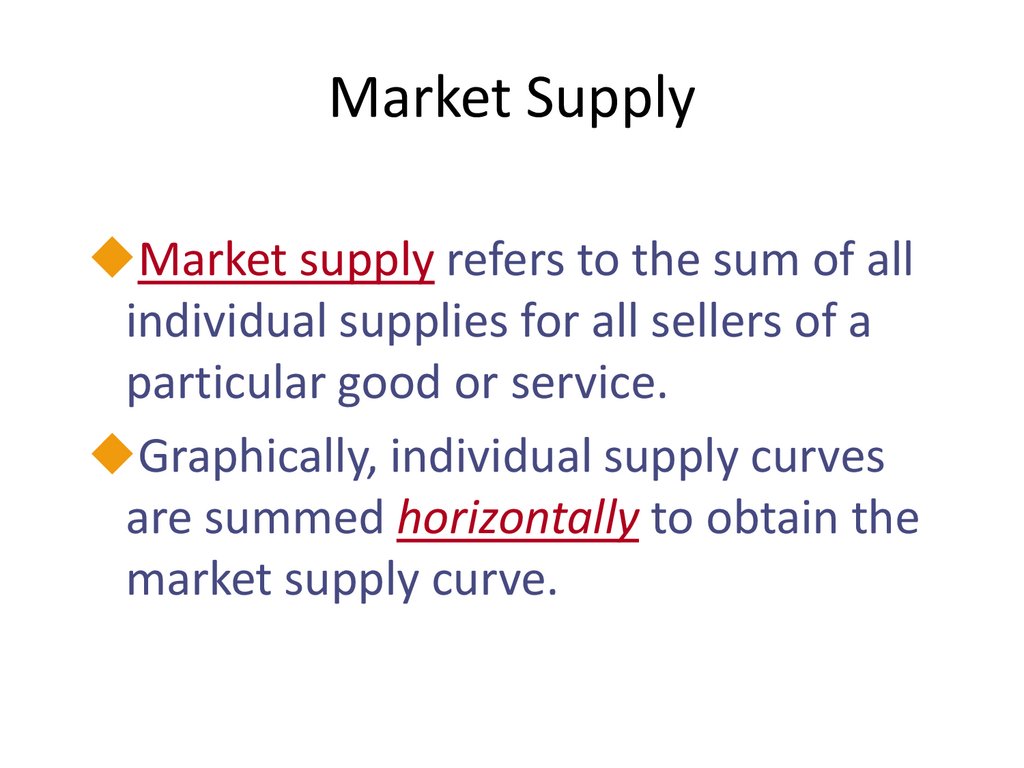
Market SupplyMarket supply refers to the sum of all
individual supplies for all sellers of a
particular good or service.
Graphically, individual supply curves
are summed horizontally to obtain the
market supply curve.
36.
Determinants of SupplyMarket price
Input prices
Technology
Expectations
Number of producers
37.
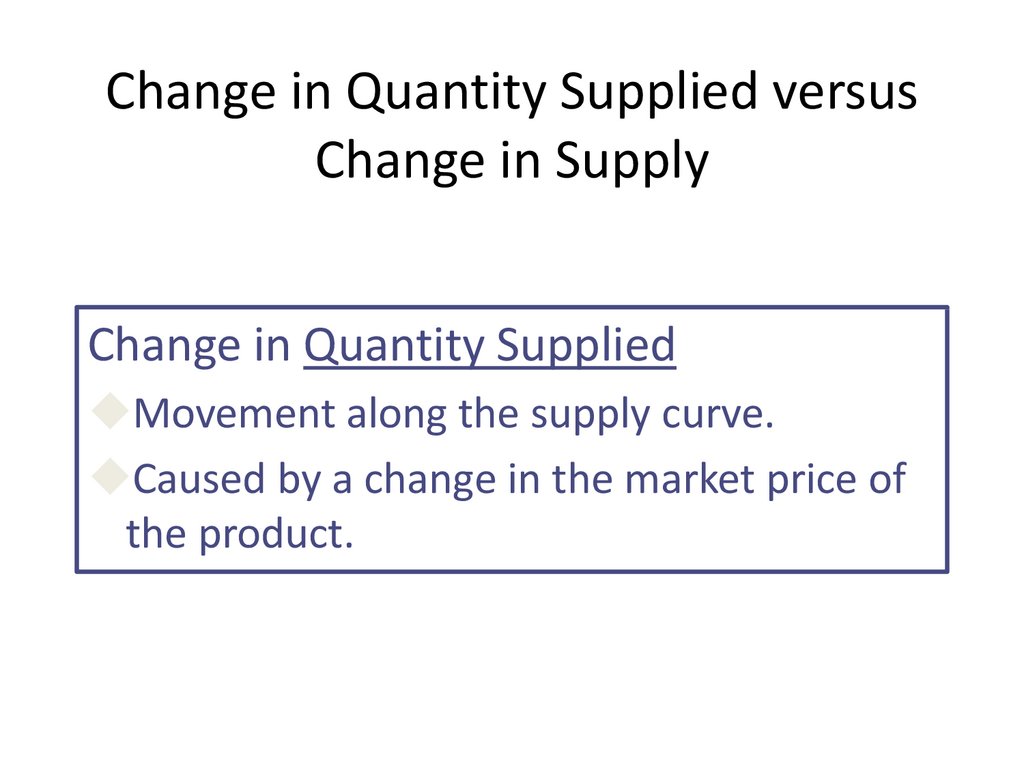
Change in Quantity Supplied versusChange in Supply
Change in Quantity Supplied
Movement along the supply curve.
Caused by a change in the market price of
the product.
38.
Change in Quantity SuppliedPrice of
Ice-Cream
Cone
S
C
$3.00
A
1.00
0
1
5
A rise in the price
of ice cream cones
results in a
movement along
the supply curve.
Quantity of
Ice-Cream
Cones
39.
Change in Quantity Supplied versusChange in Supply
Change in Supply
A shift in the supply curve, either to the left
or right.
Caused by a change in a determinant other
than price.
40.
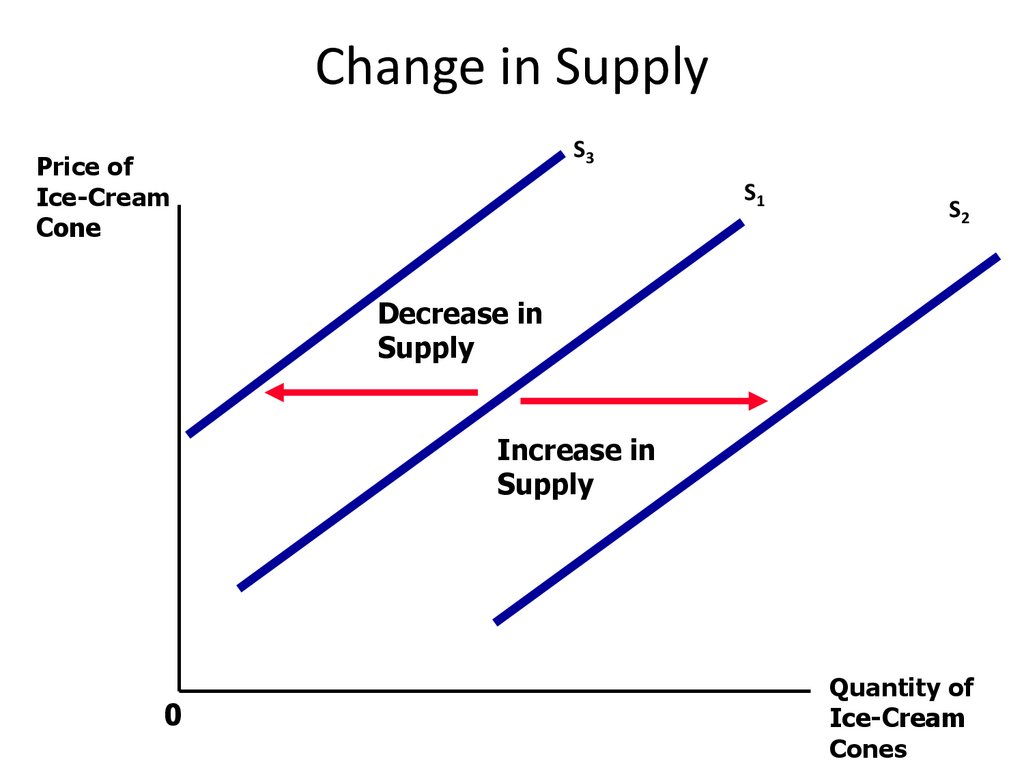
Change in SupplyS3
Price of
Ice-Cream
Cone
S1
S2
Decrease in
Supply
Increase in
Supply
0
Quantity of
Ice-Cream
Cones
41.
Change in Quantity Supplied versusChange in Supply
Variables that
Affect Quantity Supplied
A Change in This Variable . . .
Price
Represents a movement along
the supply curve
Input prices
Shifts the supply curve
Technology
Shifts the supply curve
Expectations
Shifts the supply curve
Number of sellers
Shifts the supply curve
42.
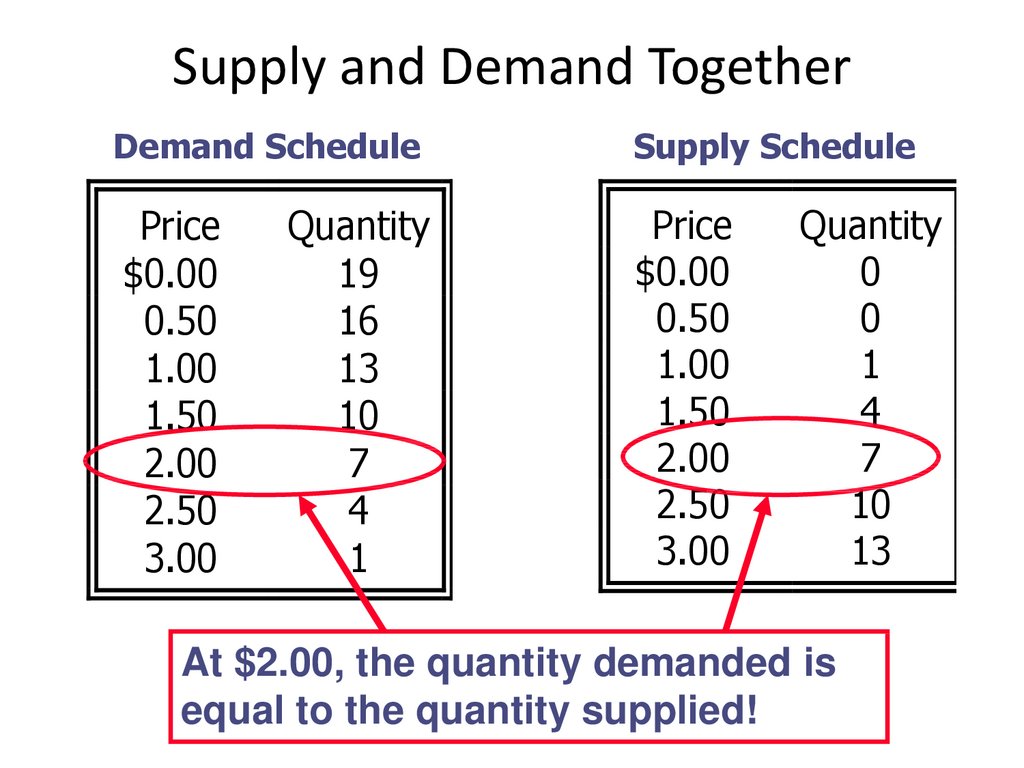
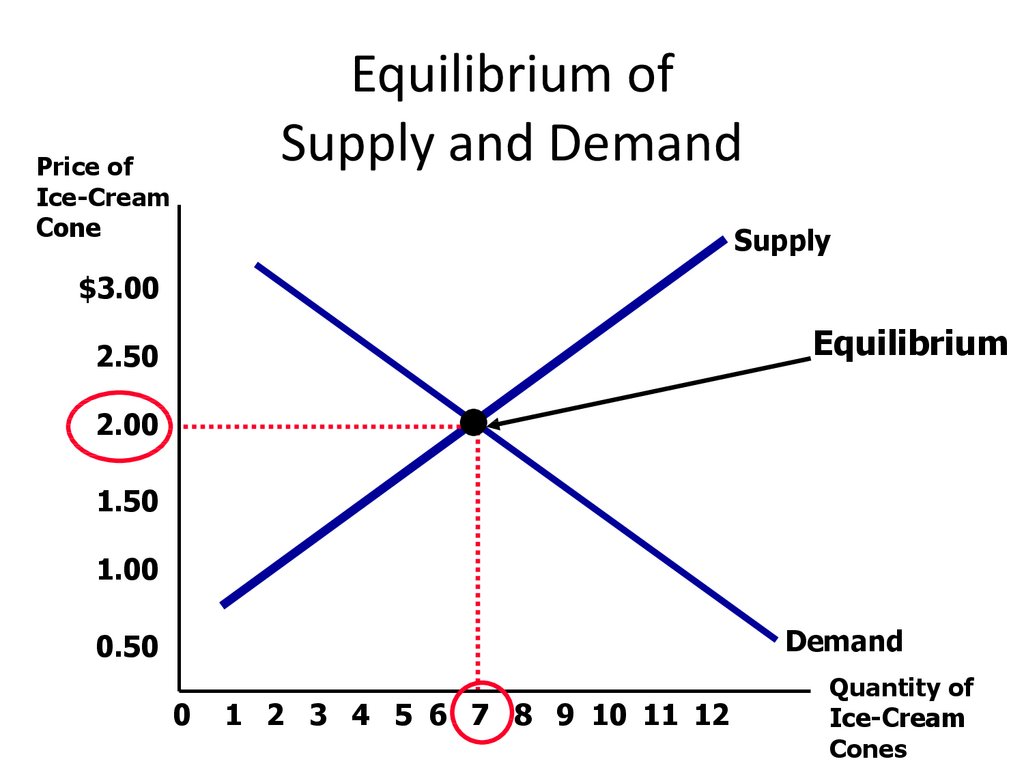
Supply and Demand TogetherEquilibrium Price
The price that balances supply and demand.
On a graph, it is the price at which the supply
and demand curves intersect.
Equilibrium Quantity
The quantity that balances supply and
demand. On a graph it is the quantity at
which the supply and demand curves
intersect.
43.
Supply and Demand TogetherDemand Schedule
Price
$0.00
0.50
1.00
1.50
2.00
2.50
3.00
Quantity
19
16
13
10
7
4
1
Supply Schedule
Price
$0.00
0.50
1.00
1.50
2.00
2.50
3.00
Quantity
0
0
1
4
7
10
13
At $2.00, the quantity demanded is
equal to the quantity supplied!
44.
Equilibrium ofSupply and Demand
Price of
Ice-Cream
Cone
Supply
$3.00
Equilibrium
2.50
2.00
1.50
1.00
Demand
0.50
0
1 2 3 4 5 6 7 8 9 10 11 12
Quantity of
Ice-Cream
Cones
45.
Excess SupplyPrice of
Ice-Cream
Cone
Surplus
$3.00
Supply
2.50
2.00
1.50
1.00
Demand
0.50
0
1 2 3 4 5 6 7 8 9 10 11 12
Quantity of
Ice-Cream
Cones
46.
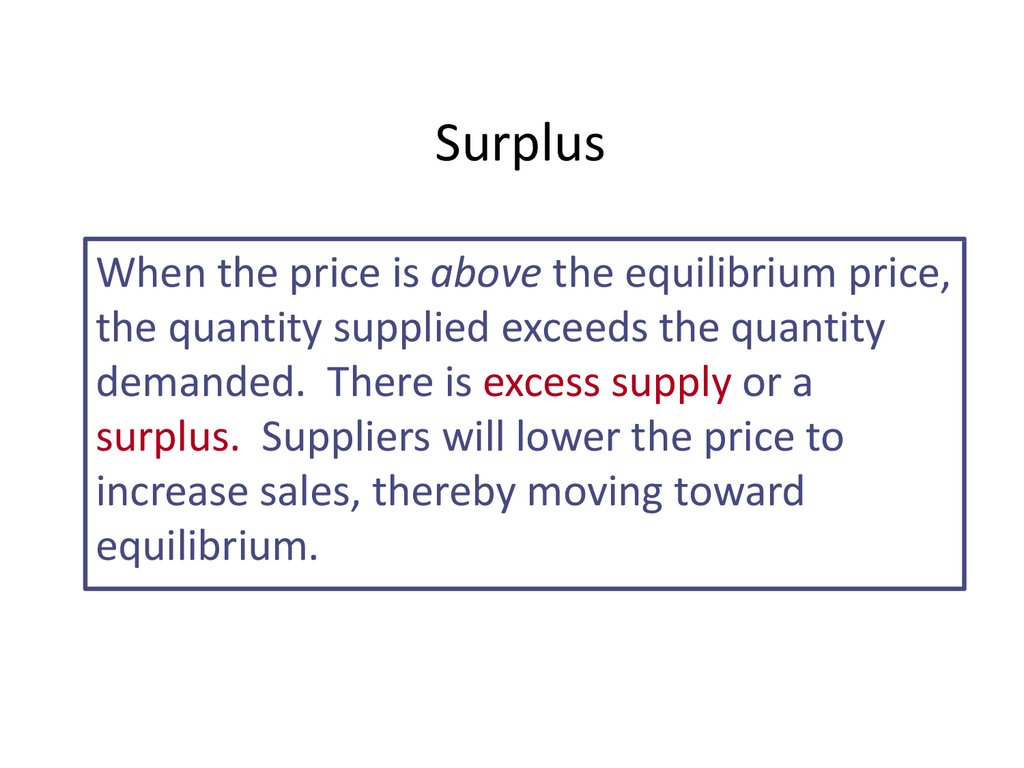
SurplusWhen the price is above the equilibrium price,
the quantity supplied exceeds the quantity
demanded. There is excess supply or a
surplus. Suppliers will lower the price to
increase sales, thereby moving toward
equilibrium.
47.
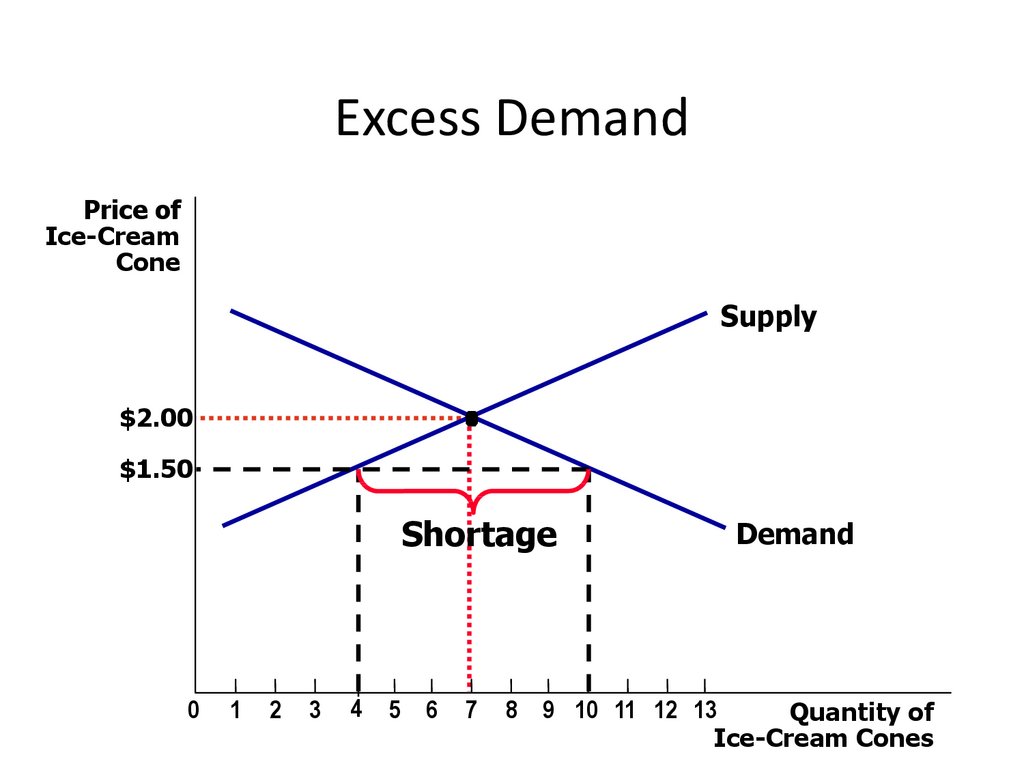
Excess DemandPrice of
Ice-Cream
Cone
Supply
$2.00
$1.50
Shortage
0
1
2
3
4
5 6
7
Demand
8 9 10 11 12 13
Quantity of
Ice-Cream Cones
48.
ShortageWhen the price is below the equilibrium price,
the quantity demanded exceeds the quantity
supplied. There is excess demand or a
shortage. Suppliers will raise the price due to
too many buyers chasing too few goods,
thereby moving toward equilibrium.
49.
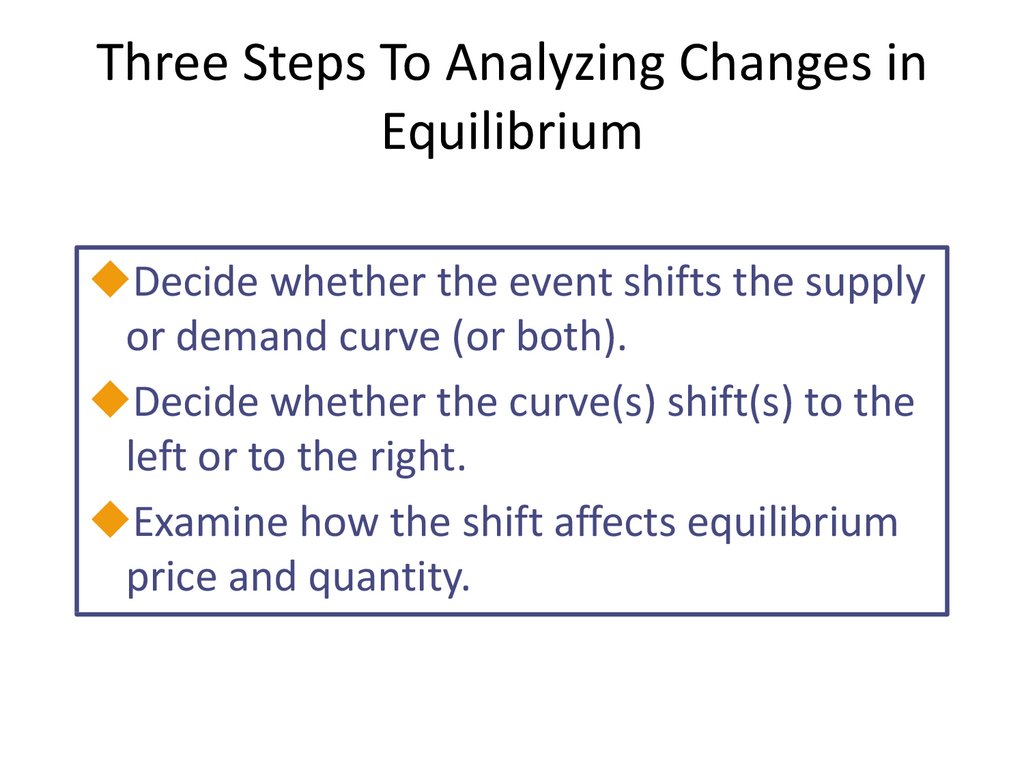
Three Steps To Analyzing Changes inEquilibrium
Decide whether the event shifts the supply
or demand curve (or both).
Decide whether the curve(s) shift(s) to the
left or to the right.
Examine how the shift affects equilibrium
price and quantity.
50.
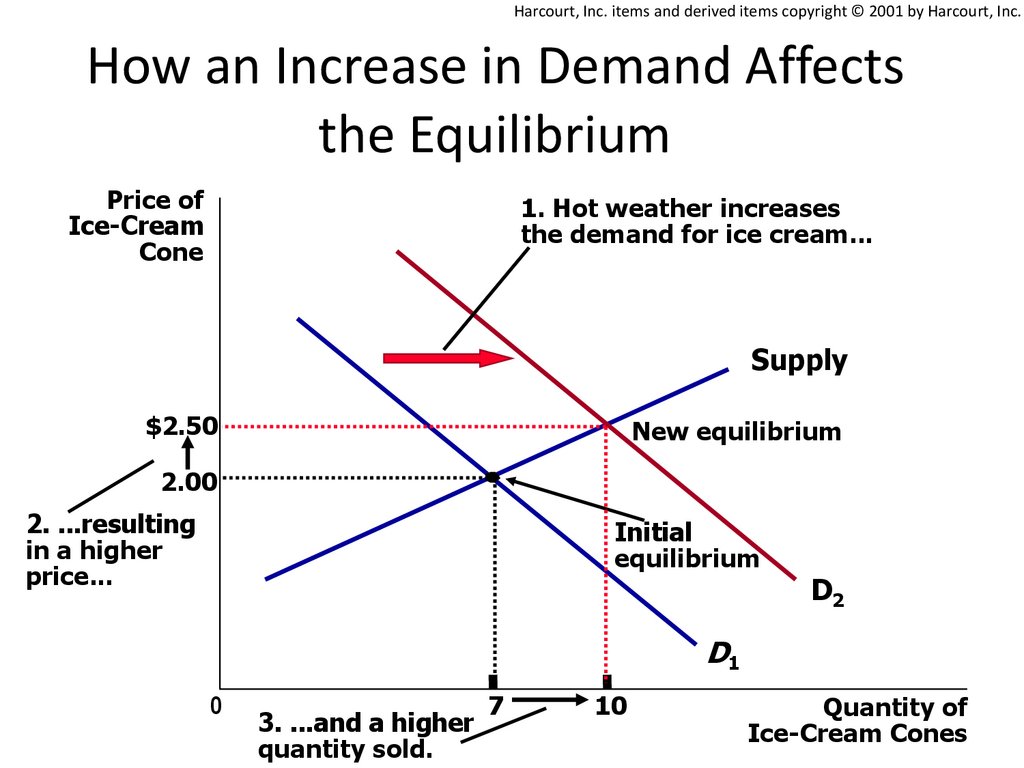
Harcourt, Inc. items and derived items copyright © 2001 by Harcourt, Inc.How an Increase in Demand Affects
the Equilibrium
Price of
Ice-Cream
Cone
1. Hot weather increases
the demand for ice cream...
Supply
$2.50
New equilibrium
2.00
2. ...resulting
in a higher
price...
Initial
equilibrium
D2
D1
0
3. ...and a higher
quantity sold.
7
10
Quantity of
Ice-Cream Cones
51.
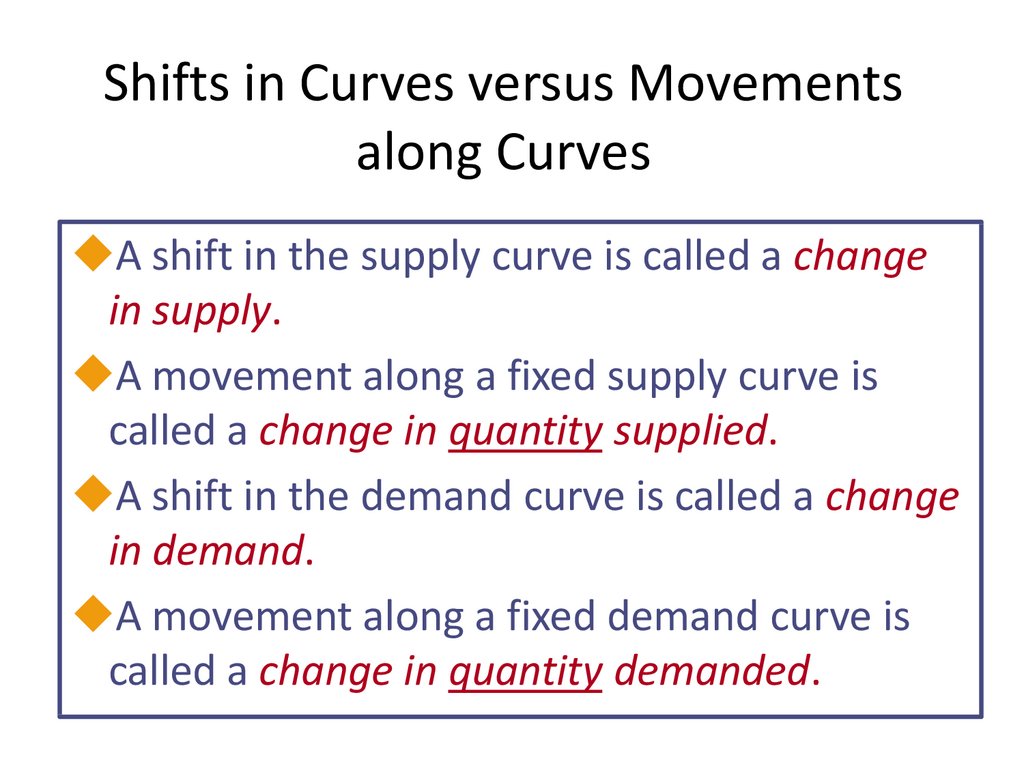
Shifts in Curves versus Movementsalong Curves
A shift in the supply curve is called a change
in supply.
A movement along a fixed supply curve is
called a change in quantity supplied.
A shift in the demand curve is called a change
in demand.
A movement along a fixed demand curve is
called a change in quantity demanded.
52.
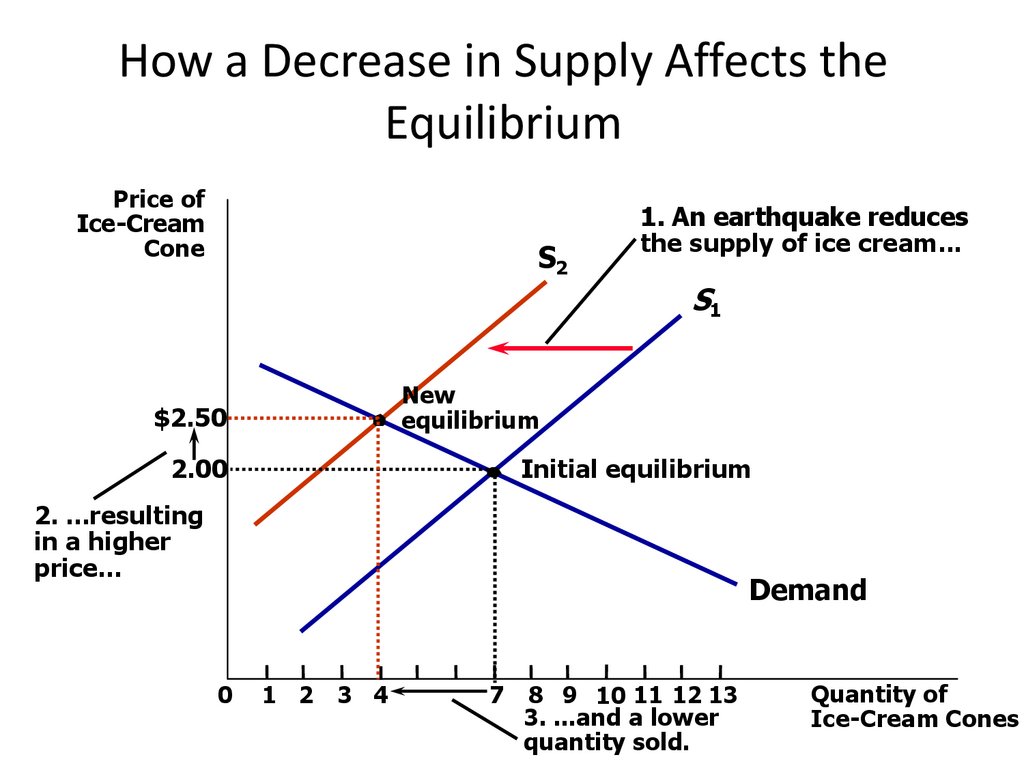
How a Decrease in Supply Affects theEquilibrium
Price of
Ice-Cream
Cone
S2
1. An earthquake reduces
the supply of ice cream...
S1
New
equilibrium
$2.50
2.00
Initial equilibrium
2. ...resulting
in a higher
price...
Demand
0
1 2 3 4
7 8 9 10 11 12 13
3. ...and a lower
quantity sold.
Quantity of
Ice-Cream Cones
53.
What Happens to Price and Quantity WhenSupply or Demand Shifts?
No Change
In Demand
An Increase
In Demand
A Decrease
In Demand
No Change
In Supply
An Increase
In Supply
A Decrease
In Supply
P
Q
P
Q
P
Q
P
Q
P
Q
P
Q
P
Q
P
Q
P
Q
same
same
up
up
down
down
down
up
ambiguous
up
down
ambiguous
up
down
up
ambiguous
ambiguous
down
54.
SummaryEconomists use the model of supply
and demand to analyze competitive
markets.
The demand curve shows how the
quantity of a good depends upon the
price.
55.
SummaryAccording to the law of demand, as the
price of a good rises, the quantity
demanded falls.
In addition to price, other
determinants of quantity demanded
include income, tastes, expectations,
and the prices of complements and
substitutes.
56.
SummaryThe supply curve shows how the
quantity of a good supplied depends
upon the price.
According to the law of supply, as the
price of a good rises, the quantity
supplied rises.
57.
SummaryIn addition to price, other
determinants of quantity supplied
include input prices, technology, and
expectations.
Market equilibrium is determined by
the intersection of the supply and
demand curves.
58.
SummarySupply and demand together
determine the prices of the economy’s
goods and services.
In market economies, prices are the
signals that guide the allocation of
resources.