


 Информатика
Похожие презентации:


Cliche 2. This is your presentation title
1.
THIS IS YOURPRESENTATION
TITLE
2. HELLO!
I am Jayden SmithI am here because I love to give presentations.
You can find me at @username
3. 1. TRANSITION HEADLINE
Let’s start withthe first set of
slides
4.
“Quotations are commonly
printed as a means of inspiration
and to invoke philosophical
thoughts from the reader.
5.
THIS IS A SLIDE TITLE▸ Here you have a list of items
▸ And some text
▸ But remember not to overload your
slides with content
You audience will listen to you or read the
content, but won’t do both.
6. BIG CONCEPT
Bring the attention of your audience over akey concept using icons or illustrations
7. YOU CAN ALSO SPLIT YOUR CONTENT
WhiteIs the color of milk
and fresh snow, the
color produced by
the combination of
all the colors of the
visible spectrum.
Black
Is the color of coal,
ebony, and of outer
space. It is the
darkest color, the
result of the absence
of or complete
absorption of light.
8. IN TWO OR THREE COLUMNS
YellowIs the color of gold,
butter and ripe
lemons. In the
spectrum of visible
light, yellow is found
between green and
orange.
Blue
Is the colour of the
clear sky and the
deep sea. It is
located between
violet and green on
the optical
spectrum.
Red
Is the color of blood,
and because of this
it has historically
been associated
with sacrifice,
danger and courage.
9. A PICTURE IS WORTH A THOUSAND WORDS
A complex idea can beconveyed with just a
single still image,
namely making it
possible to absorb large
amounts of data quickly.
10. WANT BIG IMPACT? Use big image.
11. USE CHARTS TO EXPLAIN YOUR IDEAS
WHITEGRAY
BLACK
12. OR USE DIAGRAMS TO EXPLAIN COMPLEX IDEAS
Sample TextSample Text
Sample Text
Sample Text
Diagram featured by
http://slidemodel.com
13. AND TABLES TO COMPARE DATA
AB
C
Yellow
10
20
7
Blue
30
15
10
5
24
16
Orange
14. MAPS
our officeMAPS
15. 89,526,124
Whoa! That’s a big number, aren’t you proud?16. 89,526,124$
That’s a lot of money185,244 users
And a lot of users
100%
Total success!
17. OUR PROCESS IS EASY
FirstSecond
OUR
PROCESS
IS EASY
Last
18. LET’S REVIEW SOME CONCEPTS
YellowIs the color of gold, butter
and ripe lemons. In the
spectrum of visible light,
yellow is found between
green and orange.
Blue
Is the colour of the clear
sky and the deep sea. It is
located between violet and
green on the optical
spectrum.
Red
Is the color of blood, and
because of this it has
historically been
associated with sacrifice,
danger and courage.
Yellow
Is the color of gold, butter
and ripe lemons. In the
spectrum of visible light,
yellow is found between
green and orange.
Blue
Is the colour of the clear
sky and the deep sea. It is
located between violet and
green on the optical
spectrum.
Red
Is the color of blood, and
because of this it has
historically been
associated with sacrifice,
danger and courage.
19.
You can copy&paste graphs from Google Sheets20. ANDROID PROJECT
Show and explain yourweb, app or software
projects using these
gadget templates.
Place your screenshot here
21. IPHONE PROJECT
Show and explain yourweb, app or software
projects using these
gadget templates.
Place your screenshot
here
22. TABLET PROJECT
Show and explain yourweb, app or software
projects using these
gadget templates.
Place your screenshot here
23. DESKTOP PROJECT
Place your screenshot hereShow and explain
your web, app or
software projects
using these
gadget templates.
24. THANKS!
Any questions?You can find me at @username & user@mail.me
25. CREDITS
Special thanks to all the people who made and released theseawesome resources for free:
▸ Presentation template by SlidesCarnival
▸ Photographs by Death to the Stock Photo (license)
26.
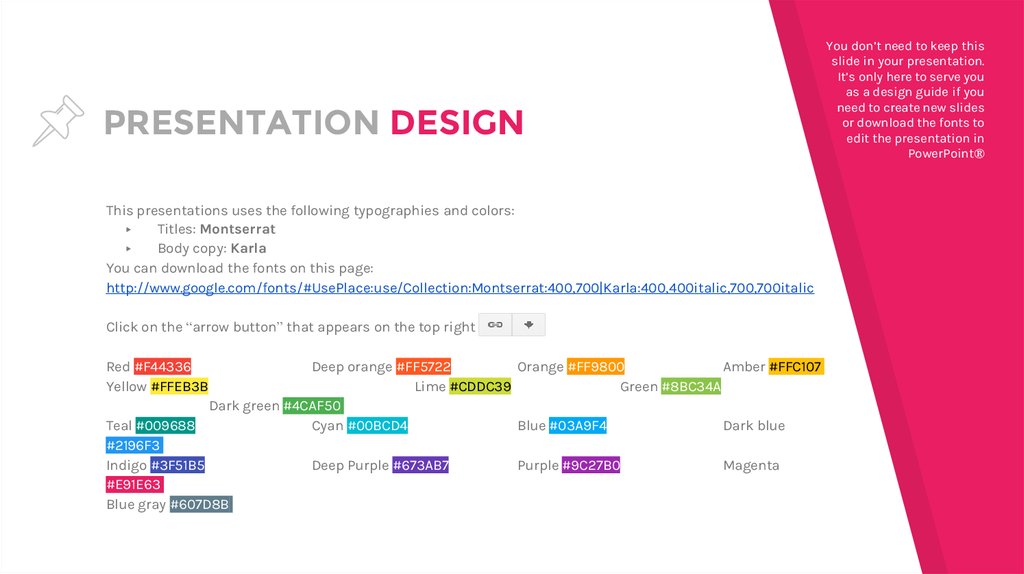
PRESENTATION DESIGNThis presentations uses the following typographies and colors:
▸
Titles: Montserrat
▸
Body copy: Karla
You can download the fonts on this page:
http://www.google.com/fonts/#UsePlace:use/Collection:Montserrat:400,700|Karla:400,400italic,700,700italic
Click on the “arrow button” that appears on the top right
Red #F44336
Yellow #FFEB3B
Deep orange #FF5722
Orange #FF9800
Amber #FFC107
Lime #CDDC39
Green #8BC34A
Dark green #4CAF50
Teal #009688
Cyan #00BCD4
Blue #03A9F4
Dark blue
#2196F3
Indigo #3F51B5
Deep Purple #673AB7
Purple #9C27B0
Magenta
#E91E63
Blue gray #607D8B
You don’t need to keep this
slide in your presentation.
It’s only here to serve you
as a design guide if you
need to create new slides
or download the fonts to
edit the presentation in
PowerPoint®
27.
SlidesCarnival icons are editable shapes.This means that you can:
Resize them without losing quality.
Change line color, width and style.
Isn’t that nice? :)
Examples: