Похожие презентации:
Первичная структура, идентификация белка. Масс-спектрометрия
1. Лекция 2
1. Первичная структура, идентификация белка.Масс-спектрометрия. Спектральные методы (CD,
IR, Raman). Нативная структура, денатурация и
агрегация белка. Методы исследования
стабильности белков (CD, DSC, DSF). Примеры.
Николай Николаевич Случанко
2. План 6 лекций
1.Методы определения размера, массы, олигомерного состояния и
гидродинамических свойств белков (EM, AFM, DLS, AUC, SEC, AF4). Примеры.
2.
Первичная структура, идентификация белка. Масс-спектрометрия.
Спектральные методы (CD, IR, Raman). Нативная структура, денатурация и
агрегация белка. Методы исследования стабильности белков (CD, DSC,
DSF). Примеры.
3.
Рентгеновская кристаллография (macromolecular crystallography, MX).
Нейтронная и электронная кристаллография. Работа со структурными
моделями (PBD и PyMOL). Примеры.
4.
Малоугловое рассеяние лучей (SAXS и SANS). Примеры
5.
Другие методы исследования структуры белков (NMR, Cryo-EM, Cryoelectrotomography, native-MS, HDX-MS). Интегральный подход и
моделирование белков по гомологии (iTasser). Примеры.
6.
Методы исследования белок-белковых взаимодействий (Co-IP, equilibrium
dialysis, ITC, SPR, BLIC, MST, QMb, SESC). Примеры.
3. Стандартные аминокислоты, входящие в состав белков
4. Различные уровни структурной организации белков
5. Мы выделили и очистили рекомбинантный белок, знаем, какая должна быть его последовательность, что дальше? Как ее проверить? Или
7 бед – один ответМы выделили и очистили рекомбинантный белок, знаем, какая должна быть
его последовательность, что дальше? Как ее проверить?
Или
Видим появление некоторого белка, но не знаем, что это за белок?
Или
Полученный белок представлен несколькими полосами в ПААГ. Что за
полосы?
Или
Белок модифицирован, но по каким участкам?
Или
Полученный белок меньше по размеру, чем ожидали, как выяснить, почему?
Или
В препарате присутствует грязь, что это?
Или
Производим химическое «сшивание» белкового олигомера, хотим понять,
боковые цепи каких остатков задействованы?
6. Mass-spectrometry
• A toolkit of methods to accurately determine masses in a sampleRequired steps:
• Ionization is the required step (ions with different masses will
show different properties)
• Acceleration and separation of ions
• Detection of different ions (m and z) to get a spectrum
Purposes:
• Protein identification
• Impurities detection
• Study of modifications (e.g., PTMs)
More sophisticated approaches:
• Proteomic scale analysis of proteomes and its changes
• Analysis of the oligomeric distribution and complexes (native-MS)
7. Принцип метода
mИонизируем молекулы,
переводим ионы в газовую фазу
и делим их по отношению m/z
z
Семенюк П.И.
8.
Способы ионизации для МС9.
Способы ионизации для МСESI
10.
Способы ионизации для МСESI
MALDI
11.
Семенюк П.И.12.
Снова про разрешение…m
R
Δm
13.
14. Как посчитать массу иона, зная соседние пики m/z ?
Пример15. Способы разделения ионов
TOFCombinations are often used!
Ion Trap
Quadrupole
Magnetic sector
16. МС подходы к идентификации и характеристике белка: «прямой» и «кверх ногами»
http://www.chromatographyonline.com/top-downversus-bottom-approaches-proteomics-017. Применимость анализаторов ионов для top-down
18. Two types of the “bottom-up” protein identification
Peptide mass fingerprinting after proteolytic digestion and comparison with thepredicted masses derived from the “idealistic” cleavage by this enzyme
• only pure proteins or very simple mixtures
• can be ambiguous as several identical masses may be derived from different
proteins
• Can be done on MS/MS instruments, but also on MALDI-TOF.
Tandem MS (or MS/MS)
• Ion is separated from others and subjected to fragmentation within the
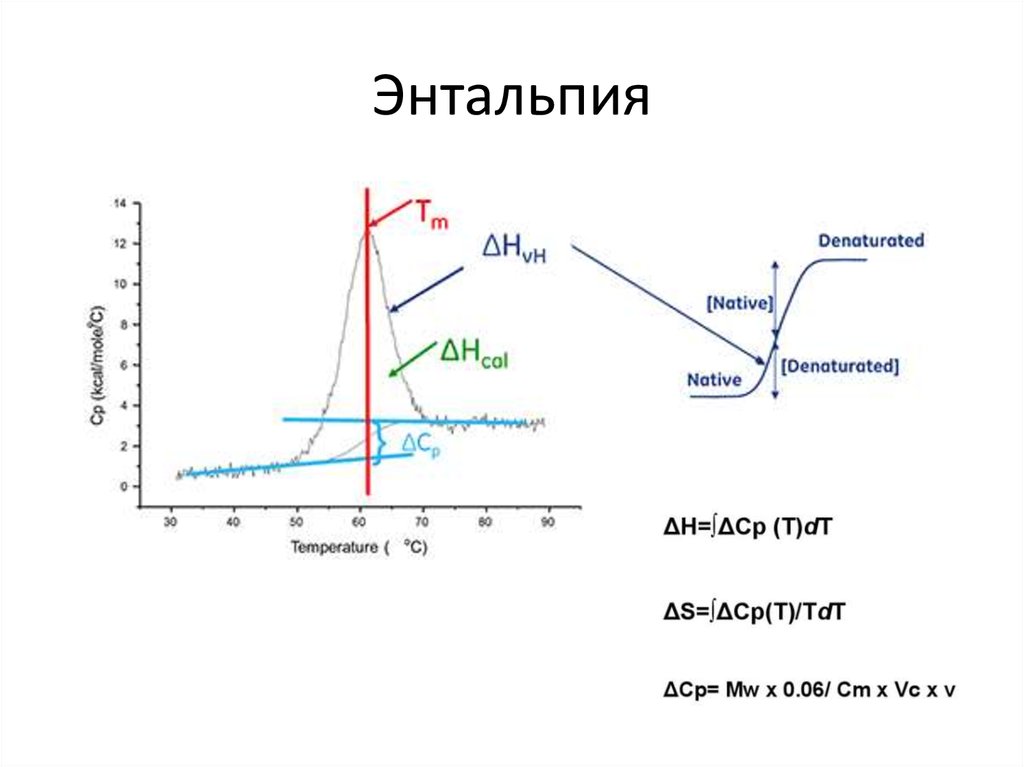
instrument
• The aa sequence is deduced from the masses of fragment ions
• Basically, de novo sequencing of a protein
• Is not subject to high-throughput analysis
• “Uninterpreted” proteomics (product ion spectra are cross-correlated with the
databases to find an annotated protein giving the same spectrum
19.
Как правило,однозарядные ионы ->
тривиальное
определение их массы
из m/z
20. Тандемная масс-спектрометрия
21. Monoisotopic masses of amino acids
Identical masses!Similar masses!
Identical masses!
Similar masses!
80Da phosphorylation
22. Тандемная масс-спектрометрия
23. MS/MS for indentifying terminal truncations in protein sequence
>sp|O14558|1-160MEIPVPVQPSWLRRASAPLPGLSAPGRLFDQRFGEGLLEAELAALCPTTLAPYYLRAPSV
ALPVAQVPTDPGHFSVLLDVKHFSPEEIAVKVVGEHVEVHARHEERPDEHGFVAREFHRR
YRLPPGVDPAAVTSALSPEGVLSIQAAPASAQAPPPAAAK
>sp|O14558|1-160
MEIPVPVQPSWLRRASAPLPGLSAPGRLFDQRFGEGLLEAELAALCPTTLAPYYLRAPSV
ALPVAQVPTDPGHFSVLLDVKHFSPEEIAVKVVGEHVEVHARHEERPDEHGFVAREFHRR
YRLPPGVDPAAVTSALSPEGVLSIQAAPASAQA
24. MS/MS for indentifying PTMs
MS/MS spectrum of the 1641 Da phosphopeptideMS spectrum
…RSpSWRVVSSIEQK…
m/z
m/z
25. Конец лекции 18.11.19
26. Secondary structure elements
α-helix
β-strand
Turns and loops
Random coil
Protein conformation is stabilized largely by
weak interactions and is therefore labile
>sp|O14558|1-160
MEIPVPVQPSWLRRASAPLPGLSAPGRLFDQRFGEGLLEAELAALCPTTLAPYYLRAPSV
ALPVAQVPTDPGHFSVLLDVKHFSPEEIAVKVVGEHVEVHARHEERPDEHGFVAREFHRR
YRLPPGVDPAAVTSALSPEGVLSIQAAPASAQAPPPAAAK
27. Предсказание вторичной структуры белка по его последовательности
http://www.compbio.dundee.ac.uk/jpred4/index_up.html28. Secondary structure prediction based on STARD1 protein sequence
using a neural network called Jnetalpha helix ('H'), beta sheet ('E') or not H or E ('-')
What is the real secondary structure composition of
a given protein?
29. Light Spectrum
30. Изменение энергии молекулы (ΔЕ) при взаимодействии с квантом света (hν)
https://biomolecula.ru/articles/spektroskopiia-kr-novye-vozmozhnosti-starogo-metoda31. Main protein chromophores
32. Absorption in far-UV by secondary structures
The differences in the linear absorption exist, but are not sufficient to tellthe secondary structure composition in a protein
33. Chirality and optical activity
34. α-helices and β-cheets are optically active
35. Polarization of light
36. Polarization of light
https://www.youtube.com/watch?v=8YkfEft4p-w37. Circularly polarized light can be absorbed
38. Units of CD
Дихроичное поглощениеМолярный
дихроизм
Молярная
эллиптичность
Молярный
дихроизм
39. Far-UV CD spectroscopy
40. Far-UV CD spectroscopy
The resulting spectra are a combination of
contributions from alpha-helical, betastranded, and random coil structural
elements
CD spectra of a protein can be
deconvoluted using the reference spectra
to derive the proportion of α, β, random
coils
41. Alpha-helix content determination using an empirical formula
Θ 208 4000%α
29000
Greenfield, N.; Fasman, G. D. Biochemistry
1969, 8, 4108–4116.
42.
43. STARD1 far-UV spectrum analysis using DichroWeb
Sluchanko et al Prot. Exp. Purif. 201644. Applications
• Determination of 2° structure content in a protein of interest• The effect of ligand binding on the 2° structure of a protein
• Effect of mutations and modifications on the 2° structure
• Conformational changes in response to buffer composition changes
• Protein folding and unfolding
• Protein-protein interactions
• Kinetics of 2° structure changes in response to anything
45.
Stabilization of a protein by its partnerpH-dependent conformational change
53°C
49.5°C
Sluchanko et al Biochemistry 2012
Busch et al JBC 1998
46.
Monomerization of a protein reduces the stability of its alpha-helical structureEngineered
mutation
Sluchanko, Uversky BBA Proteins 2015
47. Far-UV CD
Very convenient, sensitive, non-invasive technique
Small sample consumption (50-100 µl, 0.5-1 mg/ml), sample can be re-used!
Very good for a-helical proteins, worse for unfolded and beta-folded proteins
Nitrogen gas is used to minimize O2 associated absorbance
Equipment is expensive!
Chirascan (Applied Photophysics)
48. Aromatic residues are chromophores
Near-UV• Resonance double bonds
• Absorb UV light around 280 nm
• Proteins therefore give characteristic Abs spectra, which is useful for their detection
49. Near-UV CD for assessment of tertiary structure features
Higher protein Cthan for far-UV CD,
the signals are
weak!
UV region
Is sensitive to the environment!
Far-UV (190-260 nm)
Near-UV (250-320 nm)
50.
Near-UV CD indicates that mutation inalpha-B crystallin affects both its 2°
and 3° structure
For wild-type αB-crystallin
10% α-helix,
44% β-sheet,
45% unfolded
For R120G αB-crystallin
15% α-helix
33% β-sheet
52% unfolded
Bova et al PNAS 1999
CD is not great for beta-structured proteins!!!
51. Fourier-Transform Infrared (FTIR) spectroscopy
Michelson interferometerX axis – wavenumbers (cm-1)
1650 cm-1 = 0.01/1650 ~ 6 µm = 6000 nm
Many frequences are present in the
incident beam at a time!
Analysis of molecular vibrations!
52. Interference
53. Interference
54. Interferometer
55. FTIR spectroscopy requires Fourier transformation of raw data to get spectrum
Time or mirror positionThe FTIR interferogram (dependence on the mirror position) is transformed into
spectrum (wavelength dependence) by Fourier transformation
56. Fourier transform
Signal in time domainSignal in frequency domain
57.
58. Buffer subtraction from sample
• Water absorbs !• Analysis in thin films and cuvettes, capillaries
59. FTIR spectroscopy for studying 2° structures
The workflow for structure analysis:i)
measurement of the protein sample
extinction
ii) amide I band decomposition
iii) integration of the calculated
components
α
β
60.
Protein bands in a FTIR spectrum61. Processing of the raw spectrum
raw spectrumCurve-fitted inverse
derivative spectrum
2nd derivative
62. Unfolding of HSPB8 induced by temperature as monitored by FTIR
20C12% α-helix
33% β-sheet
55% unfolded
70C
0% α-helix
18% β-sheet
82% unfolded
Kazakov et al Biophys Chem 2009
63. Raman spectroscopy
Complimentary to IR spectroscopy, but relies on scattering instead of absorptionPossibility to measure directly in water, non-invasively, while IR is absorbed by water
64. Raman spectroscopy
Elastic scatteringC.V. Raman,
1930 Nobel Prize
Raman scattering
Must be filtered out!
Очень слабые сигналы!
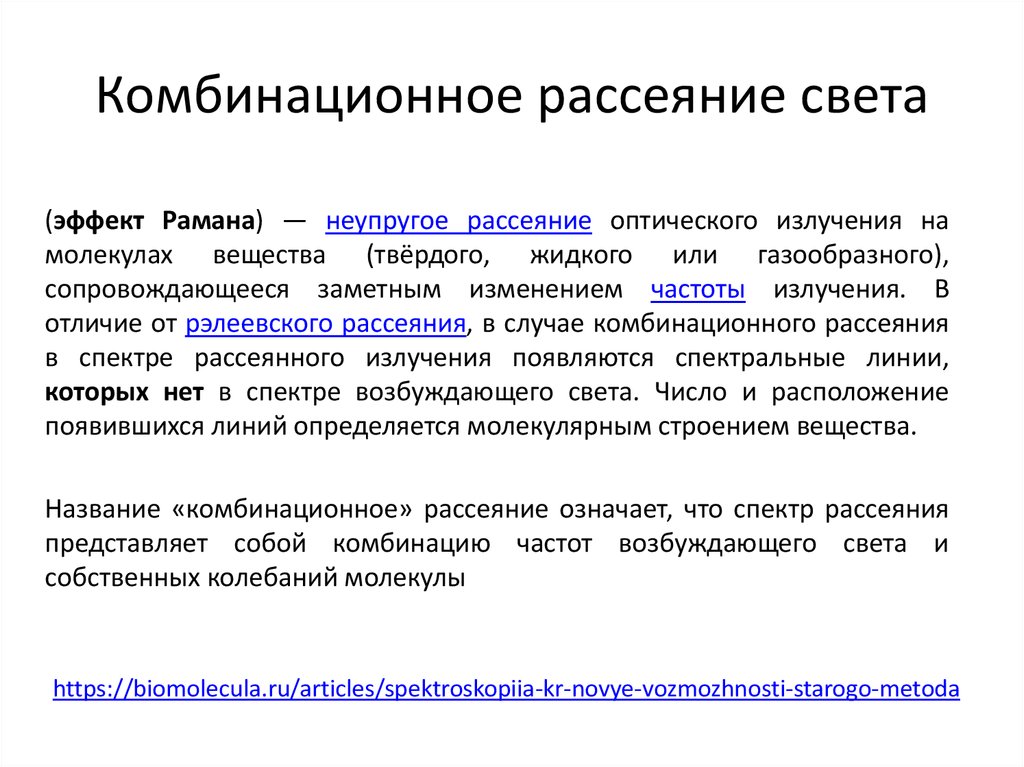
65. Комбинационное рассеяние света
(эффект Рамана) — неупругое рассеяние оптического излучения намолекулах вещества (твёрдого, жидкого или газообразного),
сопровождающееся заметным изменением частоты излучения. В
отличие от рэлеевского рассеяния, в случае комбинационного рассеяния
в спектре рассеянного излучения появляются спектральные линии,
которых нет в спектре возбуждающего света. Число и расположение
появившихся линий определяется молекулярным строением вещества.
Название «комбинационное» рассеяние означает, что спектр рассеяния
представляет собой комбинацию частот возбуждающего света и
собственных колебаний молекулы
https://biomolecula.ru/articles/spektroskopiia-kr-novye-vozmozhnosti-starogo-metoda
66. Выявление различных веществ по ключевым пикам на спектре КР сложной смеси
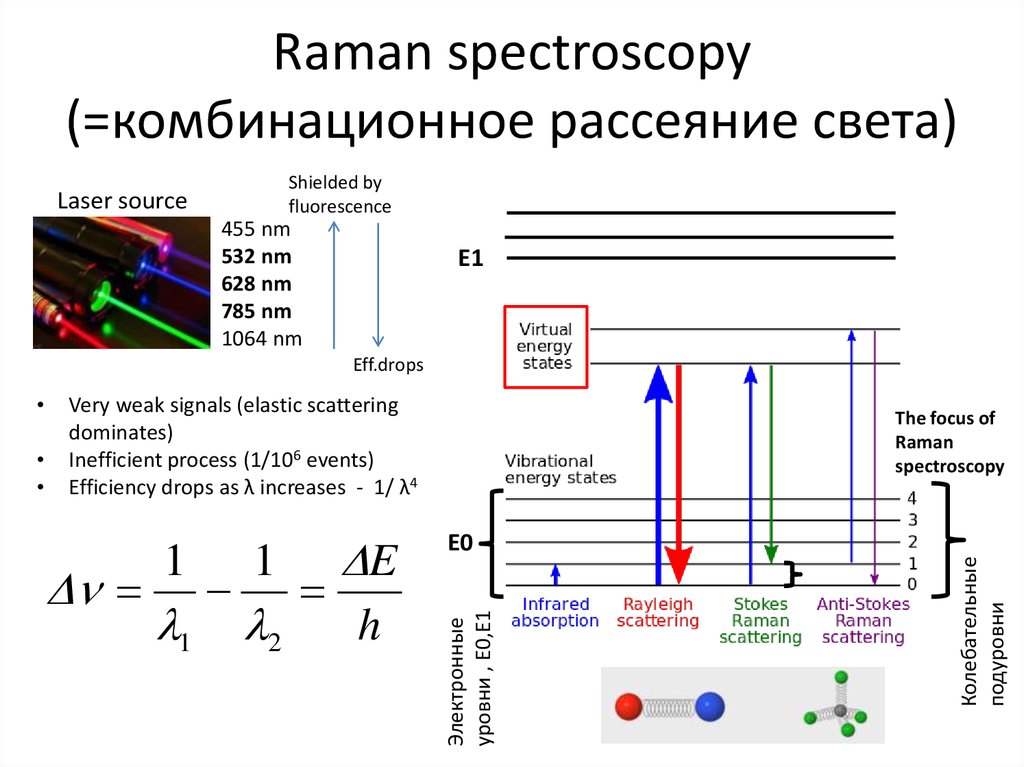
67. Raman spectroscopy (=комбинационное рассеяние света)
Shielded byfluorescence
Laser source
455 nm
532 nm
628 nm
785 nm
1064 nm
E1
Eff.drops
1
1
1
2
E
h
The focus of
Raman
spectroscopy
E0
Колебательные
подуровни
Very weak signals (elastic scattering
dominates)
Inefficient process (1/106 events)
Efficiency drops as λ increases - 1/ λ4
Электронные
уровни , E0,E1
68. Raman spectroscopy (=комбинационное рассеяние света)
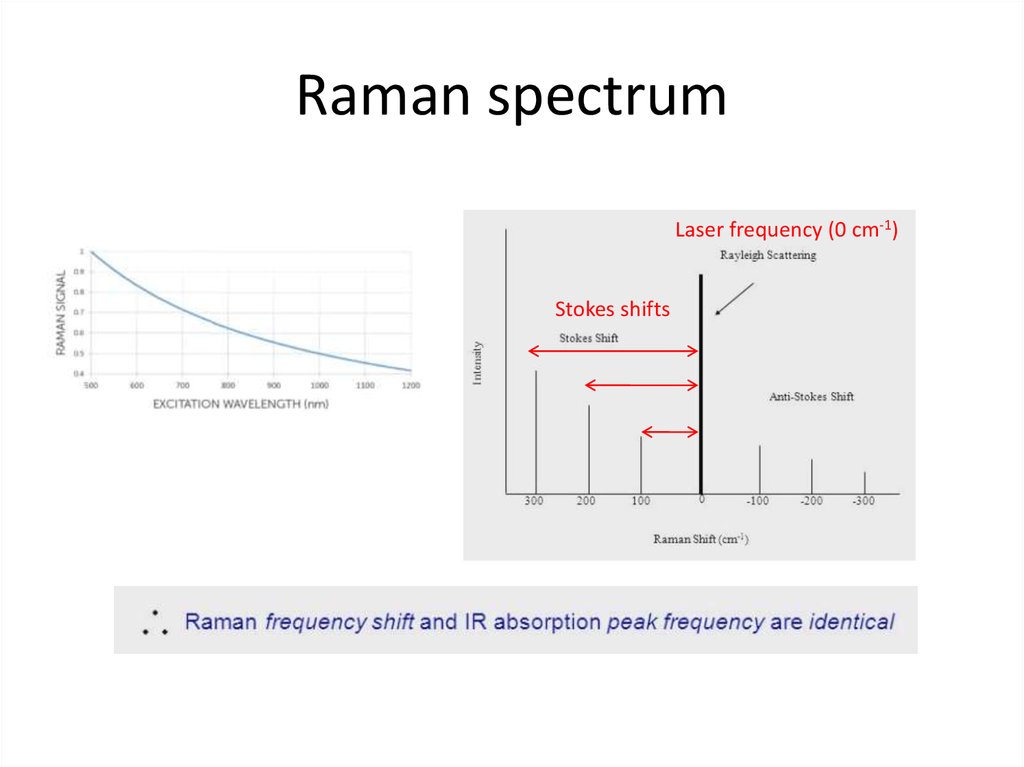
69. Raman spectrum
Laser frequency (0 cm-1)Stokes shifts
70. Raman spectrum
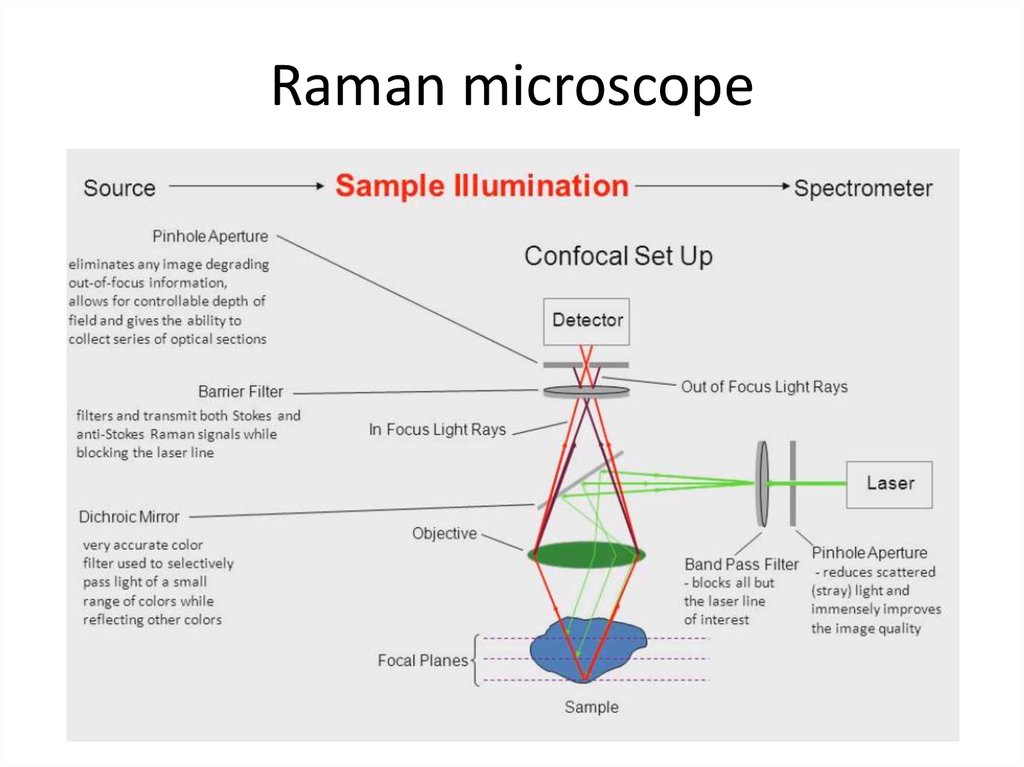
71. Raman microscope
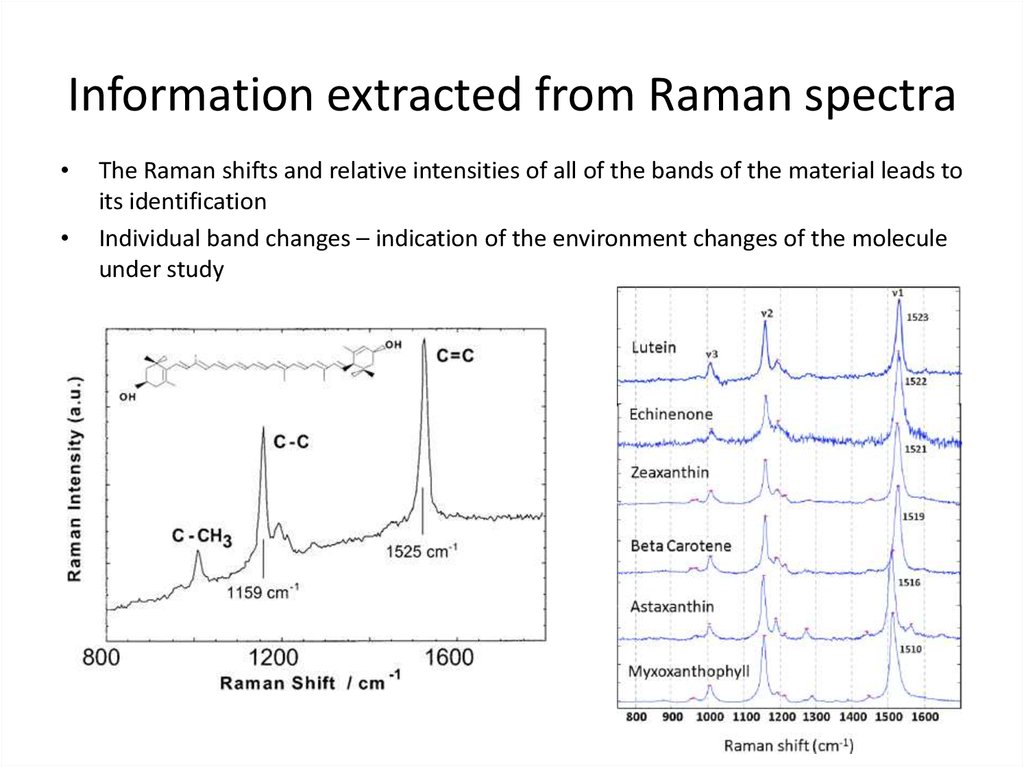
72. Information extracted from Raman spectra
The Raman shifts and relative intensities of all of the bands of the material leads to
its identification
Individual band changes – indication of the environment changes of the molecule
under study
73. Raman spectra – protein 2° structure
Resonance Raman spectra – near the electronic transition frequency
F – Phe
Y – Tyr
W – Trp
Curr Opin Struct Biol. 2008 Oct; 18(5): 623–629.
74. Intrinsic fluorescence and tertiary structure
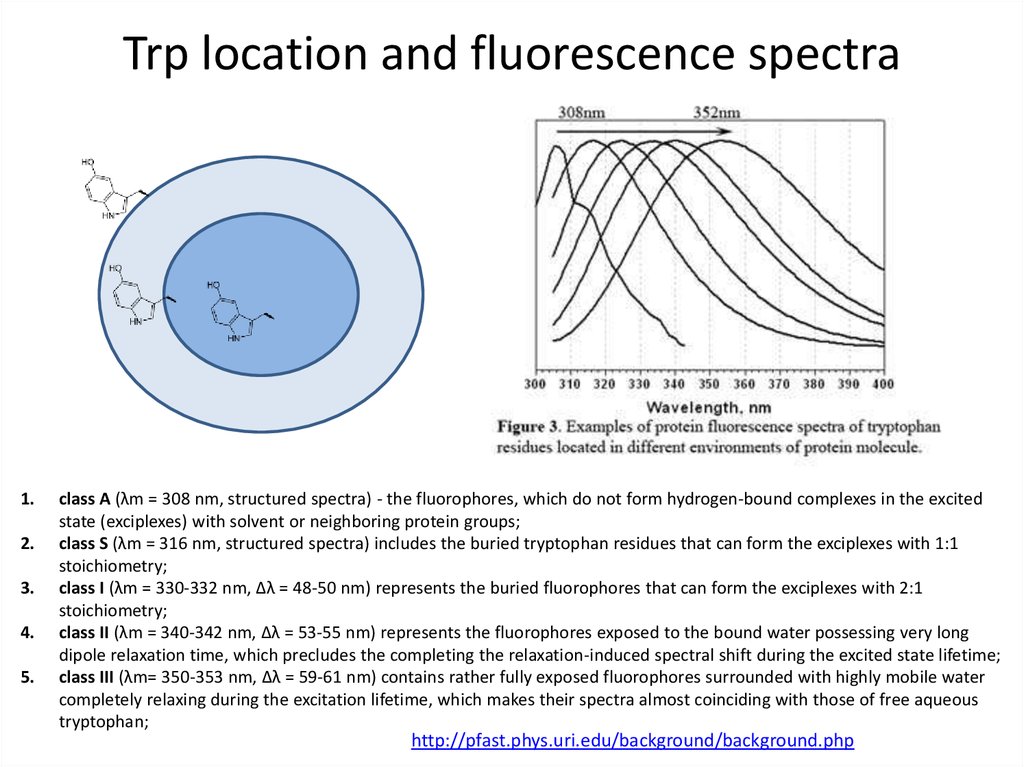
Stokes (red) shift75. Trp location and fluorescence spectra
1.2.
3.
4.
5.
class A (λm = 308 nm, structured spectra) - the fluorophores, which do not form hydrogen-bound complexes in the excited
state (exciplexes) with solvent or neighboring protein groups;
class S (λm = 316 nm, structured spectra) includes the buried tryptophan residues that can form the exciplexes with 1:1
stoichiometry;
class I (λm = 330-332 nm, Δλ = 48-50 nm) represents the buried fluorophores that can form the exciplexes with 2:1
stoichiometry;
class II (λm = 340-342 nm, Δλ = 53-55 nm) represents the fluorophores exposed to the bound water possessing very long
dipole relaxation time, which precludes the completing the relaxation-induced spectral shift during the excited state lifetime;
class III (λm= 350-353 nm, Δλ = 59-61 nm) contains rather fully exposed fluorophores surrounded with highly mobile water
completely relaxing during the excitation lifetime, which makes their spectra almost coinciding with those of free aqueous
tryptophan;
http://pfast.phys.uri.edu/background/background.php
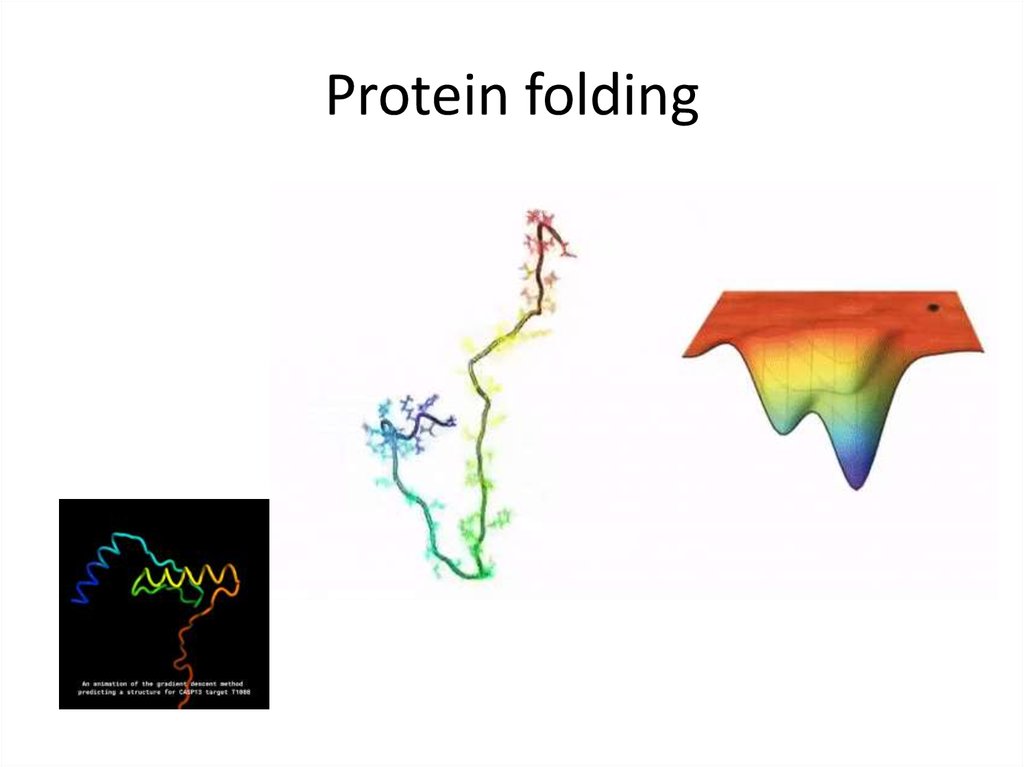
76. Protein folding
77. Protein quality control
78. Thermal stability of proteins
Thermal shift assays:Enzyme activity (T)
CD
DSF
DSC
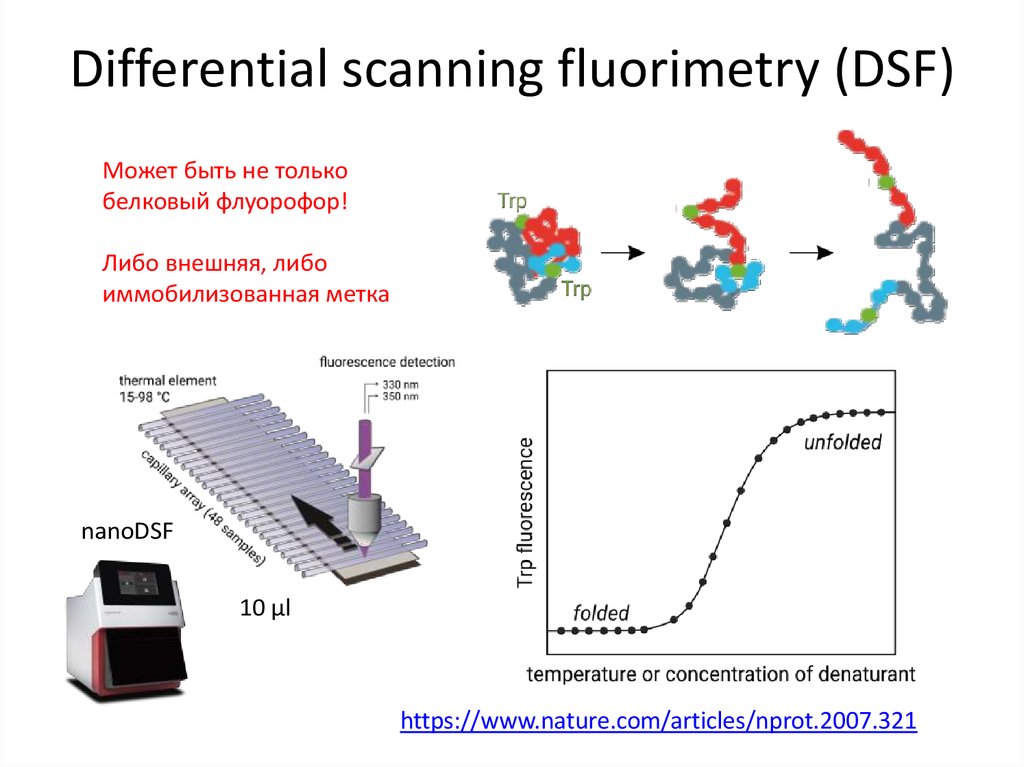
79. Differential scanning fluorimetry (DSF)
Может быть не толькобелковый флуорофор!
Либо внешняя, либо
иммобилизованная метка
nanoDSF
10 µl
https://www.nature.com/articles/nprot.2007.321
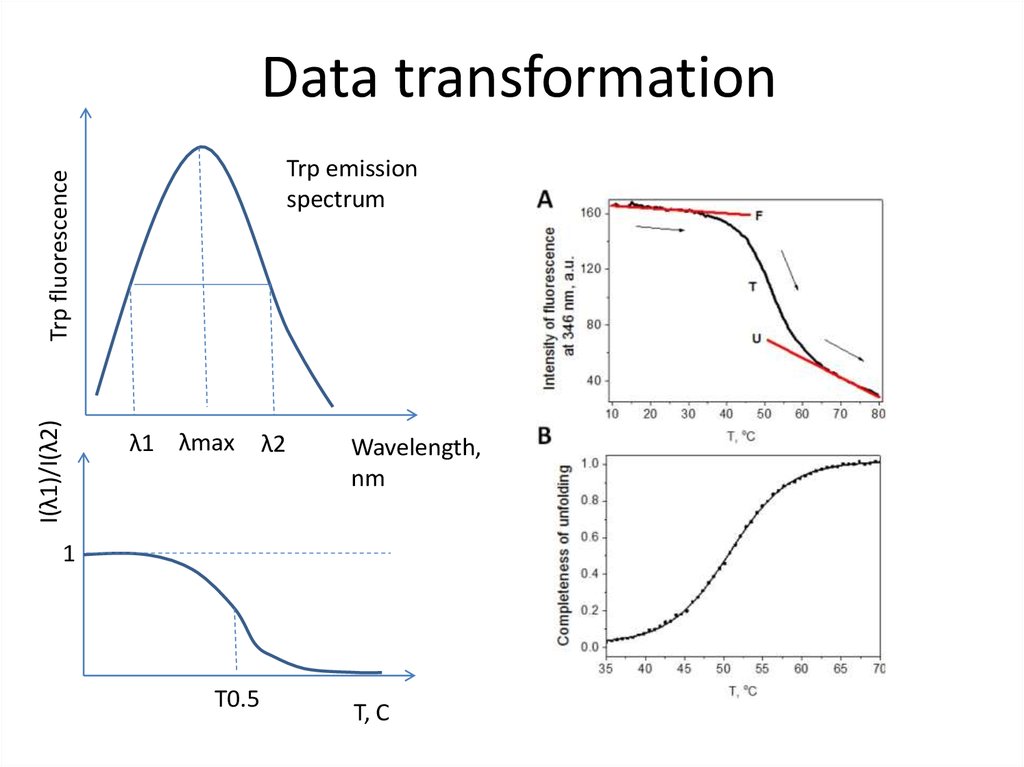
80. Data transformation
I(λ1)/I(λ2)Trp fluorescence
Trp emission
spectrum
λ1 λmax
λ2
Wavelength,
nm
1
T0.5
T, C
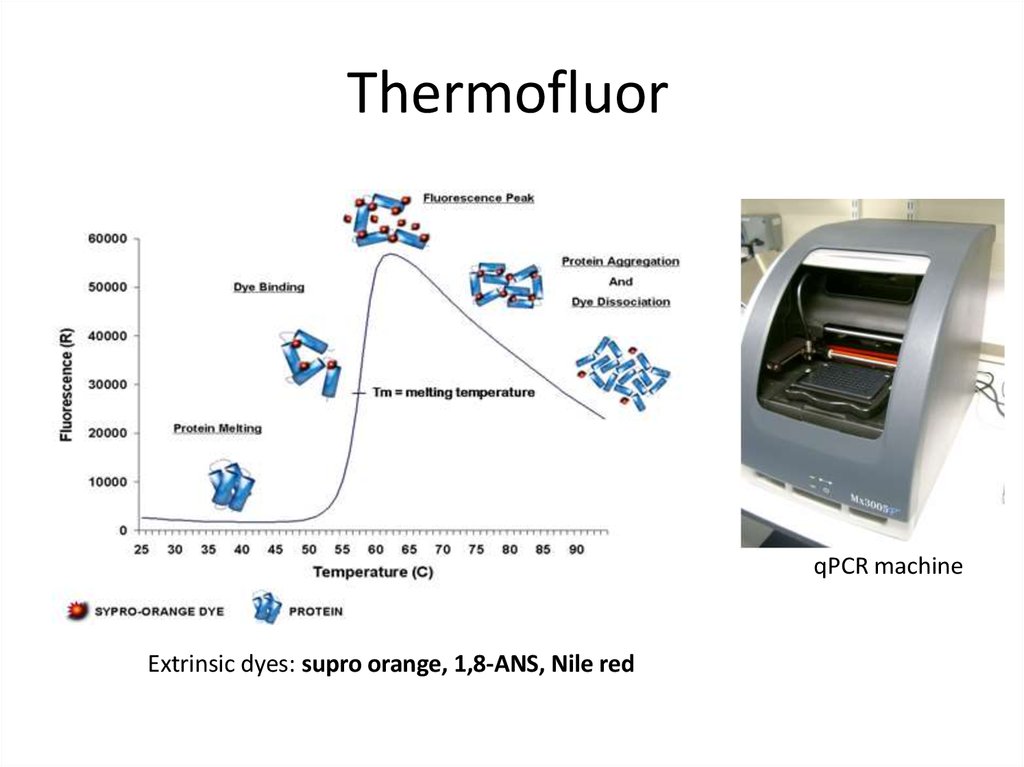
81. Thermofluor
qPCR machineExtrinsic dyes: supro orange, 1,8-ANS, Nile red
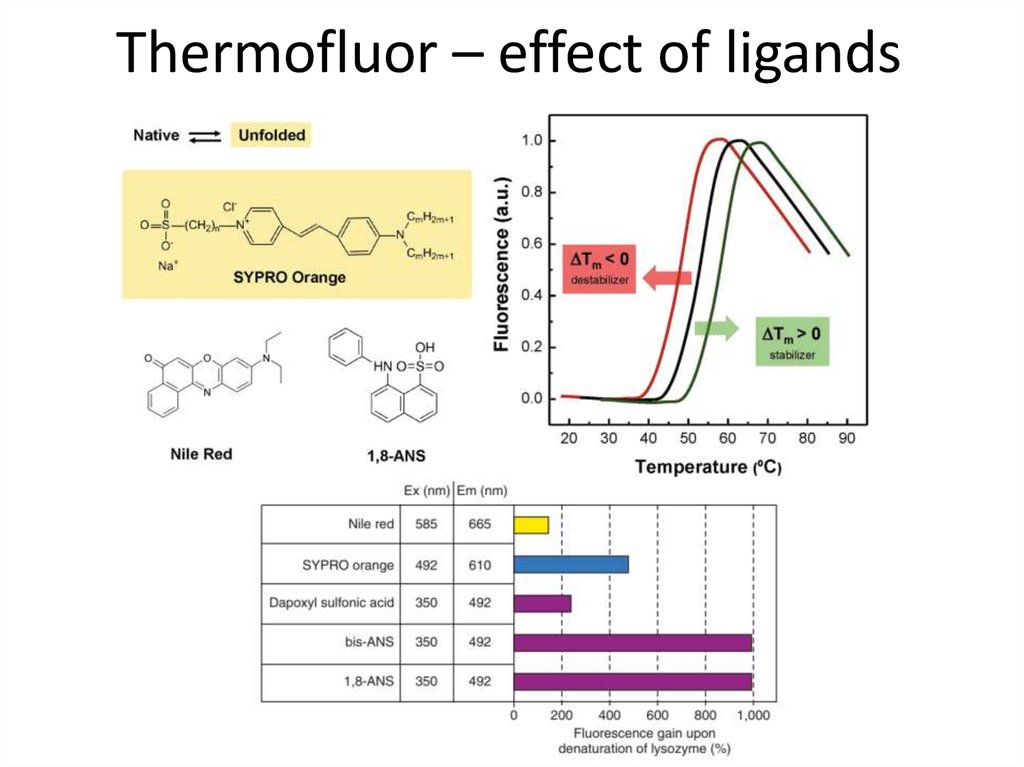
82. Thermofluor – effect of ligands
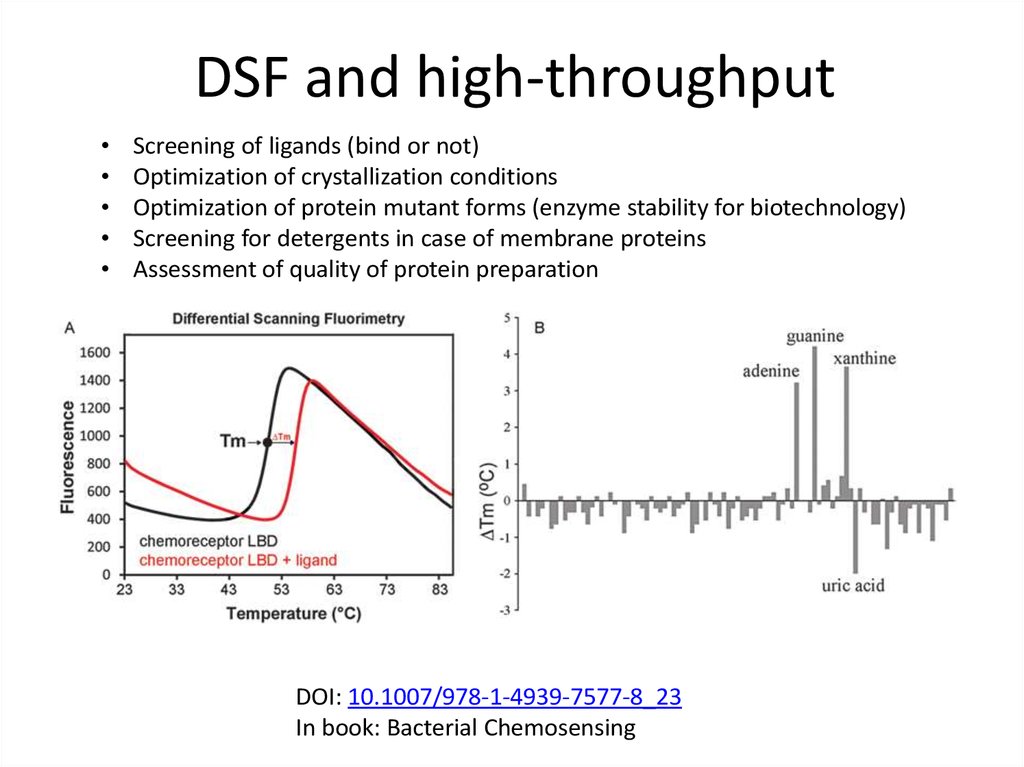
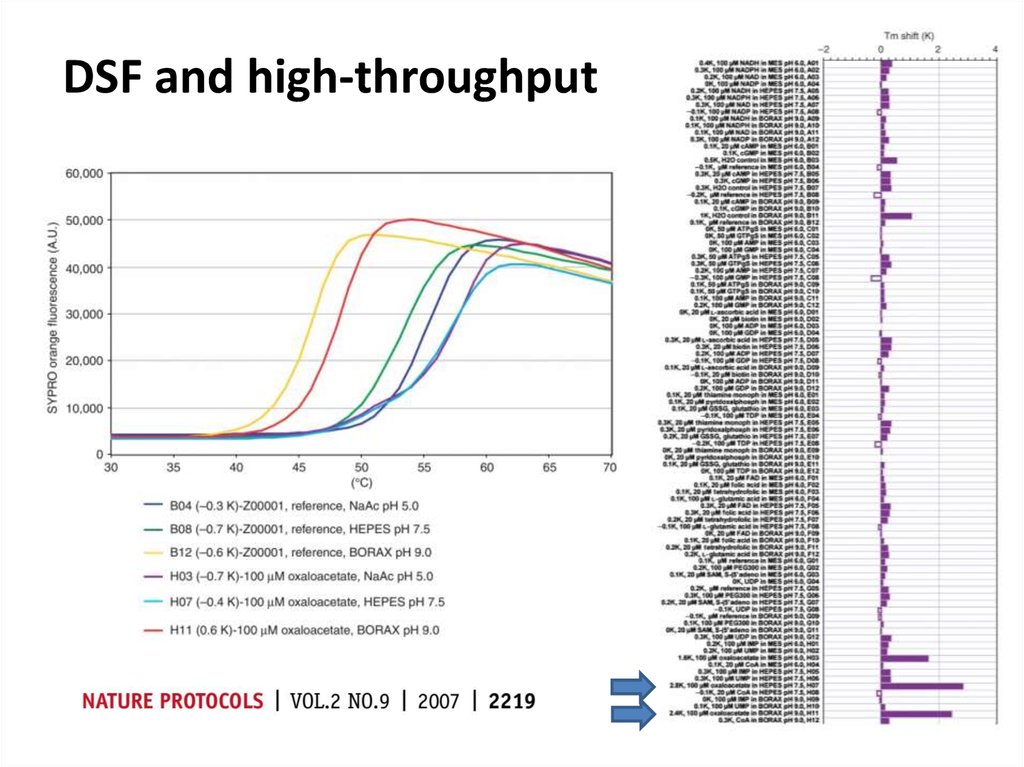
83. DSF and high-throughput
Screening of ligands (bind or not)
Optimization of crystallization conditions
Optimization of protein mutant forms (enzyme stability for biotechnology)
Screening for detergents in case of membrane proteins
Assessment of quality of protein preparation
DOI: 10.1007/978-1-4939-7577-8_23
In book: Bacterial Chemosensing
84. DSF and high-throughput
85. Дифференциальная сканирующая калориметрия (ДСК, DSC)
86. Теплота и калория
Количество энергии, которое теряет или получает тело в течениевремени в форме теплового потока
Единица измерения – Джоуль или калория
Приборы, измеряющие теплоту, выделяемую или поглощаемую в
различных процессах – калориметры
Фактически регистрируются тепловые эффекты (отдача или
поглощение тепла), сопровождающие изменения в образце в
условиях программирования температуры
Дифференциальный способ анализа – разность температур между
неким эталоном и образцом
87. Принцип метода ДСК
ДСК основан на нагревании или охлаждении образца и эталона с заданнойскоростью при сохранении их температур и измерении теплового потока,
поддерживающего температуру образца в пределах заданной программы
(например, 1 град С в минуту) – при сканировании
нагревателю ячейки с образцом придется работать усерднее, чем нагревателю
под эталоном. Он должен выделять больше тепла. И насколько именно больше
- цель опыта ДСК
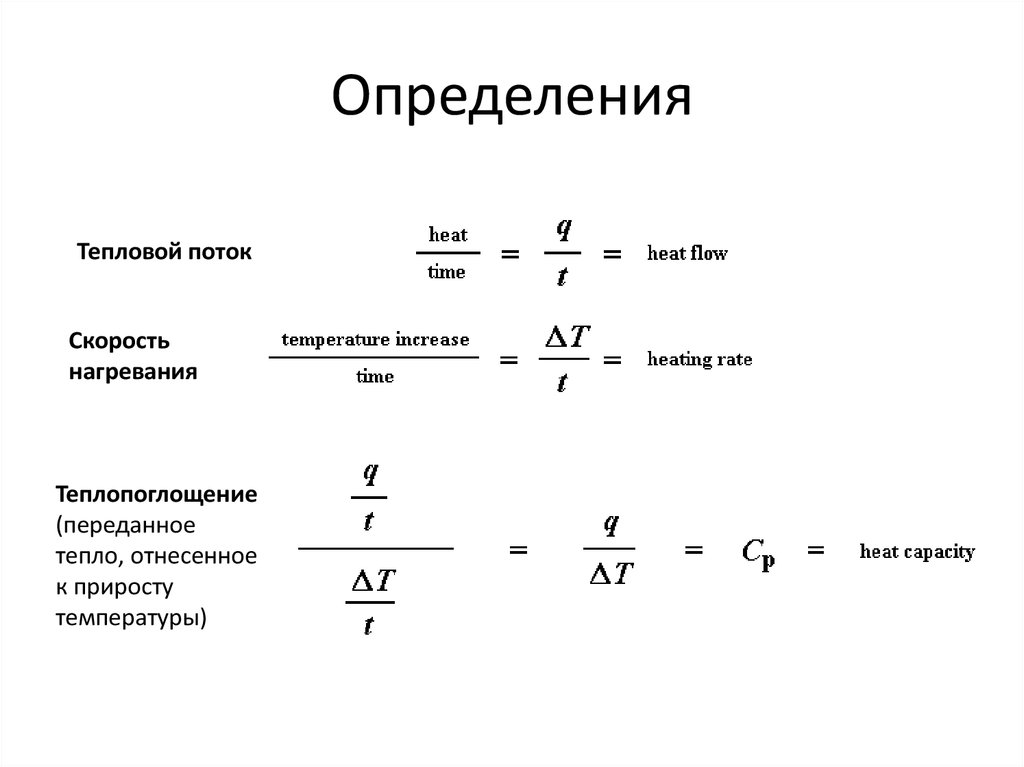
88. Определения
Тепловой потокСкорость
нагревания
Теплопоглощение
(переданное
тепло, отнесенное
к приросту
температуры)
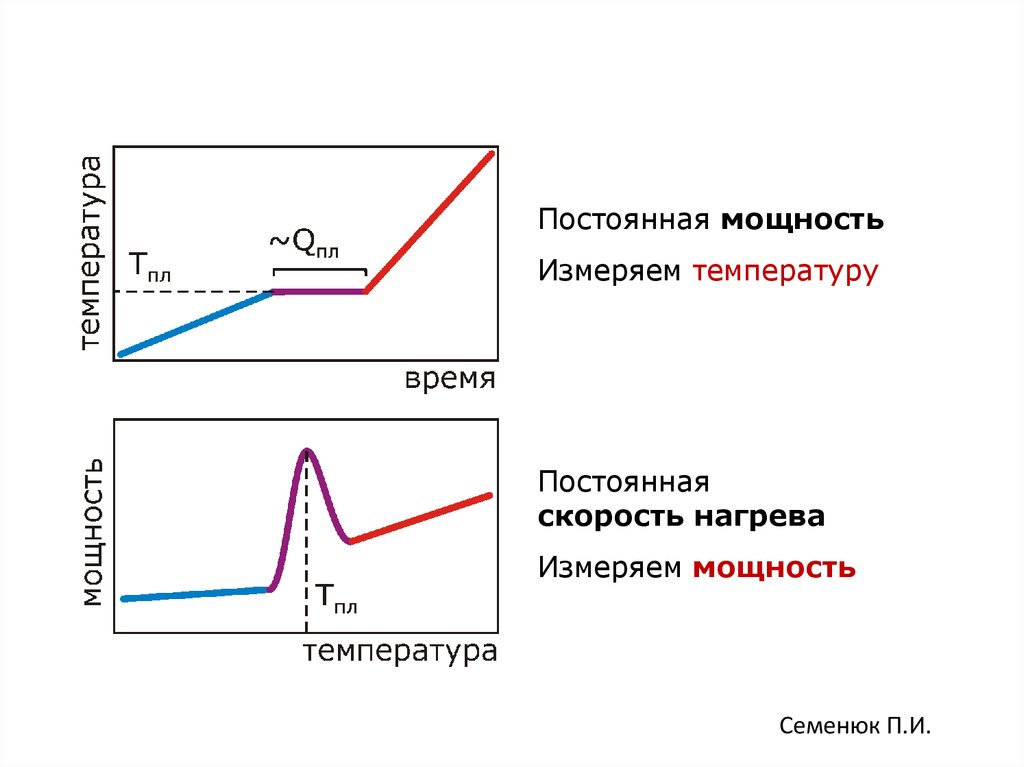
89. Взаимосвязь потока тепла в единицу времени (мощность) и температуры
Постоянная мощностьИзмеряем температуру
Постоянная
скорость нагрева
Измеряем мощность
Семенюк П.И.
90.
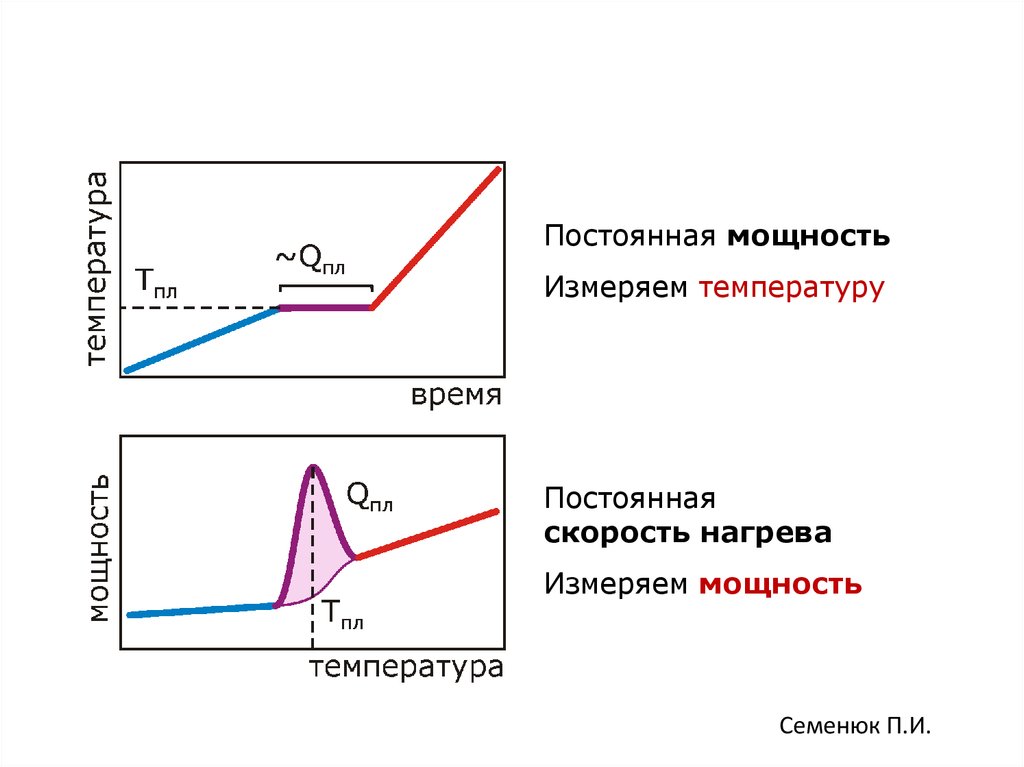
Постоянная мощностьИзмеряем температуру
Постоянная
скорость нагрева
Измеряем мощность
Семенюк П.И.
91.
Постоянная мощностьИзмеряем температуру
Постоянная
скорость нагрева
Измеряем мощность
Семенюк П.И.
92. Эндотермические и экзотермические тепловые эффекты
93. Что получаем в итоге опыта?
94. Энтальпия
95. Калориметрия мультидоменных белков
96. Сочетание разных методов изучения термостабильности
97. Требования к образцу и установке
• Образец не должен взаимодействовать с материалом измерительнойячейки (платина)
• Нужно предотвратить выкипание образца (давление)
• Нужно хороший тепловой контакт образца с тепловым сенсором и
предотвратить агрегацию белка (тонкие капиллярные ячейки)
50 образцов в день
2-5 образцов в день
















 Химия
Химия