


 Психология
 Физика
Похожие презентации:


Wellbeing
1.
What is wellbeing?Like Wikipedia says:
Well-being, wellbeing, welfare or
wellness is a general term for
the condition of an individual
or group, for example their
social, economic,
psychological, spiritual or
medical state.
And one of the main tasks of
technology nowadays is to
make our well-being high and
comfortable. There are a lot
of things that make it high
amoung them thermal
comfort.
2.
Why is thermal comfort soimportant?
Bell & Greene (1982) in Evans &
Cohen (1987) stated that if core body
temperature is above of 37ºC this can
cause heatstroke, fatigue, and ultimately
death.
According to Fanger (1982),Vitelg & Smith
(1946) in Altman & Stokol (1987), human
intellect performance, and perception in
general will reach its maximum potential if
the human is in a comfortable thermal
condition.
3.
Thermal indexIn 1923, Houghten and Yaglou began their
study to seek the a thermal index . Three
parameters in physical variables, air
temperature, humidity, and air velocity are
combined in the equation of ET (Effective
temperature). ET thermal index gives a
value that is defined as comfortable or
uncomfortable. With the developing of this
principle the PVM model was made.
4.
PMV?Model of room thermal comfort performance
quality used to define the standard of air
control design ISO 7730.
The researches showed that this model isn't
really effective for office buildings in Jakarta
and houses of Surabaya and Yogyakarta,
Indonesia, so the question is if it will be
effective for teaching rooms of universities
in Yogyakarta.
5.
ProblemSo the problem
sounds like:
Is the PMV index model
effective in predicting
thermal comfort in
learning activity rooms
in a warm humid
tropical climate zone,
Yogyakarta Indonesia?
6.
The problem solving strategyThe assessment of the significance of the
difference between the value of PMV with
the value of the real vote.
If there is a significant difference between
PMV and real vote-> the model isn't
effective, from the other hand if there is no
such difference then the model is effective.
7.
Objective, Hypothesis andResearch Boundary
The objective is to asses if model is
effective or not in predictable of thermal
comfort.
There are 2 hypothesis: 1)Ho: There is no
difference between PMV and real vote-> the
model is effective, 2)Ha: there is a
difference-> model isn't effective
The research boundary are the rooms for
learning and teaching
8.
The variables of thermal comfortClimatic physical variables:
1. Air temperature
2. Mean radiant temperature
3. Air Velocity
4. Relative humidity
Personal physiological variables
1.Level of metabolism
2.Thermal resistance of clothing
These Variables can help to predict the thermal comfort.
9.
PMV modelH-Ed-Esw-Erc-L=K=R+C(Fanger thermal comfort formula) H:
Internal heat production of body
Ed: diffusion heat loss in the skin
Esw: sweat evaporation heat loss at the skin surface. Ere: latent heat loss
by lung respiration
L: respiration heat loss. K: heat exchange from the
clothed skin surface to the outer clothed surface.
R : radiation
heat loss from the outer clothed skin surface to the environment
C:
convection heat loss
This formula is very complicated to use manually so computer software is
needed here(for instance ASHRAE)
10.
The Bias of PMV in The YogyakartaClimate Building Context
The climate characteristics of Yogyakarta
are parallel with the conditions that cause
significant bias between PMV and the real
vote on the field. Therefore it can be
predicted that there is significant difference
between the value of PMV and the value of
the real vote on the field.
11.
Research methodLocation, Place and Sample
Data Collecting
The Method of Data Analysis
12.
Location, Place and SampleThe location of research is Yogyakarta
Indonesia. The place of research is the
building of the Civil Engineering and
Planning Faculty, Islamic University of
Indonesia.Four samples of rooms are
used. Three of those samples are
architecture studios and one of those
samples is a classroom. The samples of
occupants are students and lecturers
comprising approximately eighty two
respondents.
13.
Data collectingMeasurement with appropriate tools: air
temperature, mean radiant, air velocity,
relative humidity
Observation: Activity data
Questionnaire: the level of thermal comfort
that people experience, clothes that they
wear
14.
The Method of Data Analysis1) The transformation of raw data to basic
information using ASHRAE
2) The method to assess the hypothesis.
Analytical method to prove the hypothesis
is the statistical method of mean
comparison of pair samples that is done by
SPSS 11.00
15.
Results and Conclusions16.
Describing of resultsThe characteristics of PMV in cases as described in
figure 1 can be seen. The mean of the PMV value is
0.95. This means that based on PMV the thermal
comfort of the rooms is close to warm +1.
Based on figure 2 it can be seen that the mean of the
real vote value is – 0. 32. It means that based on the
real vote, the thermal comfort of the room is close to
slightly cool -0.5.
We can see that there is a significant difference between
PMV and real vote so PMV model isn't effective.
17.
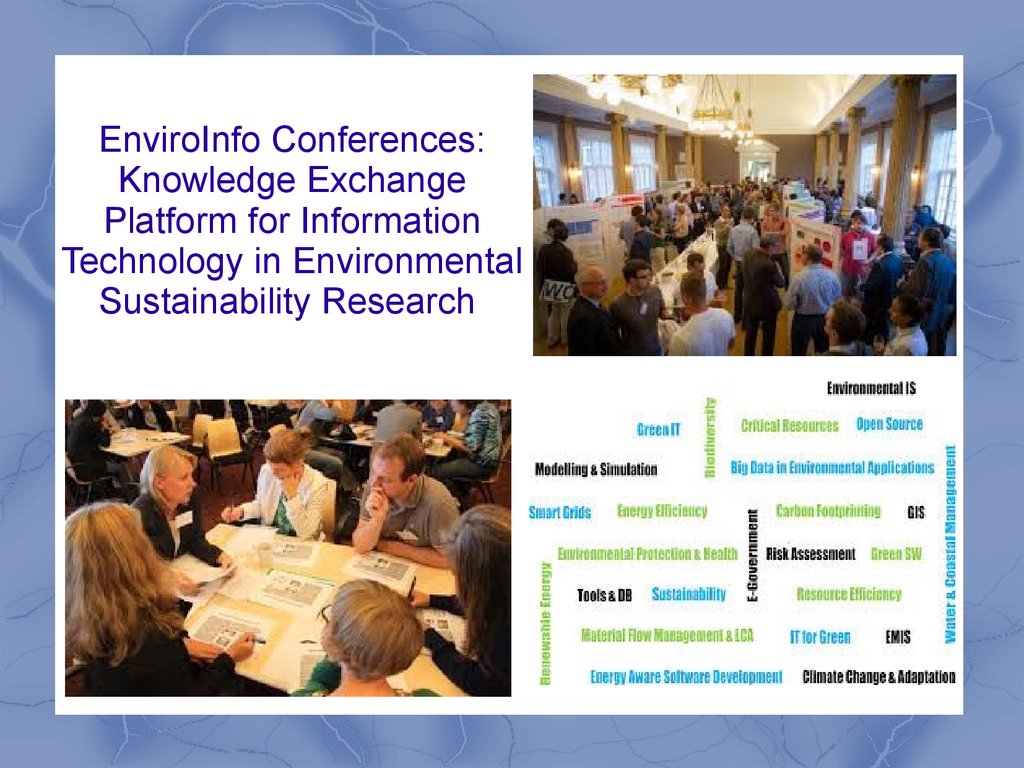
EnviroInfo Conferences:Knowledge Exchange
Platform for Information
Technology in Environmental
Sustainability Research
18.
The Role of EnvironmentalInformatics
Ecological information technologies are very
important in solving ecological problems nowadays.
That's why it was improved the right of access to
environmental information: updated Directive
2003/4/EC, then “Arhus Convention on access to
Information, Public Participation in Decision-making
and Access to Justice in Environmenatal Matters.
This information shows that we have highly
unsustainable trends and the alarm sigals are
increasing.
19.
Development Phases of theEnviroInfo Network
With the increasing of amounts of waste substances the
pollution has grown. There are tree phases of the
development of environmental informatics: an early
development phase(1up to 1990)(the time that was ripe
for the application of information systems in the
emerging field of environmental protection ), the
establishment efforts(1990-2000)(through the activities
of several TC members, specialised working groups
become operational in this era), and current phase(The
“German Conference has transformed to an international
meeting one with the English like conference language”).
20.
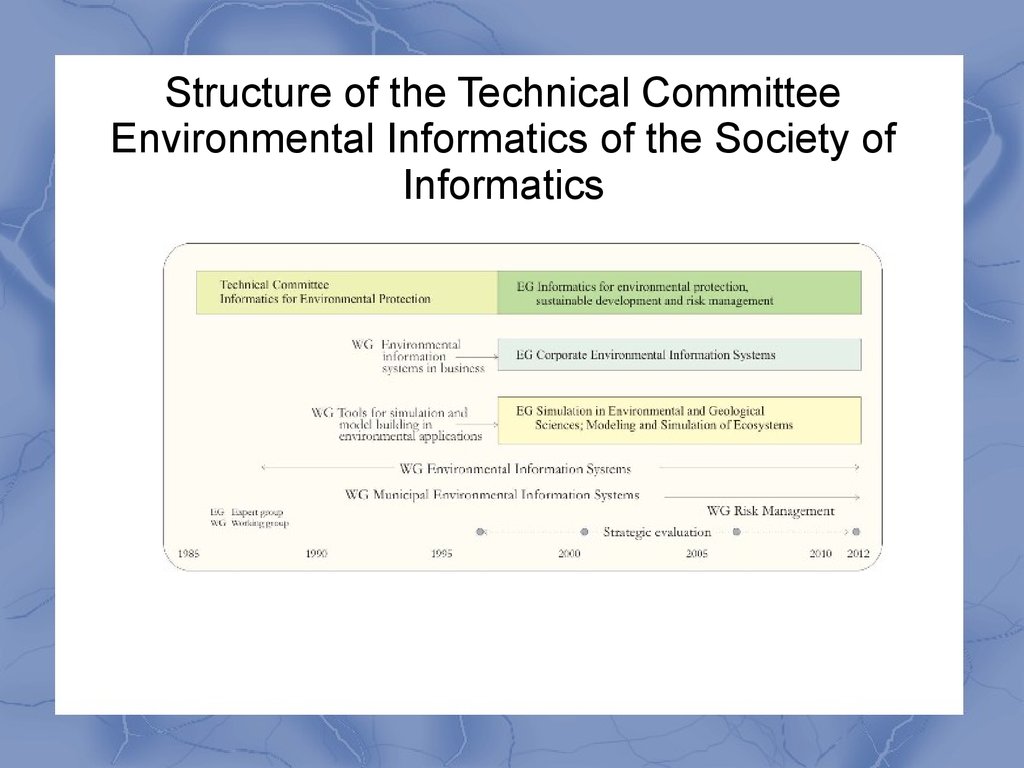
Structure of the Technical CommitteeEnvironmental Informatics of the Society of
Informatics
21.
The Technical Committee EnvironmentalInformatics of the Society of Informatics is
structured in 3 Expert groups(Informatics for
environmental protection, sustainable
development and risk management,
Corporate Environmetal Information Systems,
Simulatio in Environmental and Geological
Sciences; Modeling and Simulation of
Ecosystems) ad presently three working
group(Environmental Information Systems,
Municipal Environmental Information
Systems, Risk Management)
22.
Environmental Informatics – theway ahead
Interdisciplinary diversity of environmental
information -the future. The FP7 project ICTENSURE – iCT for Environmental
Sustainability Research shows what has been
made and broaden this path.