


 Финансы
 Бизнес
Похожие презентации:


")


Greenhouse Tomatoes Budgets and Other Economics
1.
Greenhouse Tomatoes Budgets and OtherEconomics
Elizabeth Canales
Assistant Extension
Professor
Department of Agricultural
Economics
2.
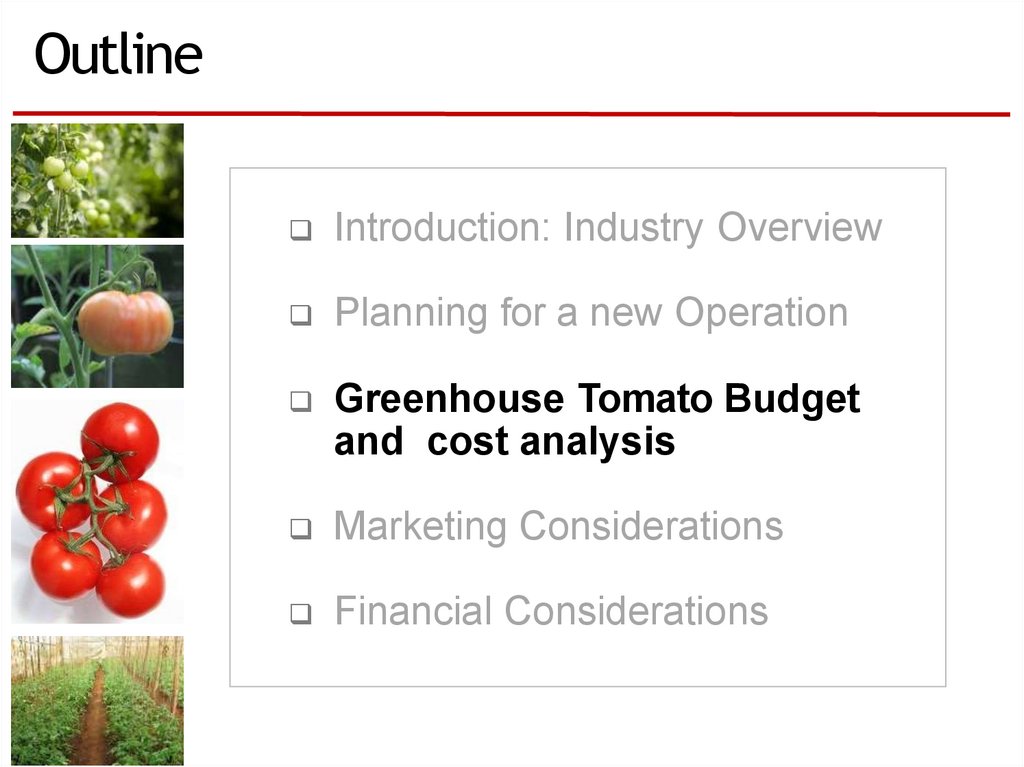
OutlineIntroduction: Industry Overview
Planning for a new Operation
Greenhouse Tomato Budget
and cost analysis
Marketing Considerations
Financial Considerations
3.
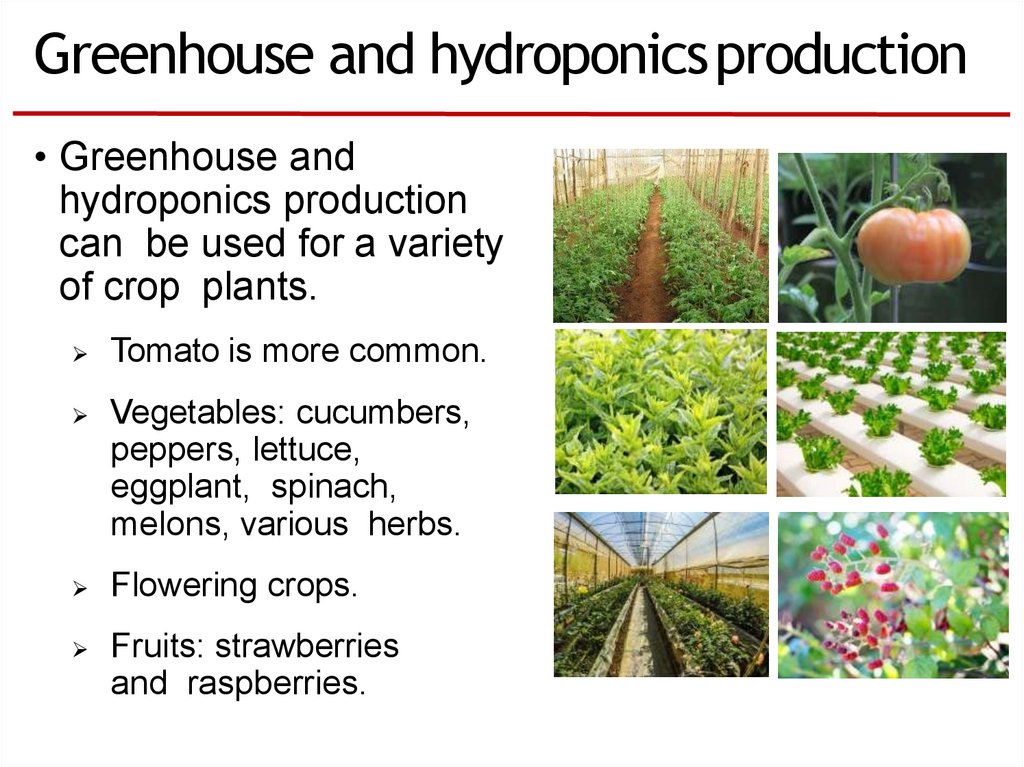
Greenhouse and hydroponics production• Greenhouse and
hydroponics production
can be used for a variety
of crop plants.
Tomato is more common.
Vegetables: cucumbers,
peppers, lettuce,
eggplant, spinach,
melons, various herbs.
Flowering crops.
Fruits: strawberries
and raspberries.
4.
3000
900,00
0
800,00
0
700,00
0
600,00
0
500,00
0
400,00
0
300,00
0
200,00
0
100,00
0
0
250
0
200
0
Number of
Operations
150
0
100
0
50
0
0
197
0
1988
1998
2009
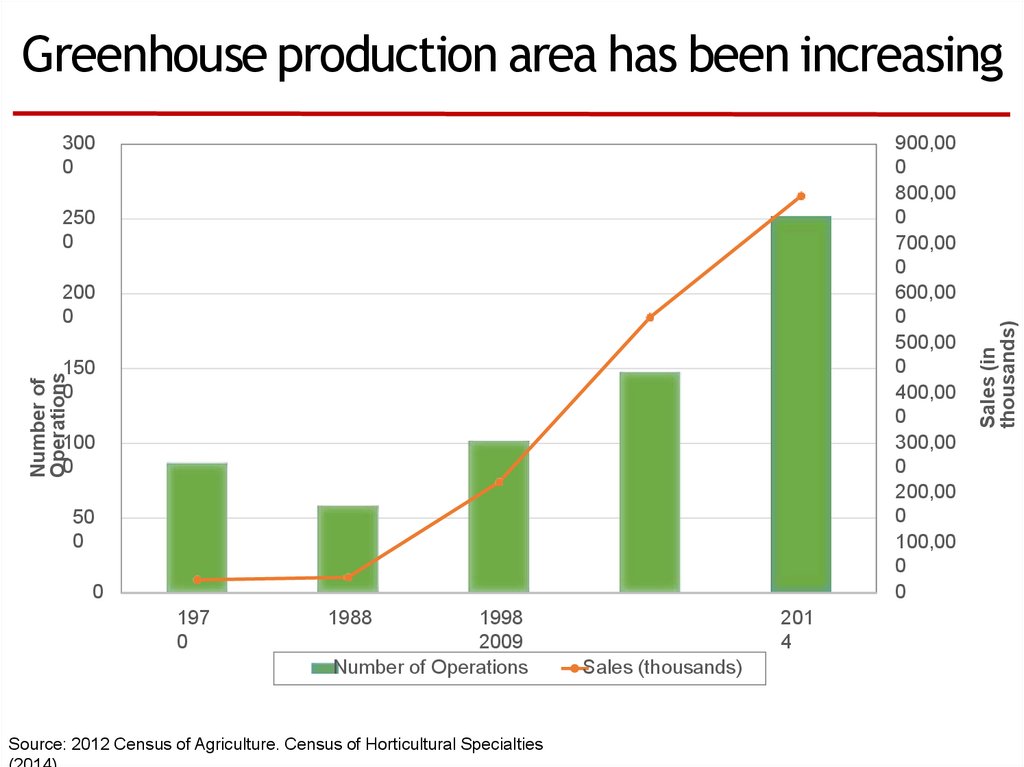
Number of Operations
Source: 2012 Census of Agriculture. Census of Horticultural Specialties
201
4
Sales (thousands)
Sales (in
thousands)
Greenhouse production area has been increasing
5.
2,000
45,00
0
40,00
0
35,00
0
30,00
0
25,00
0
20,00
0
15,00
0
10,00
0
5,00
0
0
Number of
Operations
1,80
0
1,60
0
1,40
0
1,20
0
1,00
0
800
600
400
200
0
Tomatoe
s
Othe
r
Lettuce, all Cucumbers Peppers, all Herbs, cut
Strawberries
fresh
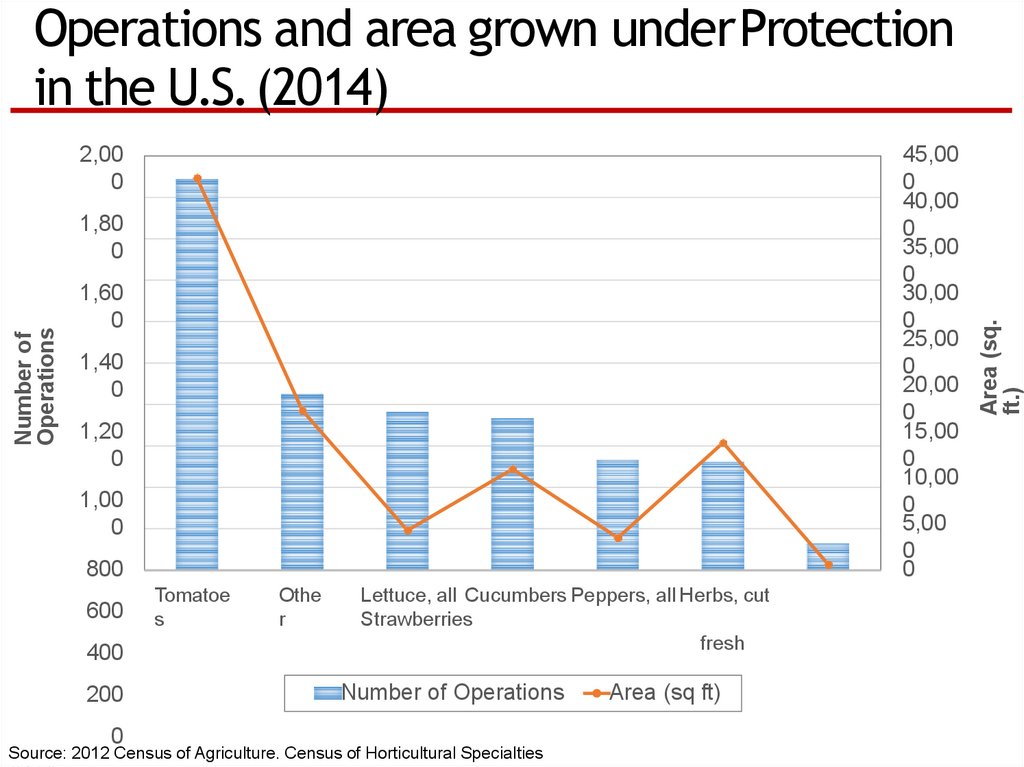
Number of Operations
Source: 2012 Census of Agriculture. Census of Horticultural Specialties
Area (sq ft)
Area (sq.
ft.)
Operations and area grown underProtection
in the U.S.(2014)
6.
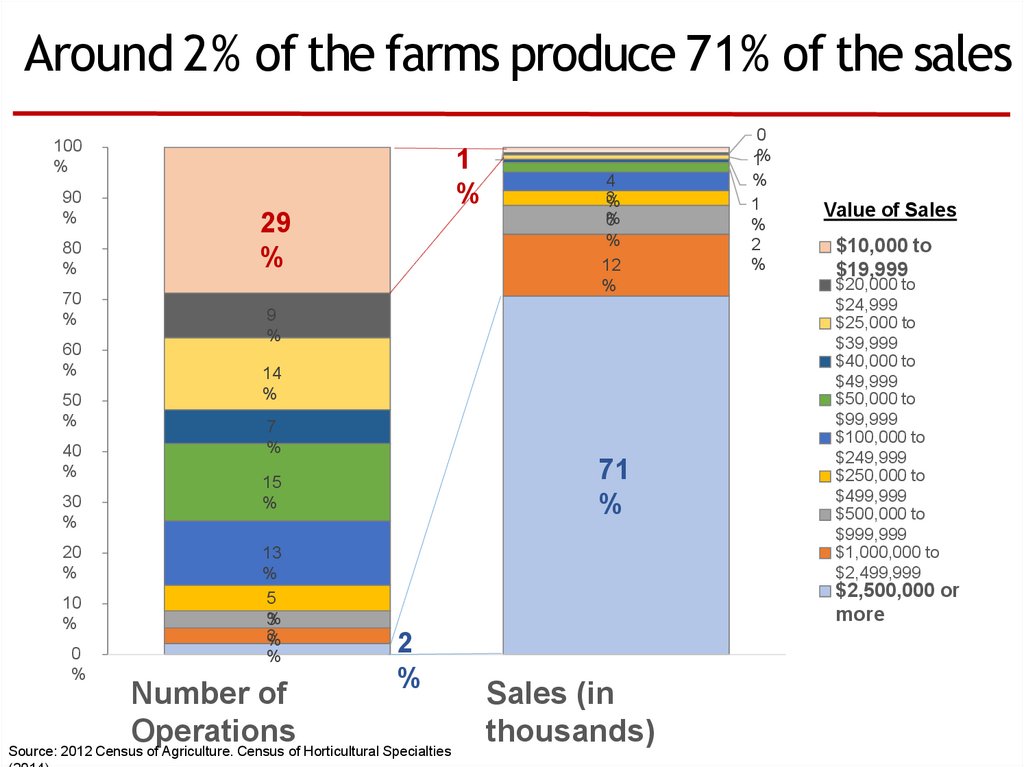
Around 2% of the farms produce 71% of the sales100
%
90
%
80
%
70
%
60
%
50
%
40
%
30
%
20
%
10
%
0
%
1
%
29
%
4
3
%
%
6
%
12
%
9
%
14
%
7
%
71
%
15
%
13
%
5
%
3
3
%
%
0
1%
%
1
%
2
%
Value of Sales
$10,000 to
$19,999
$20,000 to
$24,999
$25,000 to
$39,999
$40,000 to
$49,999
$50,000 to
$99,999
$100,000 to
$249,999
$250,000 to
$499,999
$500,000 to
$999,999
$1,000,000 to
$2,499,999
$2,500,000 or
more
2
%
Number of
Operations
Source: 2012 Census of Agriculture. Census of Horticultural Specialties
Sales (in
thousands)
7.
OutlineIntroduction: Industry Overview
Planning for a new Operation
Greenhouse Tomato Budget
and cost analysis
Marketing Considerations
Financial Considerations
8.
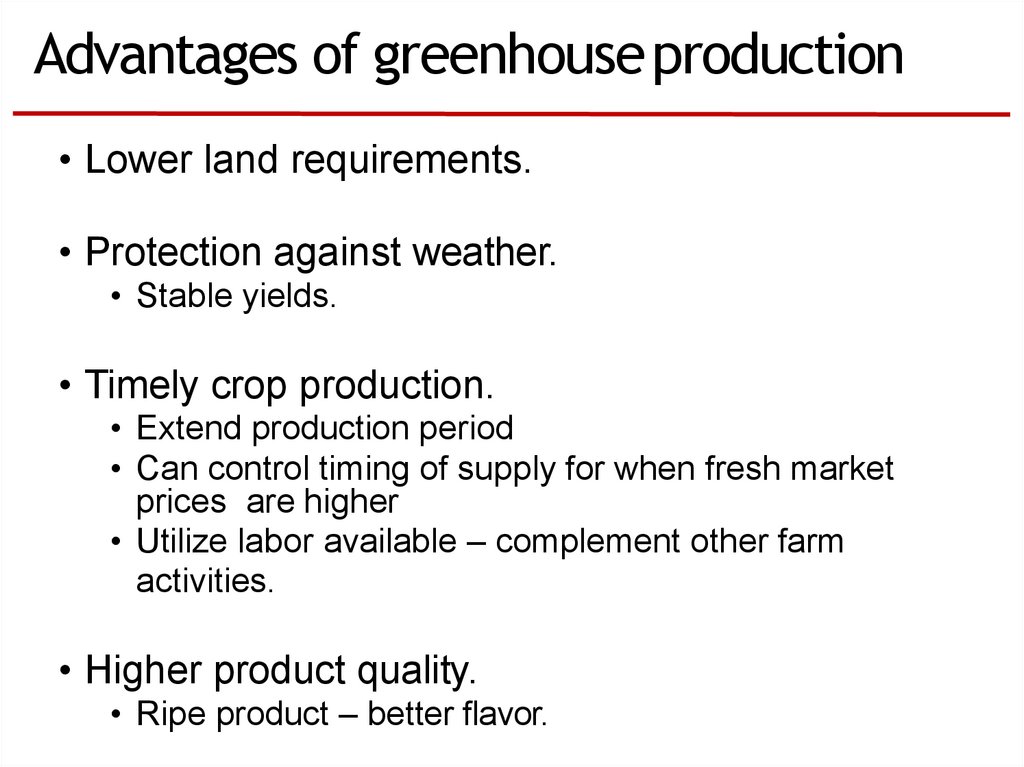
Advantages of greenhouse production• Lower land requirements.
• Protection against weather.
• Stable yields.
• Timely crop production.
• Extend production period
• Can control timing of supply for when fresh market
prices are higher
• Utilize labor available – complement other farm
activities.
• Higher product quality.
• Ripe product – better flavor.
9.
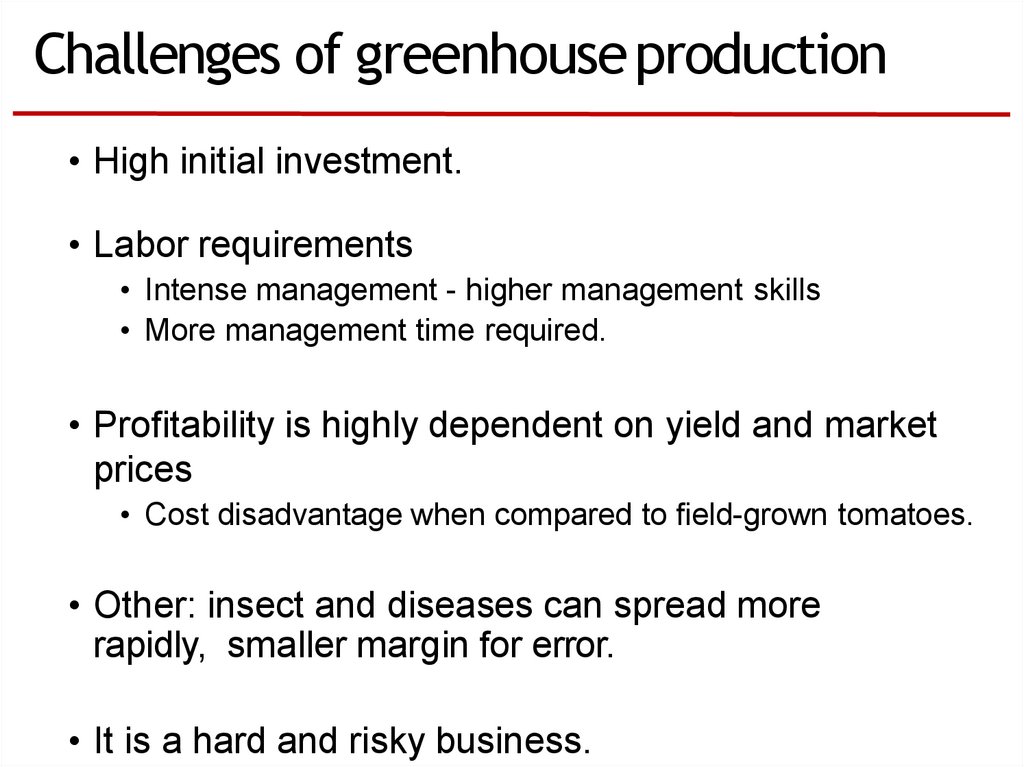
Challenges of greenhouse production• High initial investment.
• Labor requirements
• Intense management - higher management skills
• More management time required.
• Profitability is highly dependent on yield and market
prices
• Cost disadvantage when compared to field-grown tomatoes.
• Other: insect and diseases can spread more
rapidly, smaller margin for error.
• It is a hard and risky business.
10.
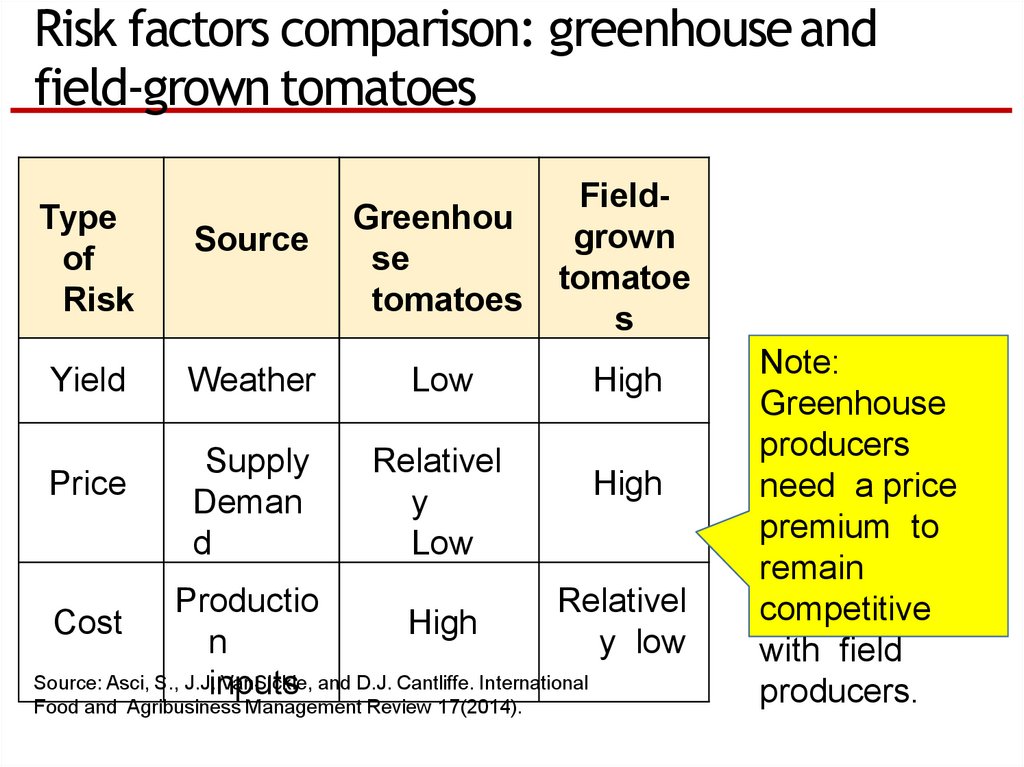
Risk factors comparison: greenhouse andfield-grown tomatoes
Type
of
Risk
Yield
Price
Greenhou
se
tomatoes
Fieldgrown
tomatoe
s
Weather
Low
High
Supply
Deman
d
Relativel
y
Low
Source
High
Productio
Relativel
Cost
High
n
y low
Source: Asci, S., J.J.inputs
VanSickle, and D.J. Cantliffe. International
Food and Agribusiness Management Review 17(2014).
Note:
Greenhouse
producers
need a price
premium to
remain
competitive
with field
producers.
11.
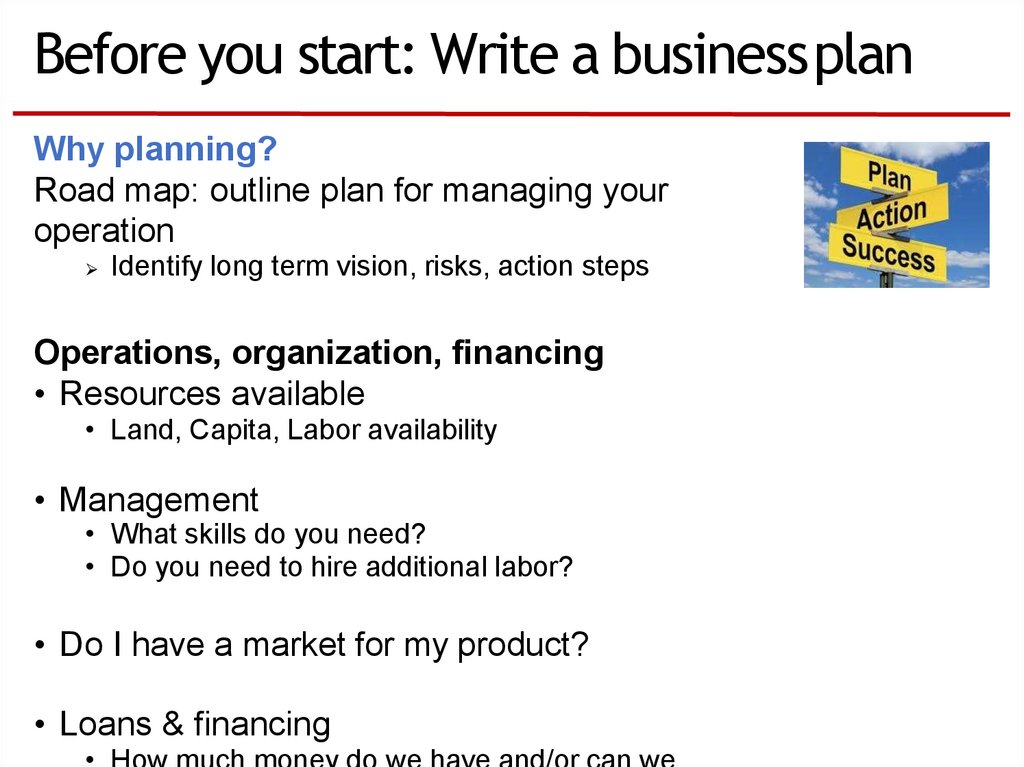
Before you start: Write a businessplanWhy planning?
Road map: outline plan for managing your
operation
Identify long term vision, risks, action steps
Operations, organization, financing
• Resources available
• Land, Capita, Labor availability
• Management
• What skills do you need?
• Do you need to hire additional labor?
• Do I have a market for my product?
• Loans & financing
12.
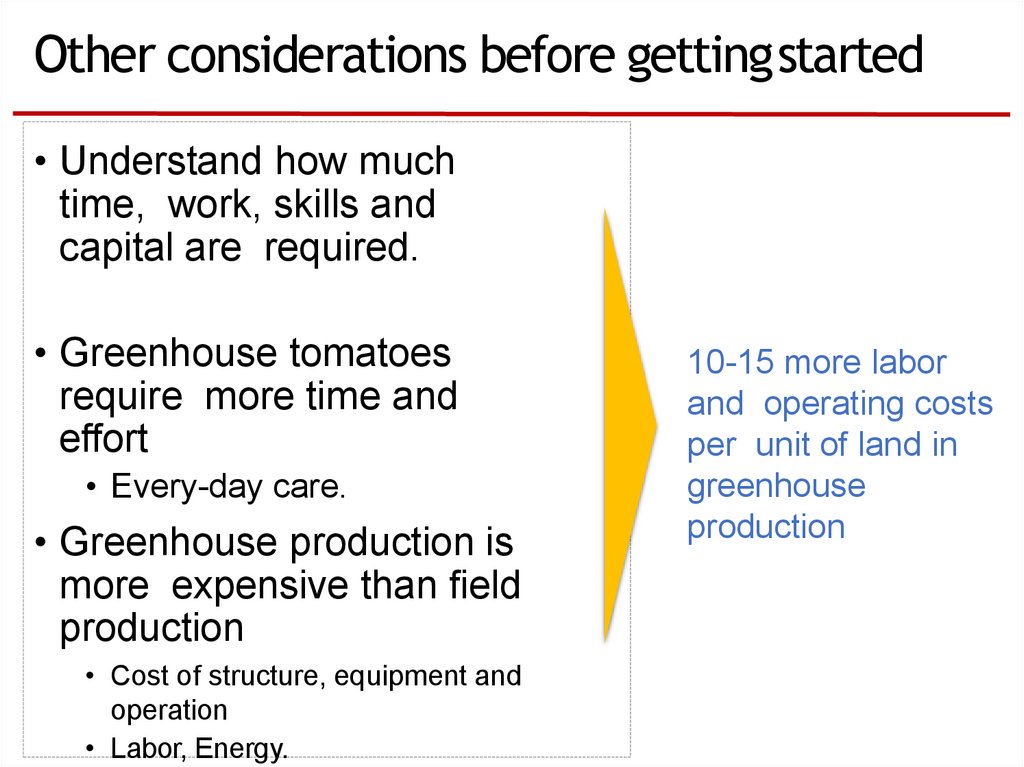
Other considerations before gettingstarted• Understand how much
time, work, skills and
capital are required.
• Greenhouse tomatoes
require more time and
effort
• Every-day care.
• Greenhouse production is
more expensive than field
production
• Cost of structure, equipment and
operation
• Labor, Energy.
10-15 more labor
and operating costs
per unit of land in
greenhouse
production
13.
OutlineIntroduction: Industry Overview
Planning for a new Operation
Greenhouse Tomato Budget
and cost analysis
Marketing Considerations
Financial Considerations
14.
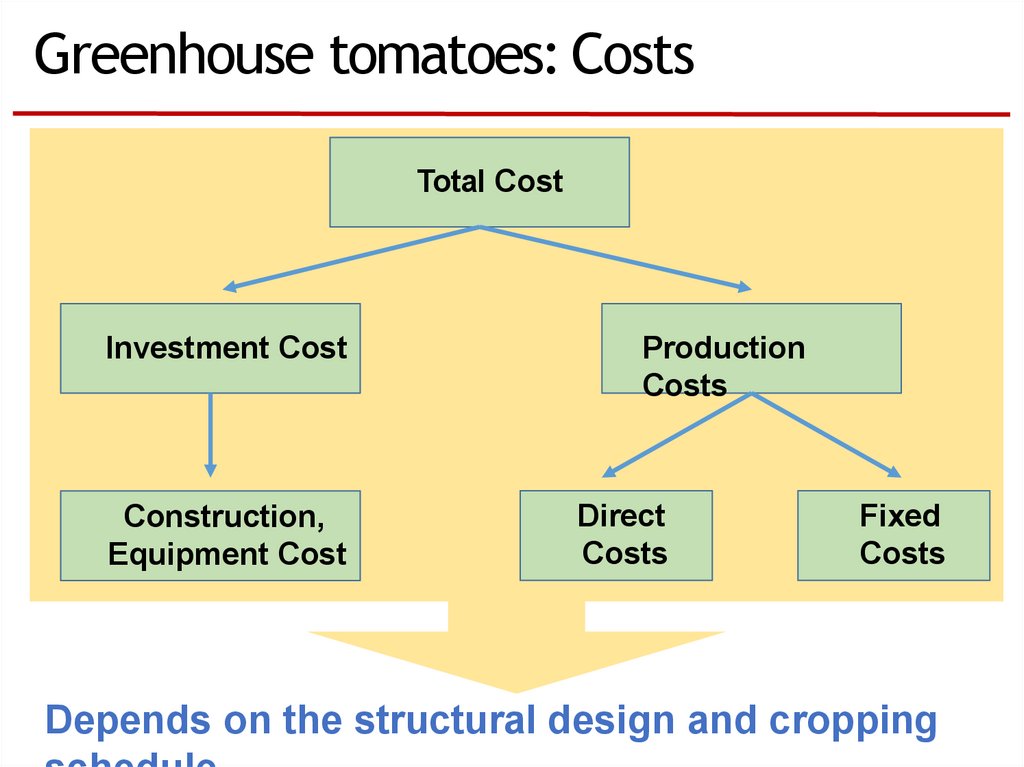
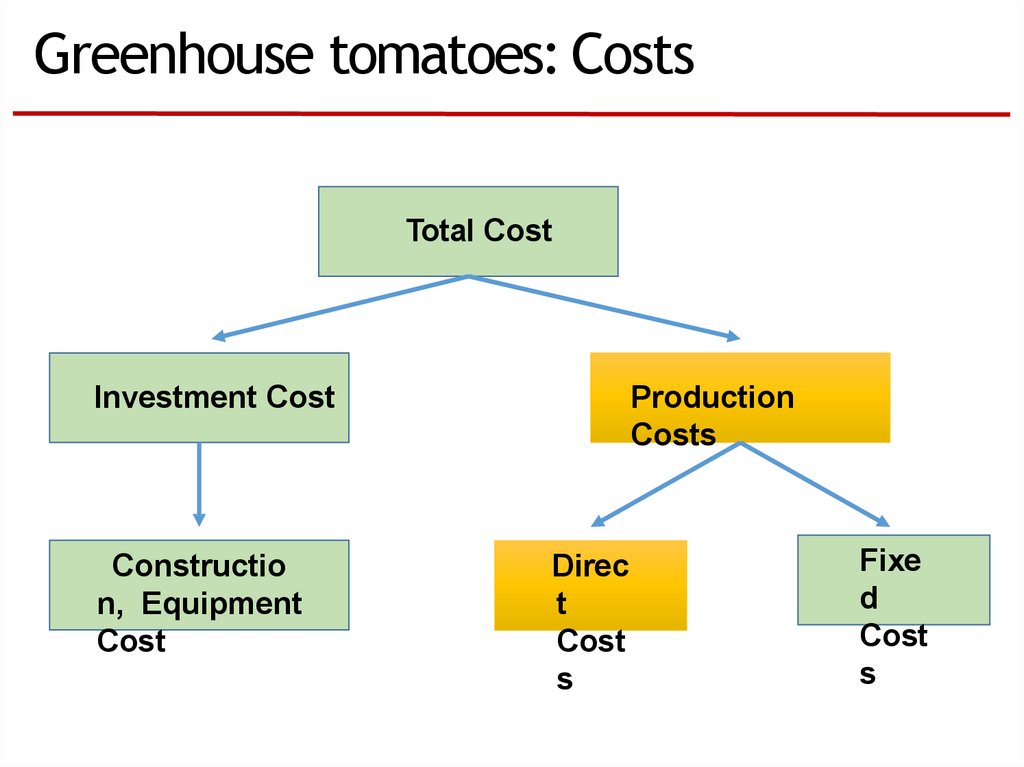
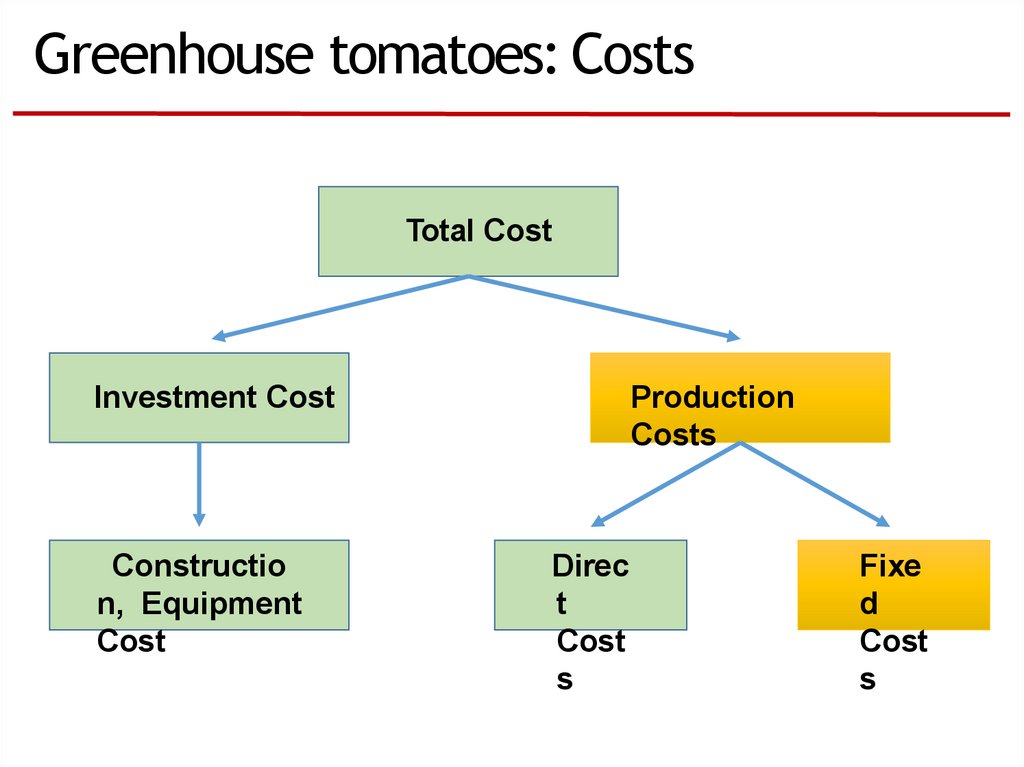
Greenhouse tomatoes: CostsTotal Cost
Investment Cost
Construction,
Equipment Cost
Production
Costs
Direct
Costs
Fixed
Costs
Depends on the structural design and cropping
15.
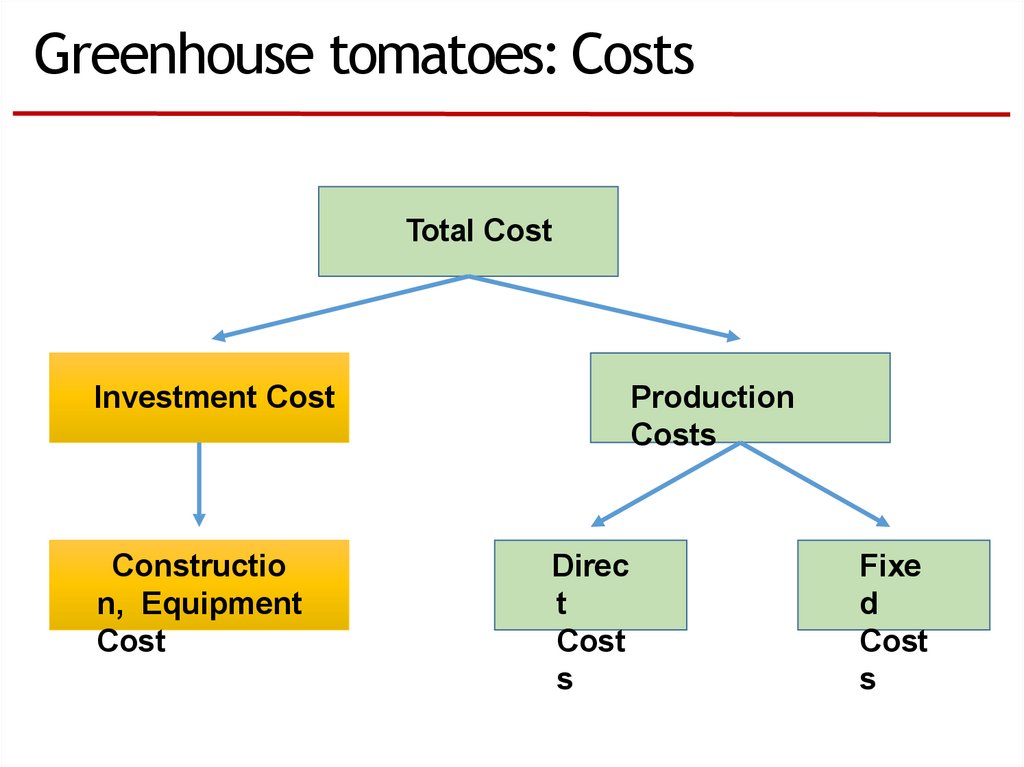
Greenhouse tomatoes: CostsTotal Cost
Investment Cost
Constructio
n, Equipment
Cost
Production
Costs
Direc
t
Cost
s
Fixe
d
Cost
s
16.
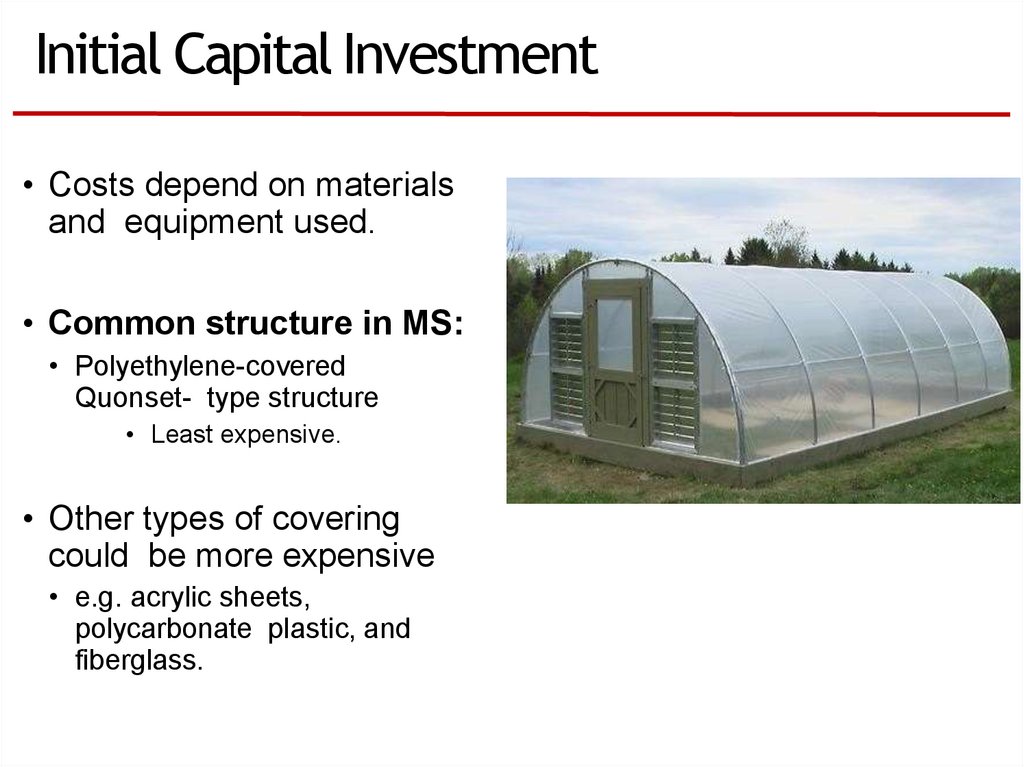
Initial Capital Investment• Costs depend on materials
and equipment used.
• Common structure in MS:
• Polyethylene-covered
Quonset- type structure
• Least expensive.
• Other types of covering
could be more expensive
• e.g. acrylic sheets,
polycarbonate plastic, and
fiberglass.
17.
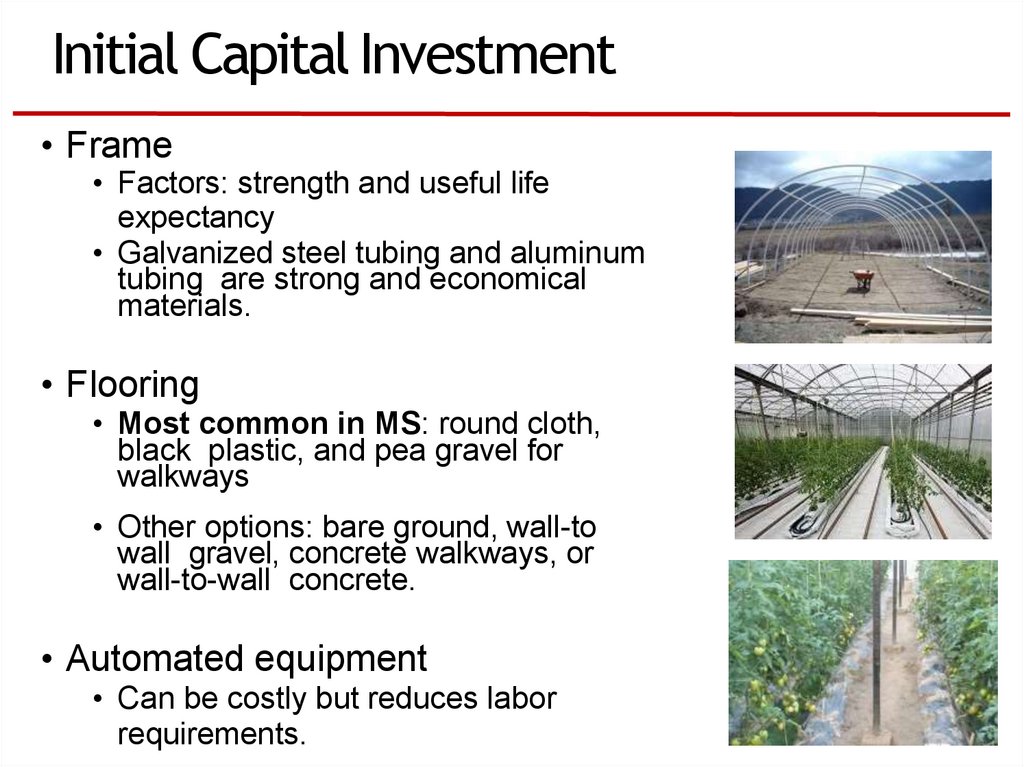
Initial Capital Investment• Frame
• Factors: strength and useful life
expectancy
• Galvanized steel tubing and aluminum
tubing are strong and economical
materials.
• Flooring
• Most common in MS: round cloth,
black plastic, and pea gravel for
walkways
• Other options: bare ground, wall-to
wall gravel, concrete walkways, or
wall-to-wall concrete.
• Automated equipment
• Can be costly but reduces labor
requirements.
18.
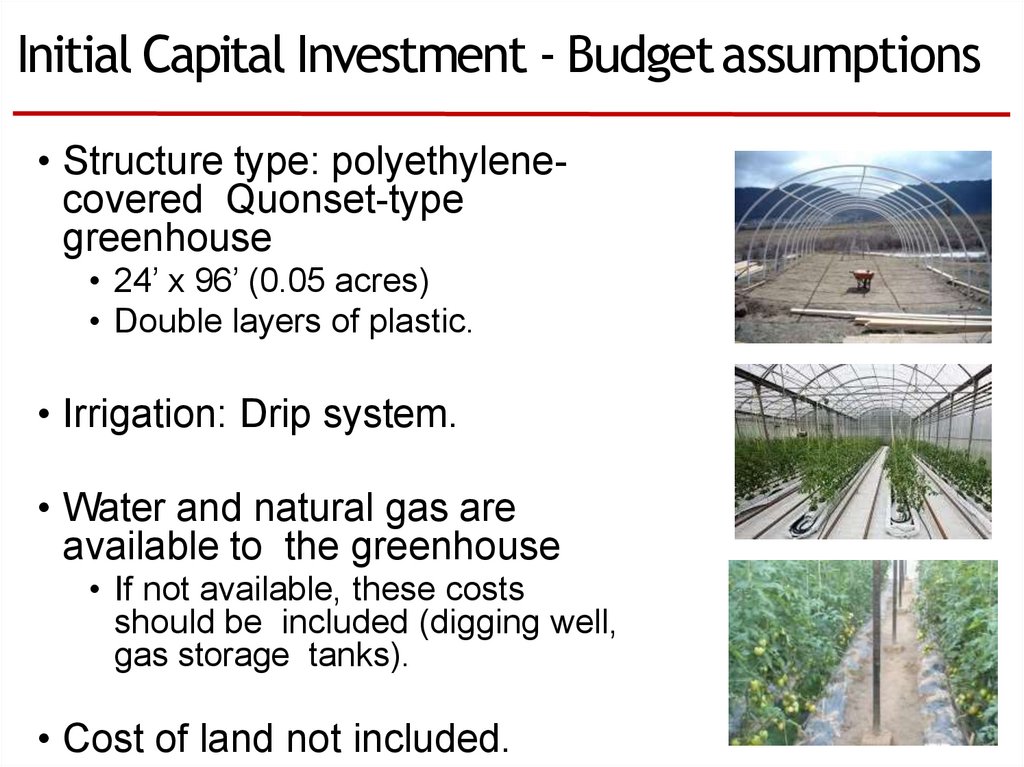
Initial Capital Investment - Budget assumptions• Structure type: polyethylenecovered Quonset-type
greenhouse
• 24’ x 96’ (0.05 acres)
• Double layers of plastic.
• Irrigation: Drip system.
• Water and natural gas are
available to the greenhouse
• If not available, these costs
should be included (digging well,
gas storage tanks).
• Cost of land not included.
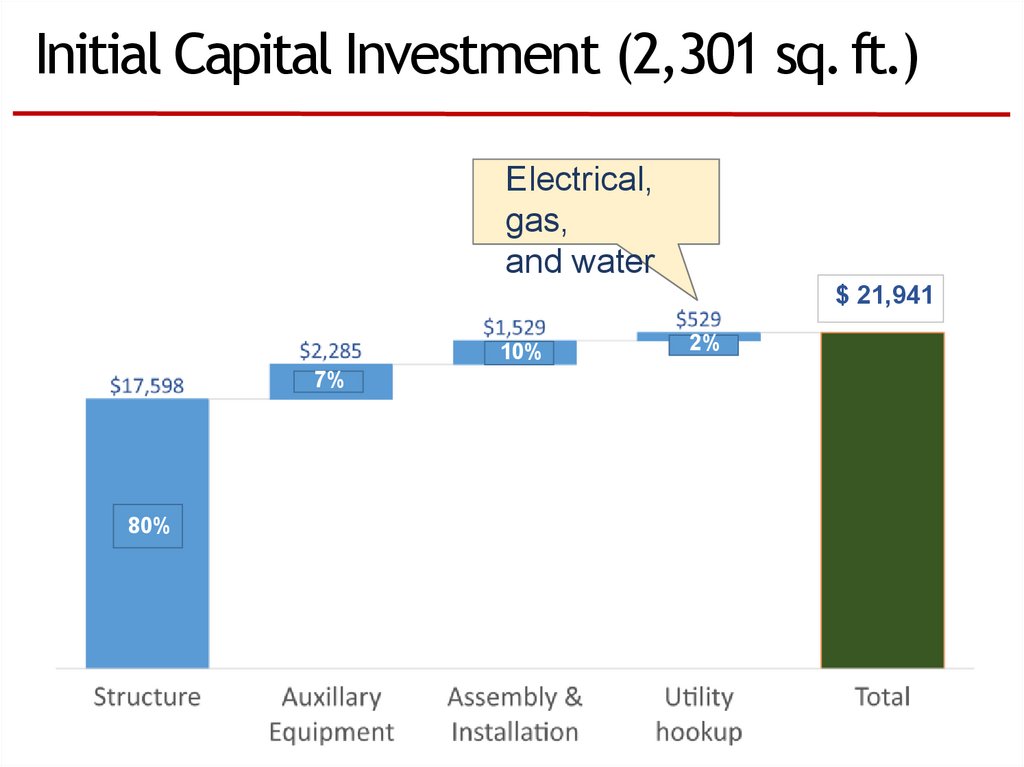
19.
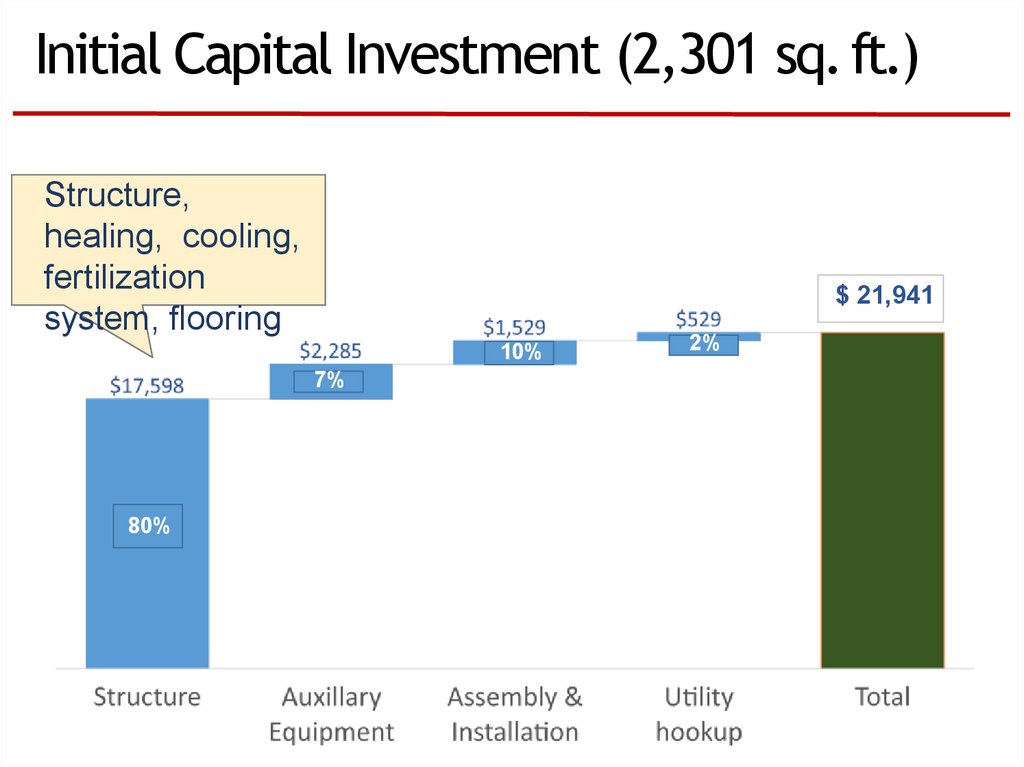
Initial Capital Investment (2,301 sq.ft.)Structure,
healing, cooling,
fertilization
system, flooring
$ 21,941
10%
7%
80%
2%
20.
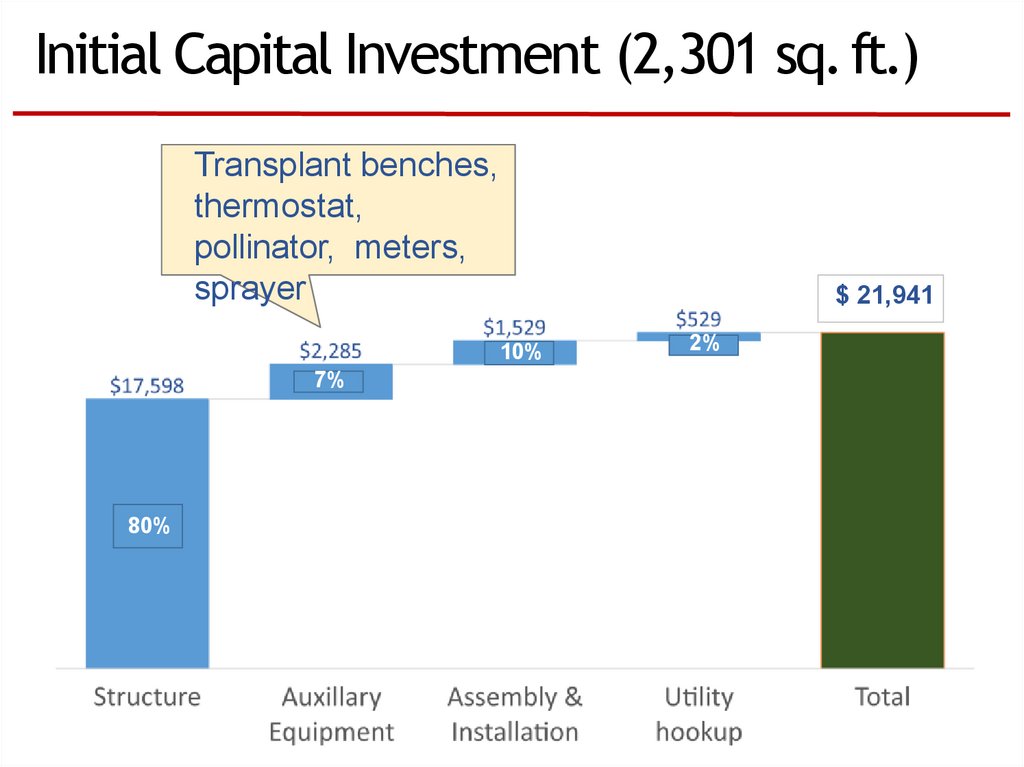
Initial Capital Investment (2,301 sq.ft.)Transplant benches,
thermostat,
pollinator, meters,
sprayer
$ 21,941
10%
7%
80%
2%
21.
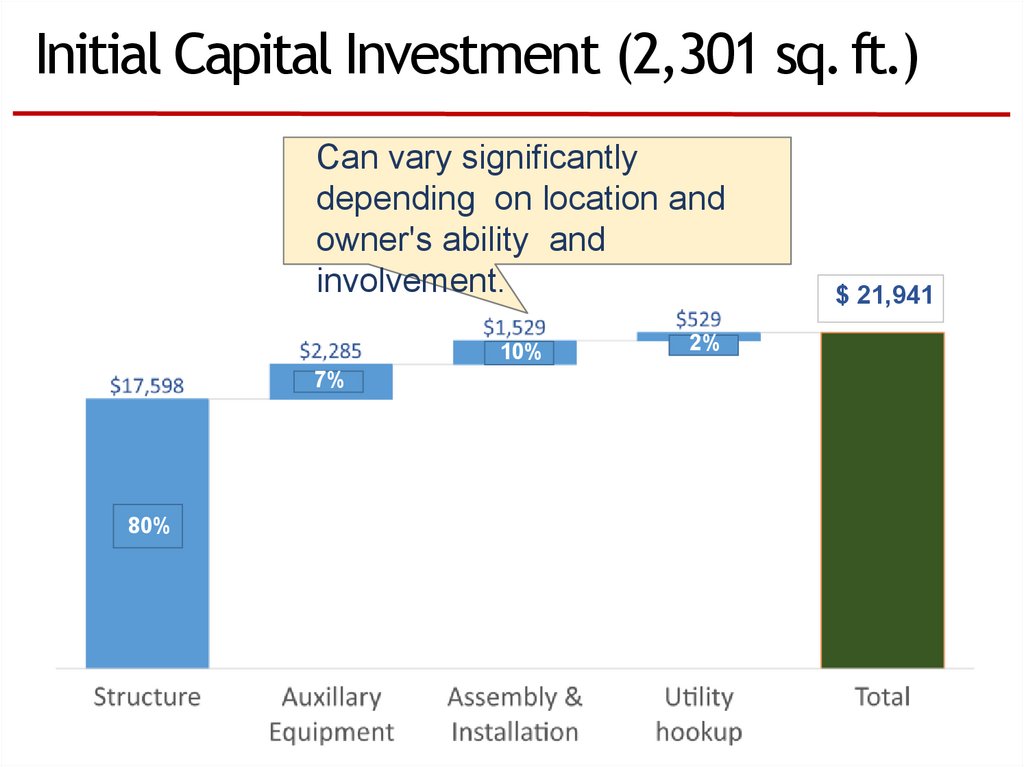
Initial Capital Investment (2,301 sq.ft.)Can vary significantly
depending on location and
owner's ability and
involvement.
10%
7%
80%
2%
$ 21,941
22.
Initial Capital Investment (2,301 sq.ft.)Electrical,
gas,
and water
$ 21,941
10%
7%
80%
2%
23.
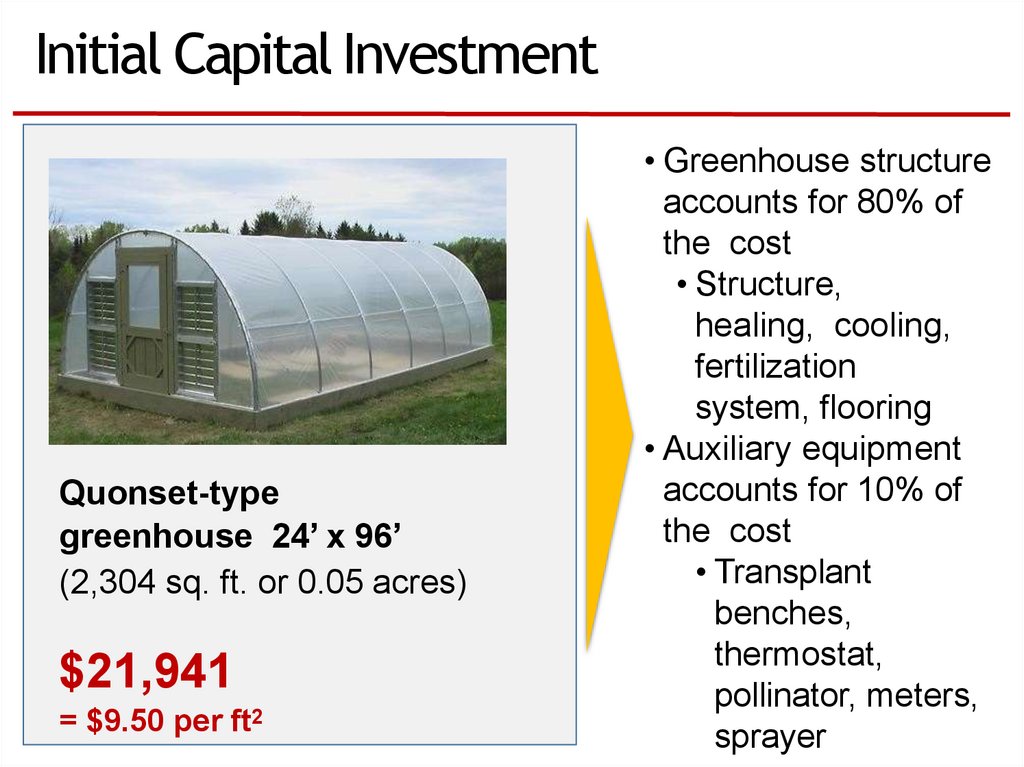
Initial Capital InvestmentQuonset-type
greenhouse 24’ x 96’
(2,304 sq. ft. or 0.05 acres)
$21,941
= $9.50 per ft2
• Greenhouse structure
accounts for 80% of
the cost
• Structure,
healing, cooling,
fertilization
system, flooring
• Auxiliary equipment
accounts for 10% of
the cost
• Transplant
benches,
thermostat,
pollinator, meters,
sprayer
24.
Plan for an adequate amount ofcontingency• Costs are often
underestimated
• Costs can exceed the
budget during execution.
• Plan for contingencies
• Include a contingency
category in your budget
• Estimated guess (some
people use 10% of cost).
25.
Considerations• Sacrifice quality to keep costs low.
• Buy more greenhouse than you
need.
26.
Greenhouse tomatoes: CostsTotal Cost
Investment Cost
Constructio
n, Equipment
Cost
Production
Costs
Direc
t
Cost
s
Fixe
d
Cost
s
27.
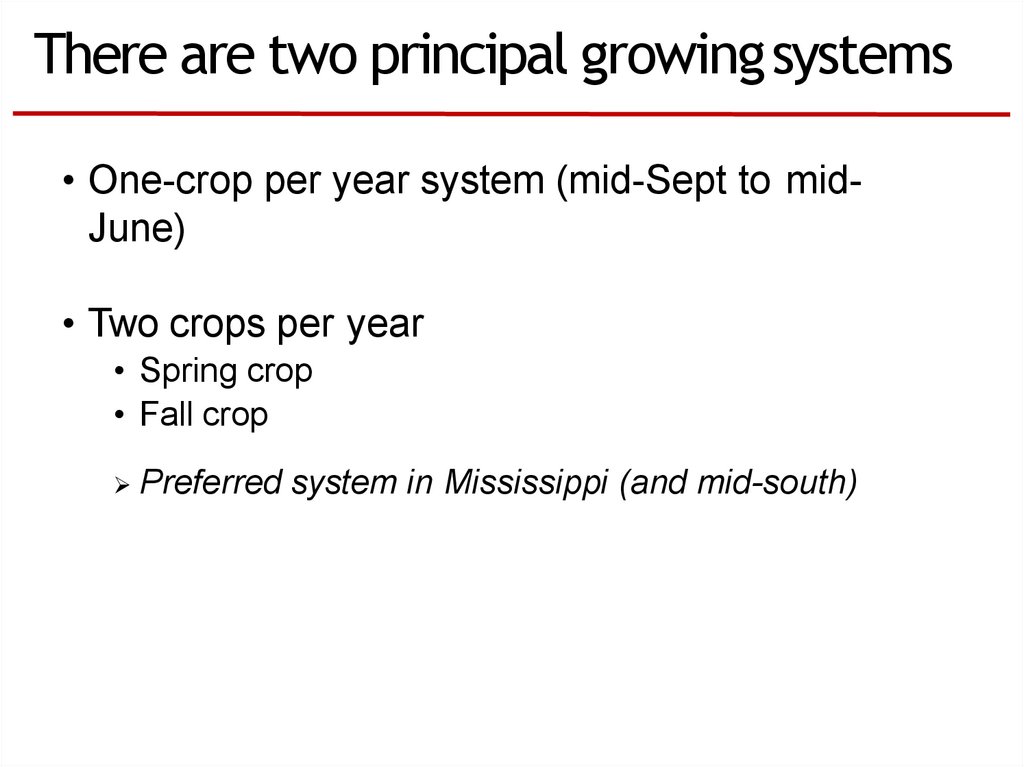
There are two principal growingsystems• One-crop per year system (mid-Sept to midJune)
• Two crops per year
• Spring crop
• Fall crop
Preferred
system in Mississippi (and mid-south)
28.
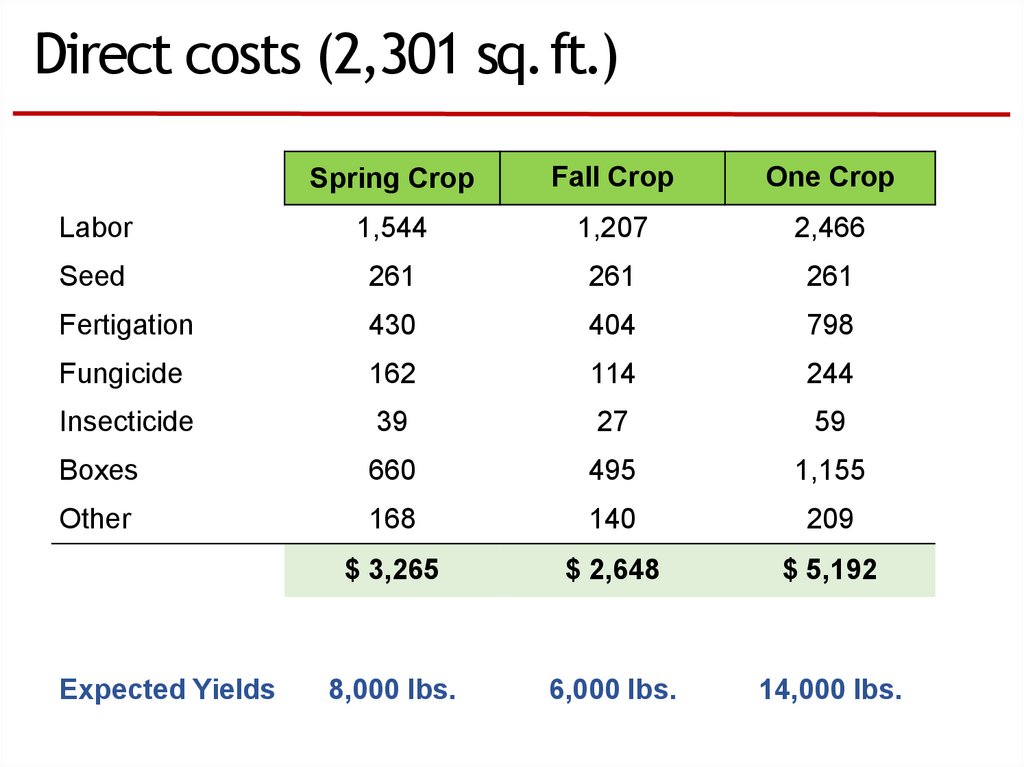
Direct costs (2,301 sq.ft.)Spring Crop
Fall Crop
One Crop
Labor
1,544
1,207
2,466
Seed
261
261
261
Fertigation
430
404
798
Fungicide
162
114
244
Insecticide
39
27
59
Boxes
660
495
1,155
Other
168
140
209
$ 3,265
$ 2,648
$ 5,192
8,000 lbs.
6,000 lbs.
14,000 lbs.
Expected Yields
29.
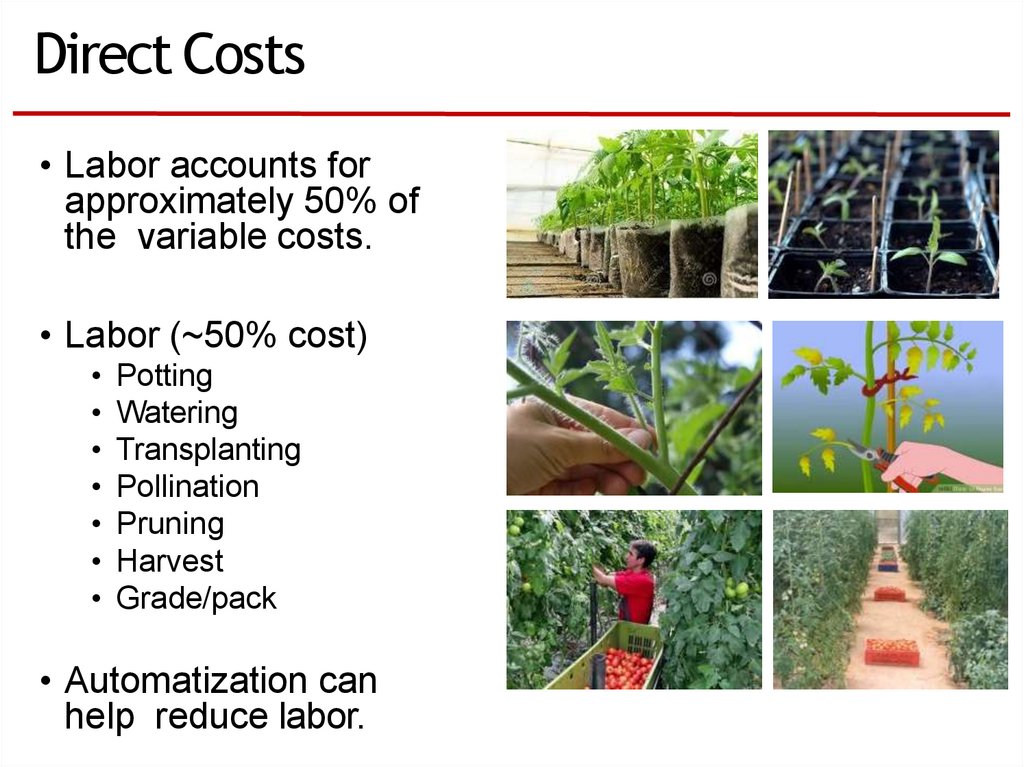
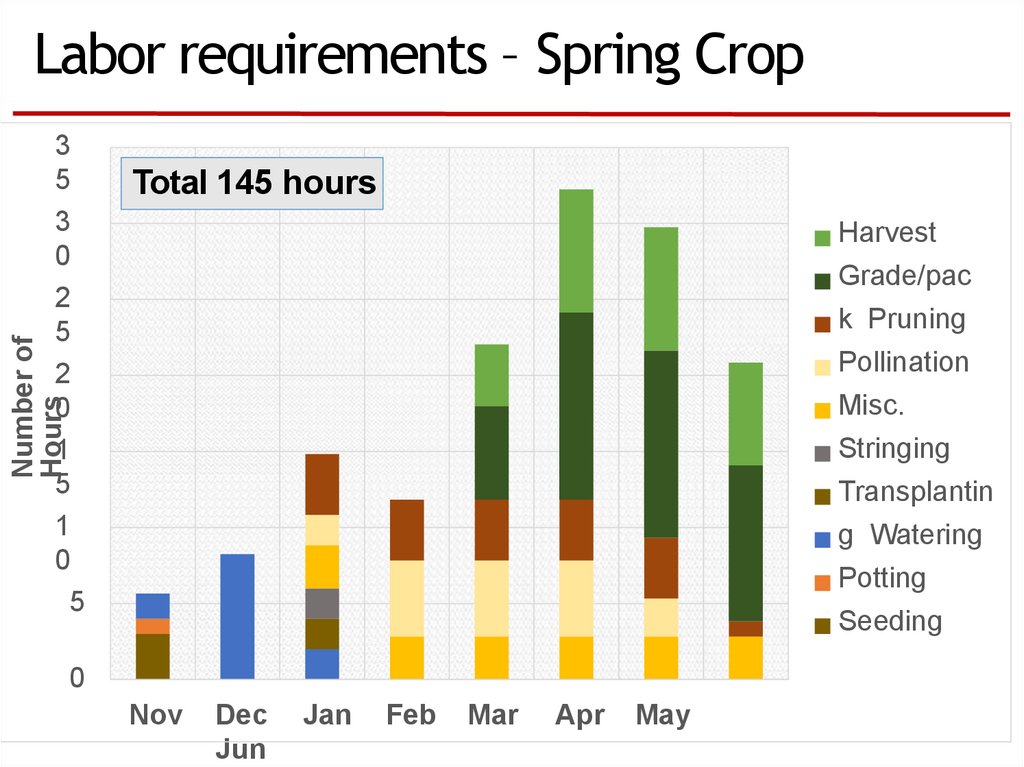
Direct Costs• Labor accounts for
approximately 50% of
the variable costs.
• Labor (~50% cost)
Potting
Watering
Transplanting
Pollination
Pruning
Harvest
Grade/pack
• Automatization can
help reduce labor.
30.
Labor requirements – Spring CropTotal 145 hours
Harvest
Grade/pac
k Pruning
Number of
Hours
3
5
3
0
2
5
2
0
1
5
1
0
5
Pollination
Misc.
Stringing
Transplantin
g Watering
Potting
Seeding
0
Nov
Dec
Jun
Jan
Feb
Mar
Apr
May
31.
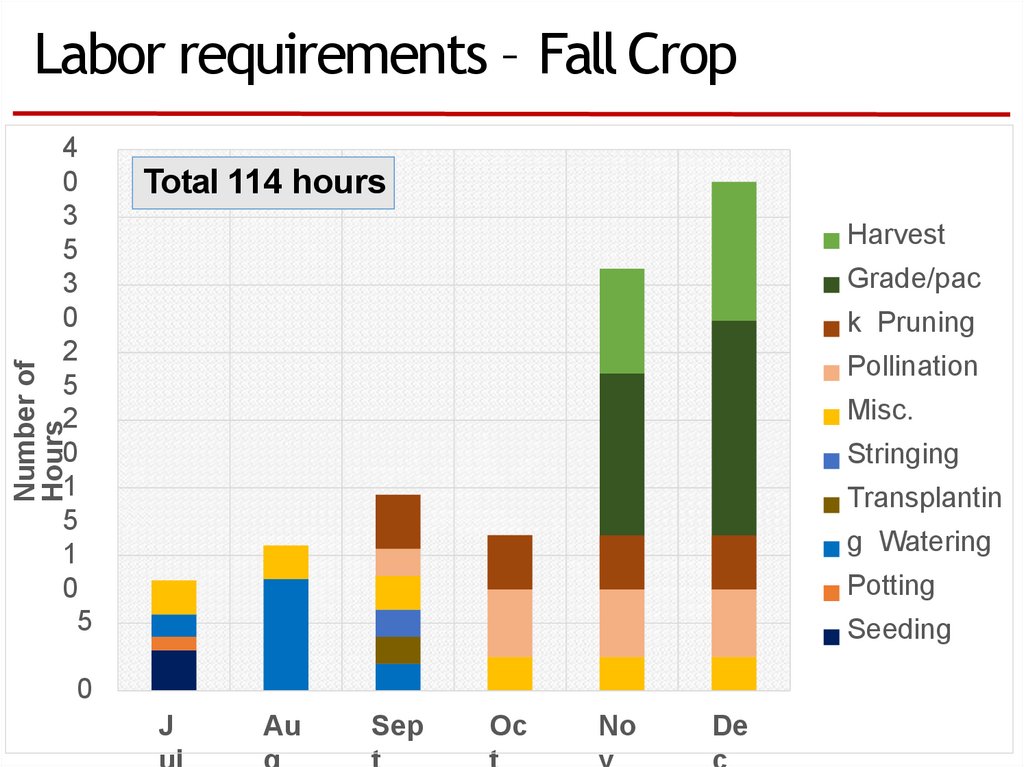
Labor requirements – Fall CropTotal 114 hours
Harvest
Grade/pac
k Pruning
Pollination
Number of
Hours
4
0
3
5
3
0
2
5
2
0
1
5
1
0
5
Misc.
Stringing
Transplantin
g Watering
Potting
Seeding
0
J
Au
Sep
Oc
No
De
32.
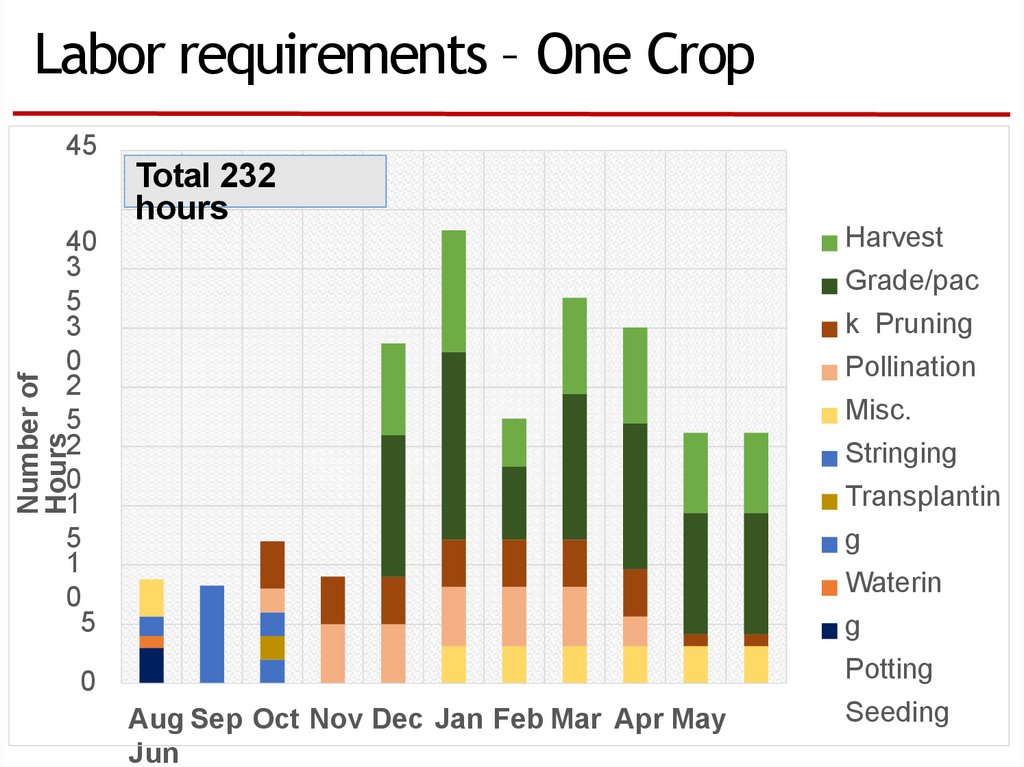
Labor requirements – One Crop45
Total 232
hours
40
3
5
3
0
2
5
2
0
1
5
1
0
5
Harvest
0
Potting
Grade/pac
k Pruning
Number of
Hours
Pollination
Misc.
Stringing
Transplantin
g
Waterin
g
Aug Sep Oct Nov Dec Jan Feb Mar Apr May
Jun
Seeding
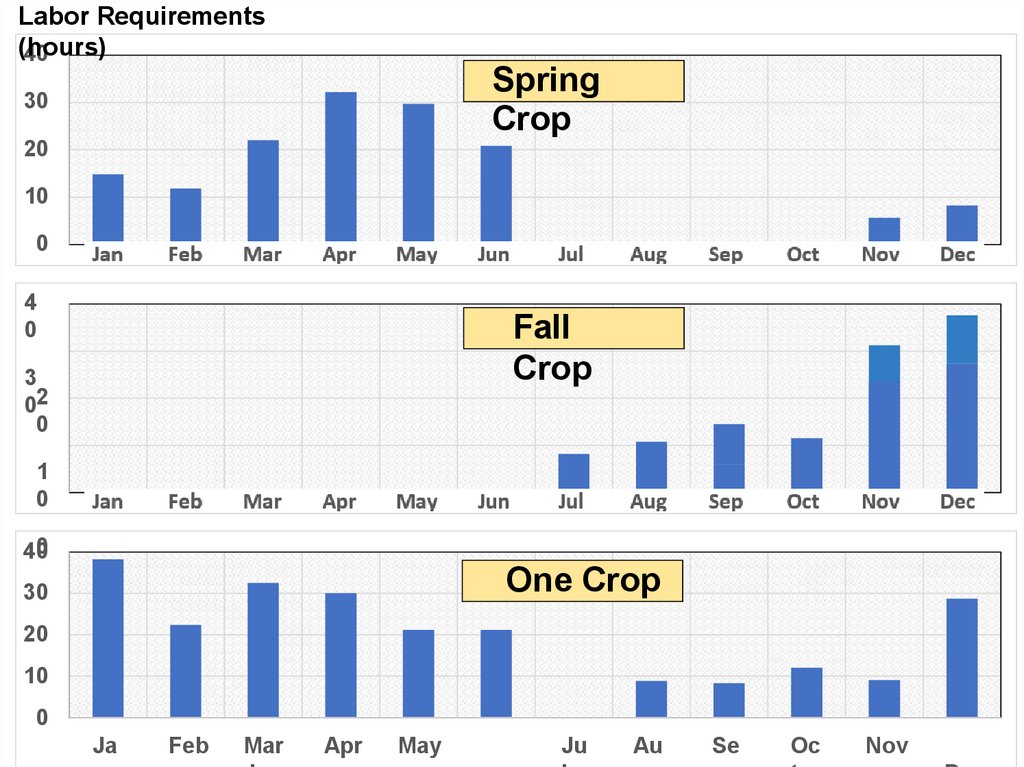
33.
Labor Requirements(hours)
40
Spring
Crop
30
20
10
0
4
0
Fall
Crop
3
02
0
1
0
0
40
One Crop
30
20
10
0
Ja
Feb
Mar
Apr
May
Ju
Au
Se
Oc
Nov
34.
Greenhouse tomatoes: CostsTotal Cost
Investment Cost
Constructio
n, Equipment
Cost
Production
Costs
Direc
t
Cost
s
Fixe
d
Cost
s
35.
Fixed Costs (2,301 sq.ft.)Annual Ownership
Costs
Depreciation
Interest
Insurance and taxes
Overhead expenses:
Heating, water,
electricity,
telephone, lab fees,
repair and
maintenance
2,6702
510
389
$ 3,570
$ 3,272
• Ownership or
Indirect costs
would exist even if
production was
zero.
• Overhead
expenses – they
do not change in
relation to the
activity of the
greenhouse.
• Other costs that
should be included
are mortgage,
36.
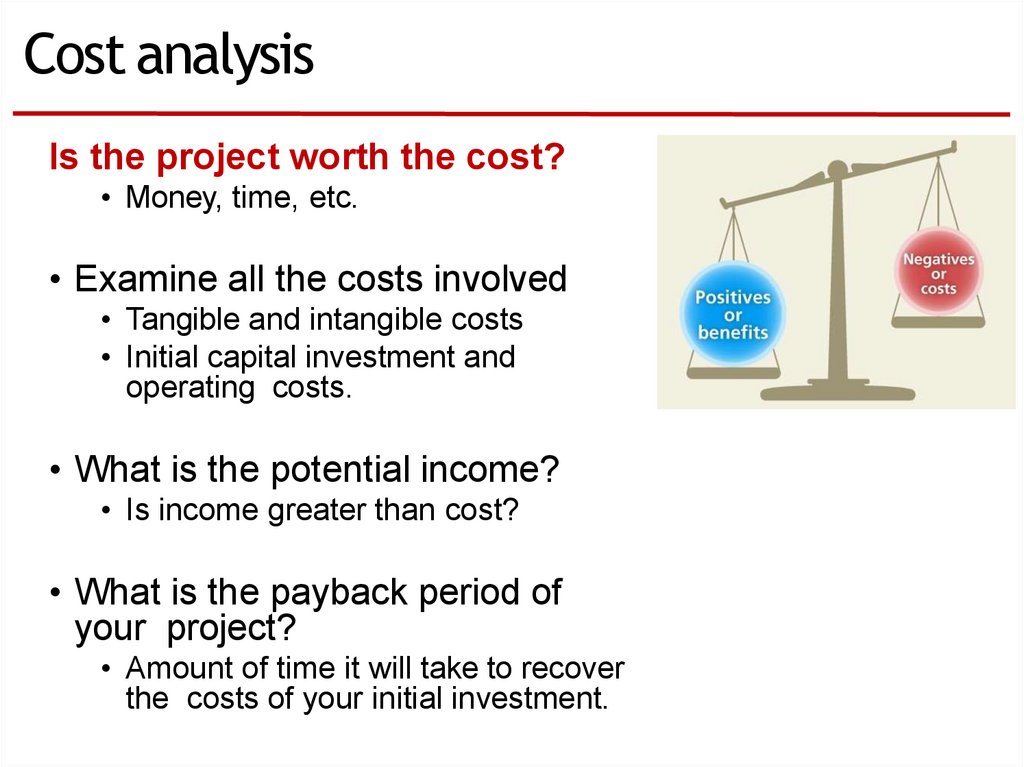
Cost analysisIs the project worth the cost?
• Money, time, etc.
• Examine all the costs involved
• Tangible and intangible costs
• Initial capital investment and
operating costs.
• What is the potential income?
• Is income greater than cost?
• What is the payback period of
your project?
• Amount of time it will take to recover
the costs of your initial investment.
37.
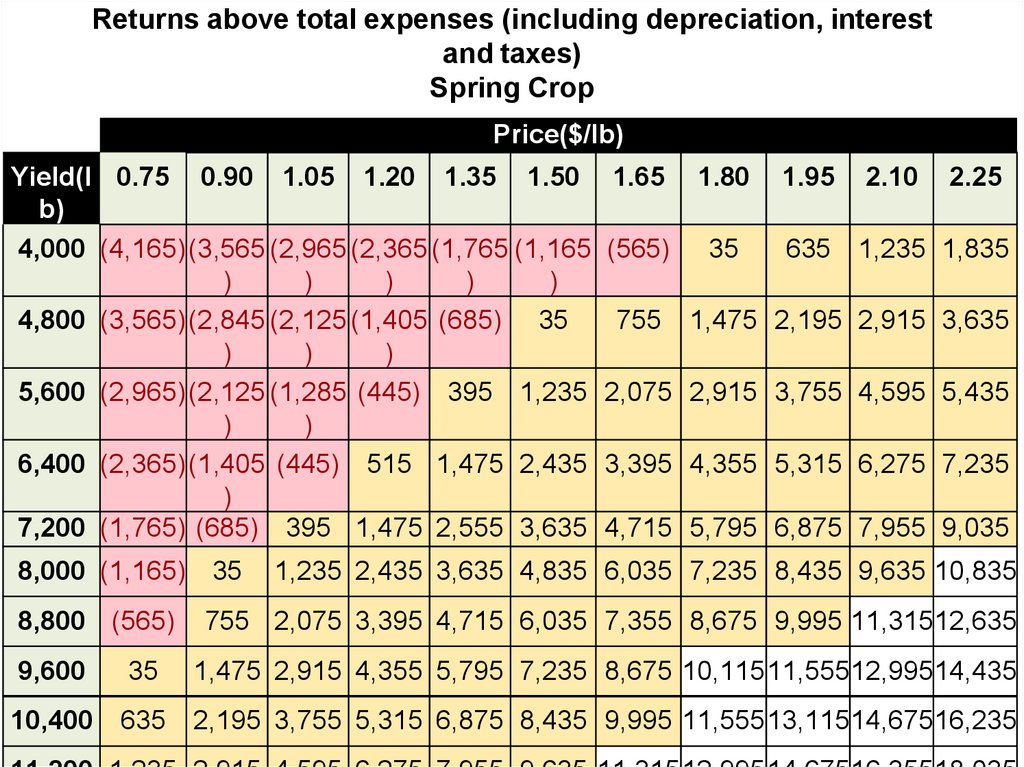
Returns above total expenses (including depreciation, interestand taxes)
Spring Crop
Price($/lb)
Yield(l 0.75 0.90 1.05 1.20 1.35 1.50
b)
4,000 (4,165)(3,565 (2,965 (2,365 (1,765 (1,165
)
)
)
)
)
4,800 (3,565)(2,845 (2,125 (1,405 (685) 35
)
)
)
5,600 (2,965)(2,125 (1,285 (445) 395 1,235
)
)
6,400 (2,365)(1,405 (445) 515 1,475 2,435
)
7,200 (1,765) (685) 395 1,475 2,555 3,635
8,000 (1,165) 35
8,800 (565)
1.65
1.80
1.95
2.10
(565)
35
635
1,235 1,835
755
2.25
1,475 2,195 2,915 3,635
2,075 2,915 3,755 4,595 5,435
3,395 4,355 5,315 6,275 7,235
4,715 5,795 6,875 7,955 9,035
1,235 2,435 3,635 4,835 6,035 7,235 8,435 9,635 10,835
755 2,075 3,395 4,715 6,035 7,355 8,675 9,995 11,31512,635
9,600
35
1,475 2,915 4,355 5,795 7,235 8,675 10,11511,55512,99514,435
10,400
635
2,195 3,755 5,315 6,875 8,435 9,995 11,55513,11514,67516,235
38.
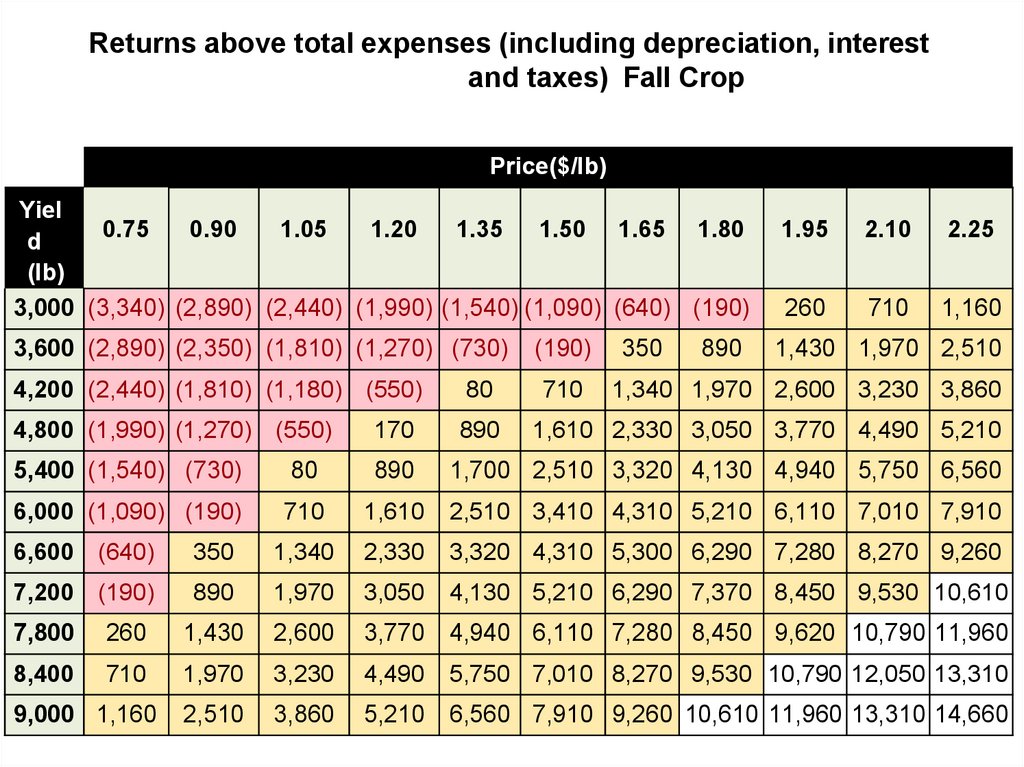
Returns above total expenses (including depreciation, interestand taxes) Fall Crop
Price($/lb)
Yiel
0.75
0.90
1.05
1.20
1.35 1.50 1.65 1.80
d
(lb)
3,000 (3,340) (2,890) (2,440) (1,990) (1,540) (1,090) (640) (190)
3,600 (2,890) (2,350) (1,810) (1,270) (730)
(190)
710
350
890
1.95
2.10
2.25
260
710
1,160
1,430 1,970 2,510
4,200 (2,440) (1,810) (1,180) (550)
80
1,340 1,970 2,600 3,230 3,860
4,800 (1,990) (1,270) (550)
170
890
5,400 (1,540) (730)
80
890
1,700 2,510 3,320 4,130 4,940 5,750 6,560
6,000 (1,090) (190)
710
1,610
2,510 3,410 4,310 5,210 6,110 7,010 7,910
1,610 2,330 3,050 3,770 4,490 5,210
6,600 (640)
350
1,340
2,330
3,320 4,310 5,300 6,290 7,280 8,270 9,260
7,200 (190)
890
1,970
3,050
4,130 5,210 6,290 7,370 8,450 9,530 10,610
7,800
260
1,430
2,600
3,770
4,940 6,110 7,280 8,450 9,620 10,790 11,960
8,400
710
1,970
3,230
4,490
5,750 7,010 8,270 9,530 10,790 12,050 13,310
2,510
3,860
5,210
6,560 7,910 9,260 10,610 11,960 13,310 14,660
9,000 1,160
39.
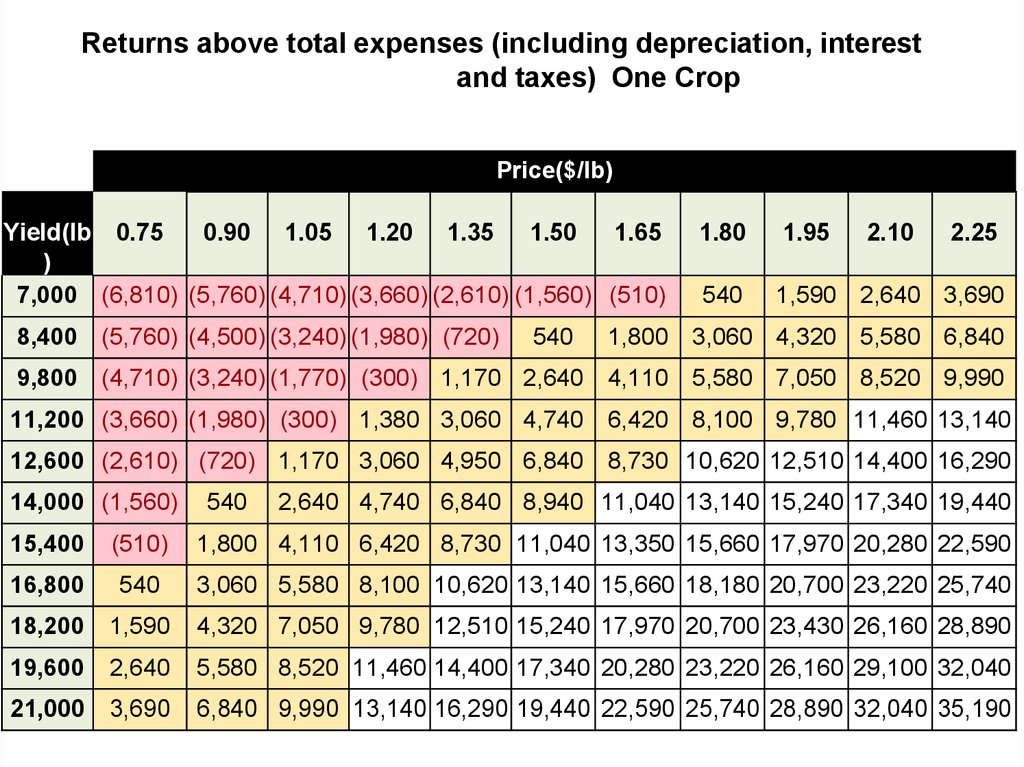
Returns above total expenses (including depreciation, interestand taxes) One Crop
Price($/lb)
Yield(lb 0.75
0.90 1.05 1.20 1.35 1.50
1.65
)
7,000 (6,810) (5,760) (4,710) (3,660) (2,610) (1,560) (510)
8,400 (5,760) (4,500) (3,240) (1,980) (720)
540
1.80
1.95
2.10
2.25
540
1,590 2,640 3,690
1,800 3,060 4,320 5,580 6,840
9,800 (4,710) (3,240) (1,770) (300) 1,170 2,640 4,110 5,580 7,050 8,520 9,990
11,200 (3,660) (1,980) (300) 1,380 3,060 4,740 6,420 8,100 9,780 11,460 13,140
12,600 (2,610) (720) 1,170 3,060 4,950 6,840 8,730 10,620 12,510 14,400 16,290
14,000 (1,560)
540
2,640 4,740 6,840 8,940 11,040 13,140 15,240 17,340 19,440
15,400
(510)
1,800 4,110 6,420 8,730 11,040 13,350 15,660 17,970 20,280 22,590
16,800
540
3,060 5,580 8,100 10,620 13,140 15,660 18,180 20,700 23,220 25,740
18,200
1,590
4,320 7,050 9,780 12,510 15,240 17,970 20,700 23,430 26,160 28,890
19,600
2,640
5,580 8,520 11,460 14,400 17,340 20,280 23,220 26,160 29,100 32,040
21,000
3,690
6,840 9,990 13,140 16,290 19,440 22,590 25,740 28,890 32,040 35,190
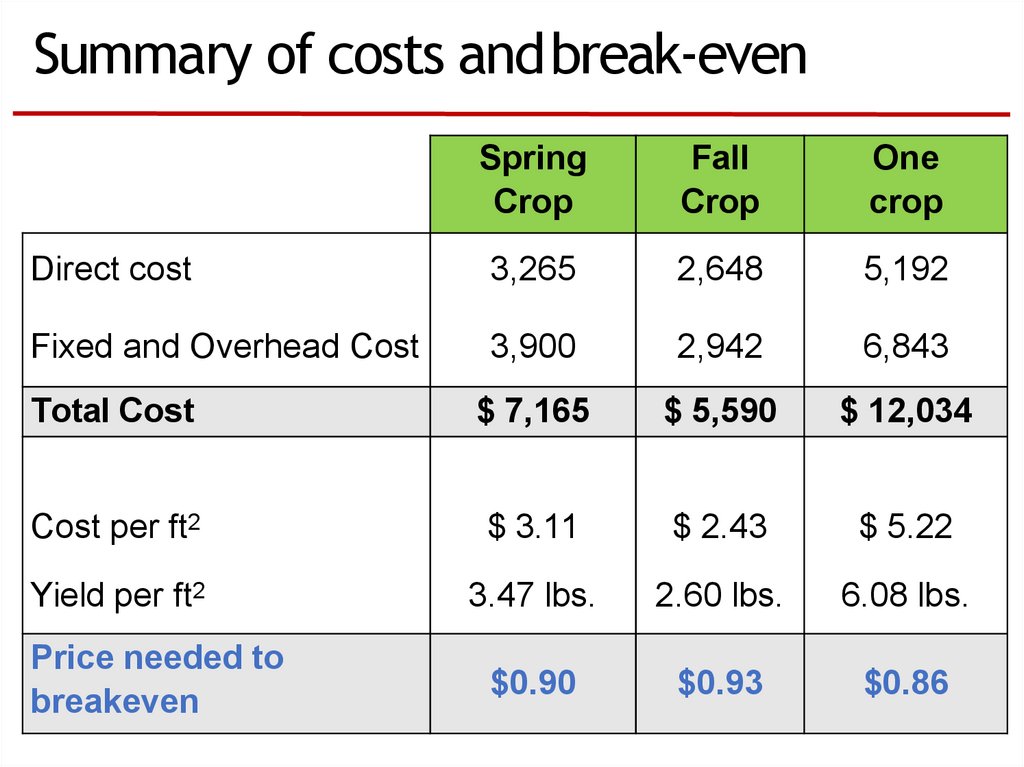
40.
Summary of costs andbreak-evenSpring
Crop
Fall
Crop
One
crop
Direct cost
3,265
2,648
5,192
Fixed and Overhead Cost
3,900
2,942
6,843
Total Cost
$ 7,165
$ 5,590
$ 12,034
Cost per ft2
$ 3.11
$ 2.43
$ 5.22
Yield per ft2
3.47 lbs.
2.60 lbs.
6.08 lbs.
$0.90
$0.93
$0.86
Price needed to
breakeven
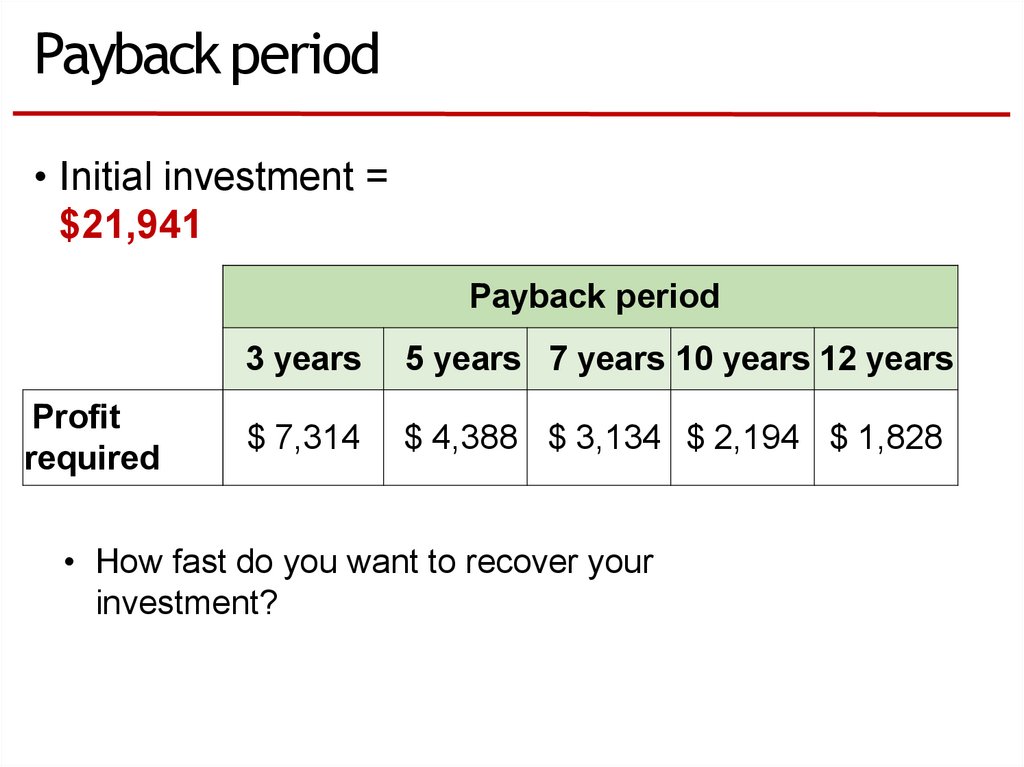
41.
Payback period• Initial investment =
$21,941
Payback period
Profit
required
3 years
5 years 7 years 10 years 12 years
$ 7,314
$ 4,388 $ 3,134 $ 2,194 $ 1,828
• How fast do you want to recover your
investment?
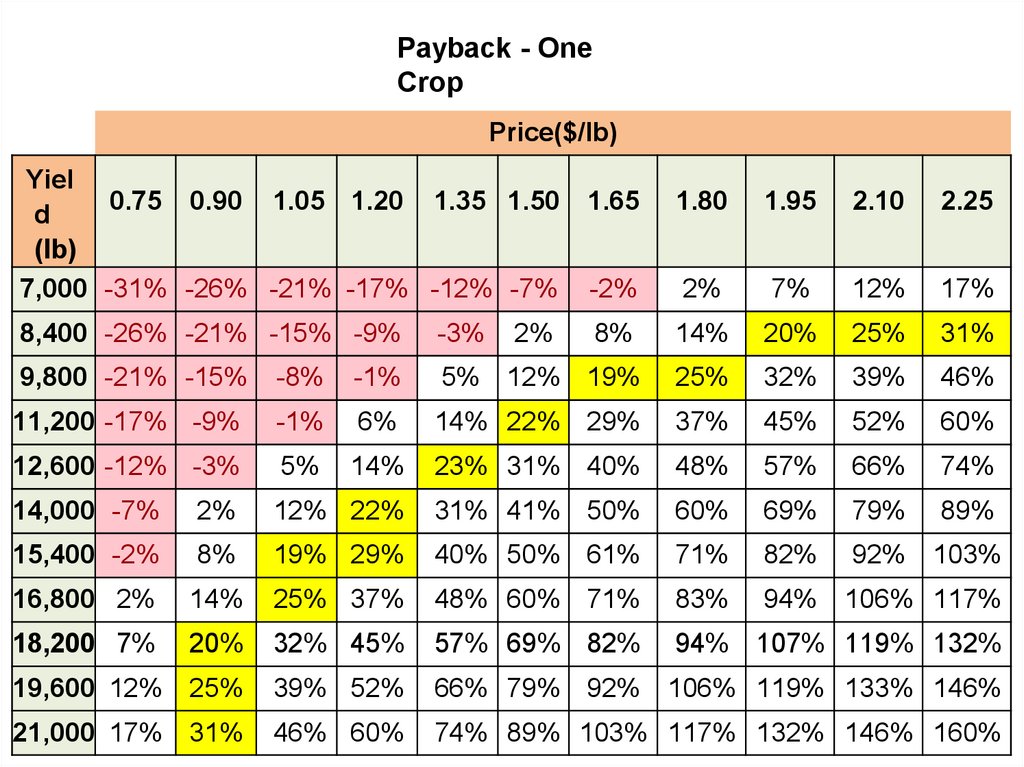
42.
Payback - OneCrop
Price($/lb)
Yiel
0.75 0.90 1.05 1.20 1.35 1.50
d
(lb)
7,000 -31% -26% -21% -17% -12% -7%
2%
1.65
1.80
1.95
2.10
2.25
-2%
2%
7%
12%
17%
8,400 -26% -21% -15% -9%
-3%
8%
14%
20%
25%
31%
9,800 -21% -15%
-8%
-1%
5% 12% 19%
25%
32%
39%
46%
11,200 -17% -9%
-1%
6%
14% 22% 29%
37%
45%
52%
60%
12,600 -12% -3%
5%
14%
23% 31% 40%
48%
57%
66%
74%
14,000 -7%
2%
12% 22%
31% 41% 50%
60%
69%
79%
89%
15,400 -2%
8%
19% 29%
40% 50% 61%
71%
82%
92%
103%
16,800 2%
14%
25% 37%
48% 60% 71%
83%
94% 106% 117%
18,200 7%
20%
32% 45%
57% 69% 82%
94%
107% 119% 132%
19,600 12% 25%
39% 52%
66% 79% 92% 106% 119% 133% 146%
21,000 17% 31%
46% 60%
74% 89% 103% 117% 132% 146% 160%
43.
OutlineIntroduction: Industry Overview
Planning for a new Operation
Greenhouse Tomato Budget
and cost analysis
Marketing Considerations
Financial Considerations
44.
Marketing plan• Market analysis
• Trends
• Market demographics
• Competition
• Strengths,
Weaknesses,
Opportunities and
Threats (SWOT)
analysis
• Is there a market
potential?
45.
Trends: Tomato industry• Steadily increase in consumption
• 4th most consumed vegetable
• Greenhouse tomatoes enjoy
price premiums
• Preference for greenhouse tomatoes
(taste)
• Consumer willingness to pay more for a
high quality product
• Growth in supply puts pressure on
prices.
• Trade plays an important role
• Greenhouse tomatoes account for
approx. 40% of imports
46.
Market trends: Fruit and vegetableconsumption• Fresh vegetables growth:
+8%
Fast food establishments:
more salads and fruit
offerings.
Diet and health issues.
Local food systems programs
Consumers’ interest in food origin.
Source: 2015 Study on America’s Consumption of Fruit &
47.
Market trends: increasing interest in localfoods• Local foods - represents a small share
but it is increasing
• Locally grown
• Direct-to-consumer marketing
• Farm-to-table
• Farm-to-school
• Locally sourced products.
• Greenhouse production benefit –
eating local year-round.
• Growing demand for fresh, healthy,
transparent products, organic,
sustainably grown products.
48.
Importance of local marketchannels• Good alternative for small farms
• Not always easy for local farmers to access largervolume marketing channels.
• Farmers’ markets, CSA’s, and roadside stands.
• High price per unit - small sale volumes.
• Can combine with sales to foodservice, institutions
and retail food markets
• Increase cash flow and production scale.
• It can be a profitable niche for some
• Generally, no need for GAP/GDP or other certifications.
49.
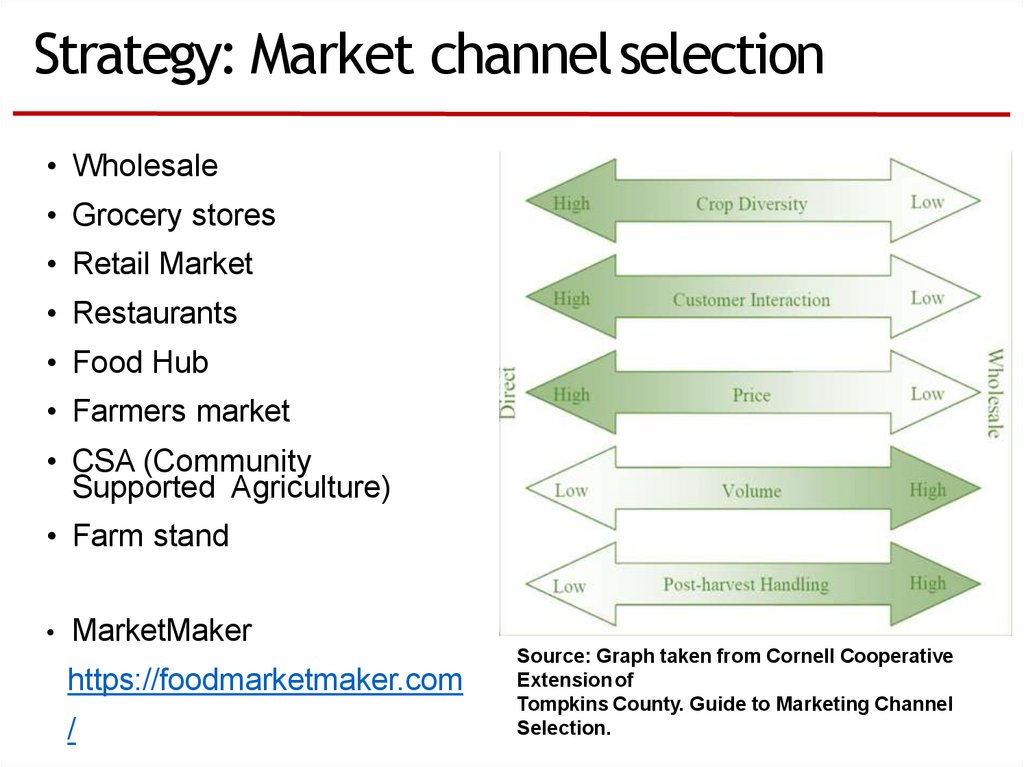
Strategy: Market channelselection• Wholesale
• Grocery stores
• Retail Market
• Restaurants
• Food Hub
• Farmers market
• CSA (Community
Supported Agriculture)
• Farm stand
MarketMaker
https://foodmarketmaker.com
/
Source: Graph taken from Cornell Cooperative
Extension of
Tompkins County. Guide to Marketing Channel
Selection.
50.
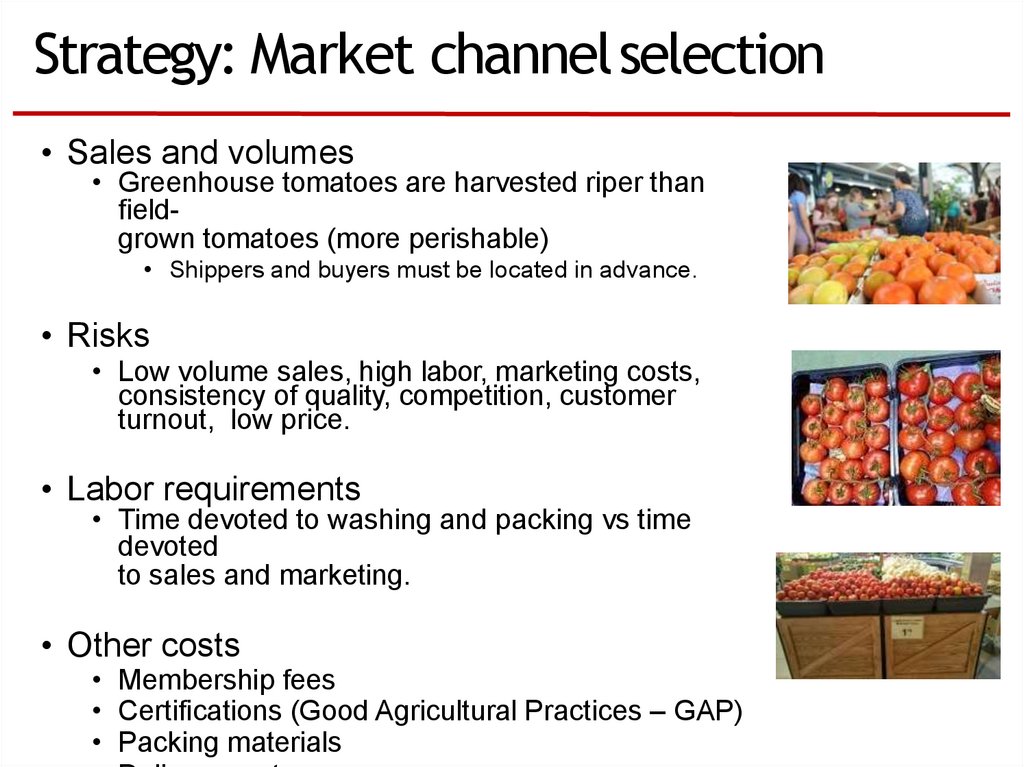
Strategy: Market channelselection• Sales and volumes
• Greenhouse tomatoes are harvested riper than
fieldgrown tomatoes (more perishable)
• Shippers and buyers must be located in advance.
• Risks
• Low volume sales, high labor, marketing costs,
consistency of quality, competition, customer
turnout, low price.
• Labor requirements
• Time devoted to washing and packing vs time
devoted
to sales and marketing.
• Other costs
• Membership fees
• Certifications (Good Agricultural Practices – GAP)
• Packing materials
51.
Strategy: Market channelselection• It is important for greenhouse tomato growers to
stablish marketing channels before beginning
production.
• Do not enter the industry if you do not know where you will
sell.
• Evaluate channels based on performance:
• Weekly sales
• Costs
• Labor requirements
• Risks
• Profits
• Personal goals
52.
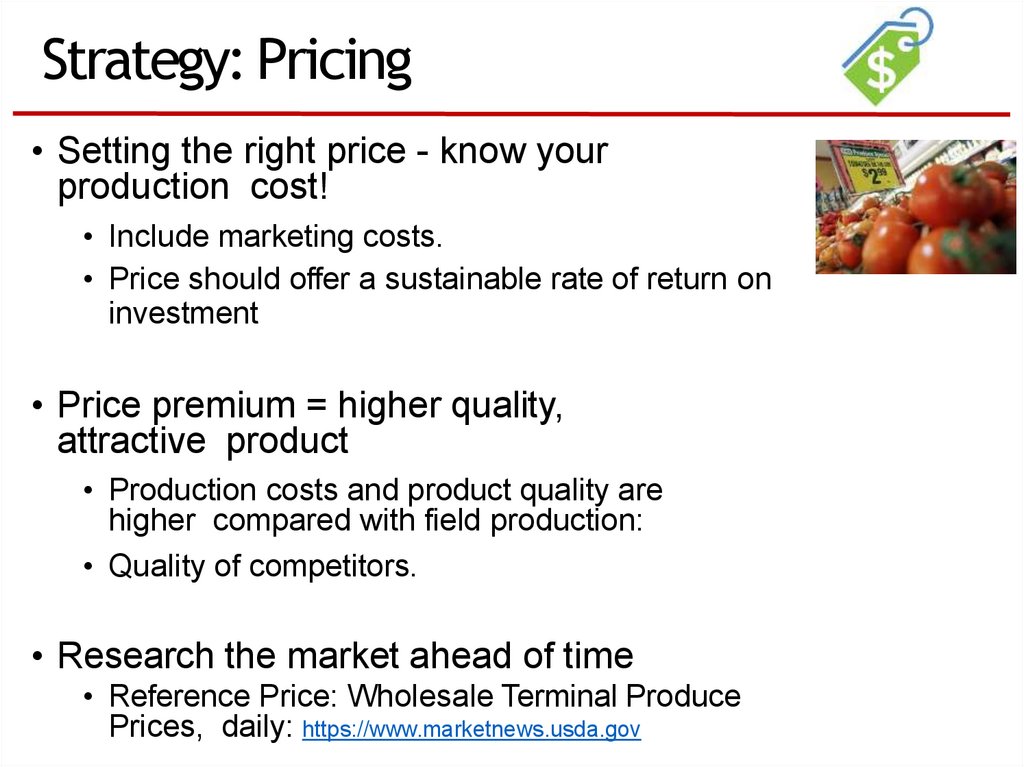
Strategy: Pricing• Setting the right price - know your
production cost!
• Include marketing costs.
• Price should offer a sustainable rate of return on
investment
• Price premium = higher quality,
attractive product
• Production costs and product quality are
higher compared with field production:
• Quality of competitors.
• Research the market ahead of time
• Reference Price: Wholesale Terminal Produce
Prices, daily: https://www.marketnews.usda.gov
53.
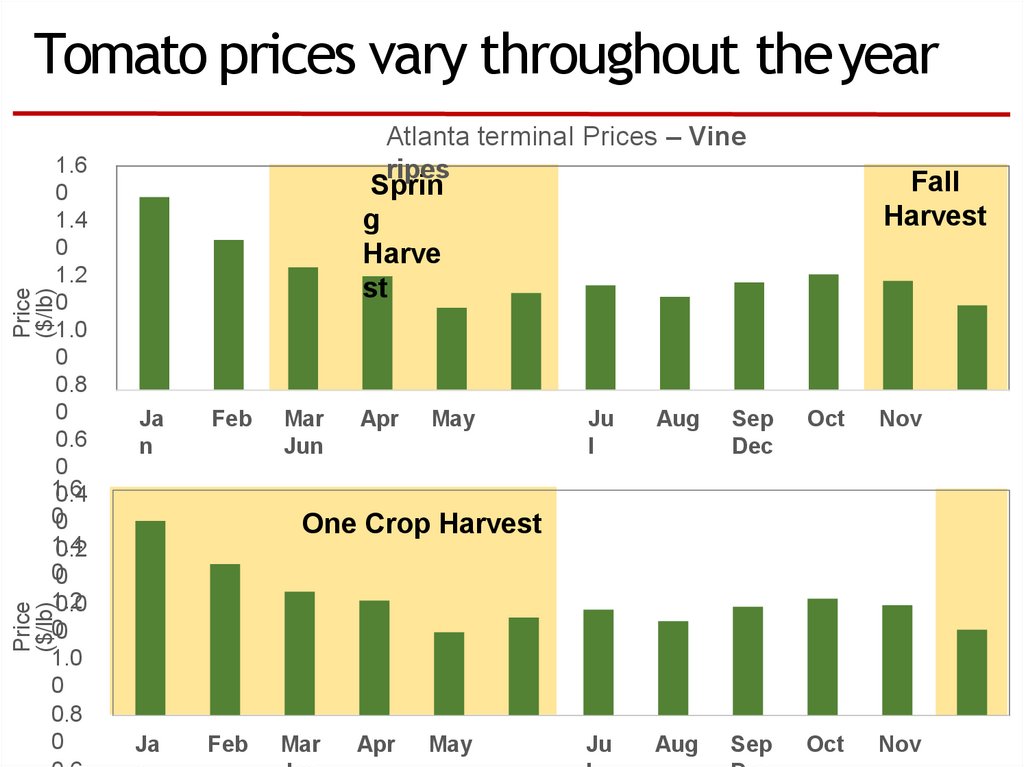
Tomato prices vary throughout theyearFall
Harvest
Sprin
g
Harve
st
Price
($/lb)
1.6
0
1.4
0
1.2
0
1.0
0
0.8
0
0.6
0
1.6
0.4
00
1.4
0.2
00
1.2
0.0
00
1.0
0
0.8
0
Atlanta terminal Prices – Vine
ripes
Ja
n
Feb
Mar
Jun
Apr
May
Ju
l
Aug
Sep
Dec
Oct
Nov
Ju
Aug
Sep
Oct
Nov
Price
($/lb)
One Crop Harvest
Ja
Feb
Mar
Apr
May
54.
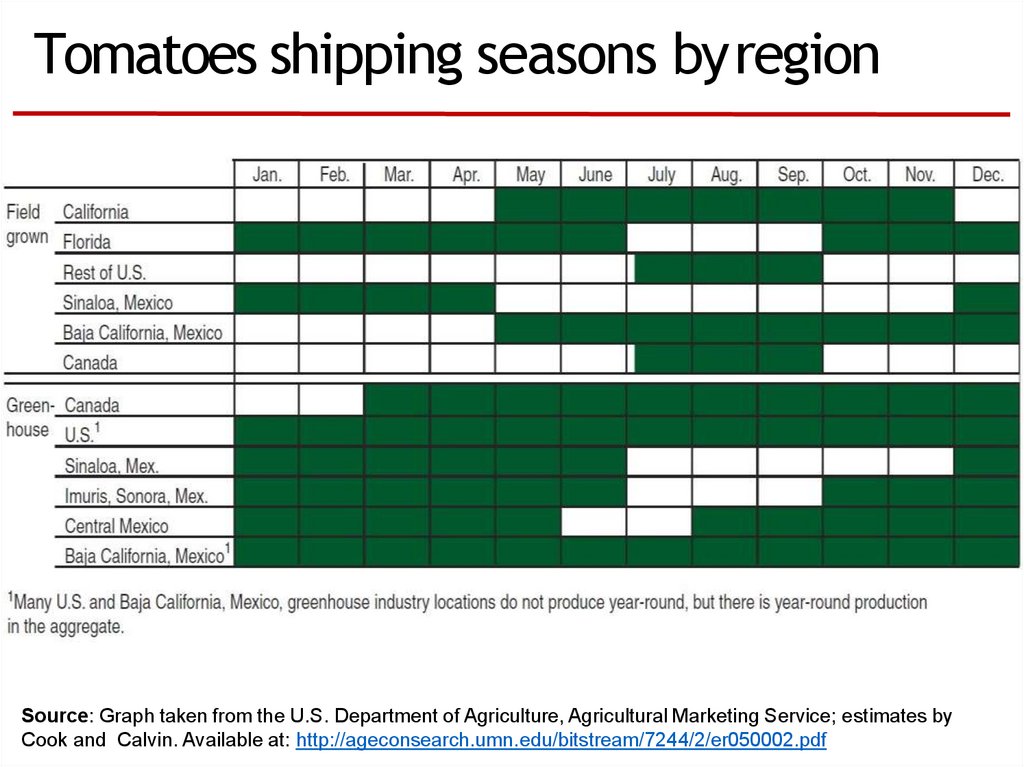
Tomatoes shipping seasons byregionSource: Graph taken from the U.S. Department of Agriculture, Agricultural Marketing Service; estimates by
Cook and Calvin. Available at: http://ageconsearch.umn.edu/bitstream/7244/2/er050002.pdf
55.
OutlineIntroduction: Industry Overview
Planning for a new Operation
Greenhouse Tomato Budget
and cost analysis
Marketing Considerations
Financial Considerations
56.
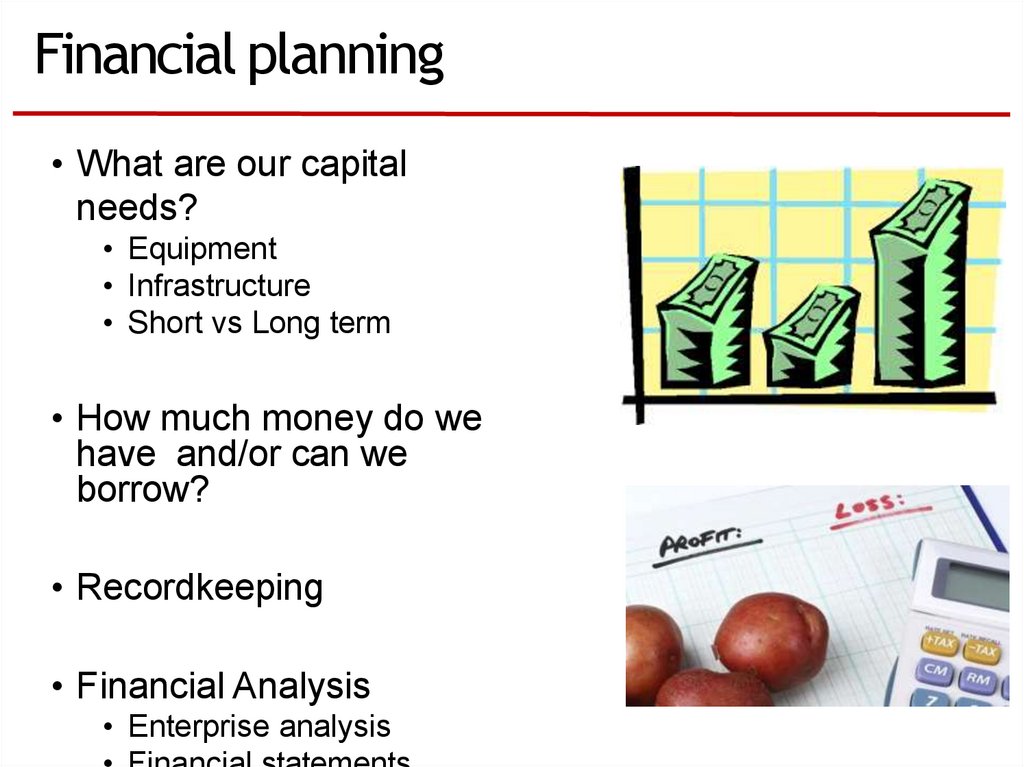
Financial planning• What are our capital
needs?
• Equipment
• Infrastructure
• Short vs Long term
• How much money do we
have and/or can we
borrow?
• Recordkeeping
• Financial Analysis
• Enterprise analysis
57.
Keep records for more than justtaxes!
58.
Keeping detailed farm records is important!• Records of day to day transactions
• Don’t rely on your memory!
• Financial records:
Income: Money received from fruits and vegetable sales
Expenses: Money paid for inputs and services
Assets: All your physical and monetary values
Liabilities: Money you owe.
• Production/Cultural records
• Field size, crop, land preparation, inputs used, irrigation,
pesticide use
• Harvest date, amount and quality of product harvested
• How can we improve production?
• Key to make informed decisions
• Investment decisions
• Producing or buying decision
• Helps to evaluate performance.
59.
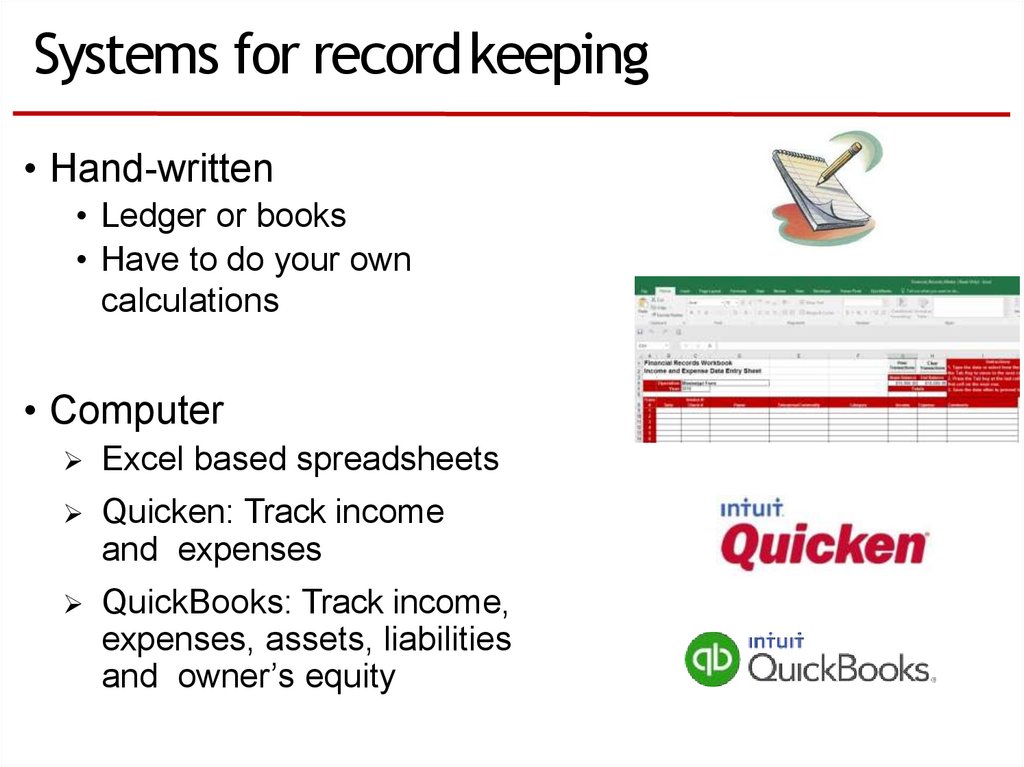
Systems for record keeping• Hand-written
• Ledger or books
• Have to do your own
calculations
• Computer
Excel based spreadsheets
Quicken: Track income
and expenses
QuickBooks: Track income,
expenses, assets, liabilities
and owner’s equity
60.
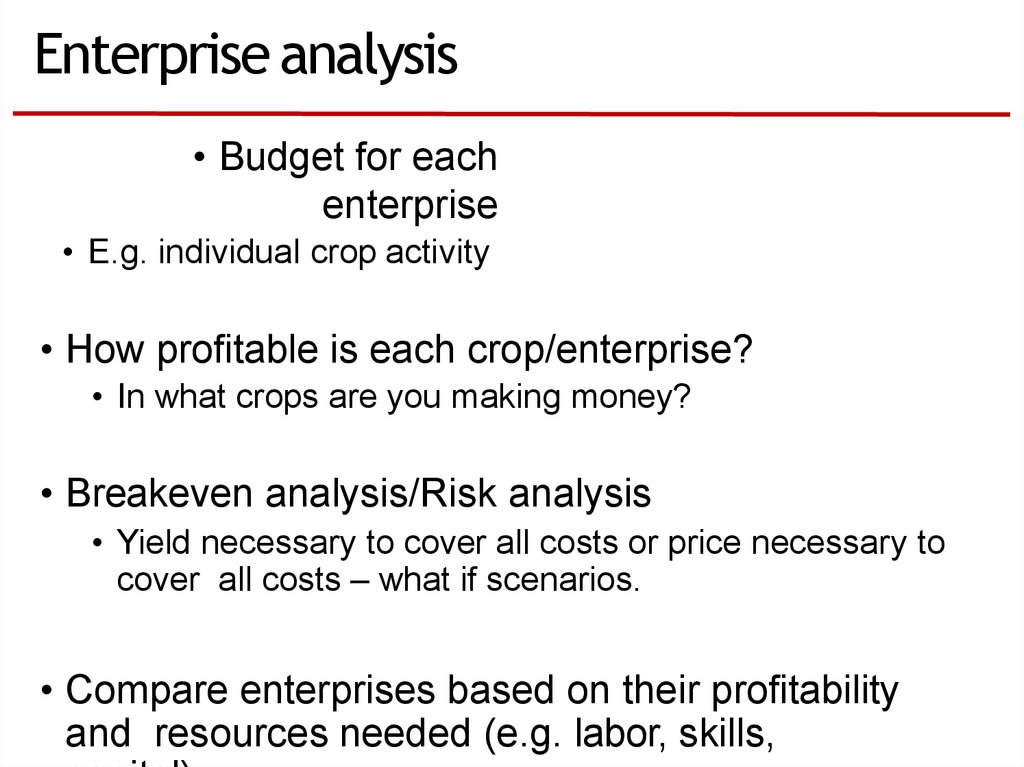
Enterprise analysis• Budget for each
enterprise
• E.g. individual crop activity
• How profitable is each crop/enterprise?
• In what crops are you making money?
• Breakeven analysis/Risk analysis
• Yield necessary to cover all costs or price necessary to
cover all costs – what if scenarios.
• Compare enterprises based on their profitability
and resources needed (e.g. labor, skills,
61.
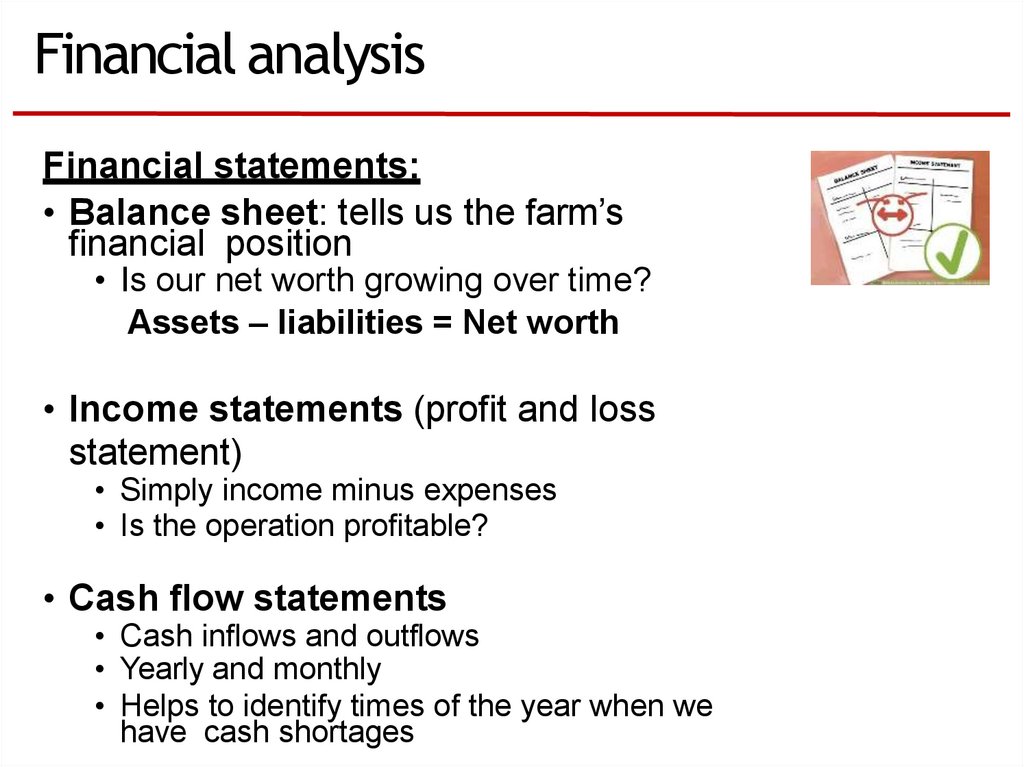
Financial analysisFinancial statements:
• Balance sheet: tells us the farm’s
financial position
• Is our net worth growing over time?
Assets – liabilities = Net worth
• Income statements (profit and loss
statement)
• Simply income minus expenses
• Is the operation profitable?
• Cash flow statements
• Cash inflows and outflows
• Yearly and monthly
• Helps to identify times of the year when we
have cash shortages
62.
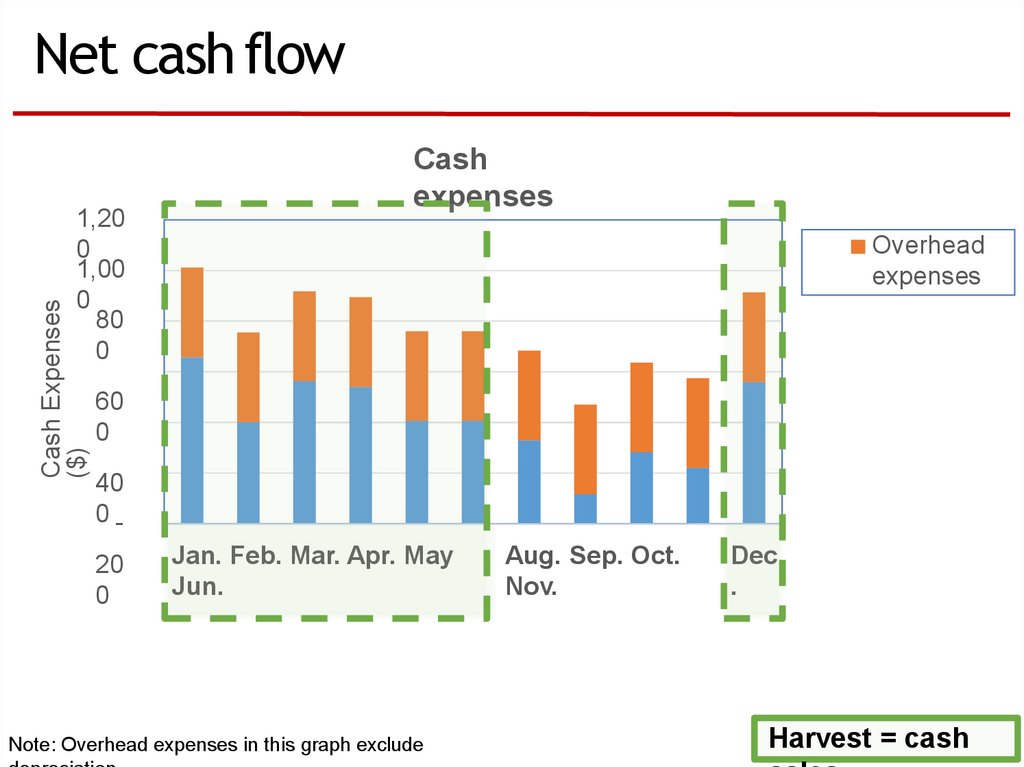
Net cash flowCash Expenses
($)
1,20
0
1,00
0
80
0
Cash
expenses
Overhead
expenses
60
0
40
020
0
Jan. Feb. Mar. Apr. May
Jun.
Note: Overhead expenses in this graph exclude
Aug. Sep. Oct.
Nov.
Dec
.
Harvest = cash
63.
Remember…• Maintaining good records is essential
• Production and financial
• Key to developing useful budgets
• Estimate costs and returns (budget) for each of
your enterprises.
• Keeping farm and personal finances separate is a
good practice.
• Use enterprise budgets to inform your decisions.
64.
THANKYOU!
Elizabeth Canales
Phone: (662) 3252516
Elizabeth.canales@msstate.
edu