

 Биология
Похожие презентации:


")


Rescue of the senescence phenotype of AD MSCs by autophagy activation in 3D spheroids
1.
Rescue of the senescence phenotype of AD MSCs by autophagyactivation in 3D spheroids.
Ольга Быстрова
- лаборатория морфологии клетки
Марина Мартынова
- лаборатория морфологии клетки
Наталья Ярцева
- группа Цитогенетики
Татьяна Крылова
- группа «Банк клеточных культур»
Елена Кочеткова
- лаборатория молекулярных основ
дифференцировки клеток
Катя Байдюк
Арина Савельева
-лаборатория РЭГ
- лаборатория РЭГ
2.
Human MSCs (hMSCs) are cells capable of self-renewal and multi-lineage differentiation into various tissues ofmesodermal origin. These cells can be easily isolated and expanded from the stroma of virtually all organs, although the
preferred sources are bone marrow and subcutaneous fat.
MSCs have been broadly applied in the treatment of various diseases, including graft-versus-host disease (GVHD), Crohn's
disease (CD), diabetes mellitus (DM), multiple sclerosis (MS), myocardial infarction (MI), liver failure, and rejection after liver
transplant.
Upon isolation, hMSCs are characterized by their capability to develop as fibroblast colony-forming-units, and differentiate
into osteocytes, chondrocytes, and adipocytes.
hMSCs are positive for CD73, CD90, CD105, СD106, CD29, CD166, and negative for CD11b, CD14, CD34, CD45,
HLA-DR, CD79α and CD19.
The function of MSCs is known to decline with age, a process that may be implicated in the loss of maintenance of tissue
homeostasis leading to organ failure and diseases of aging
Cultured primary cells do not grown infinitely, but undergo only a limited number of cell division, in a process called cellular
senescence. Cell therapy protocols generally require hundreds of million hMSCs per treatment and, consequently, these cells
need to be expanded in vitro for about 10 weeks before implantation. Notably, patient’s clinical history, age, and genetic
makeup strongly influence the length of this expansion period and the quality of the obtained cells. Aged MSCs generally
perform less well than their younger counterparts in various disease models and mounting evidence strongly suggests that
cellular senescence contribute to aging and age-related diseases.
It would, thus, be of great significance to monitor the occurrence of a senescent phenotype in hMSCs addressed to clinical
uses and to evaluate the functional consequences of senescence in hMSCs which could affect their clinical therapeutic
potential, taking into account their paracrine effects, immunomodulatory activity, differentiation potential, and cell
migration ability.
3.
The term senescence was applied to cells that ceased to divide in culture, based on the speculation that their behaviourrecapitulated organismal ageing. Consequently, cellular senescence is sometimes termed cellular ageing or replicative
senescence
MARKERS of SENESCENCE
Telomere shortening provided the first molecular explanation for why many cells cease to divide in culture.
Dysfunctional telomeres trigger senescence through the p53 pathway.
This response is often termed telomere-initiated cellular senescence. Some cells undergo replicative senescence
independently of telomere shortening.
Resistance to apoptosis might partly explain why senescent cells are so stable in culture. This attribute might also
explain why the number of senescent cells increases with age.
Changes in cell cycle inhibitors: p21Cip1 and p16InK4a. These CDKIs are components of tumour suppressor pathways
that are governed by the p53 and retinoblastoma pRB proteins.
New markers in Oncogene induced senescence: DEC1 (differentiated embryo chondrocyte expressed1), p15 (a
CDKI) and DCR2 (decoy death receptor2). The specificity and significance of these proteins for senescent cells
are not yet clear, but they are promising additional markers.
Dramatic structural changes of chromatin in senescent cells- Lamin B1. Presence of certain heterochromatin
associated histone modifications (H3 lys9 methylation) and heterochromatin protein1 (Hp1)). In some cases - global
heterochromatin loss, characterized by markers H3K9me3 and H3K27me3. Predominantly during OIS in vitro,
heterochromatin is redistributed into 30–50 punctate DNA-dense senescence-associated heterochromatin foci
(SAHF). SAHF are silent domains that co-localize with H3K9me3 and heterochromatin protein 1 (HP1) and may lock
cells in a senescent state by transcriptionally repressing genes involved in cell proliferation.
4.
DNA methyltransferases (DNMTs)Expression levels of DNMT1 and DNMT3B are significantly decreased during the replicative senescence of MSCs,
leading to a decrease in the DNA methylation level, called hypomethylation, which is a distinct feature of senescent
cells.
In contrast, DNMT3a expression was found to be increased during replicative senescence, participating in the new
methylation associated with senescence. DNMT inhibitors, such as 5-azacytidine, can upregulate p16INK4a/CDKN2A,
p21CIP1/WAF1 and miRNAs targeting EZH1, and the induction of cellular senescence in MSCs
5.
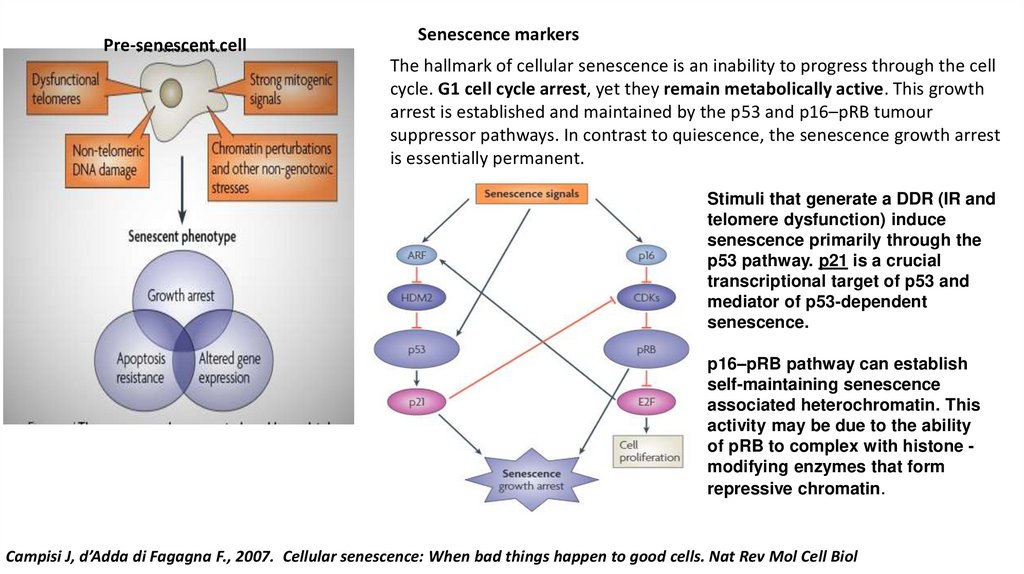
Pre-senescent cellSenescence markers
The hallmark of cellular senescence is an inability to progress through the cell
cycle. G1 cell cycle arrest, yet they remain metabolically active. This growth
arrest is established and maintained by the p53 and p16–pRB tumour
suppressor pathways. In contrast to quiescence, the senescence growth arrest
is essentially permanent.
Stimuli that generate a DDR (IR and
telomere dysfunction) induce
senescence primarily through the
p53 pathway. p21 is a crucial
transcriptional target of p53 and
mediator of p53-dependent
senescence.
p16–pRB pathway can establish
self-maintaining senescence
associated heterochromatin. This
activity may be due to the ability
of pRB to complex with histone modifying enzymes that form
repressive chromatin.
Campisi J, d’Adda di Fagagna F., 2007. Cellular senescence: When bad things happen to good cells. Nat Rev Mol Cell Biol
6.
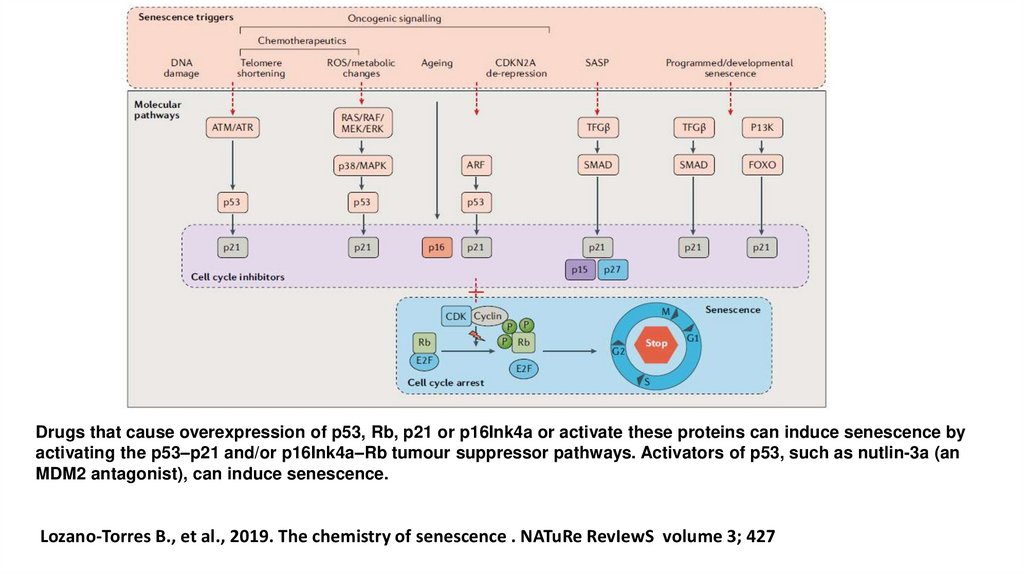
Drugs that cause overexpression of p53, Rb, p21 or p16Ink4a or activate these proteins can induce senescence byactivating the p53–p21 and/or p16Ink4a–Rb tumour suppressor pathways. Activators of p53, such as nutlin-3a (an
MDM2 antagonist), can induce senescence.
Lozano-Torres B., et al., 2019. The chemistry of senescence . NATuRe RevIewS volume 3; 427
7.
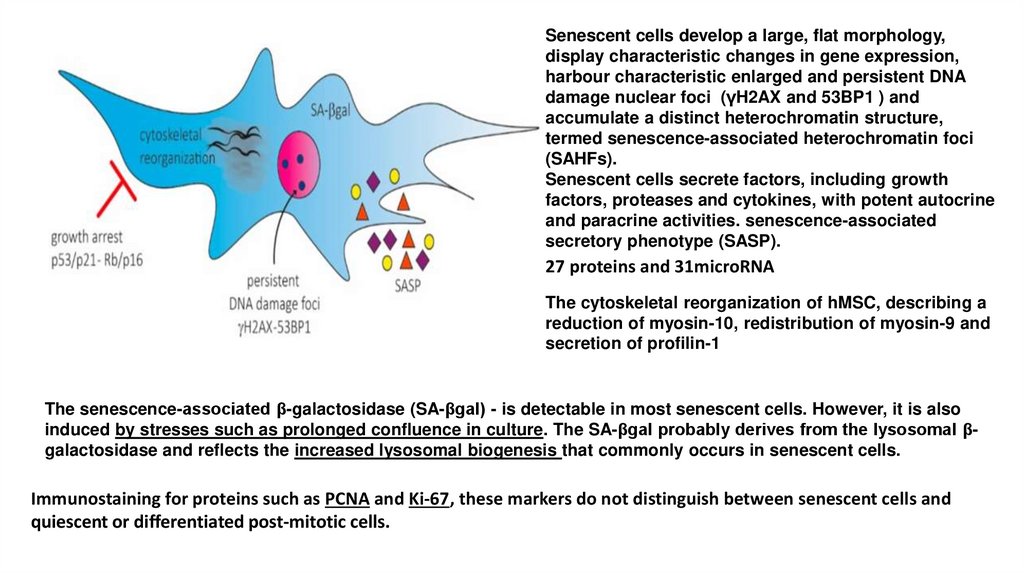
Senescent cells develop a large, flat morphology,display characteristic changes in gene expression,
harbour characteristic enlarged and persistent DNA
damage nuclear foci (γH2AX and 53BP1 ) and
accumulate a distinct heterochromatin structure,
termed senescence-associated heterochromatin foci
(SAHFs).
Senescent cells secrete factors, including growth
factors, proteases and cytokines, with potent autocrine
and paracrine activities. senescence-associated
secretory phenotype (SASP).
27 proteins and 31microRNA
The cytoskeletal reorganization of hMSC, describing a
reduction of myosin-10, redistribution of myosin-9 and
secretion of profilin-1
The senescence-associated β-galactosidase (SA-βgal) - is detectable in most senescent cells. However, it is also
induced by stresses such as prolonged confluence in culture. The SA-βgal probably derives from the lysosomal βgalactosidase and reflects the increased lysosomal biogenesis that commonly occurs in senescent cells.
Immunostaining for proteins such as PCNA and Ki-67, these markers do not distinguish between senescent cells and
quiescent or differentiated post-mitotic cells.
8.
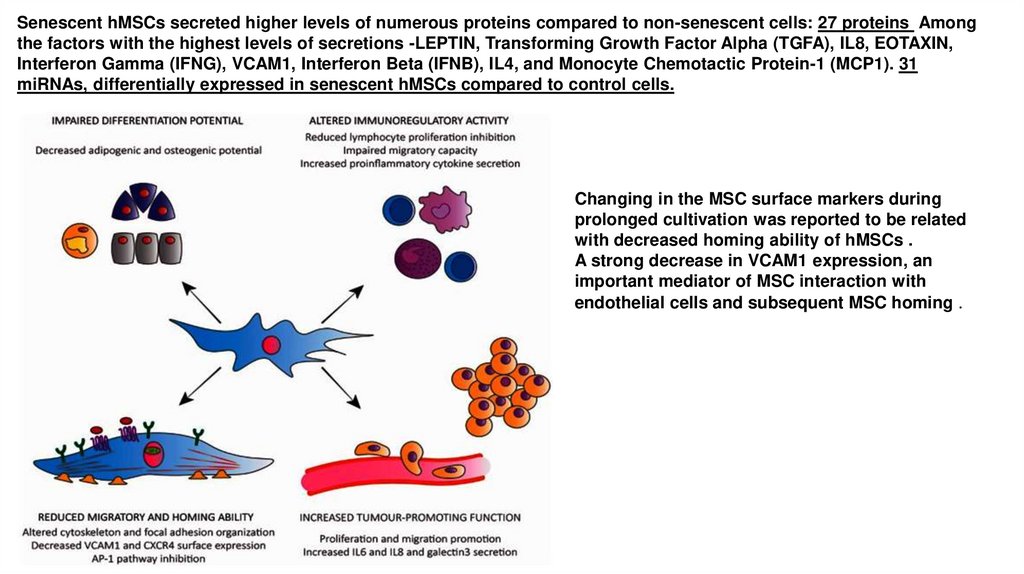
Senescent hMSCs secreted higher levels of numerous proteins compared to non-senescent cells: 27 proteins Amongthe factors with the highest levels of secretions -LEPTIN, Transforming Growth Factor Alpha (TGFA), IL8, EOTAXIN,
Interferon Gamma (IFNG), VCAM1, Interferon Beta (IFNB), IL4, and Monocyte Chemotactic Protein-1 (MCP1). 31
miRNAs, differentially expressed in senescent hMSCs compared to control cells.
Changing in the MSC surface markers during
prolonged cultivation was reported to be related
with decreased homing ability of hMSCs .
A strong decrease in VCAM1 expression, an
important mediator of MSC interaction with
endothelial cells and subsequent MSC homing .
9.
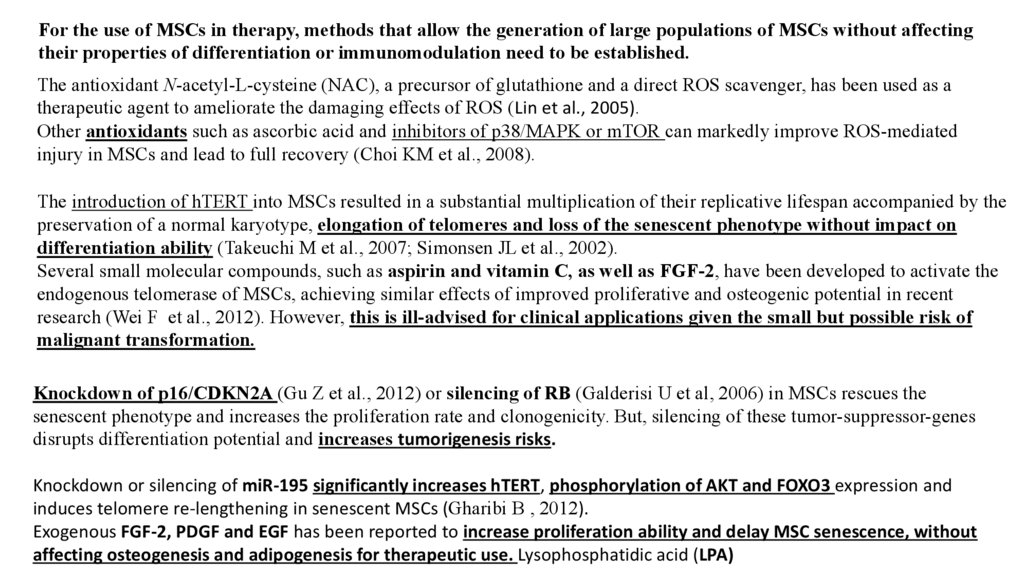
For the use of MSCs in therapy, methods that allow the generation of large populations of MSCs without affectingtheir properties of differentiation or immunomodulation need to be established.
The antioxidant N-acetyl-L-cysteine (NAC), a precursor of glutathione and a direct ROS scavenger, has been used as a
therapeutic agent to ameliorate the damaging effects of ROS (Lin et al., 2005).
Other antioxidants such as ascorbic acid and inhibitors of p38/MAPK or mTOR can markedly improve ROS-mediated
injury in MSCs and lead to full recovery (Choi KM et al., 2008).
The introduction of hTERT into MSCs resulted in a substantial multiplication of their replicative lifespan accompanied by the
preservation of a normal karyotype, elongation of telomeres and loss of the senescent phenotype without impact on
differentiation ability (Takeuchi M et al., 2007; Simonsen JL et al., 2002).
Several small molecular compounds, such as aspirin and vitamin C, as well as FGF-2, have been developed to activate the
endogenous telomerase of MSCs, achieving similar effects of improved proliferative and osteogenic potential in recent
research (Wei F et al., 2012). However, this is ill-advised for clinical applications given the small but possible risk of
malignant transformation.
Knockdown of p16/CDKN2A (Gu Z et al., 2012) or silencing of RB (Galderisi U et al, 2006) in MSCs rescues the
senescent phenotype and increases the proliferation rate and clonogenicity. But, silencing of these tumor-suppressor-genes
disrupts differentiation potential and increases tumorigenesis risks.
Knockdown or silencing of miR-195 significantly increases hTERT, phosphorylation of AKT and FOXO3 expression and
induces telomere re-lengthening in senescent MSCs (Gharibi B , 2012).
Exogenous FGF-2, PDGF and EGF has been reported to increase proliferation ability and delay MSC senescence, without
affecting osteogenesis and adipogenesis for therapeutic use. Lysophosphatidic acid (LPA)
10.
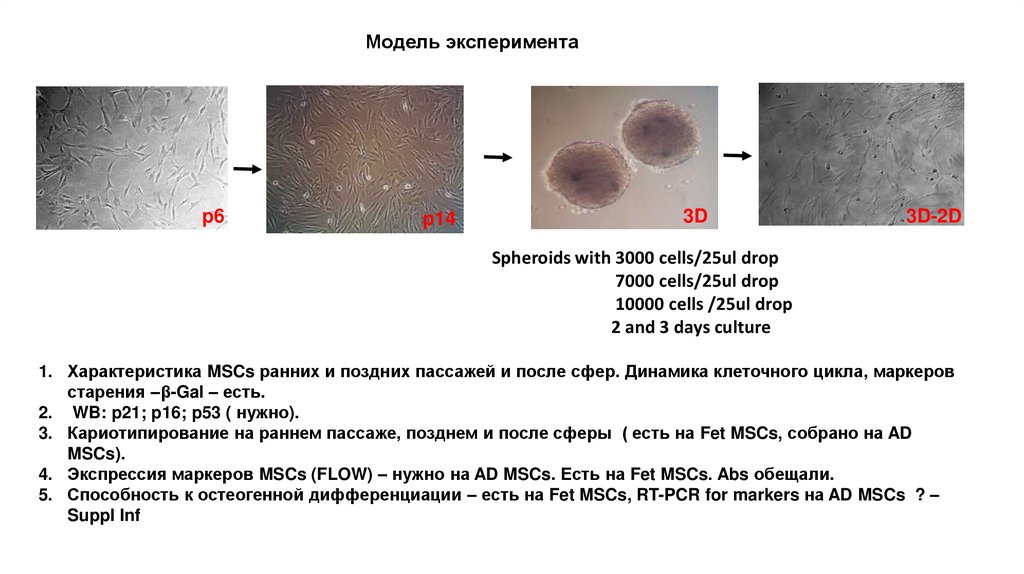
Модель экспериментаp6
p14
3D
3D-2D
Spheroids with 3000 cells/25ul drop
7000 cells/25ul drop
10000 cells /25ul drop
2 and 3 days culture
1. Характеристика MSCs ранних и поздних пассажей и после сфер. Динамика клеточного цикла, маркеров
старения –β-Gal – есть.
2. WB: p21; p16; p53 ( нужно).
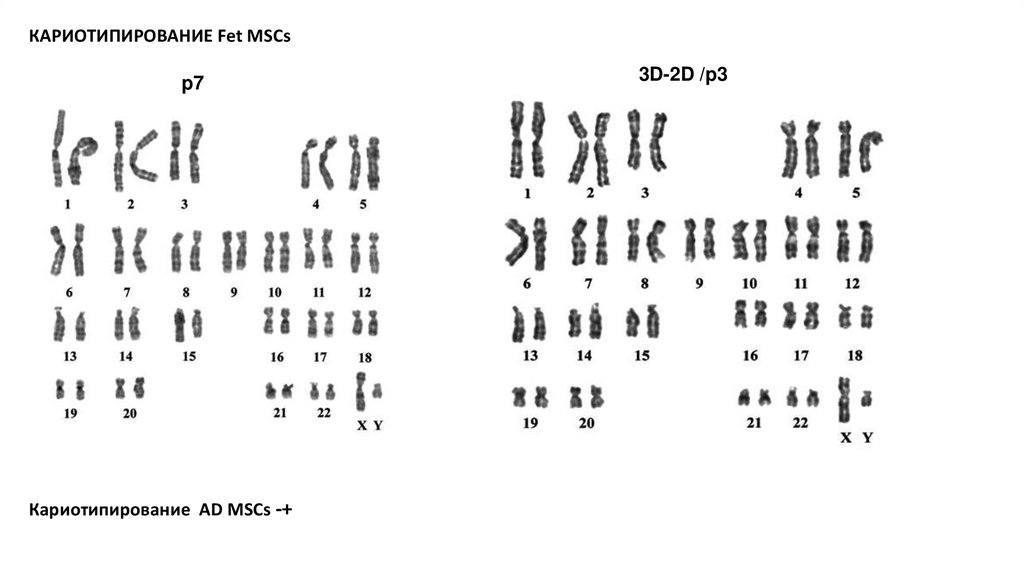
3. Кариотипирование на раннем пассаже, позднем и после сферы ( есть на Fet MSCs, собрано на AD
MSCs).
4. Экспрессия маркеров MSCs (FLOW) – нужно на AD MSCs. Есть на Fet MSCs. Abs обещали.
5. Способность к остеогенной дифференциации – есть на Fet MSCs, RT-PCR for markers на AD MSCs ? –
Suppl Inf
11.
Сеll Cycle Characterization of AD MSCs lines 1 & 2Cell Cycle analysis
pH3 (Ser10)
12.
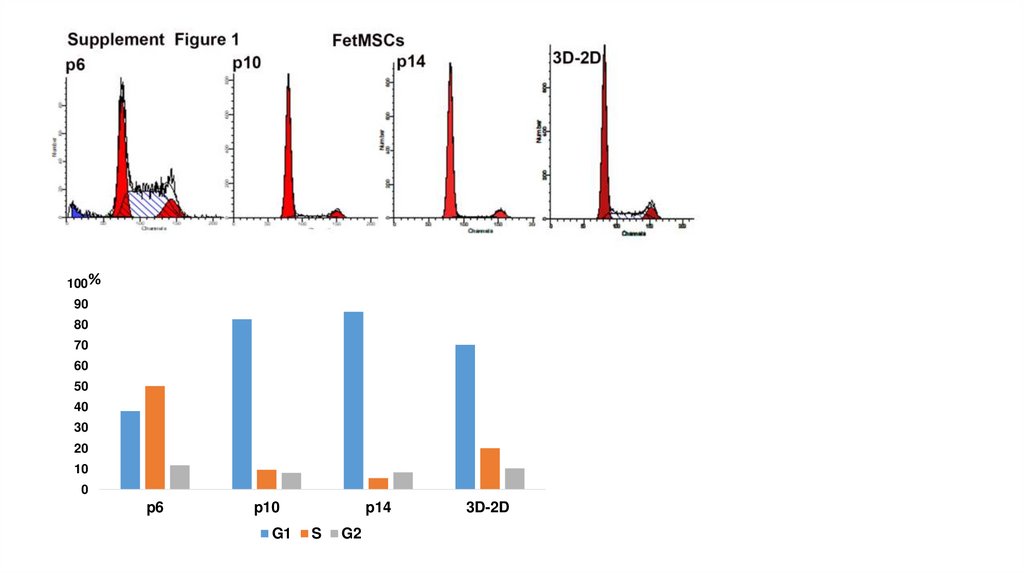
100%90
80
70
60
50
40
30
20
10
0
p6
p10
G1
p14
S
G2
3D-2D
13.
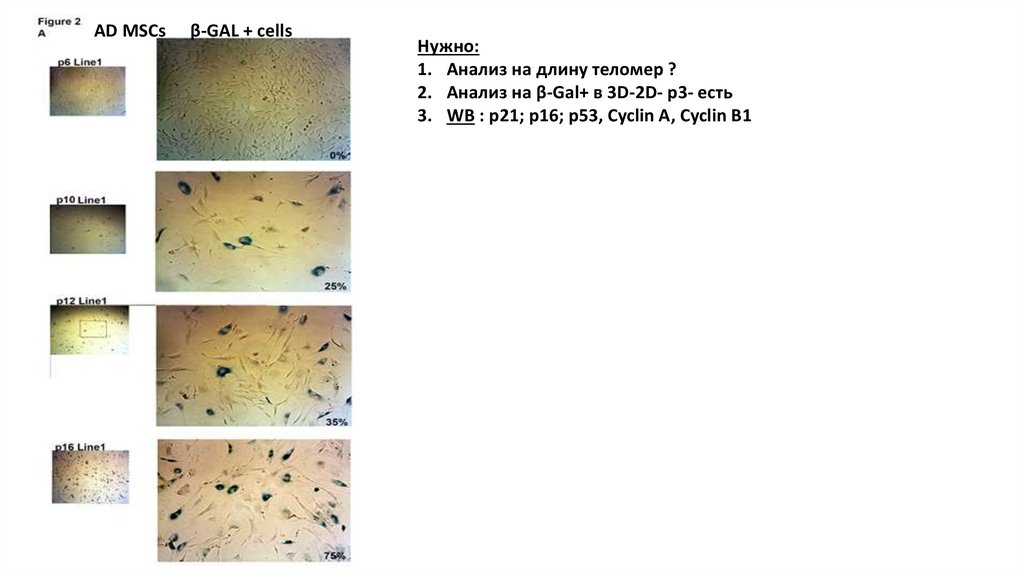
AD MSCsβ-GAL + cells
Нужно:
1. Анализ на длину теломер ?
2. Анализ на β-Gal+ в 3D-2D- p3- есть
3. WB : p21; p16; p53, Cyclin A, Cyclin B1
14.
КАРИОТИПИРОВАНИЕ Fet MSCsp7
Кариотипирование AD MSCs -+
3D-2D /p3
15.
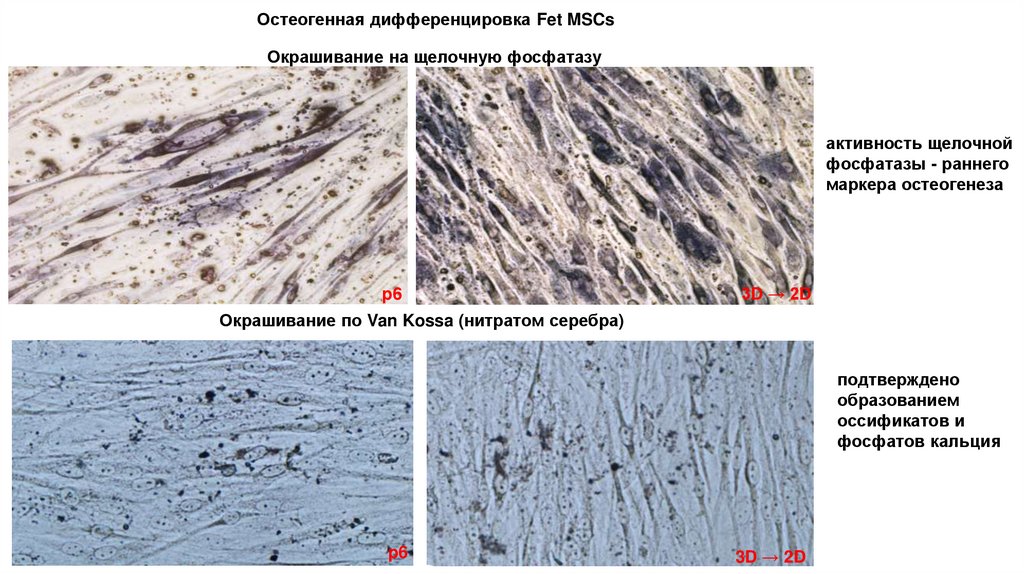
Остеогенная дифференцировка Fet MSCsОкрашивание на щелочную фосфатазу
активность щелочной
фосфатазы - раннего
маркера остеогенеза
p6
3D → 2D
Окрашивание по Van Kossa (нитратом серебра)
подтверждено
образованием
оссификатов и
фосфатов кальция
p6
3D → 2D
16.
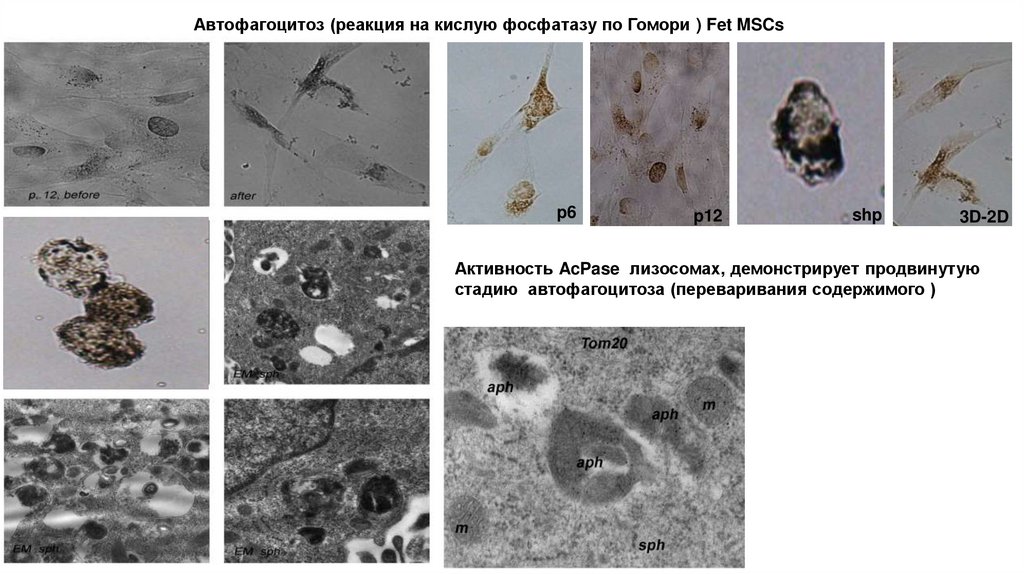
Автофагоцитоз (реакция на кислую фосфатазу по Гомори ) Fet MSCsp6
p12
shp
3D-2D
Активность AcPase лизосомах, демонстрирует продвинутую
стадию автофагоцитоза (переваривания содержимого )
17.
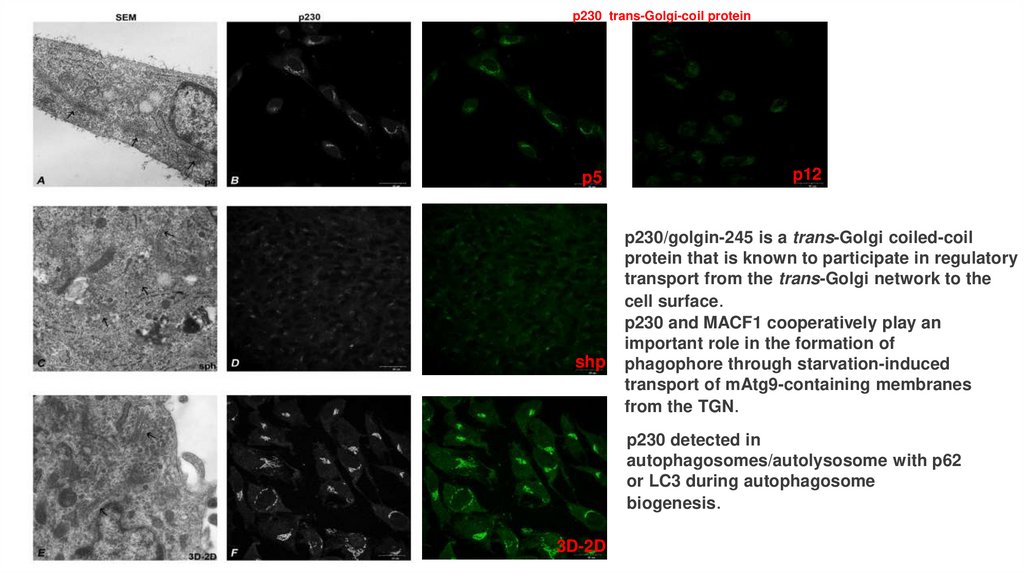
p230 trans-Golgi-coil proteinp5
shp
p12
p230/golgin-245 is a trans-Golgi coiled-coil
protein that is known to participate in regulatory
transport from the trans-Golgi network to the
cell surface.
p230 and MACF1 cooperatively play an
important role in the formation of
phagophore through starvation-induced
transport of mAtg9-containing membranes
from the TGN.
p230 detected in
autophagosomes/autolysosome with p62
or LC3 during autophagosome
biogenesis.
3D-2D
18.
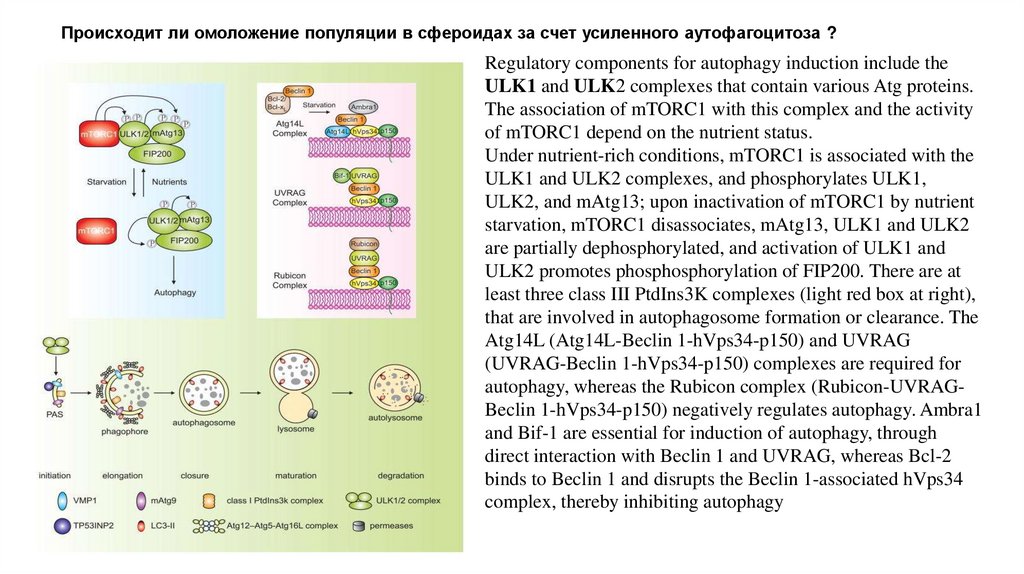
Происходит ли омоложение популяции в сфероидах за счет усиленного аутофагоцитоза ?Regulatory components for autophagy induction include the
ULK1 and ULK2 complexes that contain various Atg proteins.
The association of mTORC1 with this complex and the activity
of mTORC1 depend on the nutrient status.
Under nutrient-rich conditions, mTORC1 is associated with the
ULK1 and ULK2 complexes, and phosphorylates ULK1,
ULK2, and mAtg13; upon inactivation of mTORC1 by nutrient
starvation, mTORC1 disassociates, mAtg13, ULK1 and ULK2
are partially dephosphorylated, and activation of ULK1 and
ULK2 promotes phosphosphorylation of FIP200. There are at
least three class III PtdIns3K complexes (light red box at right),
that are involved in autophagosome formation or clearance. The
Atg14L (Atg14L-Beclin 1-hVps34-p150) and UVRAG
(UVRAG-Beclin 1-hVps34-p150) complexes are required for
autophagy, whereas the Rubicon complex (Rubicon-UVRAGBeclin 1-hVps34-p150) negatively regulates autophagy. Ambra1
and Bif-1 are essential for induction of autophagy, through
direct interaction with Beclin 1 and UVRAG, whereas Bcl-2
binds to Beclin 1 and disrupts the Beclin 1-associated hVps34
complex, thereby inhibiting autophagy
19.
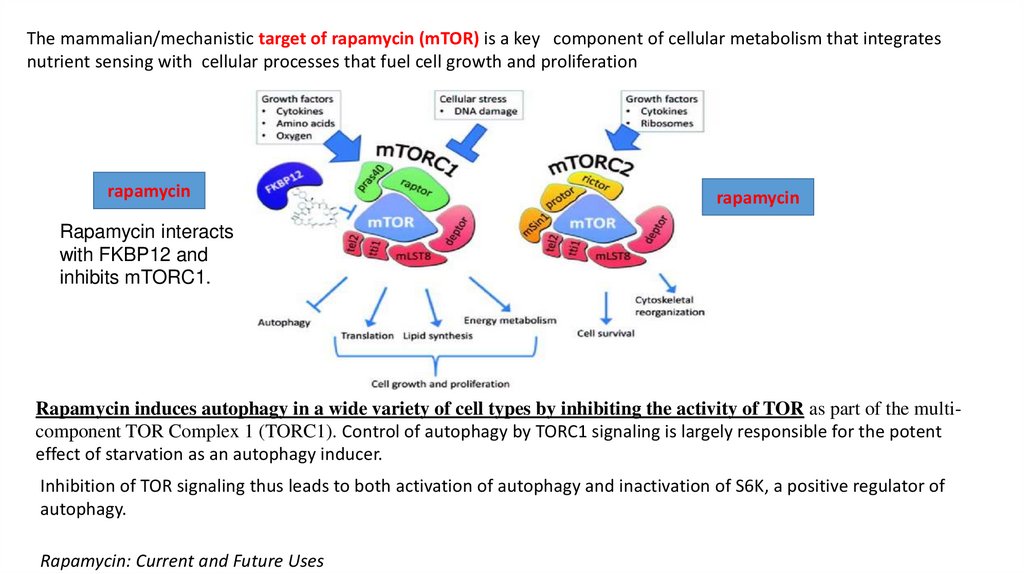
The mammalian/mechanistic target of rapamycin (mTOR) is a key component of cellular metabolism that integratesnutrient sensing with cellular processes that fuel cell growth and proliferation
rapamycin
rapamycin
Rapamycin interacts
with FKBP12 and
inhibits mTORC1.
Rapamycin induces autophagy in a wide variety of cell types by inhibiting the activity of TOR as part of the multicomponent TOR Complex 1 (TORC1). Control of autophagy by TORC1 signaling is largely responsible for the potent
effect of starvation as an autophagy inducer.
Inhibition of TOR signaling thus leads to both activation of autophagy and inactivation of S6K, a positive regulator of
autophagy.
Rapamycin: Current and Future Uses
20.
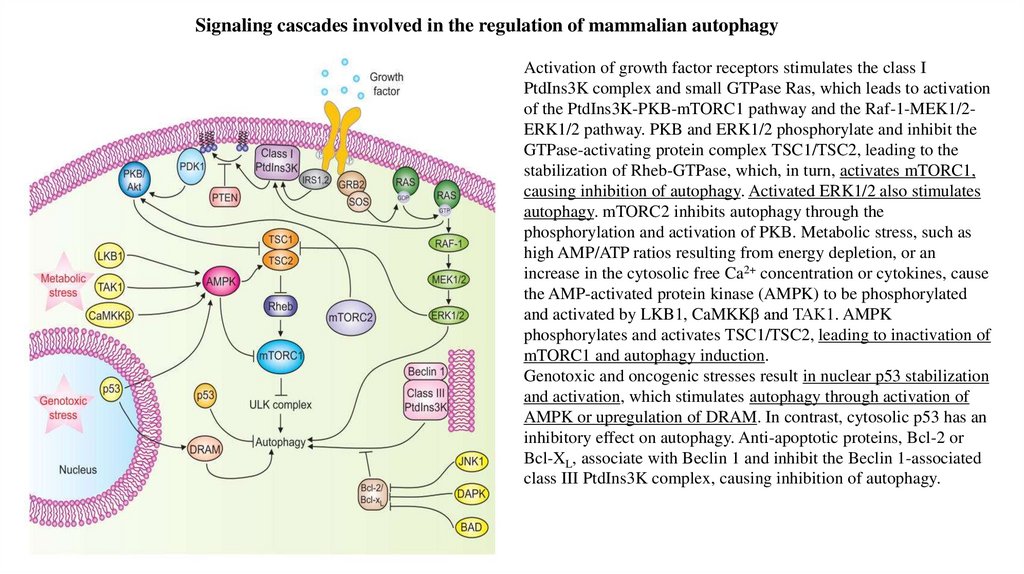
Signaling cascades involved in the regulation of mammalian autophagyActivation of growth factor receptors stimulates the class I
PtdIns3K complex and small GTPase Ras, which leads to activation
of the PtdIns3K-PKB-mTORC1 pathway and the Raf-1-MEK1/2ERK1/2 pathway. PKB and ERK1/2 phosphorylate and inhibit the
GTPase-activating protein complex TSC1/TSC2, leading to the
stabilization of Rheb-GTPase, which, in turn, activates mTORC1,
causing inhibition of autophagy. Activated ERK1/2 also stimulates
autophagy. mTORC2 inhibits autophagy through the
phosphorylation and activation of PKB. Metabolic stress, such as
high AMP/ATP ratios resulting from energy depletion, or an
increase in the cytosolic free Ca2+ concentration or cytokines, cause
the AMP-activated protein kinase (AMPK) to be phosphorylated
and activated by LKB1, CaMKKβ and TAK1. AMPK
phosphorylates and activates TSC1/TSC2, leading to inactivation of
mTORC1 and autophagy induction.
Genotoxic and oncogenic stresses result in nuclear p53 stabilization
and activation, which stimulates autophagy through activation of
AMPK or upregulation of DRAM. In contrast, cytosolic p53 has an
inhibitory effect on autophagy. Anti-apoptotic proteins, Bcl-2 or
Bcl-XL, associate with Beclin 1 and inhibit the Beclin 1-associated
class III PtdIns3K complex, causing inhibition of autophagy.
21.
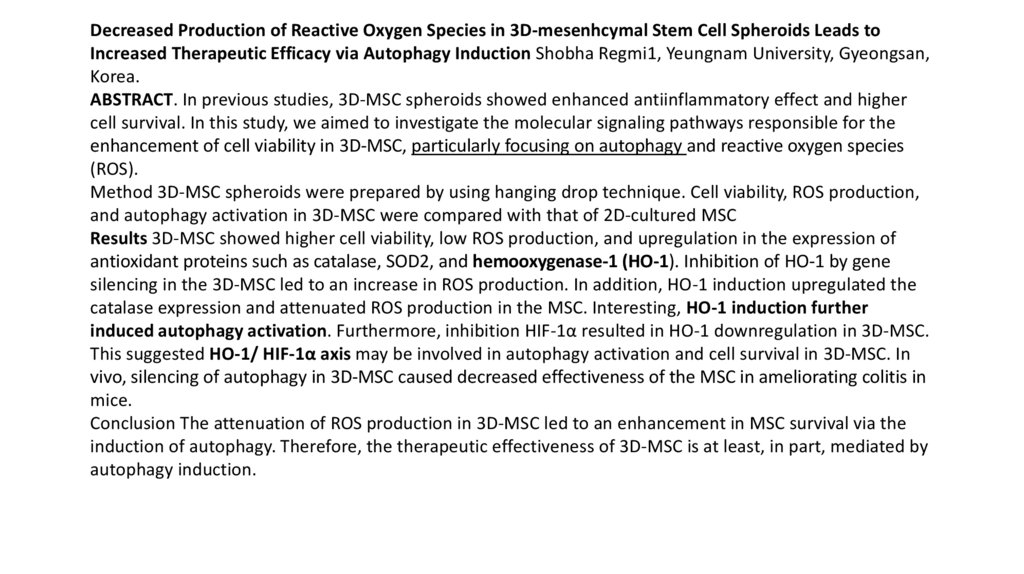
Decreased Production of Reactive Oxygen Species in 3D-mesenhcymal Stem Cell Spheroids Leads toIncreased Therapeutic Efficacy via Autophagy Induction Shobha Regmi1, Yeungnam University, Gyeongsan,
Korea.
ABSTRACT. In previous studies, 3D-MSC spheroids showed enhanced antiinflammatory effect and higher
cell survival. In this study, we aimed to investigate the molecular signaling pathways responsible for the
enhancement of cell viability in 3D-MSC, particularly focusing on autophagy and reactive oxygen species
(ROS).
Method 3D-MSC spheroids were prepared by using hanging drop technique. Cell viability, ROS production,
and autophagy activation in 3D-MSC were compared with that of 2D-cultured MSC
Results 3D-MSC showed higher cell viability, low ROS production, and upregulation in the expression of
antioxidant proteins such as catalase, SOD2, and hemooxygenase-1 (HO-1). Inhibition of HO-1 by gene
silencing in the 3D-MSC led to an increase in ROS production. In addition, HO-1 induction upregulated the
catalase expression and attenuated ROS production in the MSC. Interesting, HO-1 induction further
induced autophagy activation. Furthermore, inhibition HIF-1α resulted in HO-1 downregulation in 3D-MSC.
This suggested HO-1/ HIF-1α axis may be involved in autophagy activation and cell survival in 3D-MSC. In
vivo, silencing of autophagy in 3D-MSC caused decreased effectiveness of the MSC in ameliorating colitis in
mice.
Conclusion The attenuation of ROS production in 3D-MSC led to an enhancement in MSC survival via the
induction of autophagy. Therefore, the therapeutic effectiveness of 3D-MSC is at least, in part, mediated by
autophagy induction.
22.
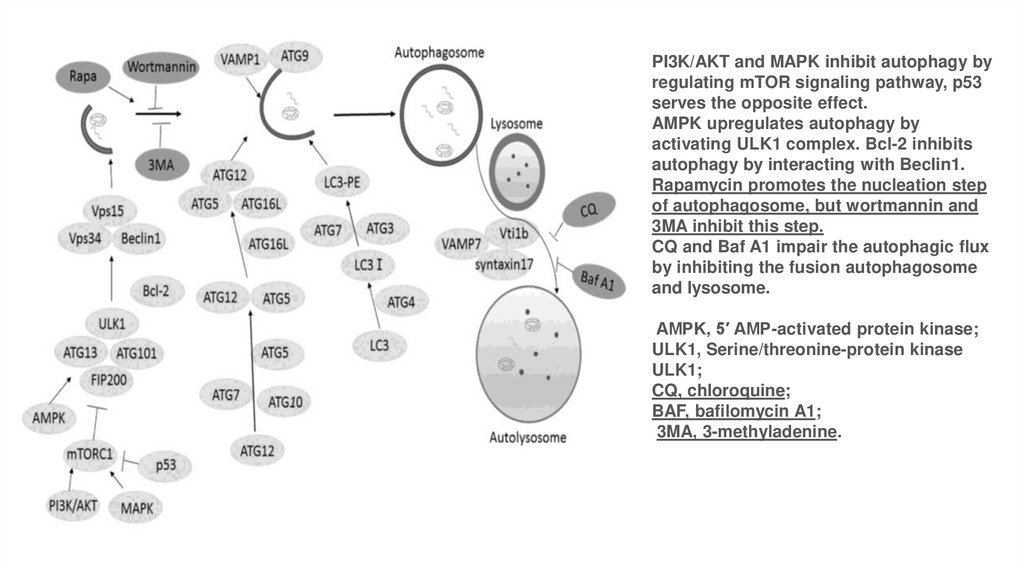
PI3K/AKT and MAPK inhibit autophagy byregulating mTOR signaling pathway, p53
serves the opposite effect.
AMPK upregulates autophagy by
activating ULK1 complex. Bcl-2 inhibits
autophagy by interacting with Beclin1.
Rapamycin promotes the nucleation step
of autophagosome, but wortmannin and
3MA inhibit this step.
CQ and Baf A1 impair the autophagic flux
by inhibiting the fusion autophagosome
and lysosome.
AMPK, 5′ AMP-activated protein kinase;
ULK1, Serine/threonine-protein kinase
ULK1;
CQ, chloroquine;
BAF, bafilomycin A1;
3MA, 3-methyladenine.
23.
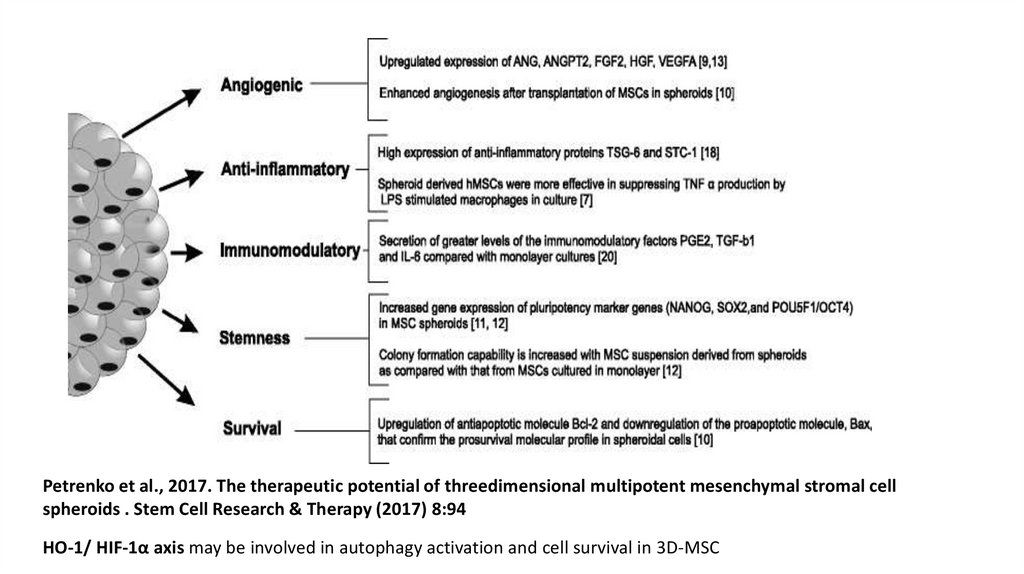
Petrenko et al., 2017. The therapeutic potential of threedimensional multipotent mesenchymal stromal cellspheroids . Stem Cell Research & Therapy (2017) 8:94
HO-1/ HIF-1α axis may be involved in autophagy activation and cell survival in 3D-MSC
24.
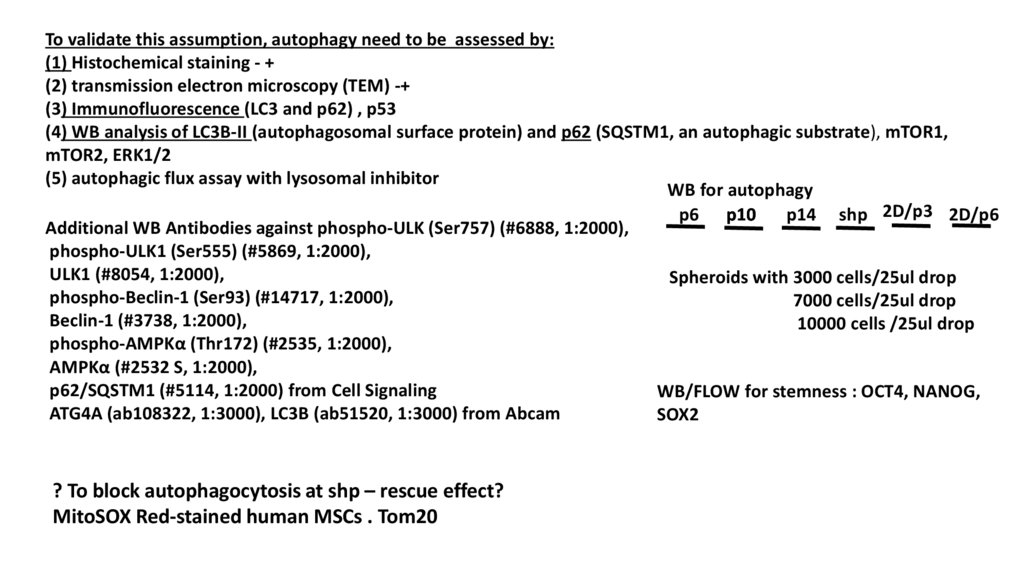
To validate this assumption, autophagy need to be assessed by:(1) Histochemical staining - +
(2) transmission electron microscopy (TEM) -+
(3) Immunofluorescence (LC3 and p62) , p53
(4) WB analysis of LC3B-II (autophagosomal surface protein) and p62 (SQSTM1, an autophagic substrate), mTOR1,
mTOR2, ERK1/2
(5) autophagic flux assay with lysosomal inhibitor
WB for autophagy
p6 p10
p14 shp 2D/p3 2D/p6
Additional WB Antibodies against phospho-ULK (Ser757) (#6888, 1:2000),
phospho-ULK1 (Ser555) (#5869, 1:2000),
ULK1 (#8054, 1:2000),
Spheroids with 3000 cells/25ul drop
phospho-Beclin-1 (Ser93) (#14717, 1:2000),
7000 cells/25ul drop
Beclin-1 (#3738, 1:2000),
10000 cells /25ul drop
phospho-AMPKα (Thr172) (#2535, 1:2000),
AMPKα (#2532 S, 1:2000),
p62/SQSTM1 (#5114, 1:2000) from Cell Signaling
WB/FLOW for stemness : OCT4, NANOG,
ATG4A (ab108322, 1:3000), LC3B (ab51520, 1:3000) from Abcam
SOX2
? To block autophagocytosis at shp – rescue effect?
MitoSOX Red-stained human MSCs . Tom20
25.
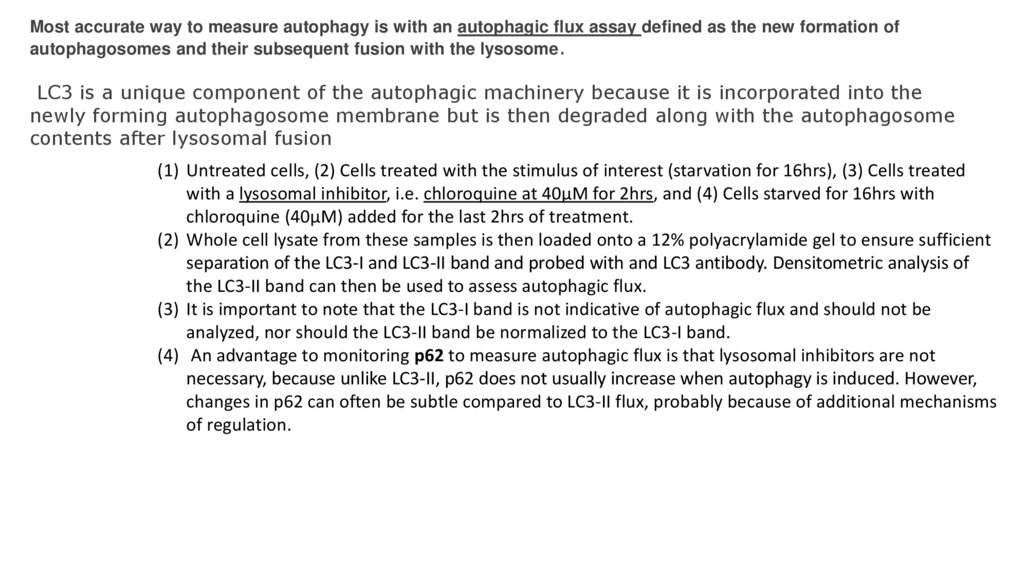
Most accurate way to measure autophagy is with an autophagic flux assay defined as the new formation ofautophagosomes and their subsequent fusion with the lysosome.
LC3 is a unique component of the autophagic machinery because it is incorporated into the
newly forming autophagosome membrane but is then degraded along with the autophagosome
contents after lysosomal fusion
(1) Untreated cells, (2) Cells treated with the stimulus of interest (starvation for 16hrs), (3) Cells treated
with a lysosomal inhibitor, i.e. chloroquine at 40μM for 2hrs, and (4) Cells starved for 16hrs with
chloroquine (40μM) added for the last 2hrs of treatment.
(2) Whole cell lysate from these samples is then loaded onto a 12% polyacrylamide gel to ensure sufficient
separation of the LC3-I and LC3-II band and probed with and LC3 antibody. Densitometric analysis of
the LC3-II band can then be used to assess autophagic flux.
(3) It is important to note that the LC3-I band is not indicative of autophagic flux and should not be
analyzed, nor should the LC3-II band be normalized to the LC3-I band.
(4) An advantage to monitoring p62 to measure autophagic flux is that lysosomal inhibitors are not
necessary, because unlike LC3-II, p62 does not usually increase when autophagy is induced. However,
changes in p62 can often be subtle compared to LC3-II flux, probably because of additional mechanisms
of regulation.
26.
Одним из специфических свойств МСК является колониеобразование. При этом установлено, что толькооколо 30% колониеобразующих мезенхимальных клеток являются мультипотентными, т. е. способными к
дифференцировке в остеогенном, адипогенном и хондрогенном направлениях
CFE assay