


 Промышленность
Похожие презентации:


Energy Storage and Conversion
1.
SCIENCEPASSION
TECHNOLOGY
Energy Storage and Conversion CHE.524
Prof. Viktor HACKER
Institut für Chemische Verfahrenstechnik und Umwelttechnik
Technische Universität Graz
2023
ceet.tugraz.at
2.
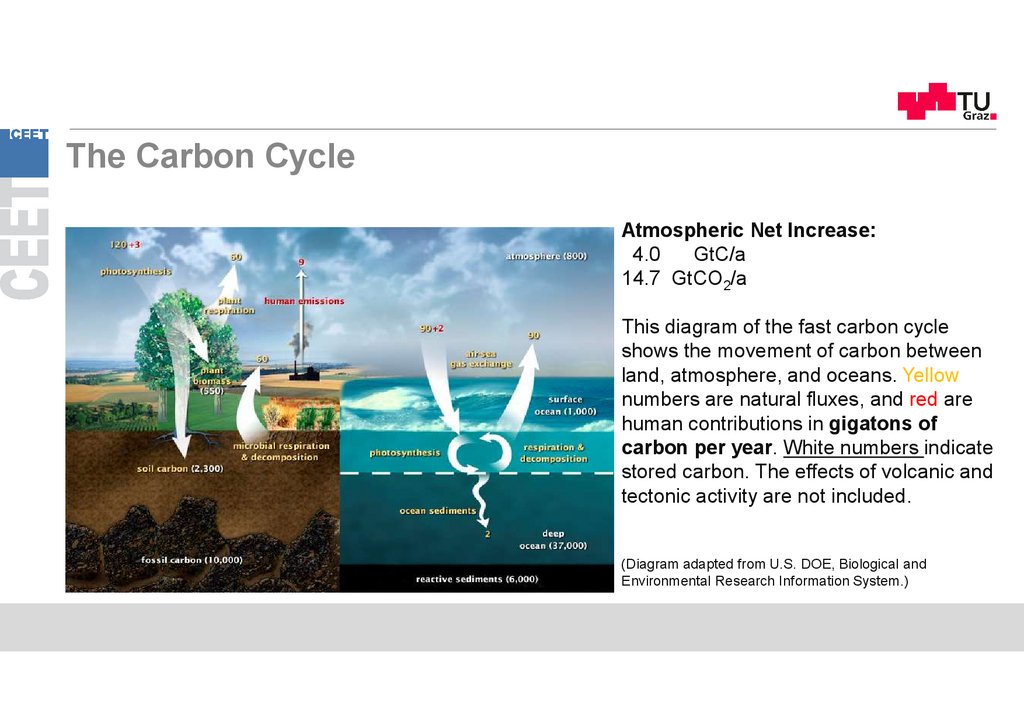
The Carbon CycleAtmospheric Net Increase:
4.0
GtC/a
14.7 GtCO2/a
This diagram of the fast carbon cycle
shows the movement of carbon between
land, atmosphere, and oceans. Yellow
numbers are natural fluxes, and red are
human contributions in gigatons of
carbon per year. White numbers indicate
stored carbon. The effects of volcanic and
tectonic activity are not included.
(Diagram adapted from U.S. DOE, Biological and
Environmental Research Information System.)
3.
3AG Hacker:
Wasserstoff & Brennstoffzellen
www.ceet.tugraz.at / Research
4.
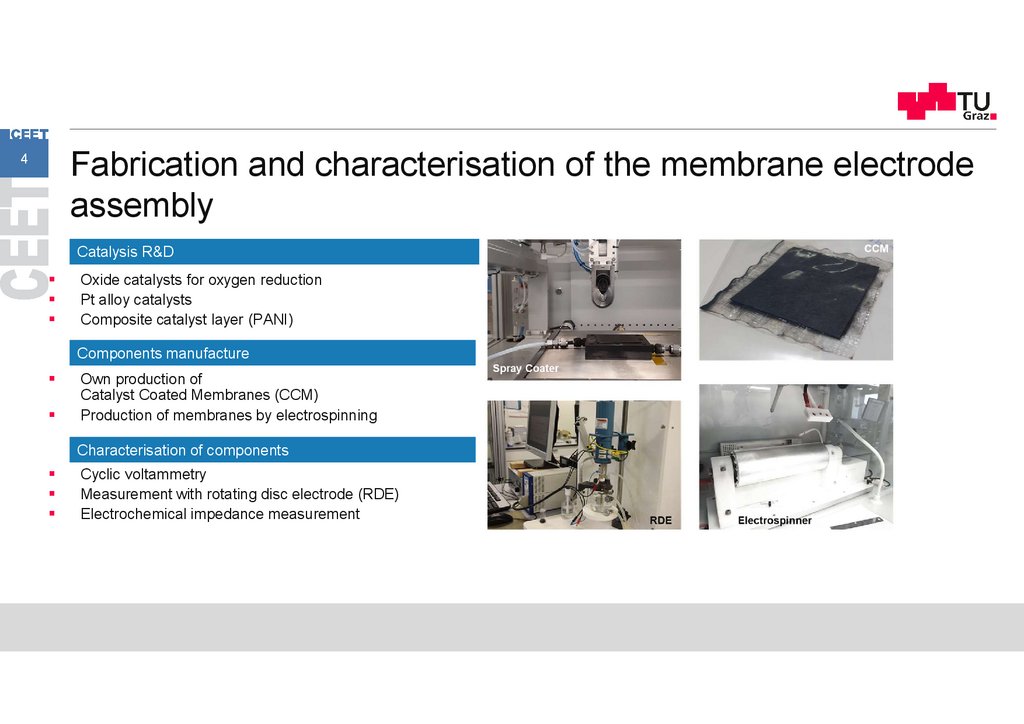
Fabrication and characterisation of the membrane electrodeassembly
4
Catalysis R&D
Oxide catalysts for oxygen reduction
Pt alloy catalysts
Composite catalyst layer (PANI)
Components manufacture
Own production of
Catalyst Coated Membranes (CCM)
Production of membranes by electrospinning
Characterisation of components
Cyclic voltammetry
Measurement with rotating disc electrode (RDE)
Electrochemical impedance measurement
5.
5Degradation of fuel cells
In situ and ex situ cell tests
Accelerated stress tests
Degradation analysis
Electrochemical impedance spectroscopy (EIS)
Total Harmonic Distortion (THDA)
Exhaust gas analysis
Fluoride detection
Characterisation of fuel cells
Dynamic Large-Signal Equivalent Circuit (dLSEC)
Cyclic voltammetry
Polarisation curves
Hydrogen cross-over
Segmented cell analysis
Long term tests
Development of control strategies
6.
Hydrogen production by chemical loopingThe Reformer Steam Iron Cycle (RESC)
6
Highlights:
Decentralised production of high-purity hydrogen
Production of hydrogen from biogas
99.999% from genuine producer gas
Suitable for PEFCs in automotive applications
Recent R&D highlights:
Influence of biogas impurities on
Applied metal oxides
Proof-of-concept for hydrogen production
from real producer biogas in Mureck
7.
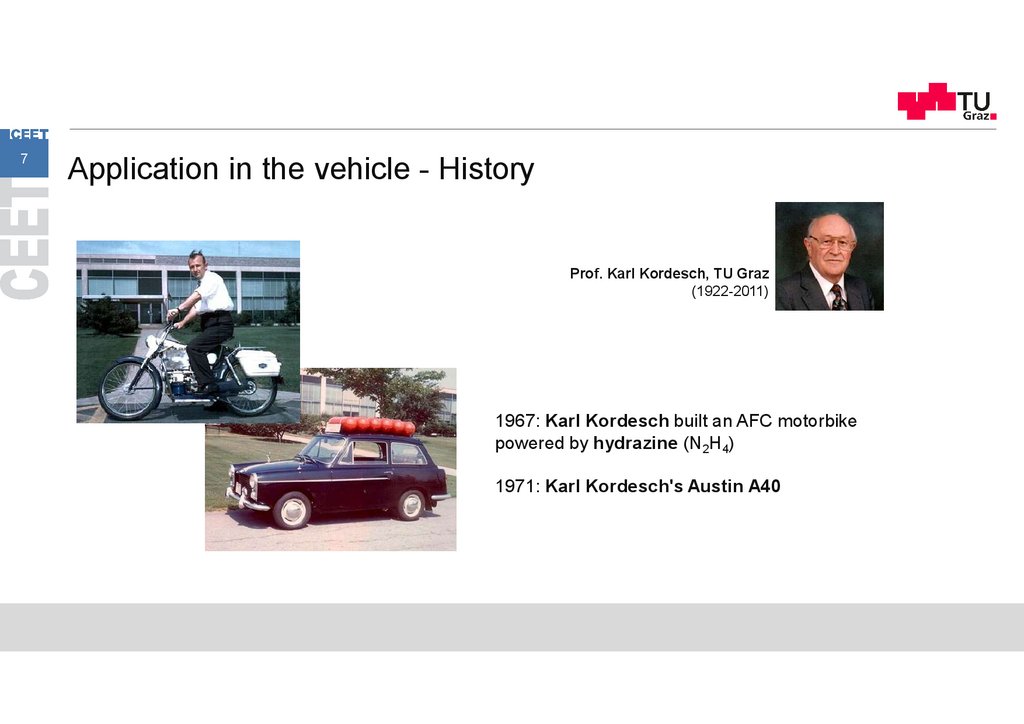
7Application in the vehicle - History
Prof. Karl Kordesch, TU Graz
(1922-2011)
1967: Karl Kordesch built an AFC motorbike
powered by hydrazine (N2H4)
1971: Karl Kordesch's Austin A40
8.
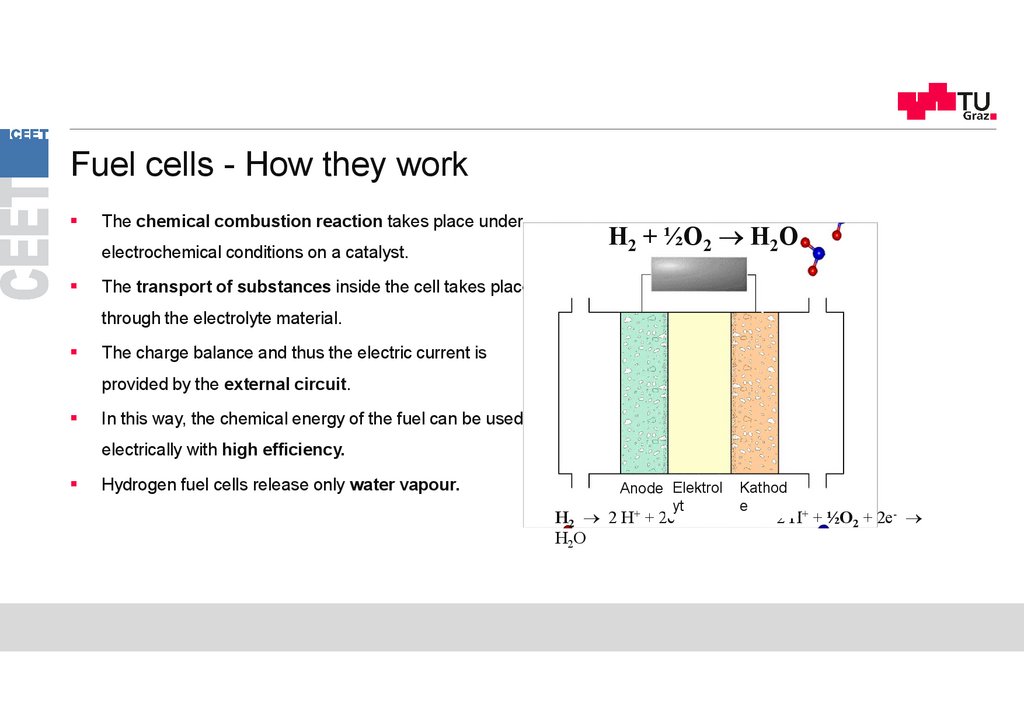
Fuel cells - How they work9
The chemical combustion reaction takes place under
electrochemical conditions on a catalyst.
H2 + ½O2 H2O
The transport of substances inside the cell takes place
through the electrolyte material.
The charge balance and thus the electric current is
provided by the external circuit.
In this way, the chemical energy of the fuel can be used
electrically with high efficiency.
Hydrogen fuel cells release only water vapour.
Electrolyt
Anode Elektrol
e
yt
+
-
H2 2 H + 2e
H2O
Kathod
e
2 H+ + ½O2 + 2e-
9.
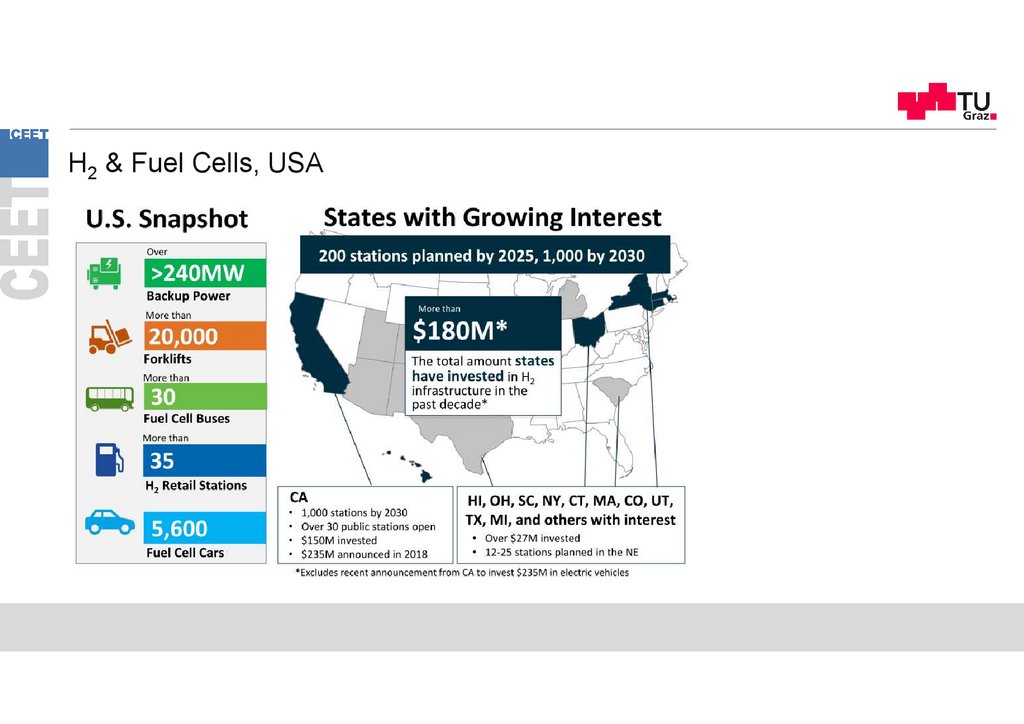
H2 & Fuel Cells, USA10
10.
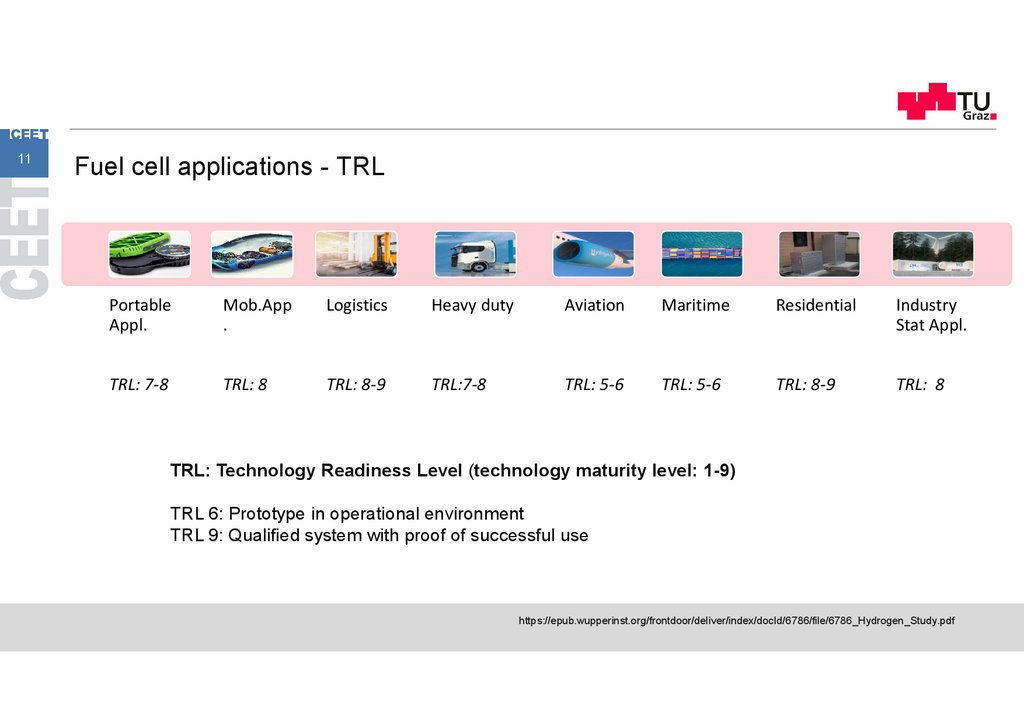
11Fuel cell applications - TRL
Portable
Appl.
Mob.App
.
Logistics
Heavy duty
Aviation
Maritime
TRL: 7-8
TRL: 8
TRL: 8-9
TRL:7-8
TRL: 5-6
TRL: 5-6
• TRL:
approx.
8-9
TRL: Technology Readiness Level (technology maturity level: 1-9)
Residential
Industry
Stat Appl.
TRL: 8-9
TRL: 8
TRL 6: Prototype in operational environment
TRL 9: Qualified system with proof of successful use
https://epub.wupperinst.org/frontdoor/deliver/index/docId/6786/file/6786_Hydrogen_Study.pdf
11.
12The challenges
12.
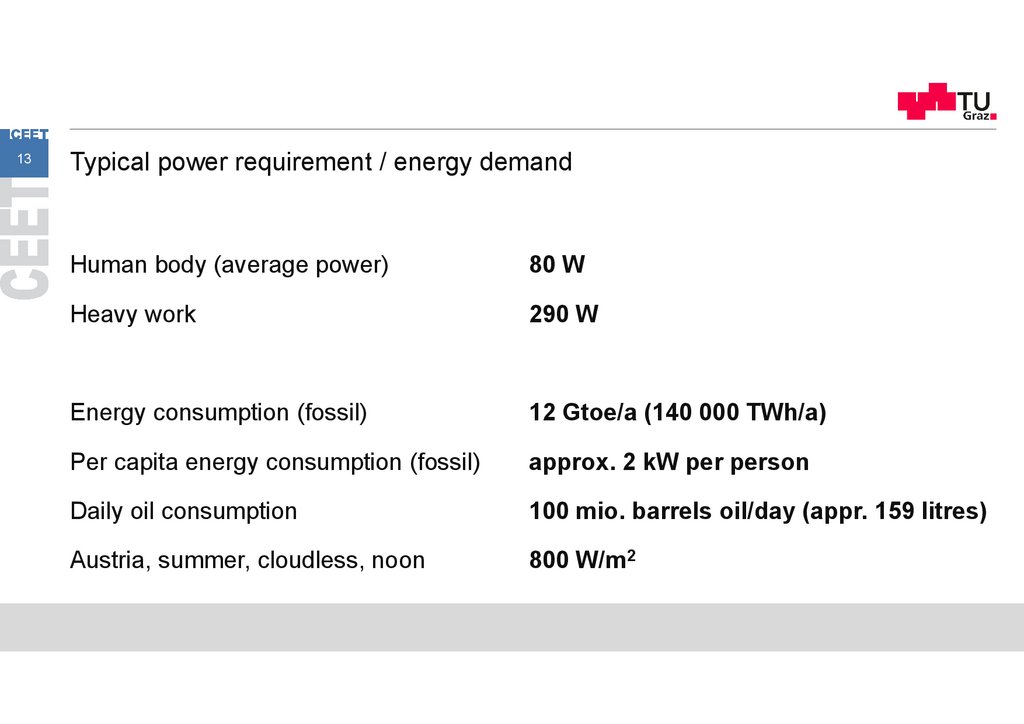
13Typical power requirement / energy demand
Human body (average power)
80 W
Heavy work
290 W
Energy consumption (fossil)
12 Gtoe/a (140 000 TWh/a)
Per capita energy consumption (fossil)
approx. 2 kW per person
Daily oil consumption
100 mio. barrels oil/day (appr. 159 litres)
Austria, summer, cloudless, noon
800 W/m2
13.
DESERTEC (2009): Sustainable prosperity for all people on earth14.
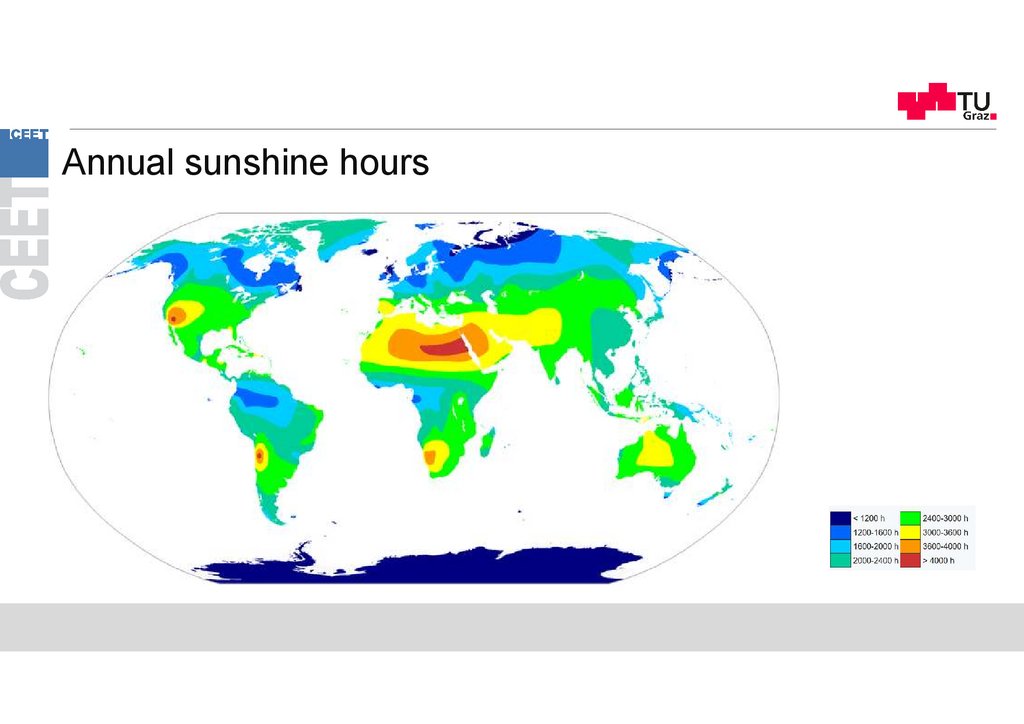
Annual sunshine hours15
15.
1616.
Crude oil trade flows worldwide (Mt/a)17
bp Statistical Review of World Energy 2021
17.
Natural gas trade flows worldwide (bn m3 /a)18
bp Statistical Review of World Energy 2021
18.
Wind and solar energy are now competitive19
19.
20Energy demand worldwide
Eurasia
Europe
1370
China
171
0
USA
2240
Near
East
Chemical energy sources can
154
0
Africa 1030
480
440
Japan
1050
India
Energy demand is unevenly
distributed around the world.
4060
South East Asia
1000
Brazil
be produced in energy-rich
regions and transported to
regions of demand.
Projected global primary energy demand in 2035 (Mtoe)
Adapted from: Optimal Operation Planning of Distributed Energy Systems Through Multiobjective Approach: a New Sustainability-oriented Pathway, di Somma, 2016
20.
World Energy Outlook• The World Energy Outlook does not provide a forecast of what will
happen. Instead, it provides a set of scenarios that explore different
possible futures, the actions – or inactions – that bring them about and
the interconnections between different parts of the system.
• Scenarios are used to present quantitative projections of longterm
energy trends. There are three core scenarios, which differ in their
assumptions about the evolution of energy-related government policies:
NZE / APS / STEPS
(former report: New (Stated) Policies Scenario; Current Policies
Scenario; Sustainable Development Scenario).
(Source: IEA, WEO 2018)
21.
Main scenarios in the outlook WEO-2021Net Zero Emissions by 2050 Scenario (NZE), which sets out a narrow but achievable pathway for the global energy
sector to achieve net zero CO2 emissions by 2050 to an achievable roadmap to a 1.5 °C stabilisation in rising global
temperatures.
Announced Pledges Scenario (APS), which assumes that all climate commitments made by governments around the
world, including Nationally Determined Contributions (NDCs) and longer term net zero targets, will be met in full and on
time. To 2030, low emissions sources of power generation account for the vast majority of capacity additions, with
annual additions of solar PV and wind approaching 500 gigawatts (GW) by 2030. Efficiency gains mean that global
energy demand plateaus post-2030. The global average temperature rise in 2100 is held to around 2.1 °C above preindustrial levels, although this scenario does not hit net zero emissions, so the temperature trend has still not stabilised.
Stated Policies Scenario (STEPS), which reflects current policy settings based on a sector-by-sector assessment of the
specific policies that are in place, as well as those that have been announced by governments around the world. In the
STEPS, almost all of the net growth in energy demand to 2050 is met by low emissions sources, but that leaves
annual emissions at around current levels. As a result, global average temperatures are still rising when they hit 2.6 °C
above pre-industrial levels in 2100. This growth largely comes from emerging market and developing economies as they
build up their nationwide infrastructure.
(Source: IEA, WEO 2021)
22.
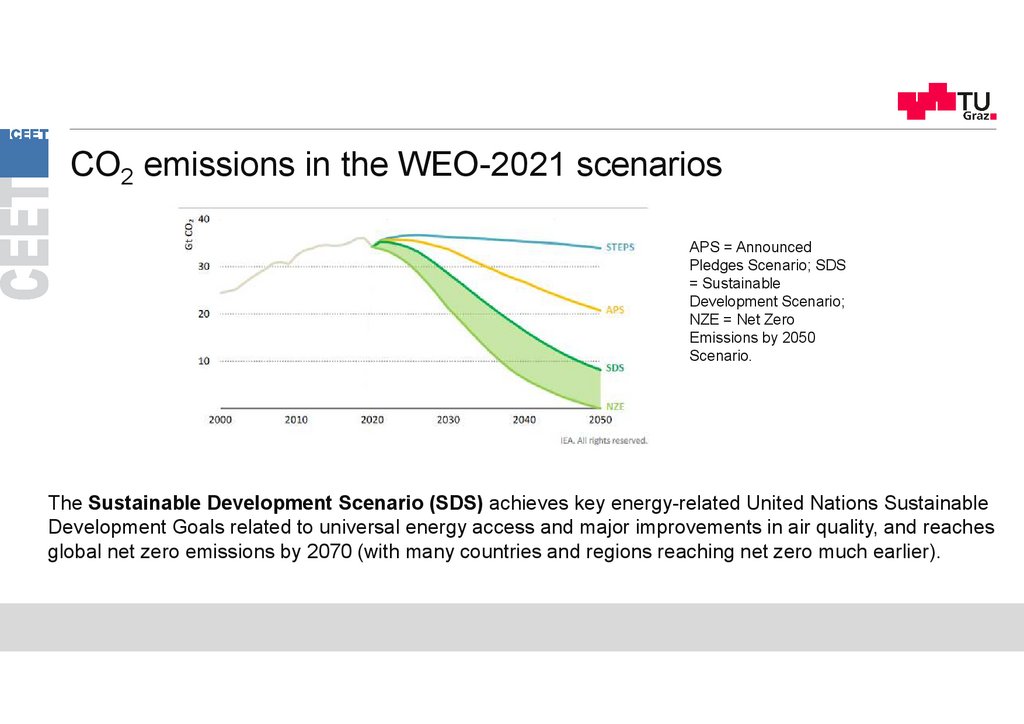
CO2 emissions in the WEO-2021 scenariosAPS = Announced
Pledges Scenario; SDS
= Sustainable
Development Scenario;
NZE = Net Zero
Emissions by 2050
Scenario.
The Sustainable Development Scenario (SDS) achieves key energy-related United Nations Sustainable
Development Goals related to universal energy access and major improvements in air quality, and reaches
global net zero emissions by 2070 (with many countries and regions reaching net zero much earlier).
23.
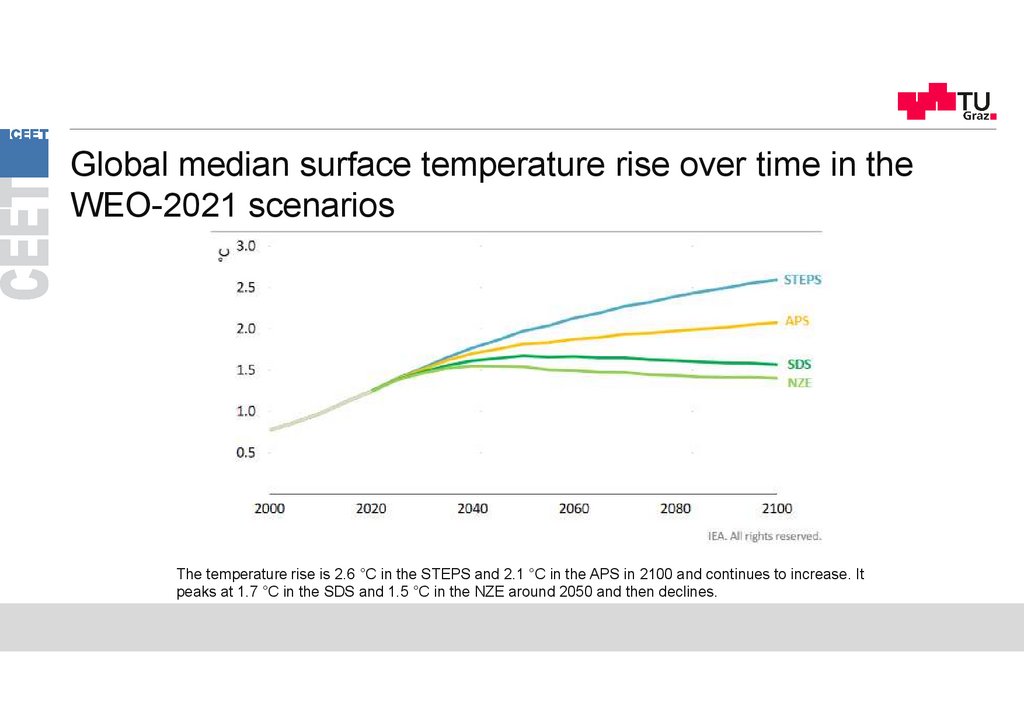
Global median surface temperature rise over time in theWEO-2021 scenarios
The temperature rise is 2.6 °C in the STEPS and 2.1 °C in the APS in 2100 and continues to increase. It
peaks at 1.7 °C in the SDS and 1.5 °C in the NZE around 2050 and then declines.
24.
Uncertaintiesthe scenarios are intended to demonstrate how markets could evolve under certain
conditions.
Population, even by region, is unlikely to deviate much from the assumptions used
(World population is projected to grow from an estimated 6.8 billion in 2010 to 8.6 billion
in 2035, or by some 1.7 billion new energy consumers.)
And we can be reasonably confident about how technology is likely to evolve in the
short to medium term, even if there are surprises, such as the improved technologies
that have recently unlocked huge unconventional gas and oil resources in the United
States and elsewhere.
Price remains an important determinant of energy trends.
“it is tough to make predictions,
especially about the future”
Niels Bohr
25.
TechnologyThe types of energy technology that are developed and deployed, for application to energy
supply and energy use, will affect investment decisions, the cost of supply of different forms of
energy, and the level and composition of future energy demand.
• These assumptions vary by fuel, end-use sector, location and scenario, and are based on our
assessment of the current stage of technological development, how far the optimal scope for
deployment will be realised and the potential for further gains, as well as our analysis of how
effectively different policy assumptions will drive technological advances.
• While no breakthrough technologies are deployed in any of the scenarios, we assume that
technologies that are in use today or are approaching the commercialisation phase will achieve
further cost reductions as a result of increased learning and deployment.
• On the supply side, exploration and production techniques are also expected to improve, which
could lower unit production costs and open up new opportunities for developing resources.
26.
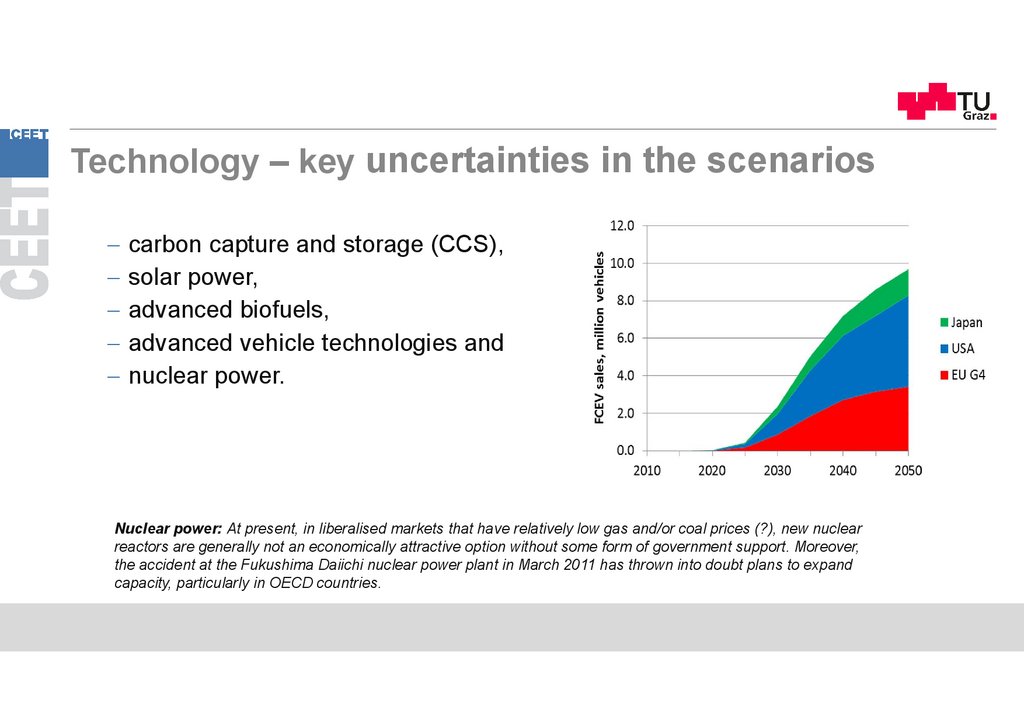
Technology – key uncertainties in the scenarioscarbon capture and storage (CCS),
solar power,
advanced biofuels,
advanced vehicle technologies and
nuclear power.
Nuclear power: At present, in liberalised markets that have relatively low gas and/or coal prices (?), new nuclear
reactors are generally not an economically attractive option without some form of government support. Moreover,
the accident at the Fukushima Daiichi nuclear power plant in March 2011 has thrown into doubt plans to expand
capacity, particularly in OECD countries.
27.
Key measures to close the gap between today’s pledges and a 1.5 °Ctrajectory
A massive additional push for clean electrification that requires a doubling of solar PV and
wind deployment relative to the APS; a major expansion of other low-emissions generation.
Accelerating the decarbonisation of the electricity mix is the single most important lever: it closes
more than one-third of the emissions gap between the APS and NZE. The low costs of wind
and solar PV mean that more than half of the additional emissions reductions could be gained
at no cost to electricity consumers.
A relentless focus on energy efficiency, together with measures to temper energy service
demand through materials efficiency and behavioural change. We estimate that almost 80% of
the additional energy efficiency gains in the NZE over the next decade result in cost savings to
consumers.
(Source: IEA, WEO 2021)
28.
Key measures to close the gap between today’s pledges and a 1.5 °Ctrajectory
A broad drive to cut methane emissions from fossil fuel operations. Rapid reductions in methane
emissions are a key tool to limit near-term global warming, and the most cost-effective abatement
opportunities are in the energy sector, particularly in oil and gas operations. Methane abatement is
not addressed quickly or effectively enough by simply reducing fossil fuel use; concerted efforts from
governments and industry are vital to secure the emissions cuts that close nearly 15% of the gap to
the NZE.
A big boost to clean energy innovation. This is another crucial gap to be filled in the 2020s, even
though most of the impacts on emissions are not felt until later. All the technologies needed to
achieve deep emissions cuts to 2030 are available. But almost half of the emissions reductions
achieved in the NZE in 2050 come from technologies that today are at the demonstration or
prototype stage. These are particularly important to address emissions from iron and steel, cement
and other energy-intensive industrial sectors – and also from long-distance transport. Today’s
announced pledges fall short of key NZE milestones for the deployment of hydrogen-based and
other low-carbon fuels, as well as carbon capture, utilisation and storage
(CCUS).
(Source: IEA, WEO 2021)
29.
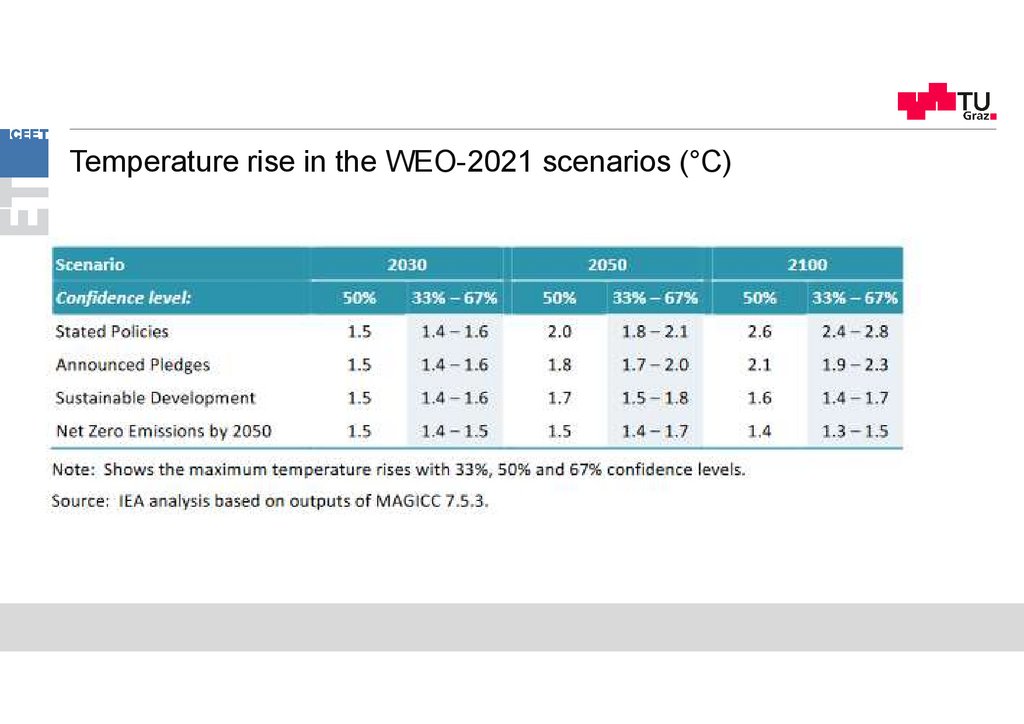
Temperature rise in the WEO-2021 scenarios (°C)30.
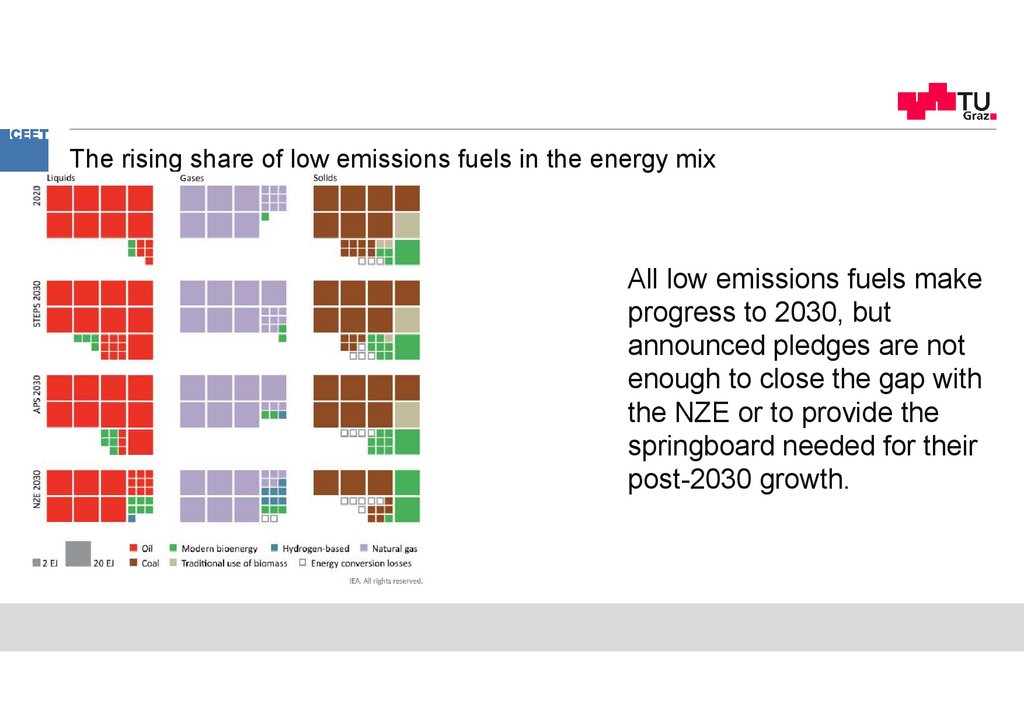
The rising share of low emissions fuels in the energy mixAll low emissions fuels make
progress to 2030, but
announced pledges are not
enough to close the gap with
the NZE or to provide the
springboard needed for their
post-2030 growth.
31.
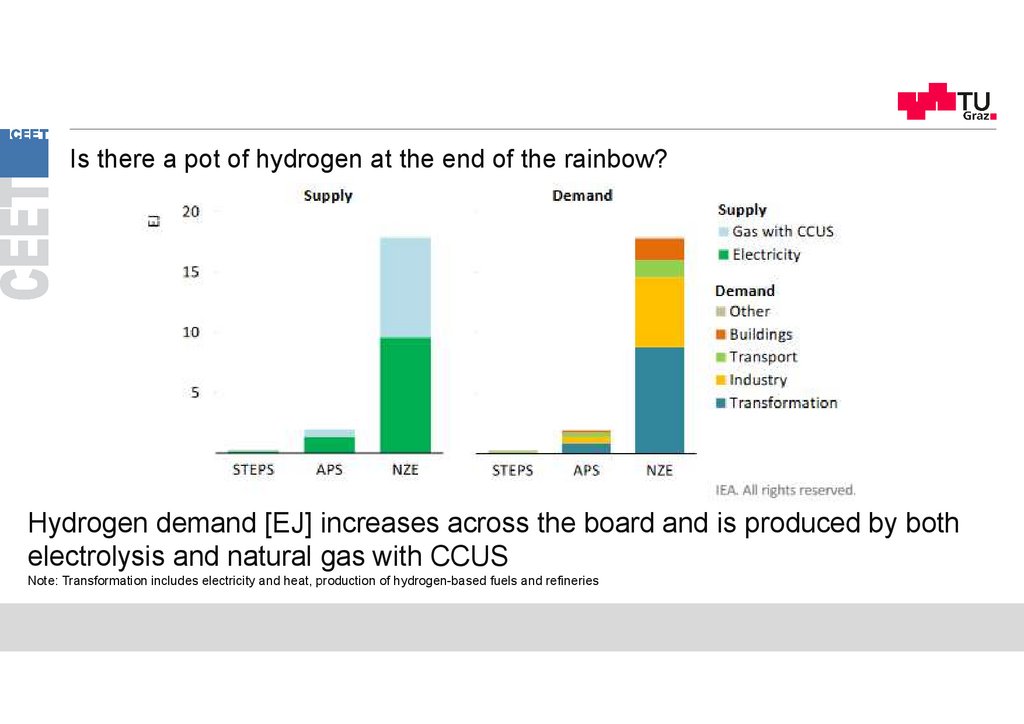
Is there a pot of hydrogen at the end of the rainbow?Hydrogen demand [EJ] increases across the board and is produced by both
electrolysis and natural gas with CCUS
Note: Transformation includes electricity and heat, production of hydrogen-based fuels and refineries
32.
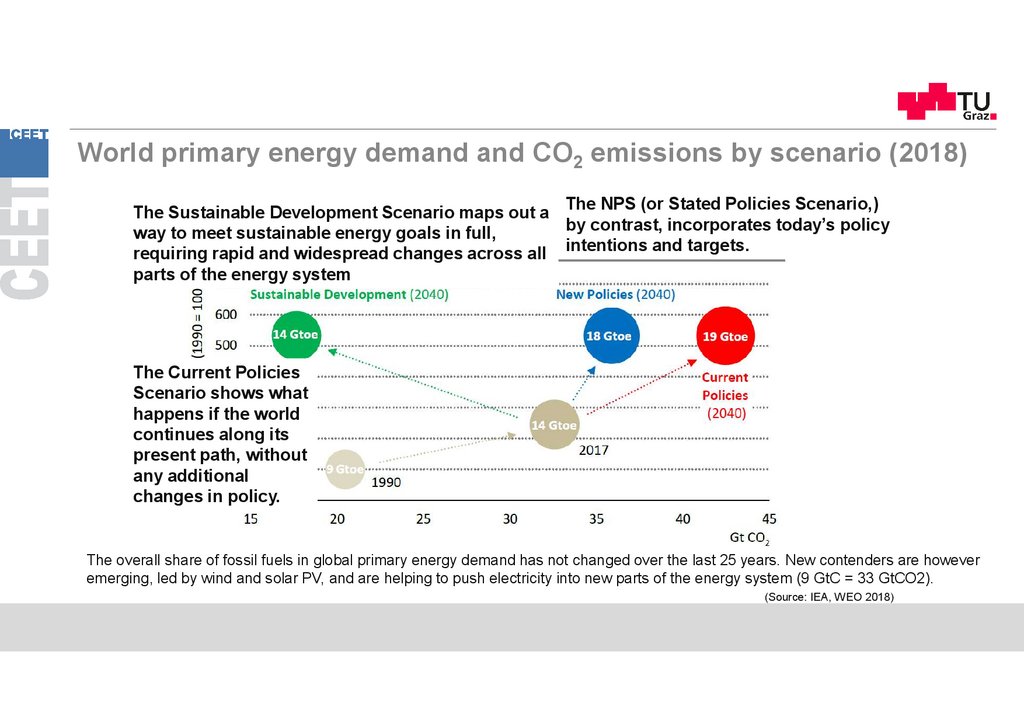
World primary energy demand and CO2 emissions by scenario (2018)The Sustainable Development Scenario maps out a The NPS (or Stated Policies Scenario,)
by contrast, incorporates today’s policy
way to meet sustainable energy goals in full,
requiring rapid and widespread changes across all intentions and targets.
parts of the energy system
The Current Policies
Scenario shows what
happens if the world
continues along its
present path, without
any additional
changes in policy.
The overall share of fossil fuels in global primary energy demand has not changed over the last 25 years. New contenders are however
emerging, led by wind and solar PV, and are helping to push electricity into new parts of the energy system (9 GtC = 33 GtCO2).
(Source: IEA, WEO 2018)
33.
34.
A Brief History of CO2 Emissions https://youtu.be/EQ7S0D1iucYPotsdam Institute for Climate Impact Research
https://youtu.be/EQ7S0D1iucY
35.
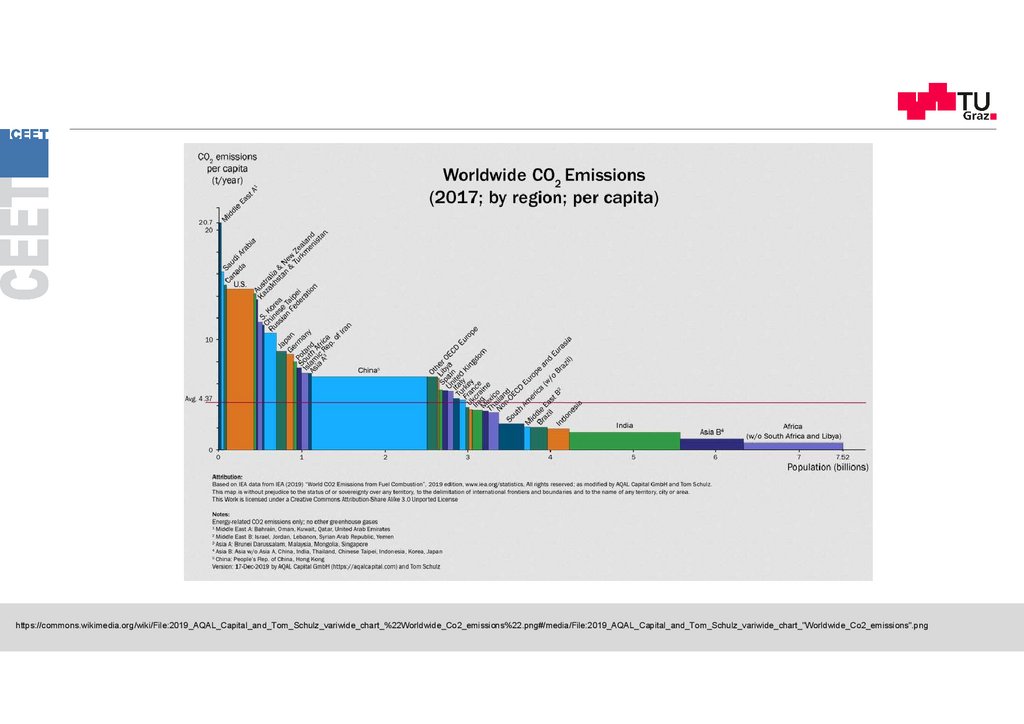
https://commons.wikimedia.org/wiki/File:2019_AQAL_Capital_and_Tom_Schulz_variwide_chart_%22Worldwide_Co2_emissions%22.png#/media/File:2019_AQAL_Capital_and_Tom_Schulz_variwide_chart_"Worldwide_Co2_emissions".png36.
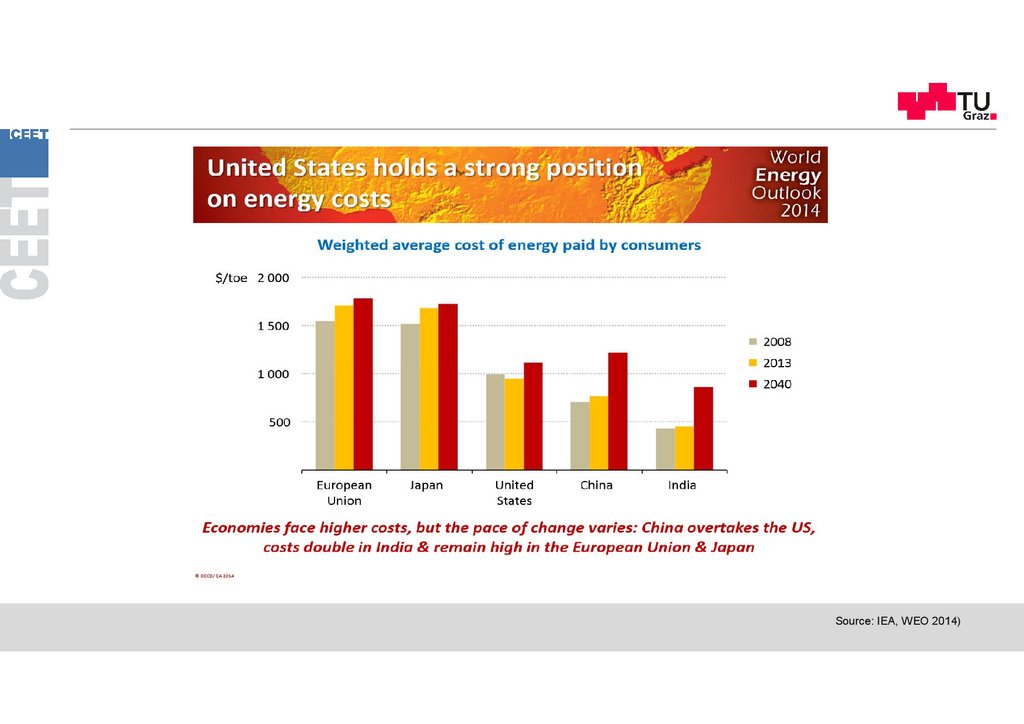
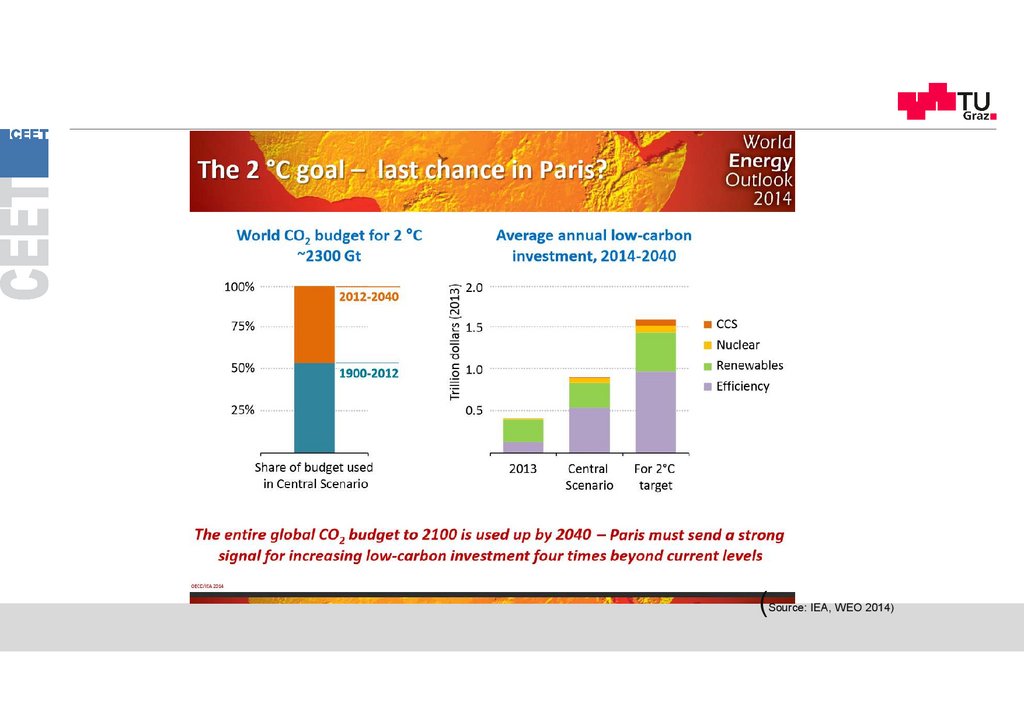
Source: IEA, WEO 2014)37.
(Source: IEA, WEO 2014)38.
Global electricity generation by source and scenario39.
40.
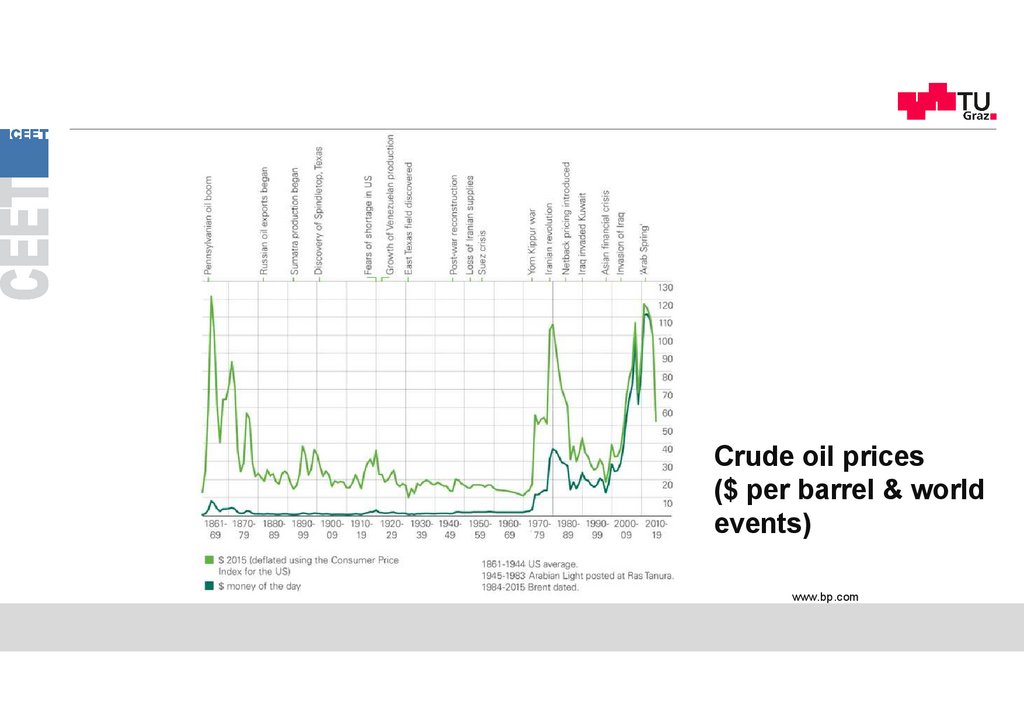
Average annual Brent crude oil price from 1976 to 2023 (US$ per barrel)41.
Crude oil prices($ per barrel & world
events)
www.bp.com
42.
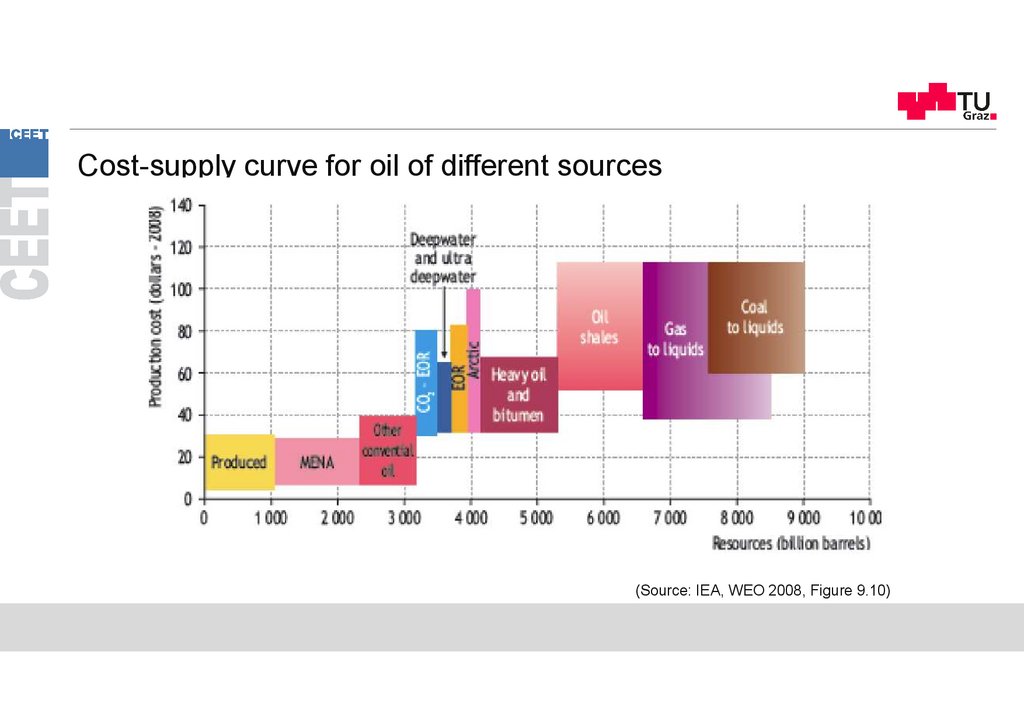
Cost-supply curve for oil of different sources(Source: IEA, WEO 2008, Figure 9.10)
43.
Global energy system todayWorld Energy Outlook 2021
44.
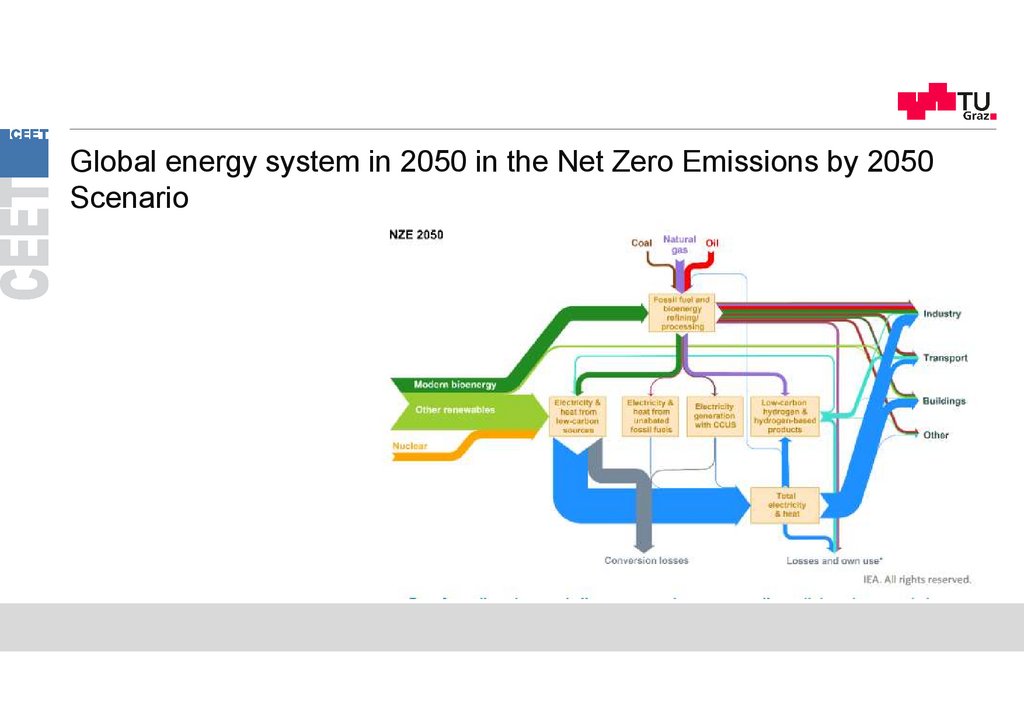
Global energy system in 2050 in the Net Zero Emissions by 2050Scenario
45.
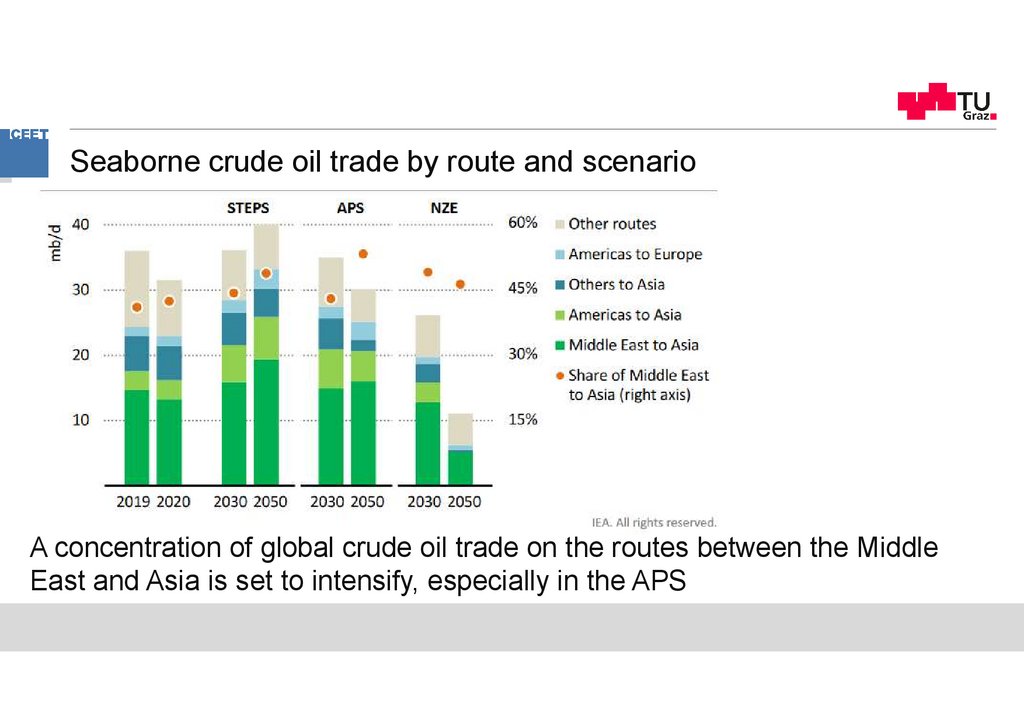
Seaborne crude oil trade by route and scenarioA concentration of global crude oil trade on the routes between the Middle
East and Asia is set to intensify, especially in the APS
46.
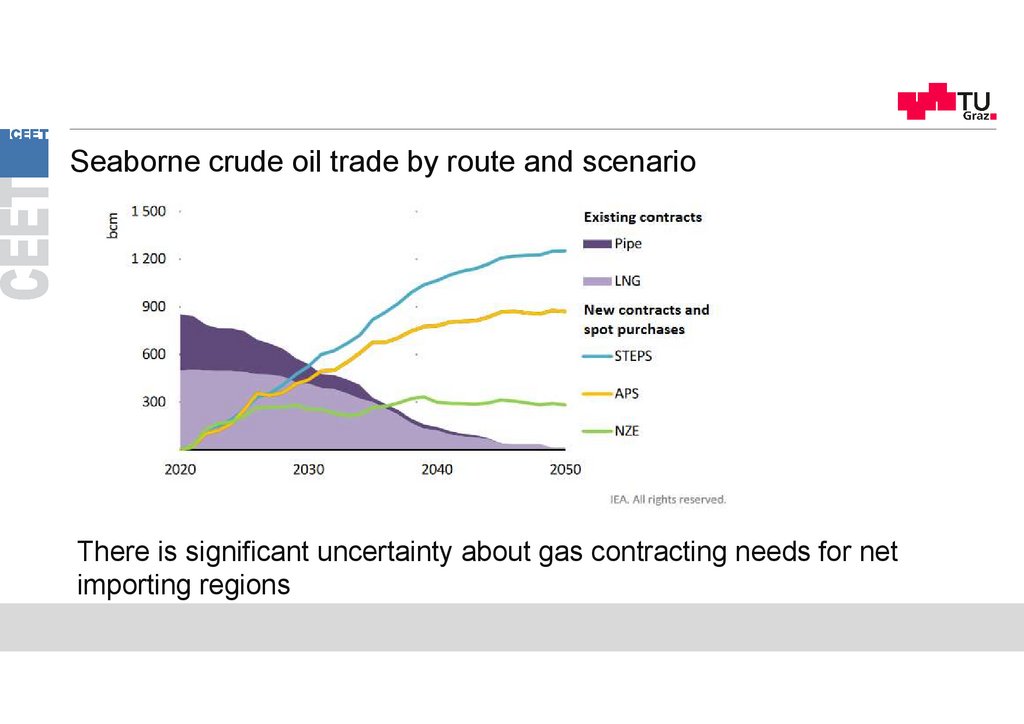
Seaborne crude oil trade by route and scenarioThere is significant uncertainty about gas contracting needs for net
importing regions
47.
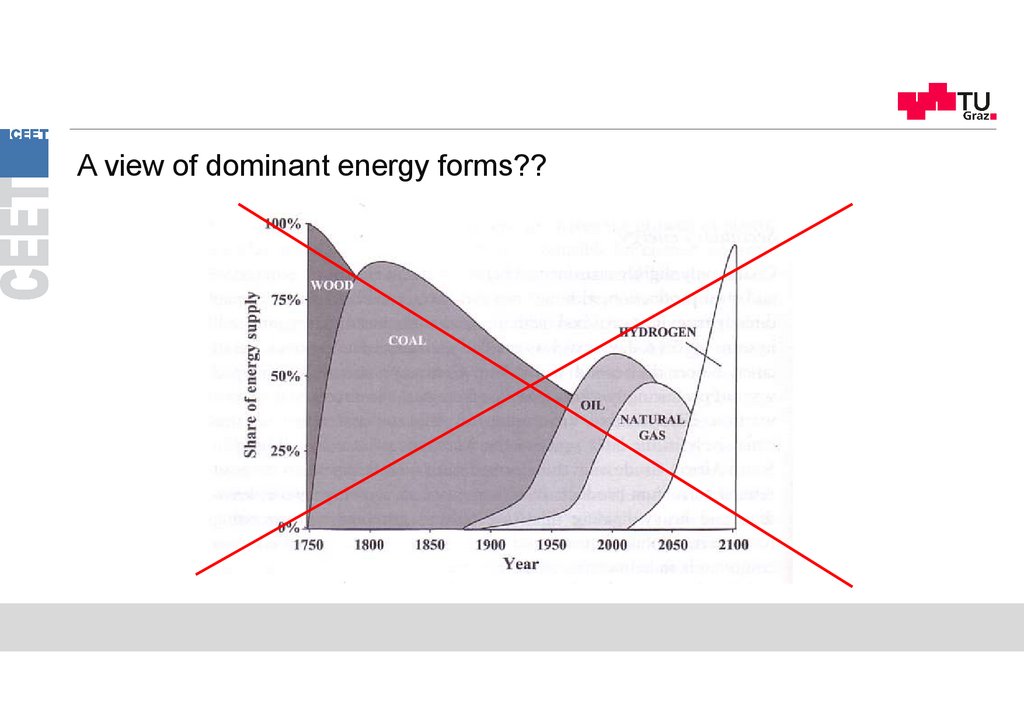
A view of dominant energy forms??48.
Crude oil utilisation49.
From fuel to service: tracing the global flow of energy through society.Jonathan M. Cullen, Julian M. Allwood, Energy Policy, Volume 38, Issue 1, 2010, 75–81
50.
From fuel to service: tracing the global flow of energy through society.Jonathan M. Cullen, Julian M. Allwood, Energy Policy, Volume 38, Issue 1, 2010, 75–81
51.
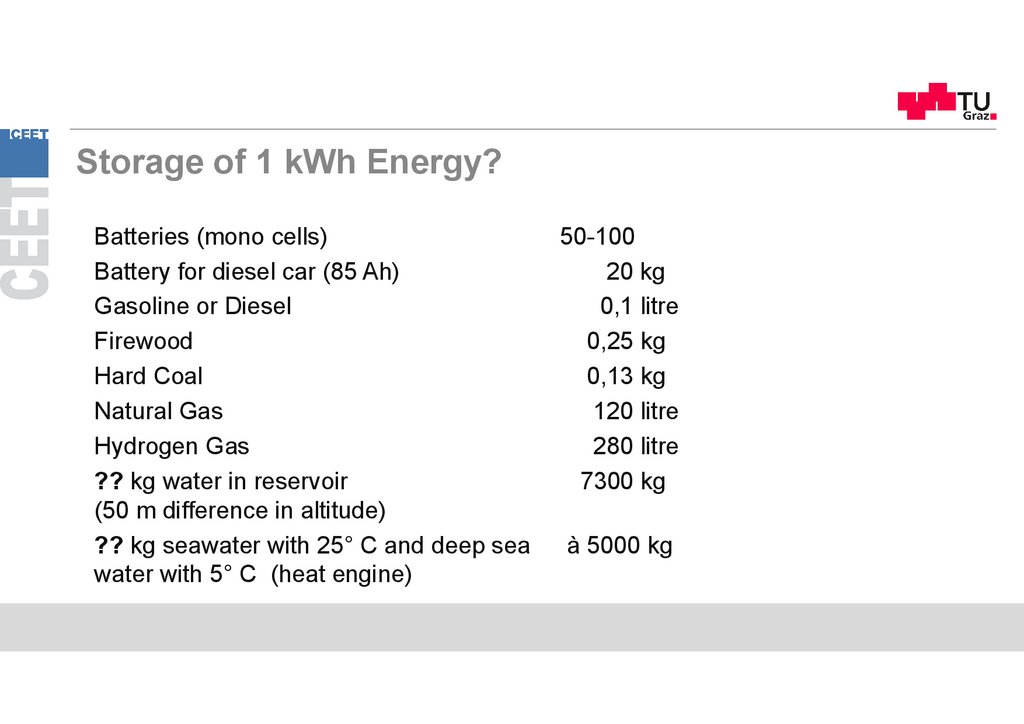
Storage of 1 kWh Energy?Batteries (mono cells)
Battery for diesel car (85 Ah)
Gasoline or Diesel
Firewood
Hard Coal
Natural Gas
Hydrogen Gas
?? kg water in reservoir
(50 m difference in altitude)
?? kg seawater with 25° C and deep sea
water with 5° C (heat engine)
50-100
20 kg
0,1 litre
0,25 kg
0,13 kg
120 litre
280 litre
7300 kg
à 5000 kg
52.
1 kWh (without losses) is able to …Lift 1 t Masse ?? m
Lift ?? t Masse 1 m high
367 m
367 t
Heat ?? litre of water up
from 10°C to 99°C
9,5 l
Fill a 30 litre compressed
air cylinder to ?? bar
200 bar
Accelerate a mass of
1 ton from 0 to ?? km/h
305 km/h
53.
Regenerative Energy Supply AustriaSolar radiation
1100 kWh/m2a
Solar radiation, summer
day, no clouds, 12:00
800 W/m2
Worldwide energy
consumption
approx. 14 Gtoe
54.
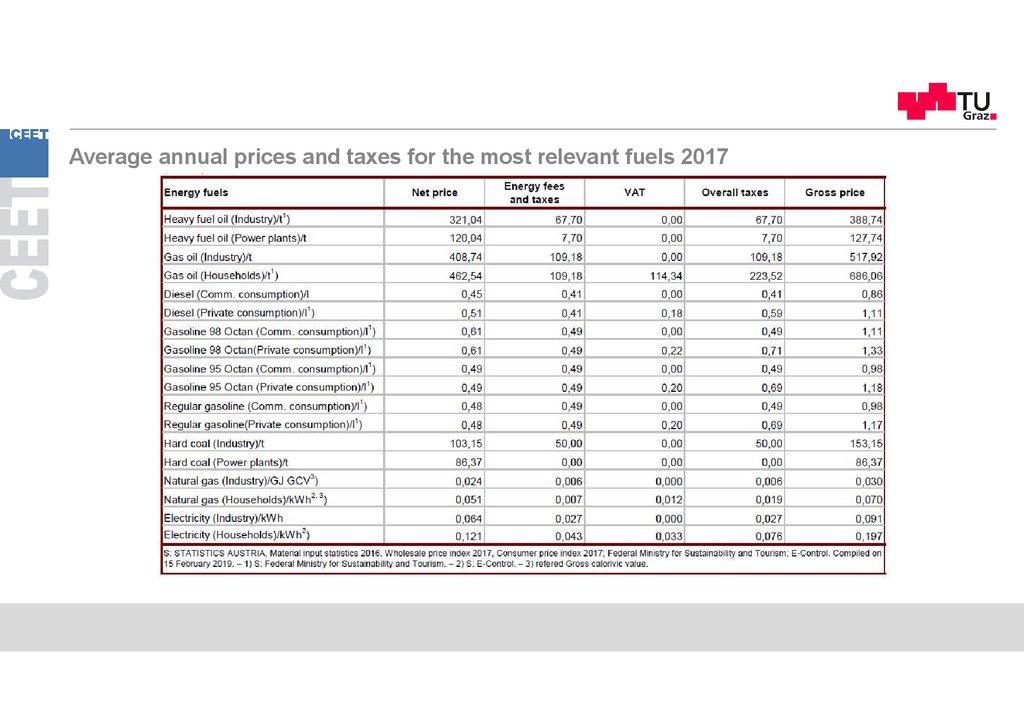
Average annual prices and taxes for the most relevant fuels 201755.
Average annual prices and taxes for the most relevant fuels 2013 (in EUR/kWh)56.
Thank you!57
www.ceet.tugraz.at
Master-Infoveranstaltung der Studienvertretung Verfahrenstechnik