


 Промышленность
Похожие презентации:


Energy Storage and Conversion CHE.524
1.
RREnergy Storage and Conversion CHE.524
Prof. Dr. Viktor Hacker
Institut für Chemische
Verfahrenstechnik und Umwelttechnik
1
TU Graz I Institute of Chemical Engineering and Environmental Technology
2.
RRRepetition
2
TU Graz I Institute of Chemical Engineering and Environmental Technology
3.
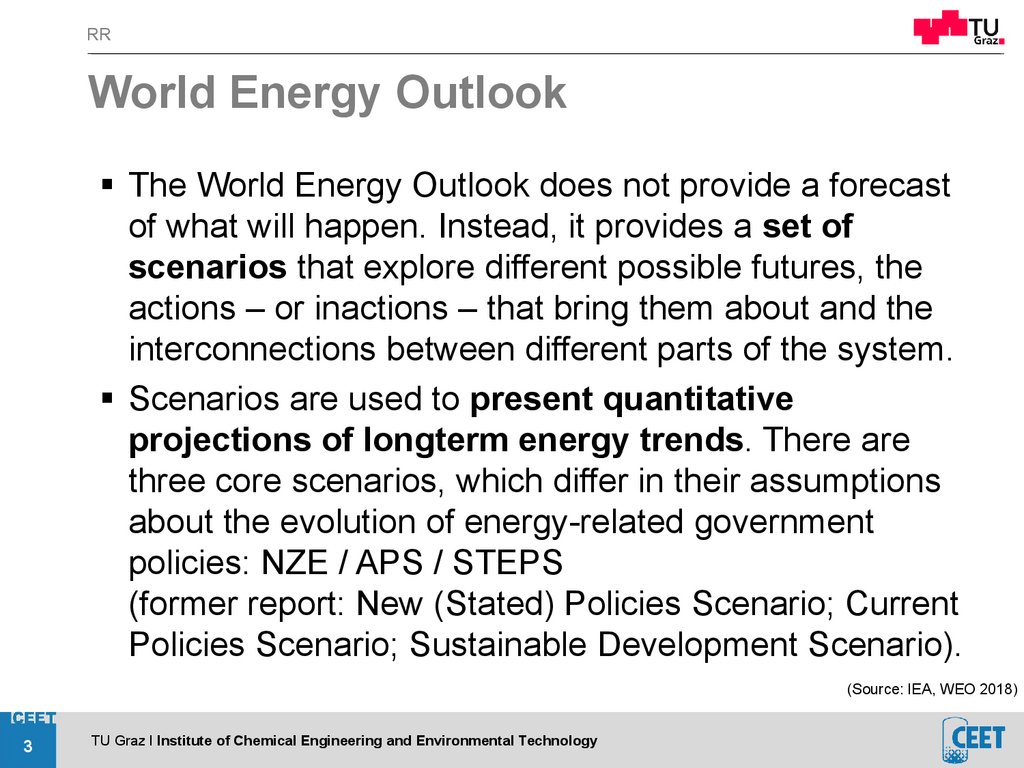
RRWorld Energy Outlook
The World Energy Outlook does not provide a forecast
of what will happen. Instead, it provides a set of
scenarios that explore different possible futures, the
actions – or inactions – that bring them about and the
interconnections between different parts of the system.
Scenarios are used to present quantitative
projections of longterm energy trends. There are
three core scenarios, which differ in their assumptions
about the evolution of energy-related government
policies: NZE / APS / STEPS
(former report: New (Stated) Policies Scenario; Current
Policies Scenario; Sustainable Development Scenario).
(Source: IEA, WEO 2018)
3
TU Graz I Institute of Chemical Engineering and Environmental Technology
4.
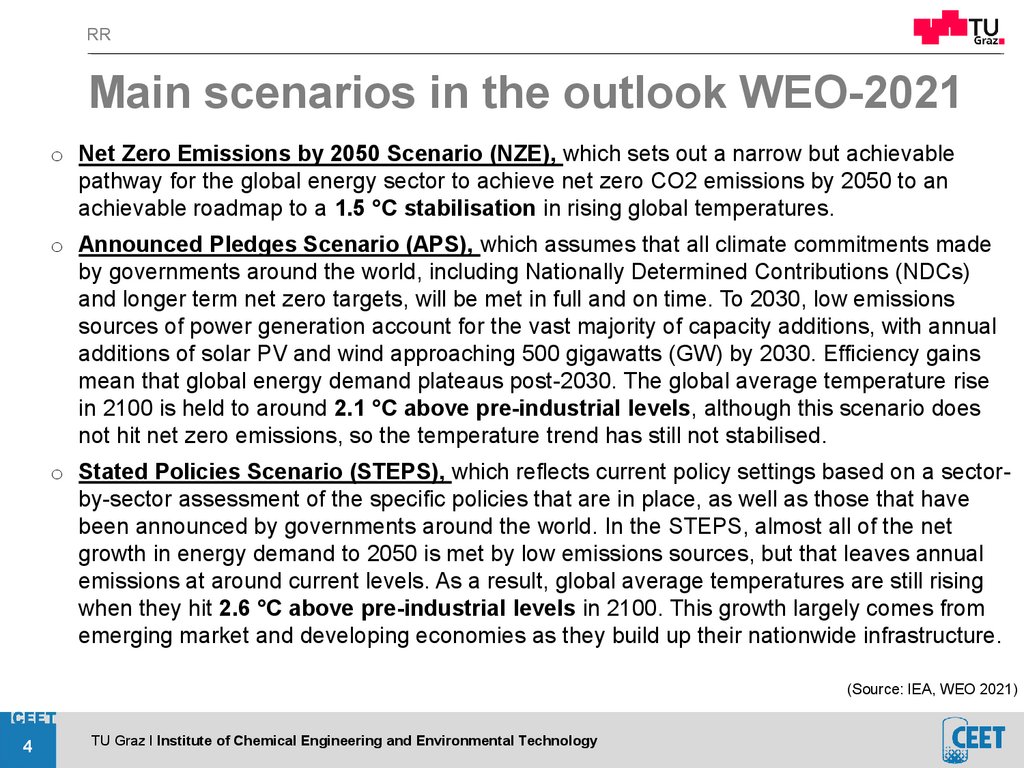
RRMain scenarios in the outlook WEO-2021
o Net Zero Emissions by 2050 Scenario (NZE), which sets out a narrow but achievable
pathway for the global energy sector to achieve net zero CO2 emissions by 2050 to an
achievable roadmap to a 1.5 °C stabilisation in rising global temperatures.
o Announced Pledges Scenario (APS), which assumes that all climate commitments made
by governments around the world, including Nationally Determined Contributions (NDCs)
and longer term net zero targets, will be met in full and on time. To 2030, low emissions
sources of power generation account for the vast majority of capacity additions, with annual
additions of solar PV and wind approaching 500 gigawatts (GW) by 2030. Efficiency gains
mean that global energy demand plateaus post-2030. The global average temperature rise
in 2100 is held to around 2.1 °C above pre-industrial levels, although this scenario does
not hit net zero emissions, so the temperature trend has still not stabilised.
o Stated Policies Scenario (STEPS), which reflects current policy settings based on a sectorby-sector assessment of the specific policies that are in place, as well as those that have
been announced by governments around the world. In the STEPS, almost all of the net
growth in energy demand to 2050 is met by low emissions sources, but that leaves annual
emissions at around current levels. As a result, global average temperatures are still rising
when they hit 2.6 °C above pre-industrial levels in 2100. This growth largely comes from
emerging market and developing economies as they build up their nationwide infrastructure.
(Source: IEA, WEO 2021)
4
TU Graz I Institute of Chemical Engineering and Environmental Technology
5.
RRCO2 emissions in the WEO-2021 scenarios
APS = Announced
Pledges Scenario; SDS
= Sustainable
Development Scenario;
NZE = Net Zero
Emissions by 2050
Scenario.
The Sustainable Development Scenario (SDS) achieves key energy-related
United Nations Sustainable Development Goals related to universal energy access
and major improvements in air quality, and reaches global net zero emissions by
2070 (with many countries and regions reaching net zero much earlier).
5
TU Graz I Institute of Chemical Engineering and Environmental Technology
6.
RRGlobal median surface temperature rise
over time in the WEO-2021 scenarios
The temperature rise is 2.6 °C in the STEPS and 2.1 °C in the APS in 2100 and continues to increase. It
peaks at 1.7 °C in the SDS and 1.5 °C in the NZE around 2050 and then declines.
6
TU Graz I Institute of Chemical Engineering and Environmental Technology
7.
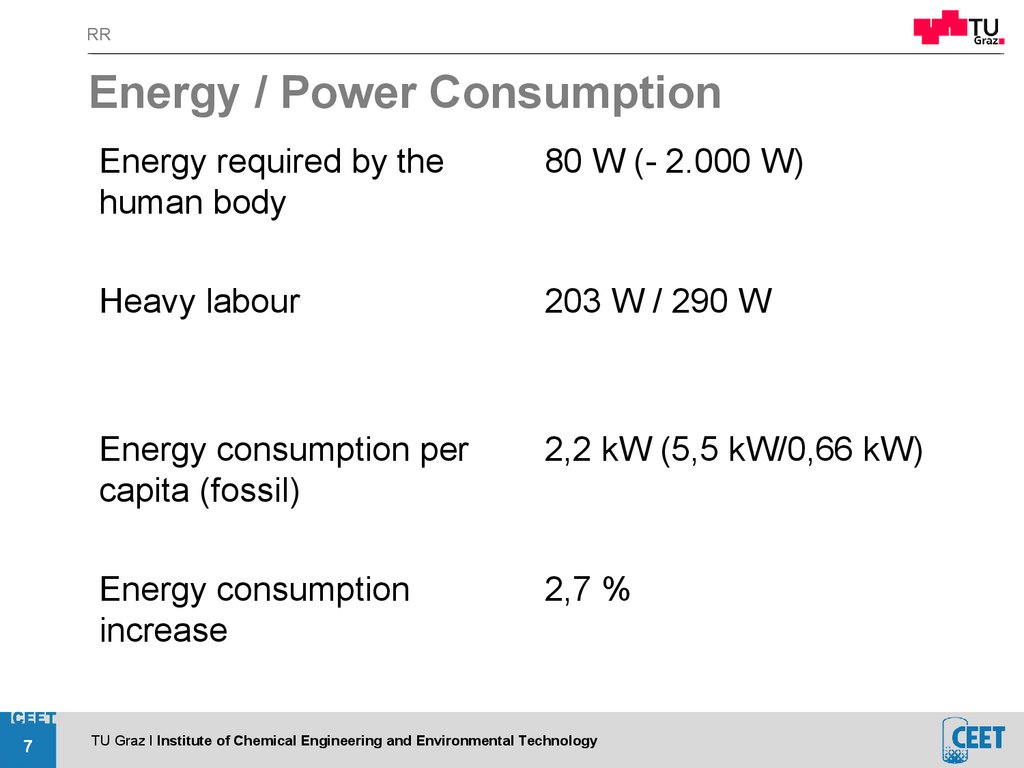
RREnergy / Power Consumption
7
Energy required by the
human body
80 W (- 2.000 W)
Heavy labour
203 W / 290 W
Energy consumption per
capita (fossil)
2,2 kW (5,5 kW/0,66 kW)
Energy consumption
increase
2,7 %
TU Graz I Institute of Chemical Engineering and Environmental Technology
8.
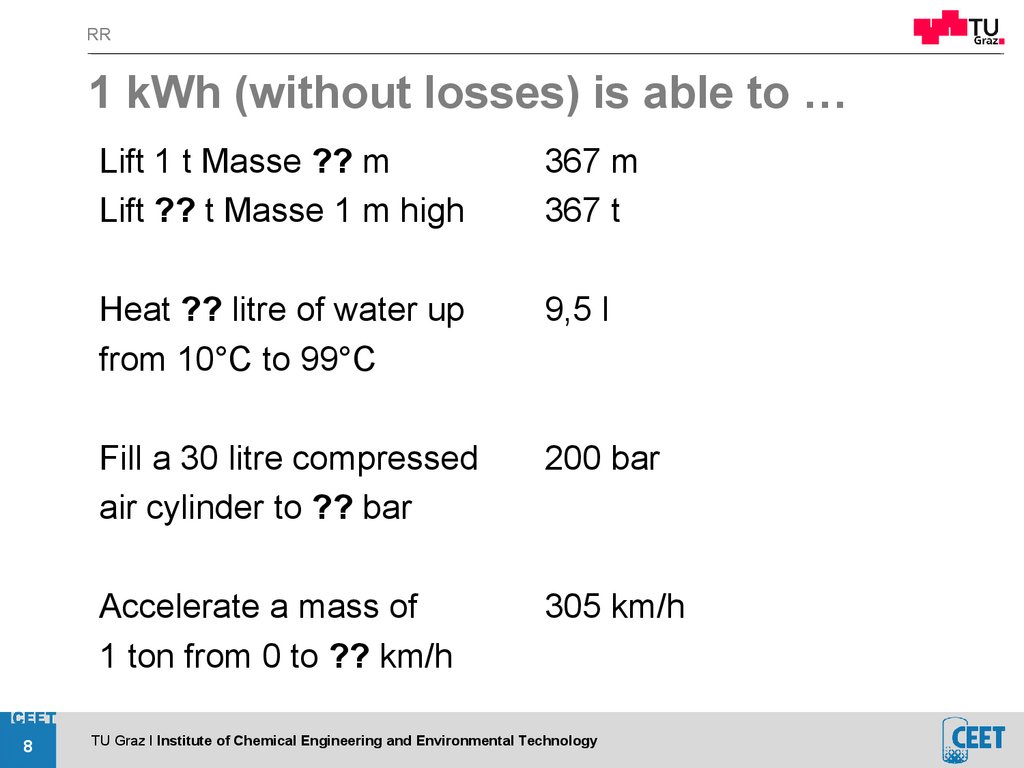
RR1 kWh (without losses) is able to …
8
Lift 1 t Masse ?? m
Lift ?? t Masse 1 m high
367 m
367 t
Heat ?? litre of water up
from 10°C to 99°C
9,5 l
Fill a 30 litre compressed
air cylinder to ?? bar
200 bar
Accelerate a mass of
1 ton from 0 to ?? km/h
305 km/h
TU Graz I Institute of Chemical Engineering and Environmental Technology
9.
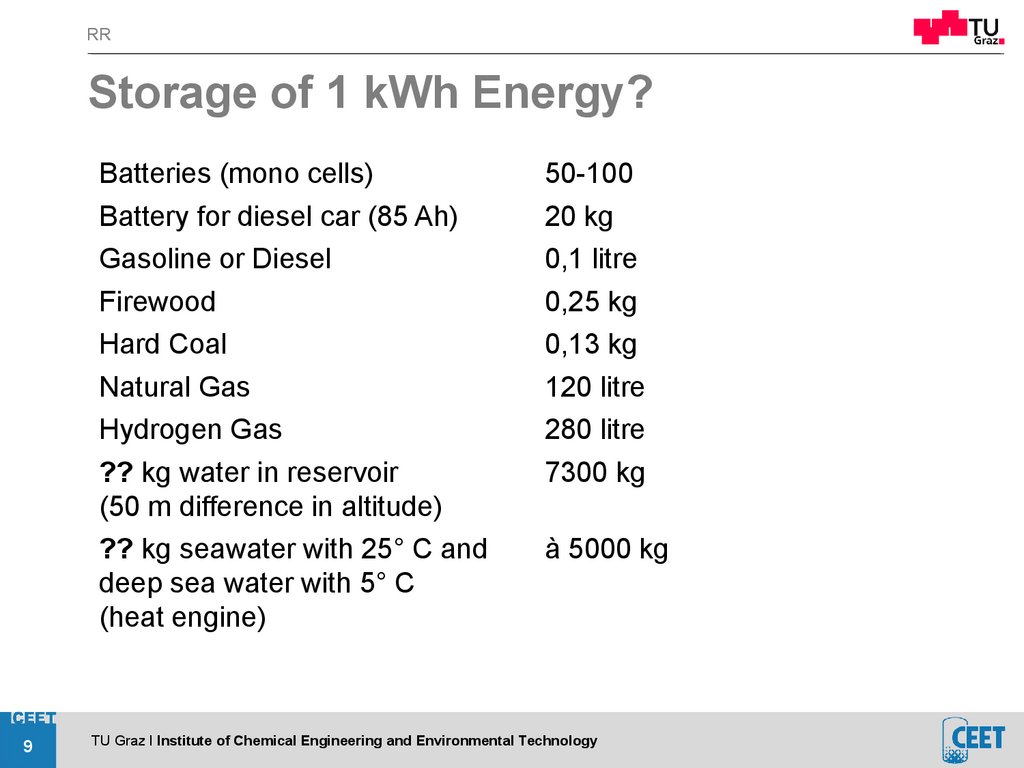
RRStorage of 1 kWh Energy?
Batteries (mono cells)
Battery for diesel car (85 Ah)
Gasoline or Diesel
Firewood
Hard Coal
Natural Gas
Hydrogen Gas
?? kg water in reservoir
(50 m difference in altitude)
?? kg seawater with 25° C and
deep sea water with 5° C
(heat engine)
9
50-100
20 kg
0,1 litre
0,25 kg
0,13 kg
120 litre
280 litre
7300 kg
à 5000 kg
TU Graz I Institute of Chemical Engineering and Environmental Technology
10.
RRRegenerative Energy Supply Austria
10
Solar radiation
1100 kWh/m2a
Solar radiation, summer
day, no clouds, 12:00
800 W/m2
Worldwide energy
consumption
approx. 14 Gtoe
TU Graz I Institute of Chemical Engineering and Environmental Technology
11.
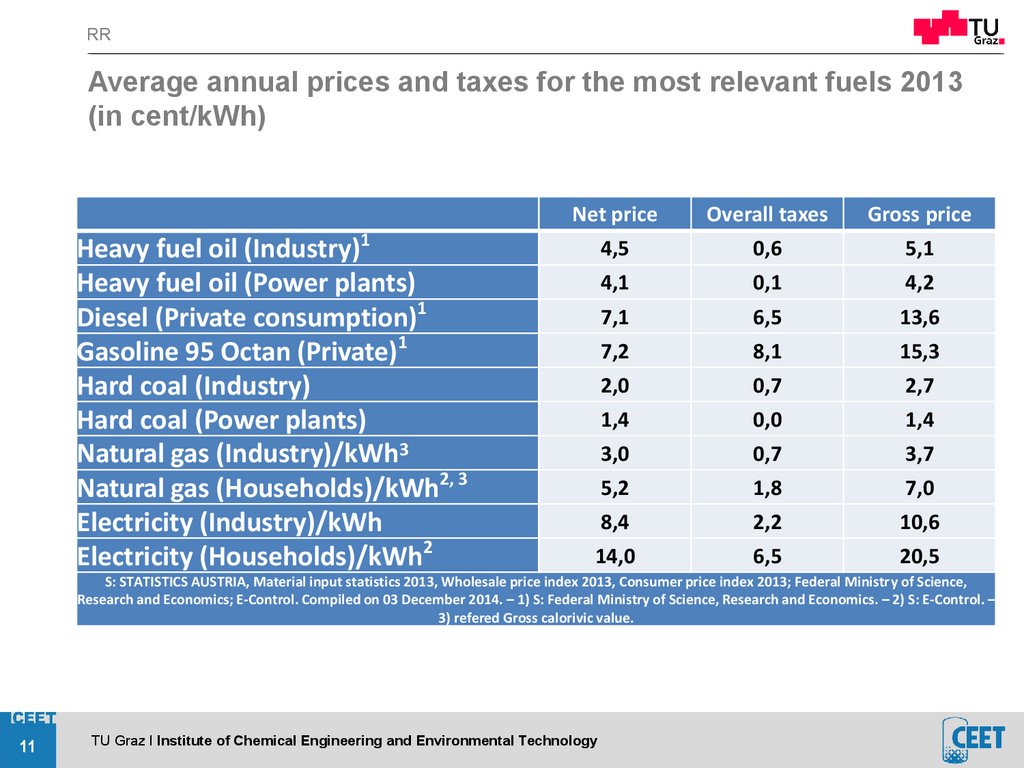
RRAverage annual prices and taxes for the most relevant fuels 2013
(in cent/kWh)
Heavy fuel oil (Industry)1
Heavy fuel oil (Power plants)
Diesel (Private consumption)1
Gasoline 95 Octan (Private)1
Hard coal (Industry)
Hard coal (Power plants)
Natural gas (Industry)/kWh3
Natural gas (Households)/kWh2, 3
Electricity (Industry)/kWh
Electricity (Households)/kWh2
Net price
Overall taxes
Gross price
4,5
0,6
5,1
4,1
0,1
4,2
7,1
6,5
13,6
7,2
8,1
15,3
2,0
0,7
2,7
1,4
0,0
1,4
3,0
0,7
3,7
5,2
1,8
7,0
8,4
2,2
10,6
14,0
6,5
20,5
S: STATISTICS AUSTRIA, Material input statistics 2013, Wholesale price index 2013, Consumer price index 2013; Federal Ministry of Science,
Research and Economics; E-Control. Compiled on 03 December 2014. – 1) S: Federal Ministry of Science, Research and Economics. – 2) S: E-Control. –
3) refered Gross calorivic value.
11
TU Graz I Institute of Chemical Engineering and Environmental Technology
12.
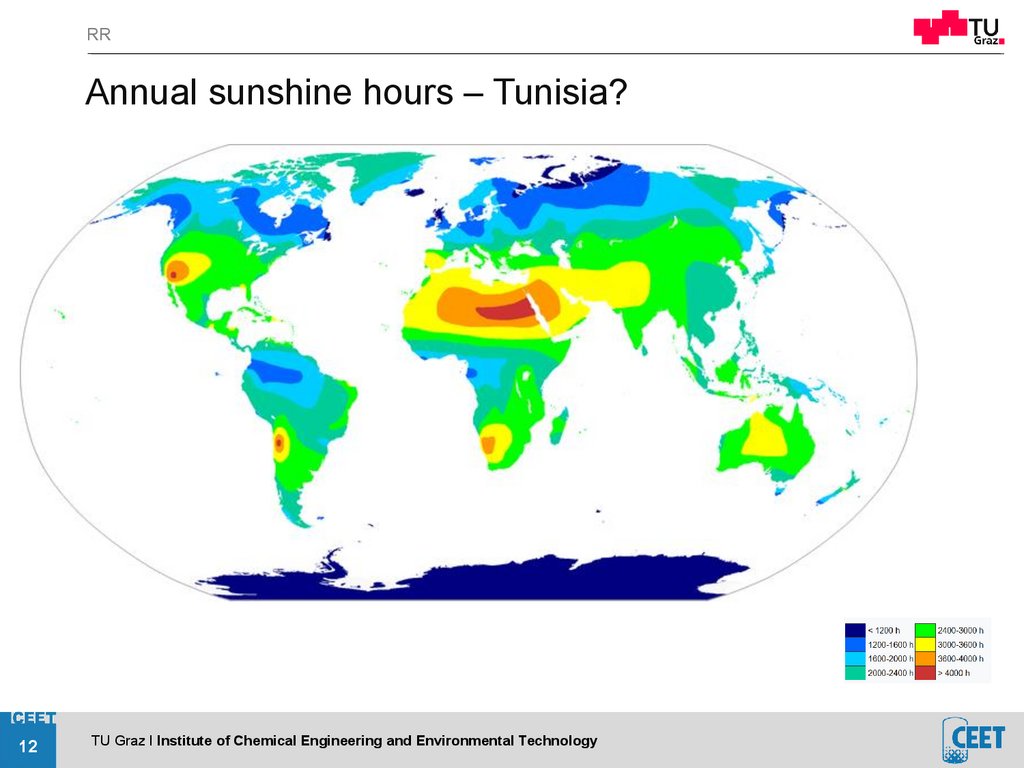
RRAnnual sunshine hours – Tunisia?
12
12
TU Graz I Institute of Chemical Engineering and Environmental Technology
13.
RRStart
13
TU Graz I Institute of Chemical Engineering and Environmental Technology
14.
RRAverage efficiency of coal-fired power plants by region
in the New Policies Scenario
14
TU Graz I Institute of Chemical Engineering and Environmental Technology
15.
RRBackpressure power plants
15
satisfy heat demand of an industrial process
or a district heating network.
by changing the exhaust pressure it is
possible to control the heat-to-power ratio
of a backpressure turbine.
thermal efficiencies can exceed 90%
electricity generation 15% to 25%.
TU Graz I Institute of Chemical Engineering and Environmental Technology
16.
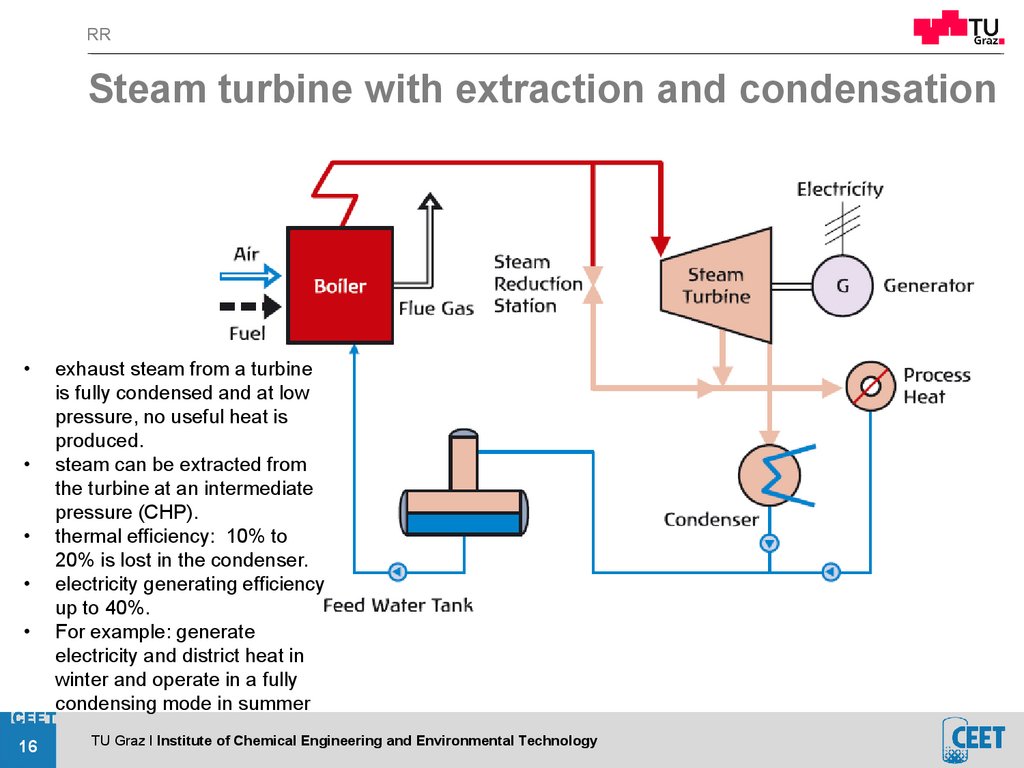
RRSteam turbine with extraction and condensation
16
exhaust steam from a turbine
is fully condensed and at low
pressure, no useful heat is
produced.
steam can be extracted from
the turbine at an intermediate
pressure (CHP).
thermal efficiency: 10% to
20% is lost in the condenser.
electricity generating efficiency
up to 40%.
For example: generate
electricity and district heat in
winter and operate in a fully
condensing mode in summer
TU Graz I Institute of Chemical Engineering and Environmental Technology
17.
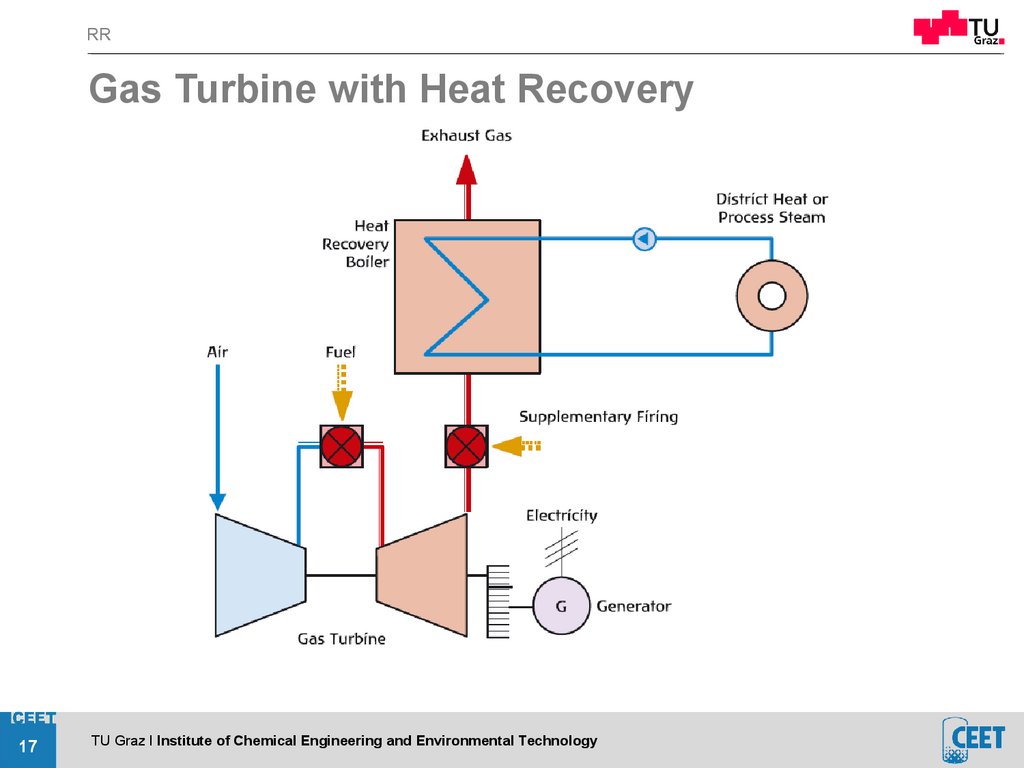
RRGas Turbine with Heat Recovery
17
TU Graz I Institute of Chemical Engineering and Environmental Technology
18.
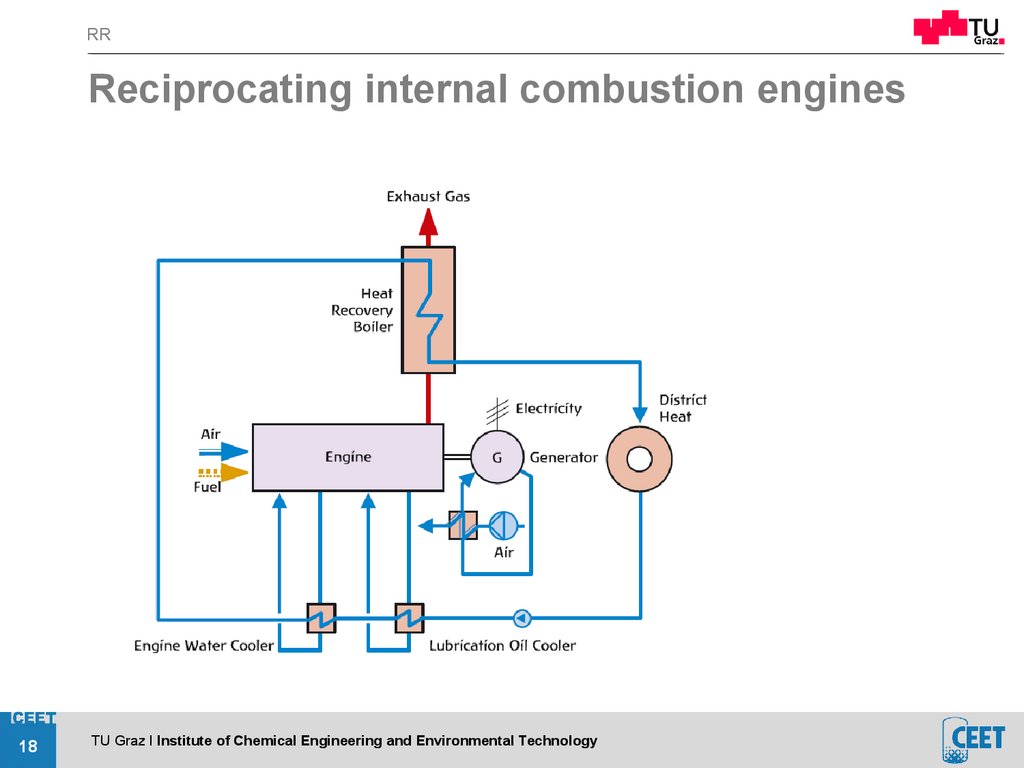
RRReciprocating internal combustion engines
18
TU Graz I Institute of Chemical Engineering and Environmental Technology
19.
RRCombined gas/steam cycle in co-generation
19
TU Graz I Institute of Chemical Engineering and Environmental Technology
20.
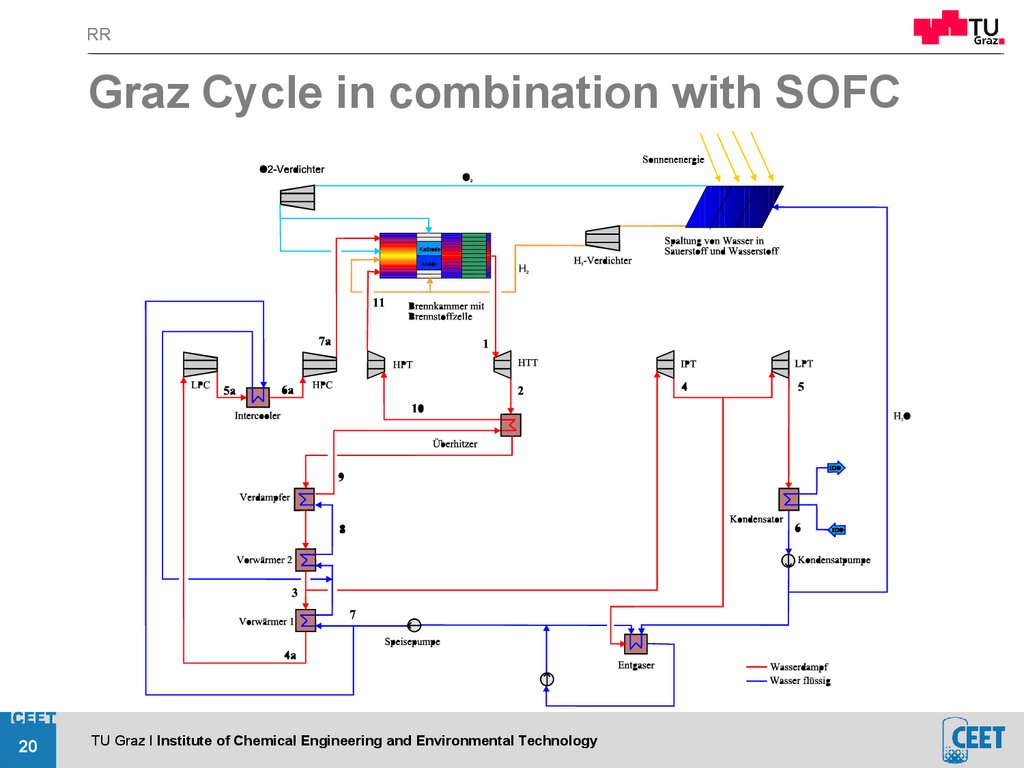
RRGraz Cycle in combination with SOFC
20
TU Graz I Institute of Chemical Engineering and Environmental Technology
21.
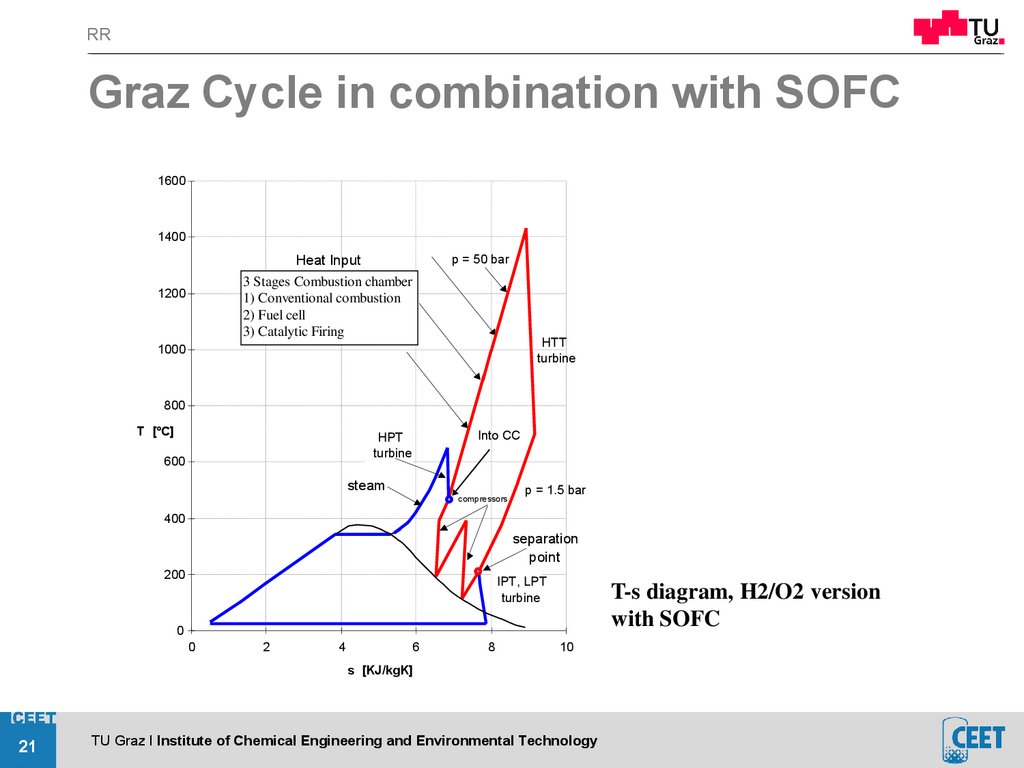
RRGraz Cycle in combination with SOFC
1600
1400
p = 50 bar
Heat Input
3 Stages Combustion chamber
1) Conventional combustion
2) Fuel cell
3) Catalytic Firing
1200
HTT
turbine
1000
800
T [°C]
Into CC
HPT
turbine
600
steam
compressors
p = 1.5 bar
400
separation
point
200
IPT, LPT
turbine
T-s diagram, H2/O2 version
with SOFC
0
0
2
4
6
8
10
s [KJ/kgK]
21
TU Graz I Institute of Chemical Engineering and Environmental Technology
22.
RRKey Features of a Blast Furnace
22
TU Graz I Institute of Chemical Engineering and Environmental Technology
23.
Energy Storage & Conversion VO23
Global steel production
Production
volume:
1864 million mt
(2020)
27 % of global
CO2 emissions
(manufacturing
sector)
Blast furnace
ironmaking:
2.2 t CO2/t steel
https://www.visualcapitalist.com/visualizing-50-years-of-global-steel-production/
24.
Energy Storage & Conversion VO24
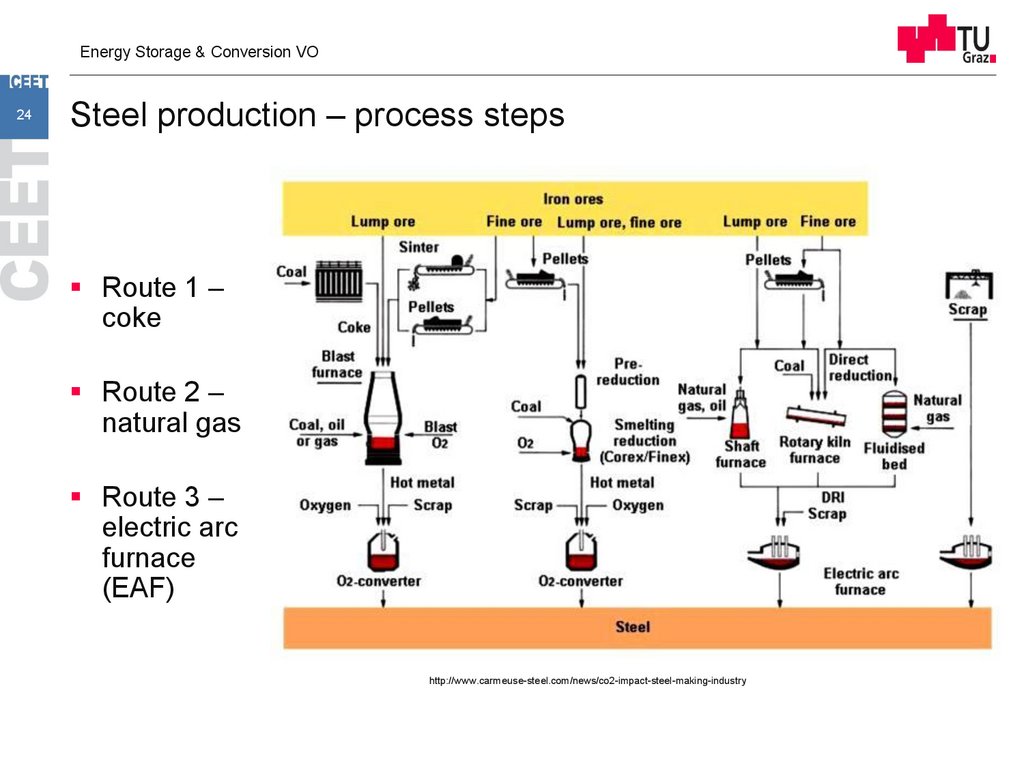
Steel production – process steps
Route 1 –
coke
Route 2 –
natural gas
Route 3 –
electric arc
furnace
(EAF)
http://www.carmeuse-steel.com/news/co2-impact-steel-making-industry
25.
Energy Storage & Conversion VO25
Steel production – process steps
Route 1 – Blast
furnace
Route 2 –
Direct reduction +
Electric Arc
furnace
https://www.sustainableinsteel.eu/p/531/production_routes_for_steel.html
26.
Energy Storage & Conversion VO26
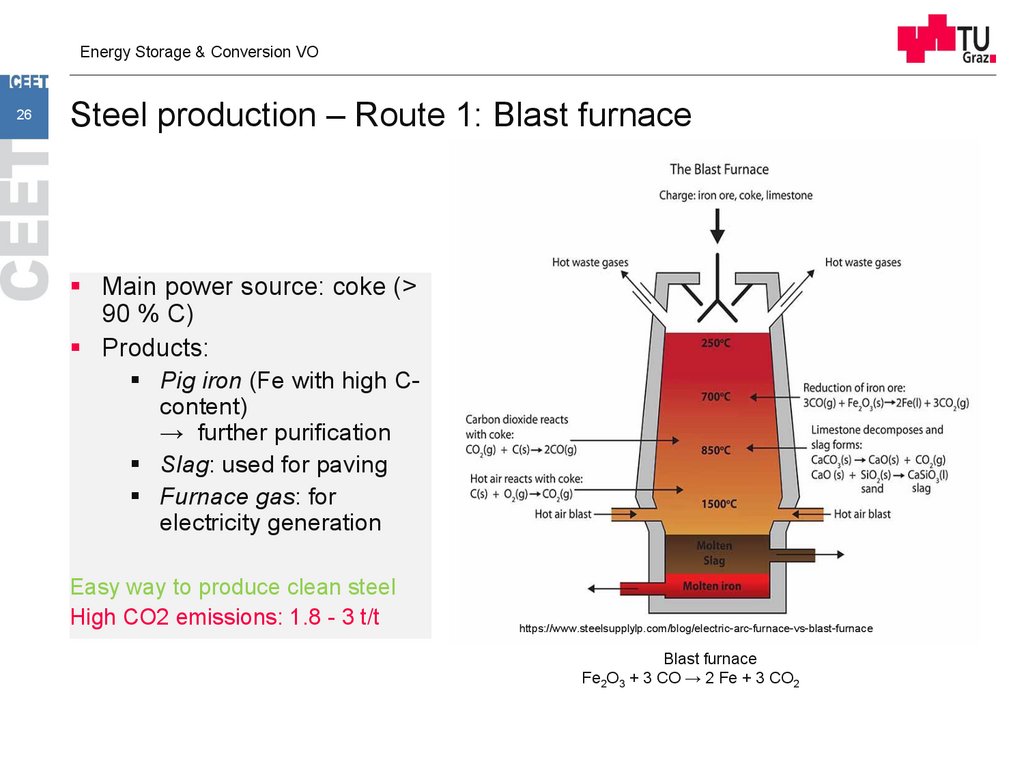
Steel production – Route 1: Blast furnace
Main power source: coke (>
90 % C)
Products:
Pig iron (Fe with high Ccontent)
→ further purification
Slag: used for paving
Furnace gas: for
electricity generation
Easy way to produce clean steel
High CO2 emissions: 1.8 - 3 t/t
https://www.steelsupplylp.com/blog/electric-arc-furnace-vs-blast-furnace
Blast furnace
Fe2O3 + 3 CO → 2 Fe + 3 CO2
27.
Energy Storage & Conversion VO27
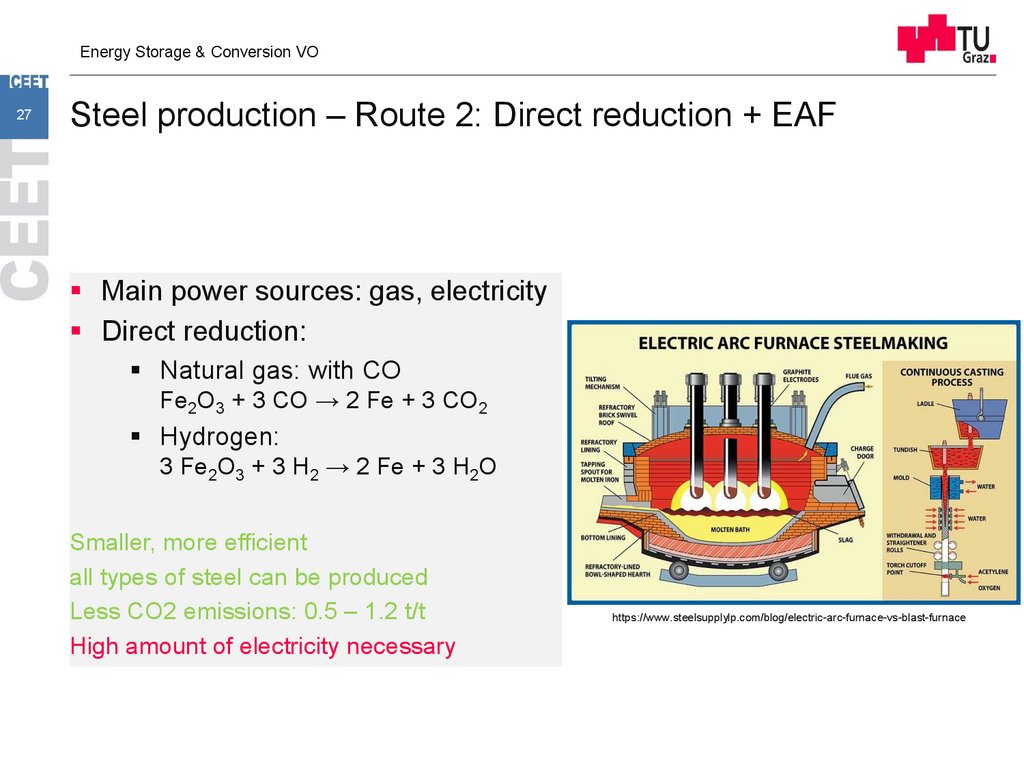
Steel production – Route 2: Direct reduction + EAF
Main power sources: gas, electricity
Direct reduction:
Natural gas: with CO
Fe2O3 + 3 CO → 2 Fe + 3 CO2
Hydrogen:
3 Fe2O3 + 3 H2 → 2 Fe + 3 H2O
Smaller, more efficient
all types of steel can be produced
Less CO2 emissions: 0.5 – 1.2 t/t
High amount of electricity necessary
https://www.steelsupplylp.com/blog/electric-arc-furnace-vs-blast-furnace
28.
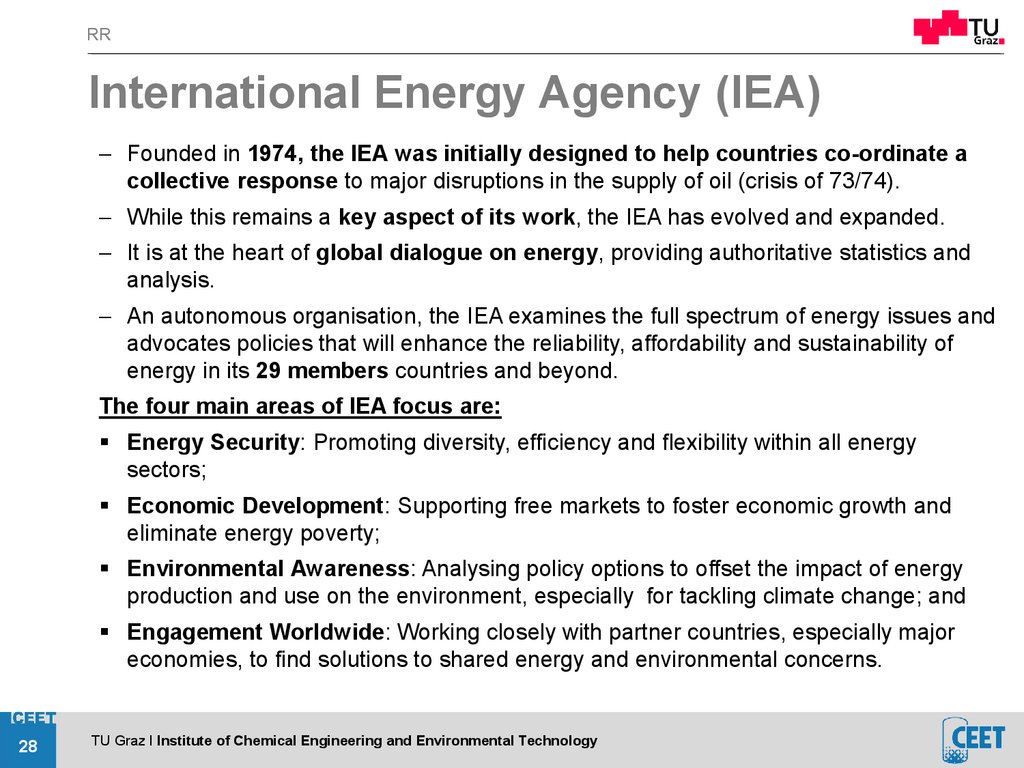
RRInternational Energy Agency (IEA)
Founded in 1974, the IEA was initially designed to help countries co-ordinate a
collective response to major disruptions in the supply of oil (crisis of 73/74).
While this remains a key aspect of its work, the IEA has evolved and expanded.
It is at the heart of global dialogue on energy, providing authoritative statistics and
analysis.
An autonomous organisation, the IEA examines the full spectrum of energy issues and
advocates policies that will enhance the reliability, affordability and sustainability of
energy in its 29 members countries and beyond.
The four main areas of IEA focus are:
Energy Security: Promoting diversity, efficiency and flexibility within all energy
sectors;
Economic Development: Supporting free markets to foster economic growth and
eliminate energy poverty;
Environmental Awareness: Analysing policy options to offset the impact of energy
production and use on the environment, especially for tackling climate change; and
Engagement Worldwide: Working closely with partner countries, especially major
economies, to find solutions to shared energy and environmental concerns.
28
TU Graz I Institute of Chemical Engineering and Environmental Technology
29.
RRCommittee on Energy Research and Technology
(CERT)
29
TU Graz I Institute of Chemical Engineering and Environmental Technology
30.
RRInternational Energy Agency - Implementing Agreement on
Advanced Fuel Cells
Representative in Annex
PEFC
Representative in Annex
Portable Fuel Fells
30
TU Graz I Institute of Chemical Engineering and Environmental Technology
31.
RRInternational Energy Agency (IEA)
31
TU Graz I Institute of Chemical Engineering and Environmental Technology
32.
RRIEA - Events Leading Up to the IEA
The industrial countries’ worst fears were realized in the crisis of 19731974 when a number of the Members of the Organization of Arab
Petroleum Exporting Countries (OAPEC) took concerted action,
beginning in October 1973, to reduce their previous oil production from
about 20.8 million barrels per day (mbd) to about 15.8 mbd.
These reductions were set to increase in monthly increments, until their
economic and political objectives were achieved, and they were
sufficiently implemented to increase oil prices dramatically, in some
spot transactions by as much as six-fold. The producers were able to fix
prices in the range of 400 per cent above previous levels.
The embargo was established by the selective delivery of available oil
and by the deliberate production cuts. So-called “friendly countries” would
continue to receive their previous levels of supply without disturbance.
Although the embargo was not uniformly applied, Saudi Arabia and Libya
cut off virtually all supplies to the United States, which they viewed as the
principal adversary. Denmark, The Netherlands, Portugal, Rhodesia and
South Africa were also embargo targets.
32
TU Graz I Institute of Chemical Engineering and Environmental Technology
33.
RRIEA - Main objectives of the IEA 1974
to maintain and improve systems for coping with oil supply
disruptions
to promote rational energy policies in a global context through cooperative relations with non-member countries, industry and
international organisations
to operate a permanent information system on the international oil
market
to improve the world’s energy supply and demand structure by
developing alternative energy sources and increasing the
efficiency of energy use
to promote international collaboration on energy technology, and
to assist in the integration of environmental and energy policies.
33
TU Graz I Institute of Chemical Engineering and Environmental Technology
34.
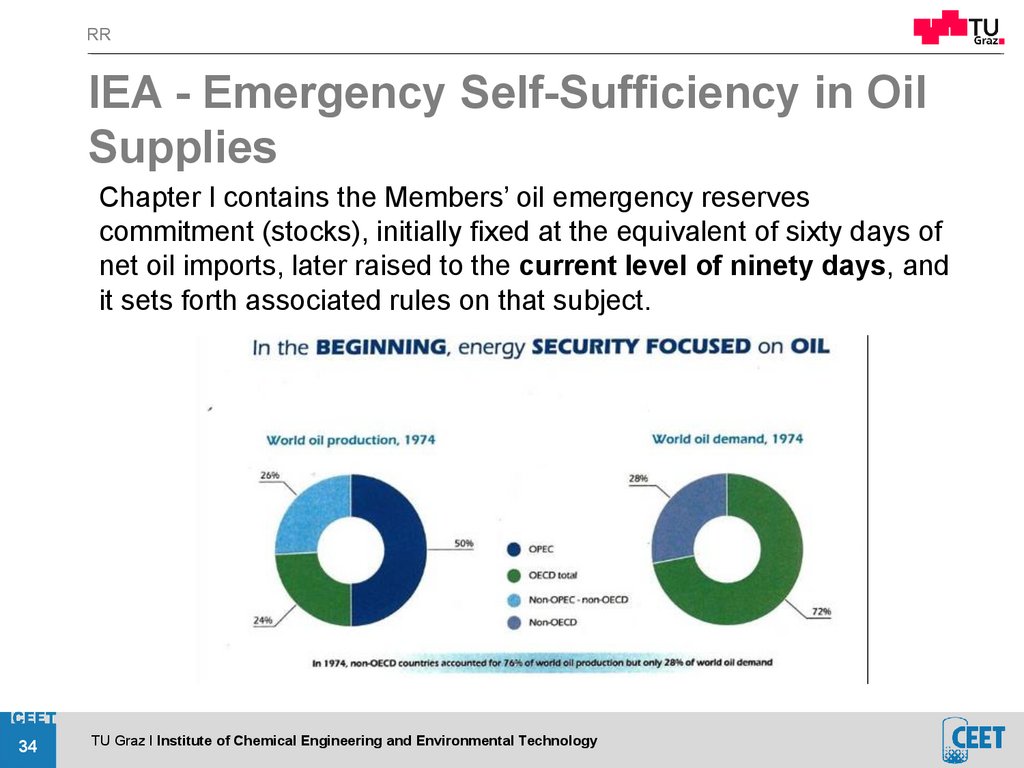
RRIEA - Emergency Self-Sufficiency in Oil
Supplies
Chapter I contains the Members’ oil emergency reserves
commitment (stocks), initially fixed at the equivalent of sixty days of
net oil imports, later raised to the current level of ninety days, and
it sets forth associated rules on that subject.
34
TU Graz I Institute of Chemical Engineering and Environmental Technology
35.
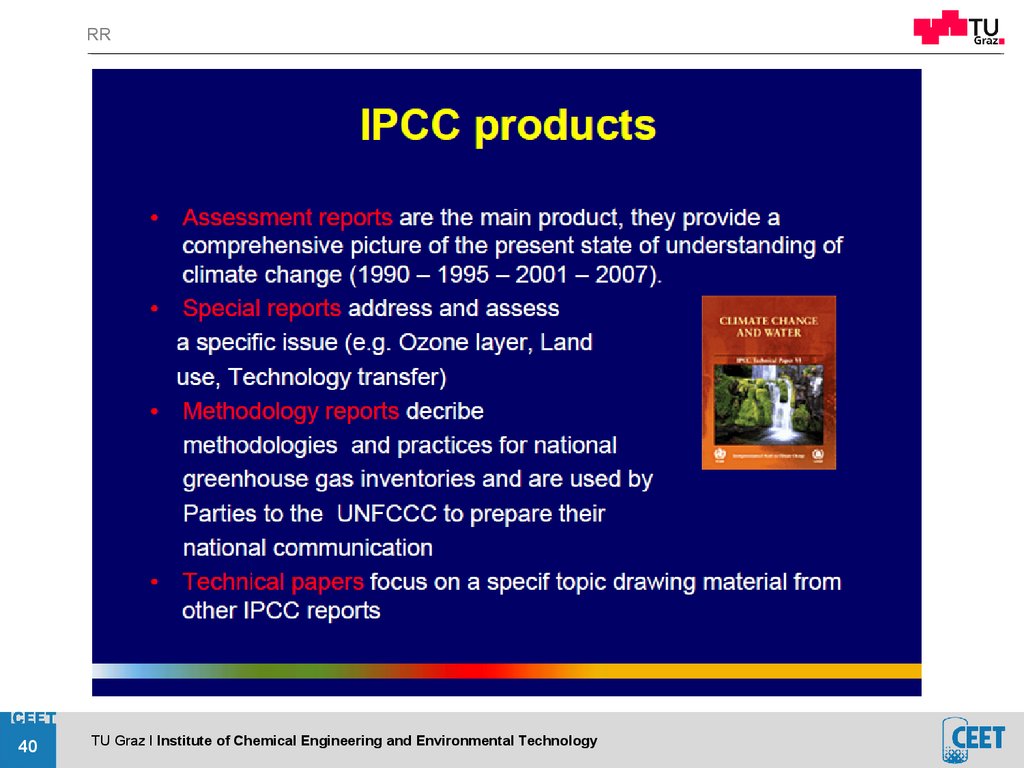
RRIPCC
The Intergovernmental Panel on Climate Change is a
scientific intergovernmental body belonging to the
United Nations
It is the leading body for the assessment of climate
change
35
TU Graz I Institute of Chemical Engineering and Environmental Technology
36.
RRAuthors, contributors, reviewers and
other experts
They are selected by the Working Group
Bureaus from nominations received from
governments and participating organizations or
identified directly because of their special
expertise reflected in their publications and
works
The composition of lead author teams for
chapters of IPCC reports shall reflect a range
of views, expertise and geographical
representation
They work on a voluntary basis
36
TU Graz I Institute of Chemical Engineering and Environmental Technology
37.
RR37
TU Graz I Institute of Chemical Engineering and Environmental Technology
38.
RR38
TU Graz I Institute of Chemical Engineering and Environmental Technology
39.
RR39
TU Graz I Institute of Chemical Engineering and Environmental Technology
40.
RR40
TU Graz I Institute of Chemical Engineering and Environmental Technology
41.
RRGLOBAL ENERGY TRENDS (WEO 2012)
41
TU Graz I Institute of Chemical Engineering and Environmental Technology
42.
RR42
TU Graz I Institute of Chemical Engineering and Environmental Technology
43.
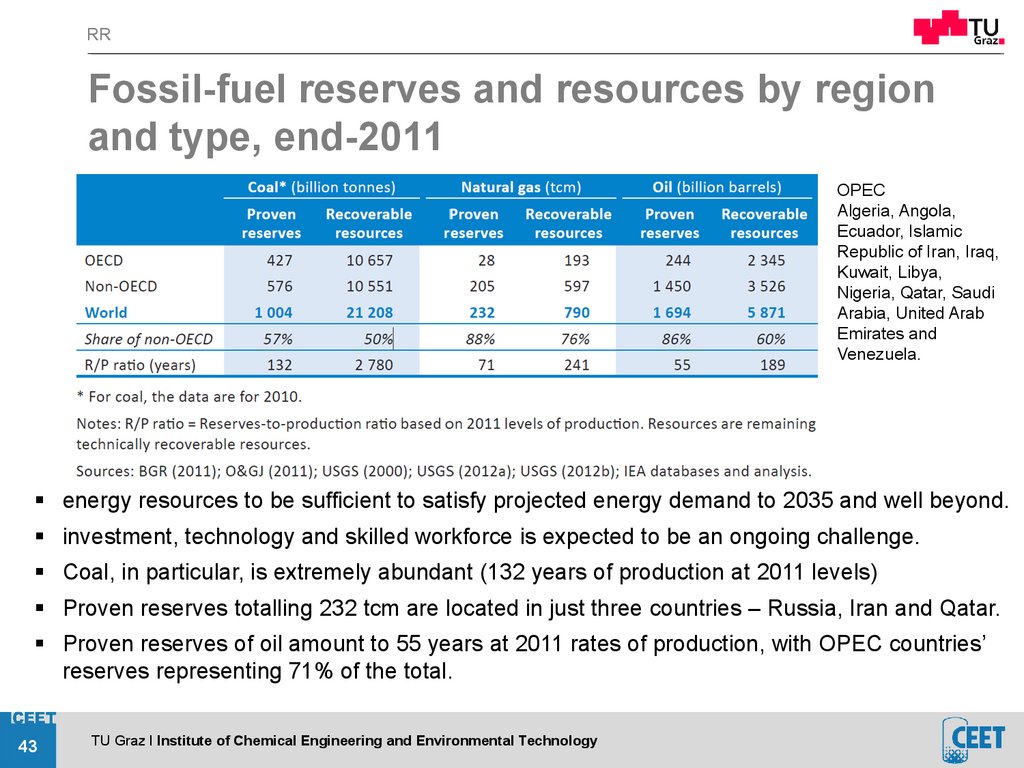
RRFossil-fuel reserves and resources by region
and type, end-2011
OPEC
Algeria, Angola,
Ecuador, Islamic
Republic of Iran, Iraq,
Kuwait, Libya,
Nigeria, Qatar, Saudi
Arabia, United Arab
Emirates and
Venezuela.
energy resources to be sufficient to satisfy projected energy demand to 2035 and well beyond.
investment, technology and skilled workforce is expected to be an ongoing challenge.
Coal, in particular, is extremely abundant (132 years of production at 2011 levels)
Proven reserves totalling 232 tcm are located in just three countries – Russia, Iran and Qatar.
Proven reserves of oil amount to 55 years at 2011 rates of production, with OPEC countries’
reserves representing 71% of the total.
43
TU Graz I Institute of Chemical Engineering and Environmental Technology
44.
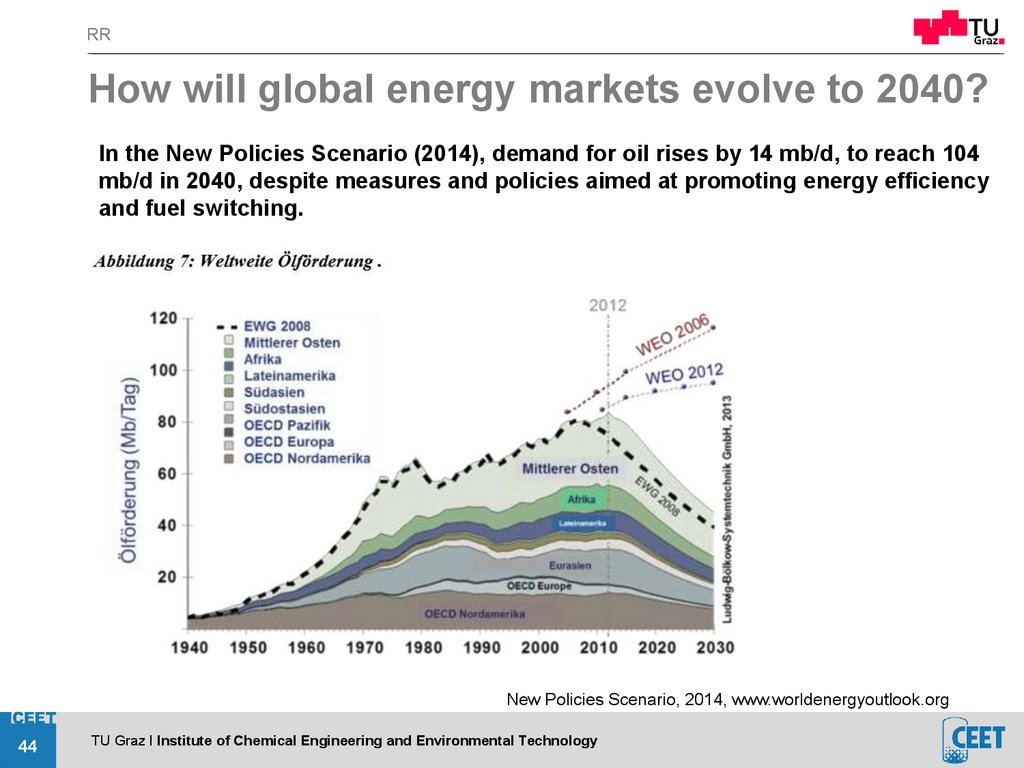
RRHow will global energy markets evolve to 2040?
In the New Policies Scenario (2014), demand for oil rises by 14 mb/d, to reach 104
mb/d in 2040, despite measures and policies aimed at promoting energy efficiency
and fuel switching.
New Policies Scenario, 2014, www.worldenergyoutlook.org
44
TU Graz I Institute of Chemical Engineering and Environmental Technology
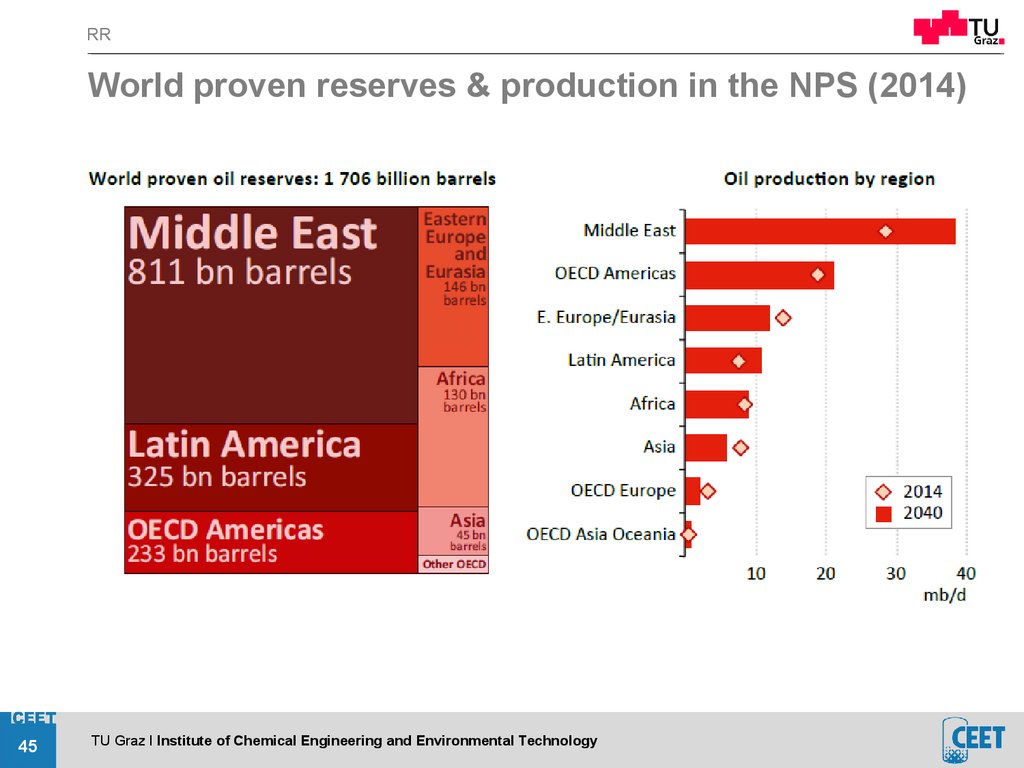
45.
RRWorld proven reserves & production in the NPS (2014)
45
TU Graz I Institute of Chemical Engineering and Environmental Technology
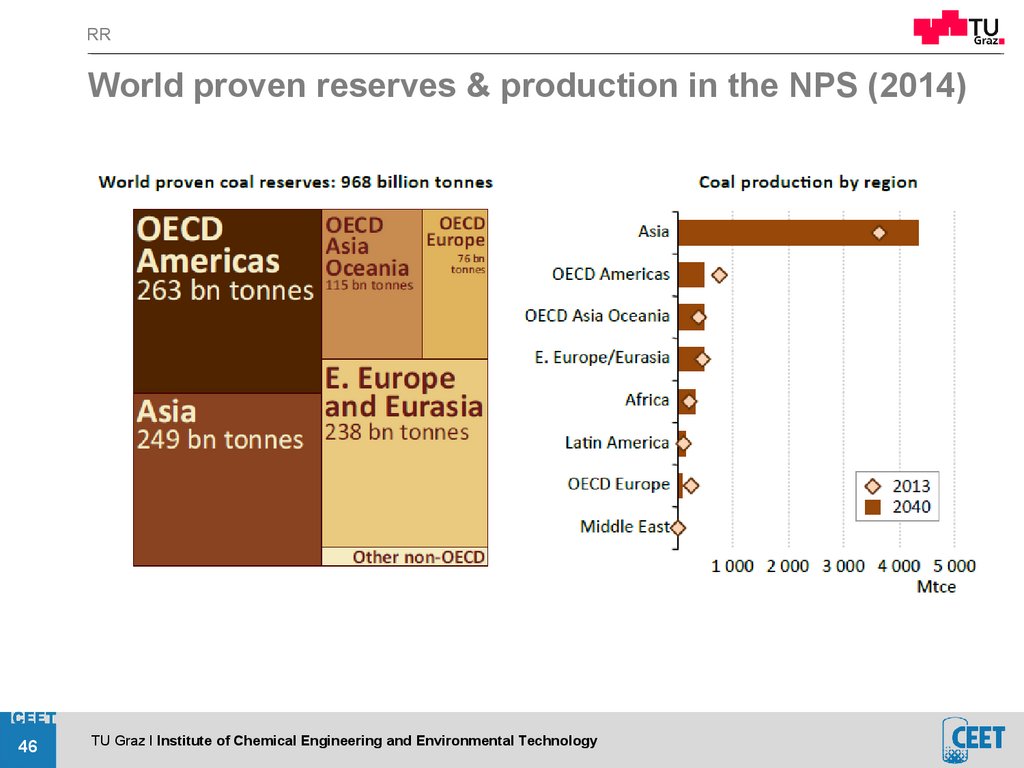
46.
RRWorld proven reserves & production in the NPS (2014)
46
TU Graz I Institute of Chemical Engineering and Environmental Technology
47.
RRWorld proven reserves & production in the NPS (2014)
47
TU Graz I Institute of Chemical Engineering and Environmental Technology
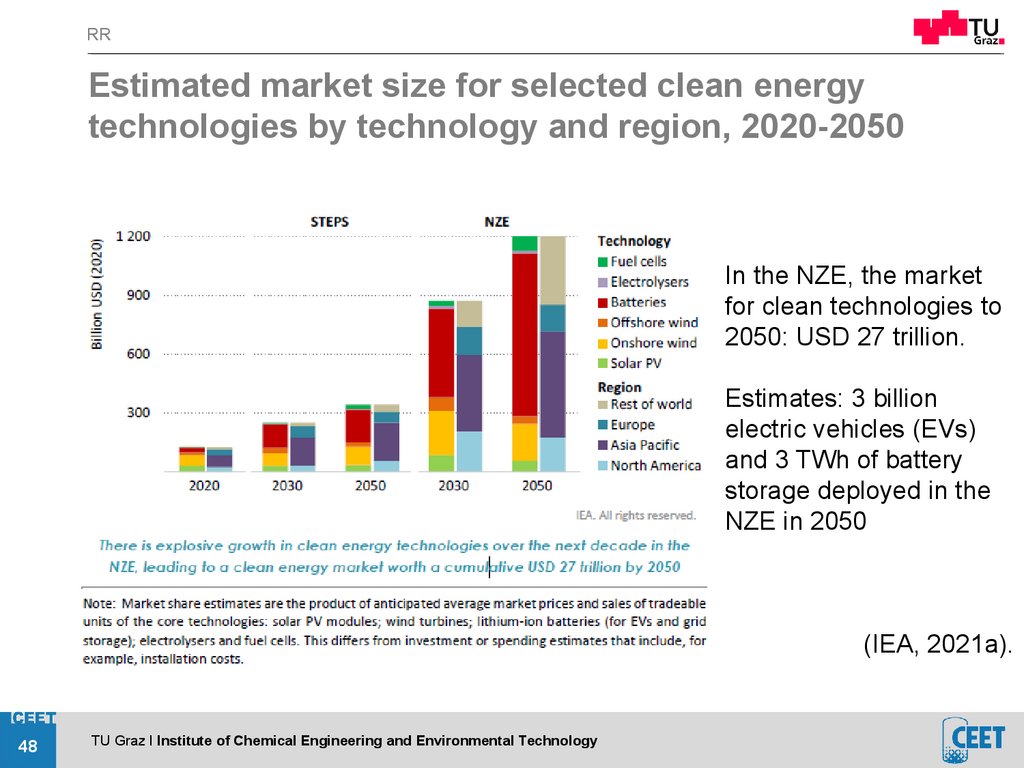
48.
RREstimated market size for selected clean energy
technologies by technology and region, 2020-2050
In the NZE, the market
for clean technologies to
2050: USD 27 trillion.
Estimates: 3 billion
electric vehicles (EVs)
and 3 TWh of battery
storage deployed in the
NZE in 2050
(IEA, 2021a).
48
TU Graz I Institute of Chemical Engineering and Environmental Technology
49.
RRSelected indicators
in the Net Zero
Emissions by 2050
Scenario
The four key priorities for action to close this
gap over the next decade, and to prepare
the ground for further rapid emissions
reduction beyond 2030, are to:
1. Deliver a surge in clean electrification.
2. Realise the full potential of energy
efficiency.
3. Prevent methane leaks from fossil fuel
operations.
4. Boost clean energy innovation.
WEO,2021
49
TU Graz I Institute of Chemical Engineering and Environmental Technology
50.
RR1. Clean electrification
Cleaning up the electricity mix and extending the electrification of enduses
The electricity sector emitted 2020, 36% of all energy-related emissions
(12.3 Gt CO2). Coal remains the largest single source of electricity
worldwide.
Coal contributes just over one-third of electricity supply but is responsible
for nearly three-quarters of electricity sector CO2 emissions.
Accelerating the decarbonisation of the electricity mix is the single most
important way to close the 2030 gap between the APS and NZE.
Renewables increases from almost 30% of electricity generation globally
in 2020 to about 45% in 2030 (APS) and 60% (NZE).
Utility-scale battery storage capacity increases 18-times from 2020 to
2030 in the APS, and more than 30-times in the NZE.
In NZE, the share of EV cars in total car sales is over 60% in 2030.
50
TU Graz I Institute of Chemical Engineering and Environmental Technology
51.
RRClean electrification: Selected indicators in APS & NZE by 2050
51
TU Graz I Institute of Chemical Engineering and Environmental Technology
52.
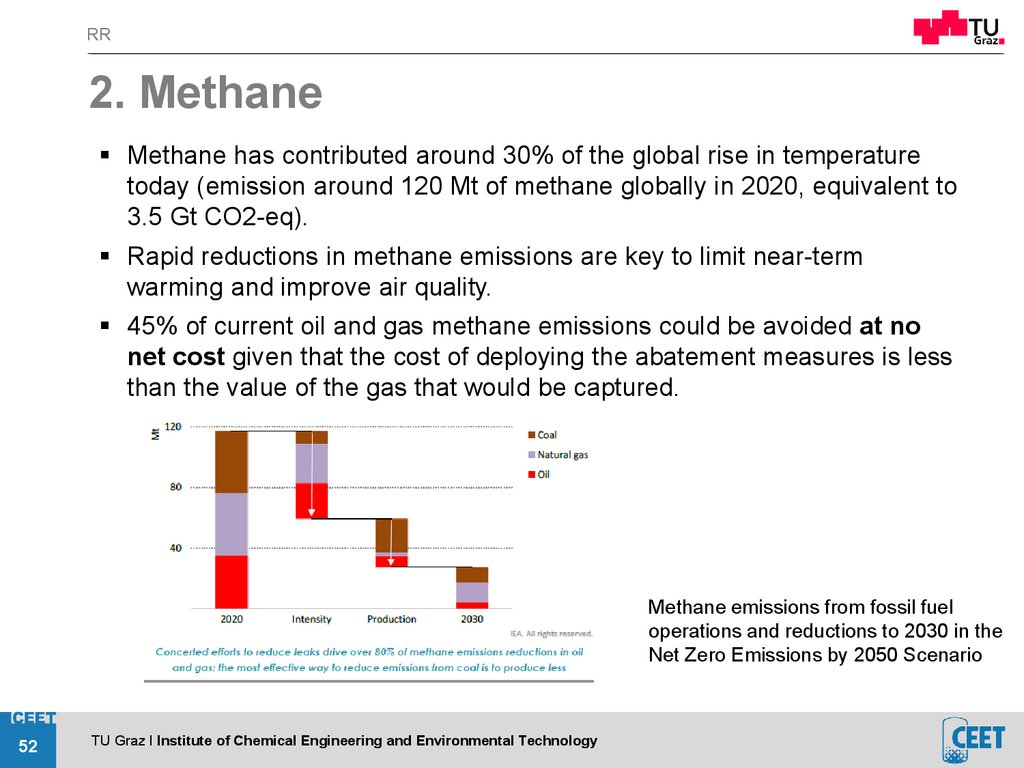
RR2. Methane
Methane has contributed around 30% of the global rise in temperature
today (emission around 120 Mt of methane globally in 2020, equivalent to
3.5 Gt CO2-eq).
Rapid reductions in methane emissions are key to limit near-term
warming and improve air quality.
45% of current oil and gas methane emissions could be avoided at no
net cost given that the cost of deploying the abatement measures is less
than the value of the gas that would be captured.
Methane emissions from fossil fuel
operations and reductions to 2030 in the
Net Zero Emissions by 2050 Scenario
52
TU Graz I Institute of Chemical Engineering and Environmental Technology
53.
RRNatural Gas
New Policies Scenaorio, 2014, www.worldenergyoutlook.org
53
TU Graz I Institute of Chemical Engineering and Environmental Technology
54.
RR54
TU Graz I Institute of Chemical Engineering and Environmental Technology
55.
RRThe World Bank
estimates 5 to 6 trillion cf
(cubic feet) of natural
gas are flared /vented
yearly representing 400
million tons of green
house gas emissions.
This is equivalent to
nearly one-third of the
European Union’s
annual natural gas
consumption.
55
TU Graz I Institute of Chemical Engineering and Environmental Technology
56.
RRAbfackelstatistik: Russland verbrennt nach Berechnungen der Forscher mit Abstand das meiste
Erdgas. Die USA tauchen in der Statistik nicht auf, weil die Forscher in Nordamerika nur Flammen
von Seeplattformen erfassen konnten. Laut eigenen Angaben verbrennt die US-Ölindustrie etwa 2,8
Milliarden Kubikmeter pro Jahr.
56
TU Graz I Institute of Chemical Engineering and Environmental Technology
57.
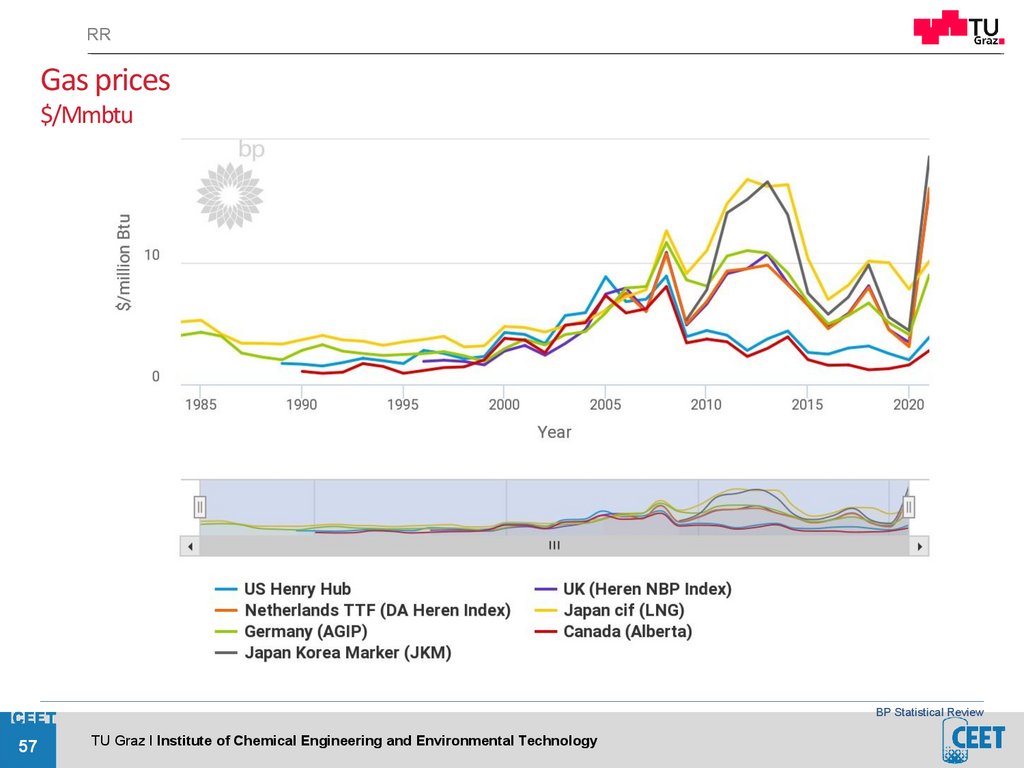
RRGas prices
$/Mmbtu
BP Statistical Review
57
TU Graz I Institute of Chemical Engineering and Environmental Technology
58.
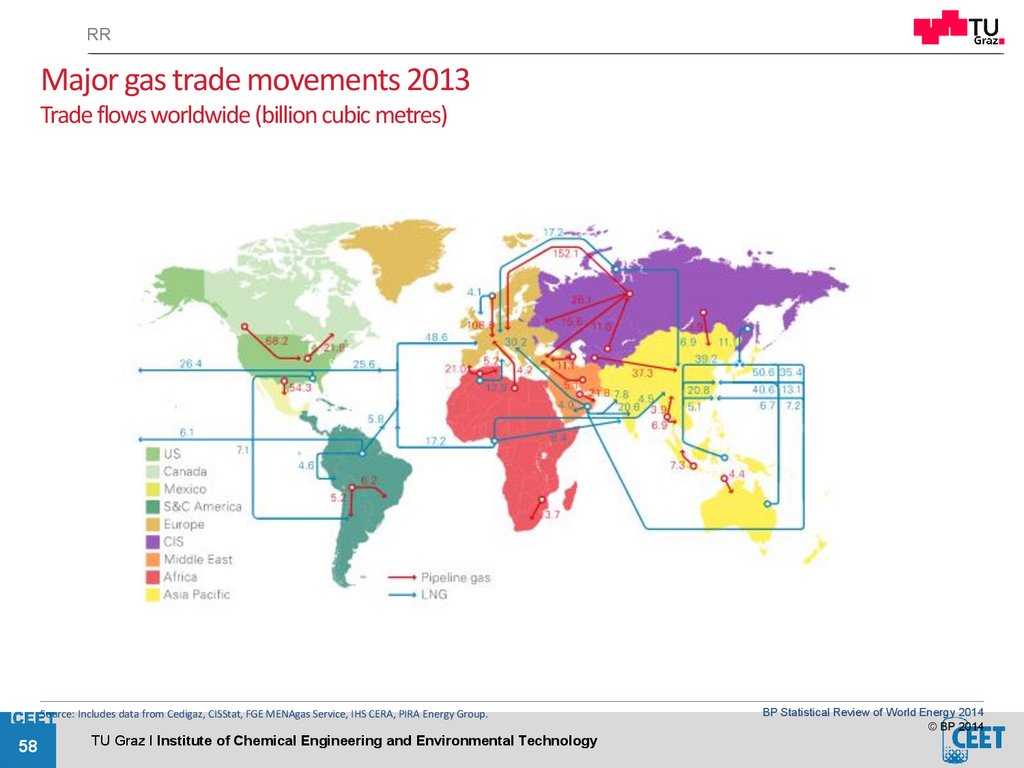
RRMajor gas trade movements 2013
Trade flows worldwide (billion cubic metres)
Source: Includes data from Cedigaz, CISStat, FGE MENAgas Service, IHS CERA, PIRA Energy Group.
58
TU Graz I Institute of Chemical Engineering and Environmental Technology
BP Statistical Review of World Energy 2014
© BP 2014
59.
RR59
TU Graz I Institute of Chemical Engineering and Environmental Technology
60.
RR60
TU Graz I Institute of Chemical Engineering and Environmental Technology
61.
RR61
TU Graz I Institute of Chemical Engineering and Environmental Technology
62.
RR62
TU Graz I Institute of Chemical Engineering and Environmental Technology
63.
RR63
TU Graz I Institute of Chemical Engineering and Environmental Technology
64.
RR64
TU Graz I Institute of Chemical Engineering and Environmental Technology
65.
RR3. Energy efficiency
Improvements in energy efficiency curb demand for electricity and
fuels of all kinds.
In the STEPS, overall global energy demand continues to climb; in
the APS it plateaus after 2030 (in the NZE, it is 15% lower)
As a result, the energy intensity of the global economy decreases
by 4% per year between 2020 and 2030 in the NZE, more than
double the average rate of the previous decade
Behavioural changes contribute around another 1 Gt by 2030 to
the additional emissions reductions in the NZE, notably in the
transport sector.
In the buildings sector, the number of building retrofits would need
to increase two-and-half-times compared with announced pledges
to close the gap; this is particularly important in advanced
economies.
65
TU Graz I Institute of Chemical Engineering and Environmental Technology
66.
RR4. Innovation
Almost half of the emissions reductions achieved in the
NZE in 2050 come from technologies that are at the
demonstration or prototype stage today (heavy
industrial sectors and long-distance transport)
Need of support in key technology areas, such as
advanced batteries, low-carbon fuels, hydrogen
electrolysers and direct air capture.
In the NZE, around USD 90 billion of public money is
mobilised to complete a portfolio of demonstration
projects before 2030.
Announced pledges lag on key NZE milestones related
to hydrogen-based and other lowcarbon fuels, as
well as CCUS.
66
TU Graz I Institute of Chemical Engineering and Environmental Technology
67.
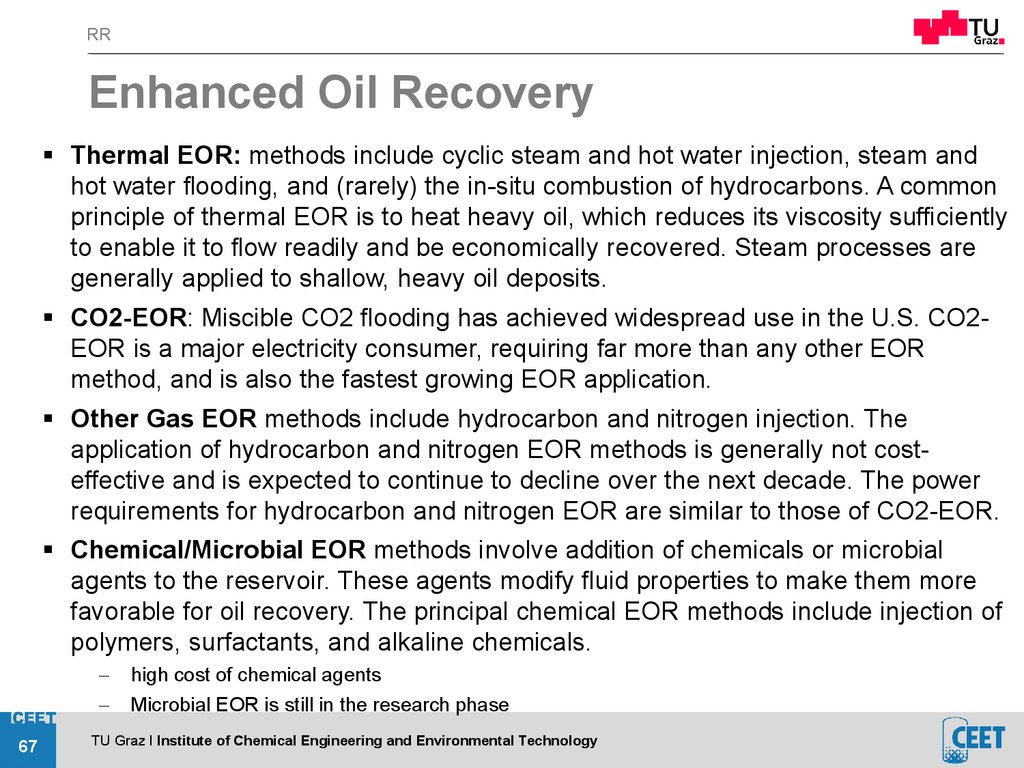
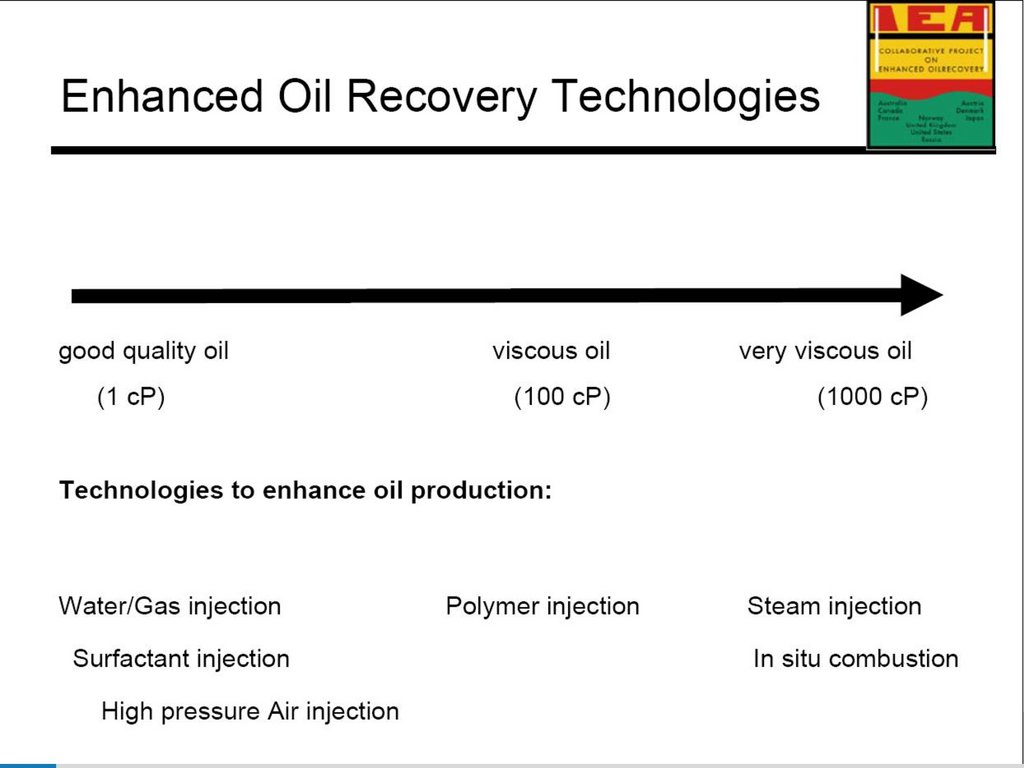
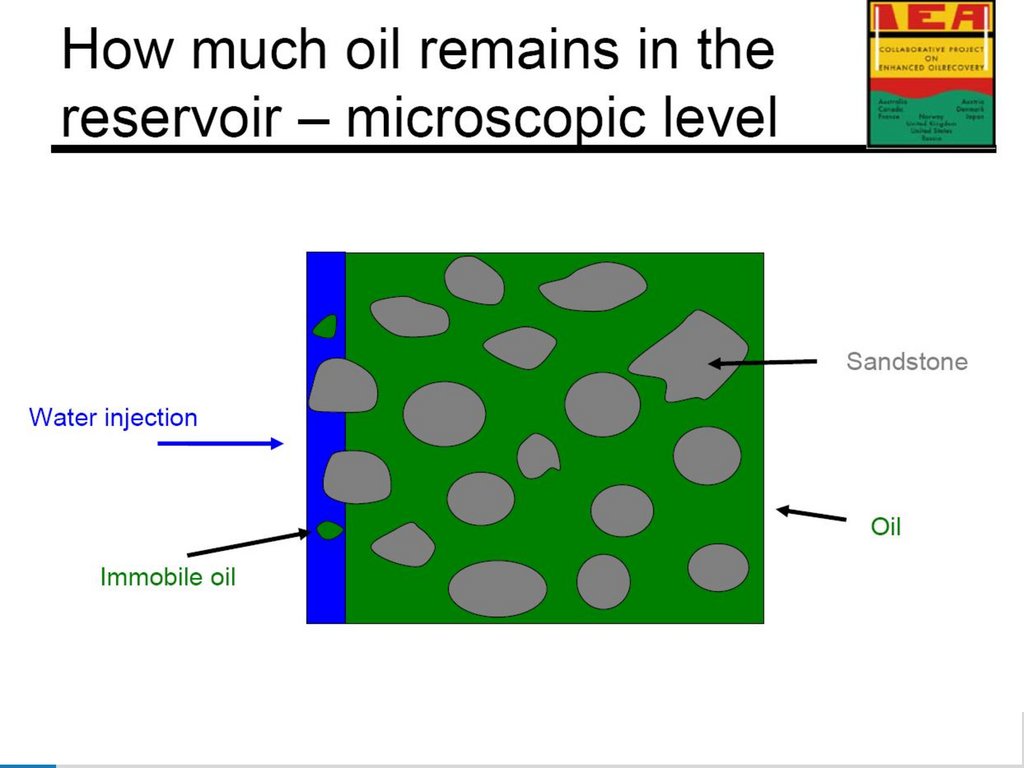
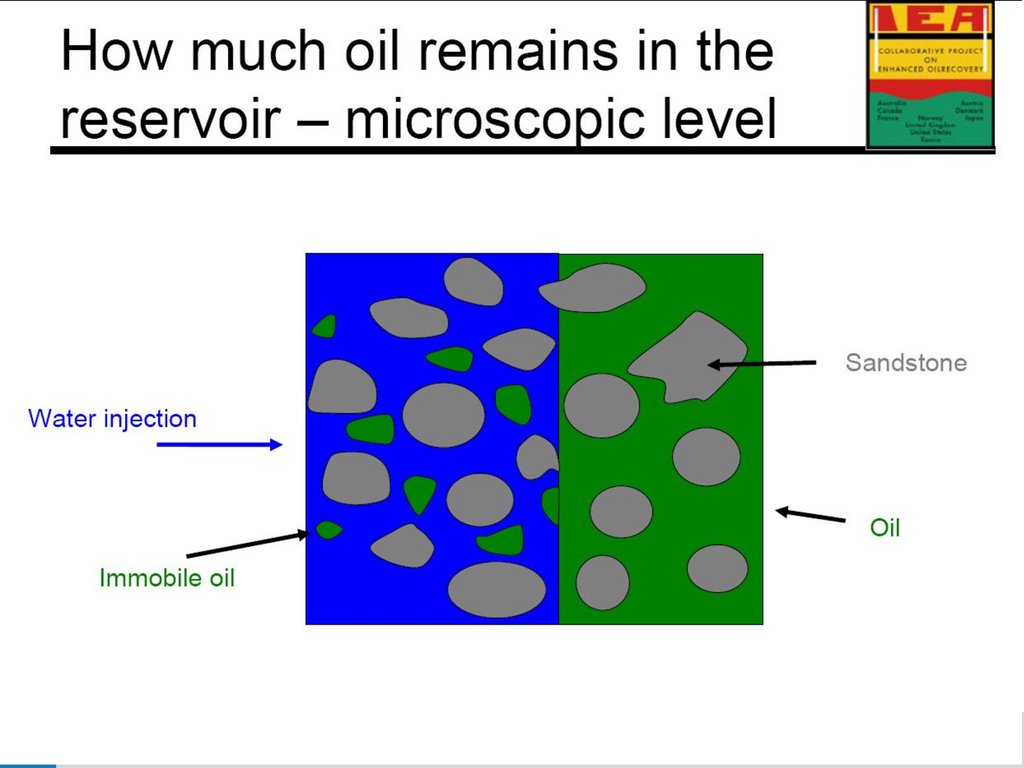
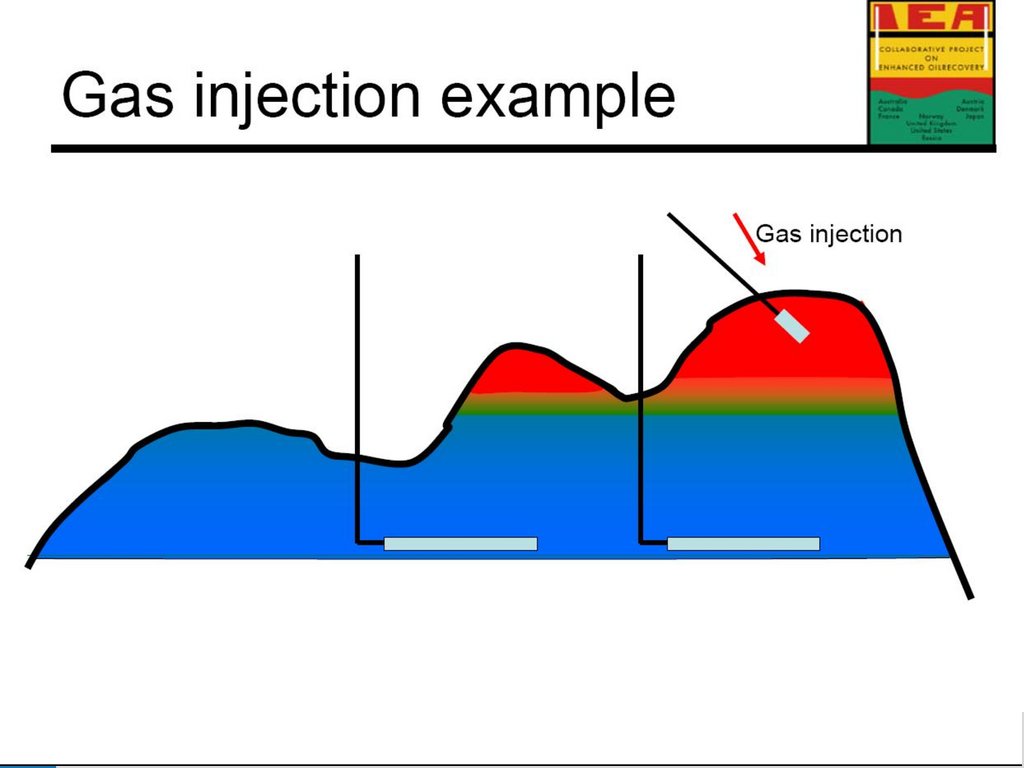
RREnhanced Oil Recovery
Thermal EOR: methods include cyclic steam and hot water injection, steam and
hot water flooding, and (rarely) the in-situ combustion of hydrocarbons. A common
principle of thermal EOR is to heat heavy oil, which reduces its viscosity sufficiently
to enable it to flow readily and be economically recovered. Steam processes are
generally applied to shallow, heavy oil deposits.
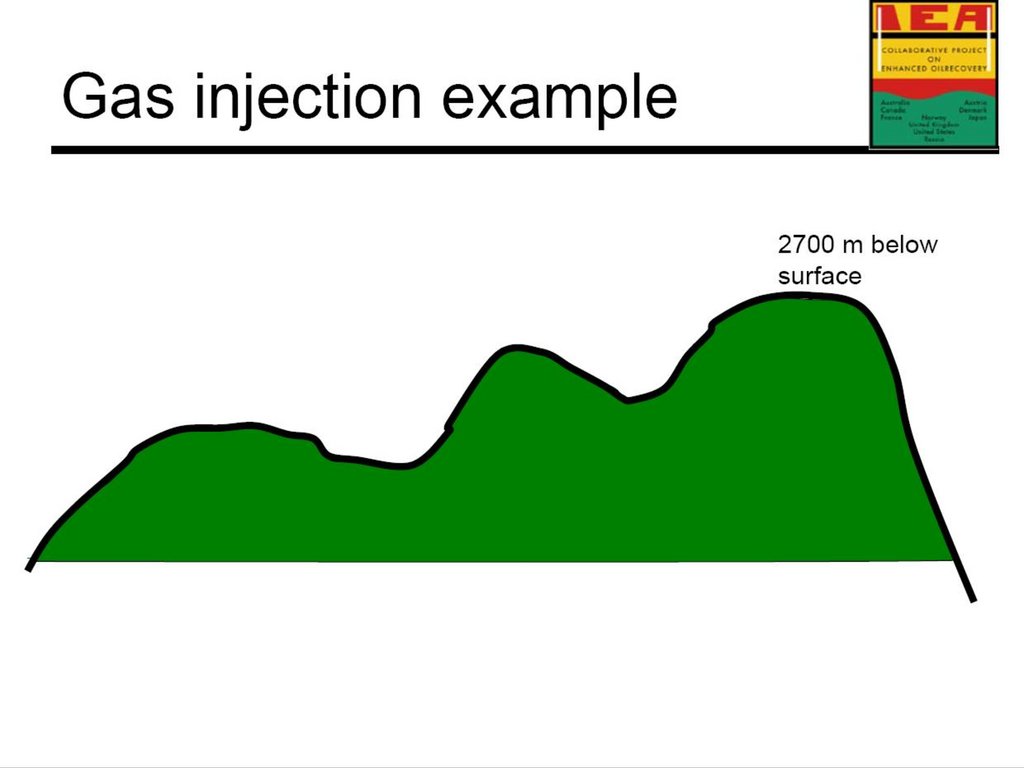
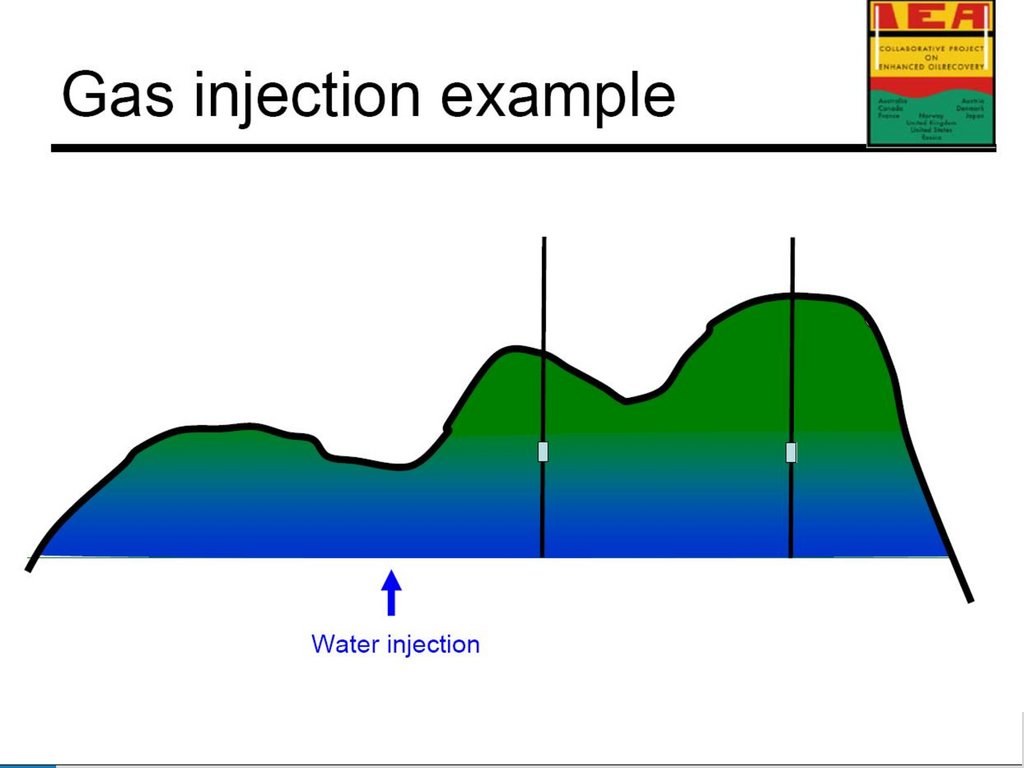
CO2-EOR: Miscible CO2 flooding has achieved widespread use in the U.S. CO2EOR is a major electricity consumer, requiring far more than any other EOR
method, and is also the fastest growing EOR application.
Other Gas EOR methods include hydrocarbon and nitrogen injection. The
application of hydrocarbon and nitrogen EOR methods is generally not costeffective and is expected to continue to decline over the next decade. The power
requirements for hydrocarbon and nitrogen EOR are similar to those of CO2-EOR.
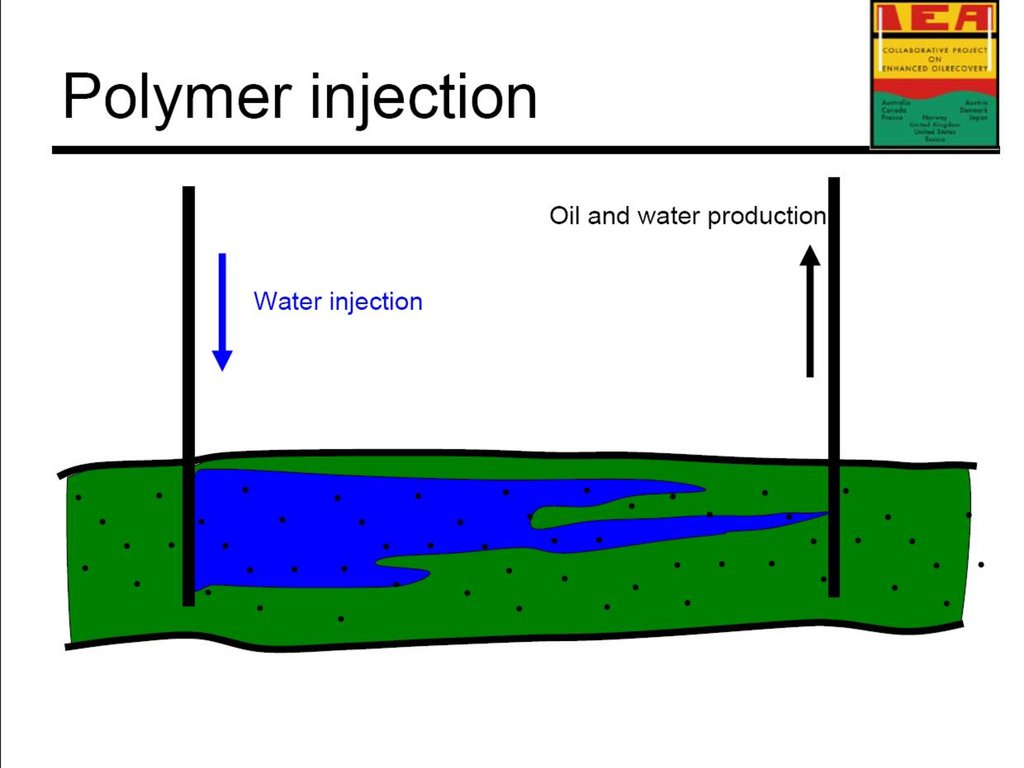
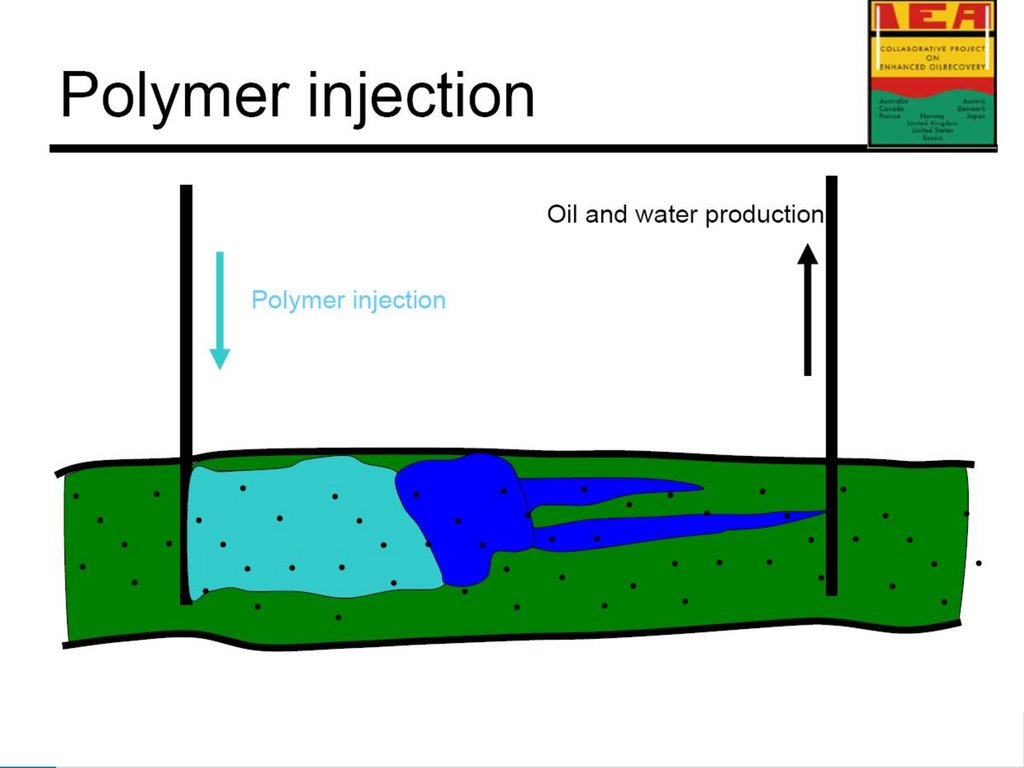
Chemical/Microbial EOR methods involve addition of chemicals or microbial
agents to the reservoir. These agents modify fluid properties to make them more
favorable for oil recovery. The principal chemical EOR methods include injection of
polymers, surfactants, and alkaline chemicals.
67
high cost of chemical agents
Microbial EOR is still in the research phase
TU Graz I Institute of Chemical Engineering and Environmental Technology
68.
RR68
TU Graz I Institute of Chemical Engineering and Environmental Technology
69.
RR69
TU Graz I Institute of Chemical Engineering and Environmental Technology
70.
RR70
TU Graz I Institute of Chemical Engineering and Environmental Technology
71.
RR71
TU Graz I Institute of Chemical Engineering and Environmental Technology
72.
RR72
TU Graz I Institute of Chemical Engineering and Environmental Technology
73.
RR73
TU Graz I Institute of Chemical Engineering and Environmental Technology
74.
RR74
TU Graz I Institute of Chemical Engineering and Environmental Technology
75.
RR75
TU Graz I Institute of Chemical Engineering and Environmental Technology
76.
RR76
TU Graz I Institute of Chemical Engineering and Environmental Technology
77.
RR77
TU Graz I Institute of Chemical Engineering and Environmental Technology
78.
RR78
TU Graz I Institute of Chemical Engineering and Environmental Technology
79.
RR79
TU Graz I Institute of Chemical Engineering and Environmental Technology
80.
RR80
TU Graz I Institute of Chemical Engineering and Environmental Technology
81.
RR81
TU Graz I Institute of Chemical Engineering and Environmental Technology
82.
RR82
TU Graz I Institute of Chemical Engineering and Environmental Technology
83.
RR83
TU Graz I Institute of Chemical Engineering and Environmental Technology
84.
RR84
TU Graz I Institute of Chemical Engineering and Environmental Technology
85.
RR85
TU Graz I Institute of Chemical Engineering and Environmental Technology
86.
RR86
TU Graz I Institute of Chemical Engineering and Environmental Technology
87.
RR87
TU Graz I Institute of Chemical Engineering and Environmental Technology
88.
RRCO2 prices
The pricing of CO2 emissions (either through cap-and-trade programmes or carbon
taxes) affects demand for energy by altering the relative costs of using different fuels.
Several countries have implemented emissions trading schemes to set CO2 prices,
while many others have schemes under development, some at an advanced stage of
design.
Other countries have introduced carbon taxes – taxes on fuels linked to related
emissions – or are considering doing so. The EU Emissions Trading System (ETS) is
currently the world’s largest, covering all 27 member states, plus Norway, Iceland and
Liechtenstein.
CO2 prices under the programme had been driven to record lows by mid-2012,
primarily due to the dampening effect of the economic recession on energy demand.
A debate followed on reform options to ensure that prices rise sufficiently to
encourage investment in lowcarbon technologies.
In the Sustainable Development Scenario, a higher and broader CO2 price is
assumed, rising to $140/tonne in advanced economies and $125/tonne in Brazil,
China, Russia and South Africa by 2040. The carbon price applies to power
generation, industry and, in some countries, aviation.
88
TU Graz I Institute of Chemical Engineering and Environmental Technology
89.
RRCO2 prices in selected regions by scenario ($2017 per tonne)
89
TU Graz I Institute of Chemical Engineering and Environmental Technology
90.
RR90
TU Graz I Institute of Chemical Engineering and Environmental Technology
91.
RR91
TU Graz I Institute of Chemical Engineering and Environmental Technology