


 Физика
Похожие презентации:


")
")


Mechanical oscillations and waves. Bioacoustics. Ultrasound
1.
Mechanical oscillations andwaves. Bioacoustics. Ultrasound
2.
OSCILLATIONSOSCILLATIONS – are movements or processes that repeat in time. Many biological
objects and natural phenomena have oscillatory nature.
Examples:
spring
pendulum
breath
mathematical
pendulum
heartbeat
3.
KINDS OF OSCILLATIONSelectrocardiogram
harmonic oscillations
rectangular oscillations
Sawtooth oscillations
complex form oscillations
harmonic damped oscillations
4.
PARAMETERS OFOSCILLATIONS
AMPLITUDE-
maximal
displacement
from
equilibrium
PERIOD-
FREQUENCY
– number of
time of one full
oscillation cycle oscillations
per unit of
time
5. WAVE
Wave – is a disturbance ofmatter of medium, spreading in
this medium and carrying
energy
WAVEFRONT - is the locus (a line, or, in
a wave propagating in 3 dimensions,
a surface) of points having the same
phase of oscillations.
6. According the wavefront waves can be:
sphericalplane
7. According to medium particles oscillation direction, waves can be:
•transversal – particles of medium oscillate perpendiculary to thedirection of wave spreading (electromagnetic waves, waves on the
surface between two mediums);
•longitudinal – particles of medium oscillate along the direction of
spreading of wave (sound waves);
8. RESONANCE
Resonance (fr. resonance, from lat. resono - respond)- phenomenon of a sharp increase of the amplitude
of forced oscillations, which occurs when the
frequency of driving force coincides with the
frequency of forced
oscillations (resonance frequency).
9.
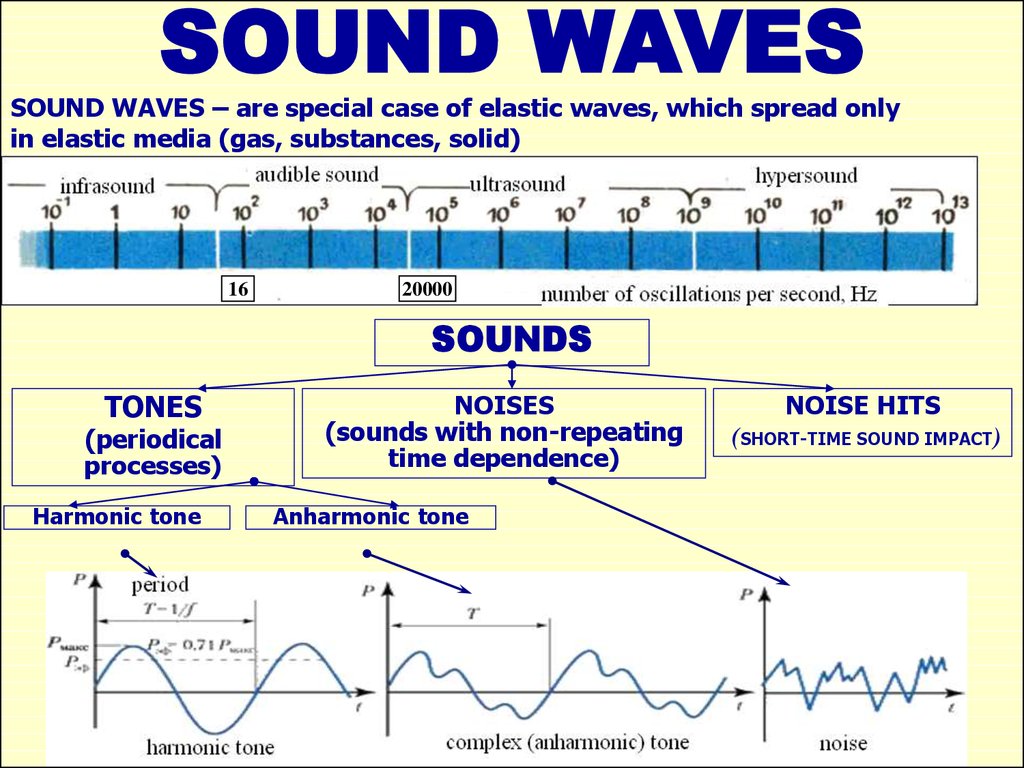
SOUND WAVESSOUND WAVES – are special case of elastic waves, which spread only
in elastic media (gas, substances, solid)
16
20000
SOUNDS
TONES
(periodical
processes)
Harmonic tone
NOISES
(sounds with non-repeating
time dependence)
Anharmonic tone
NOISE HITS
(SHORT-TIME SOUND IMPACT)
10.
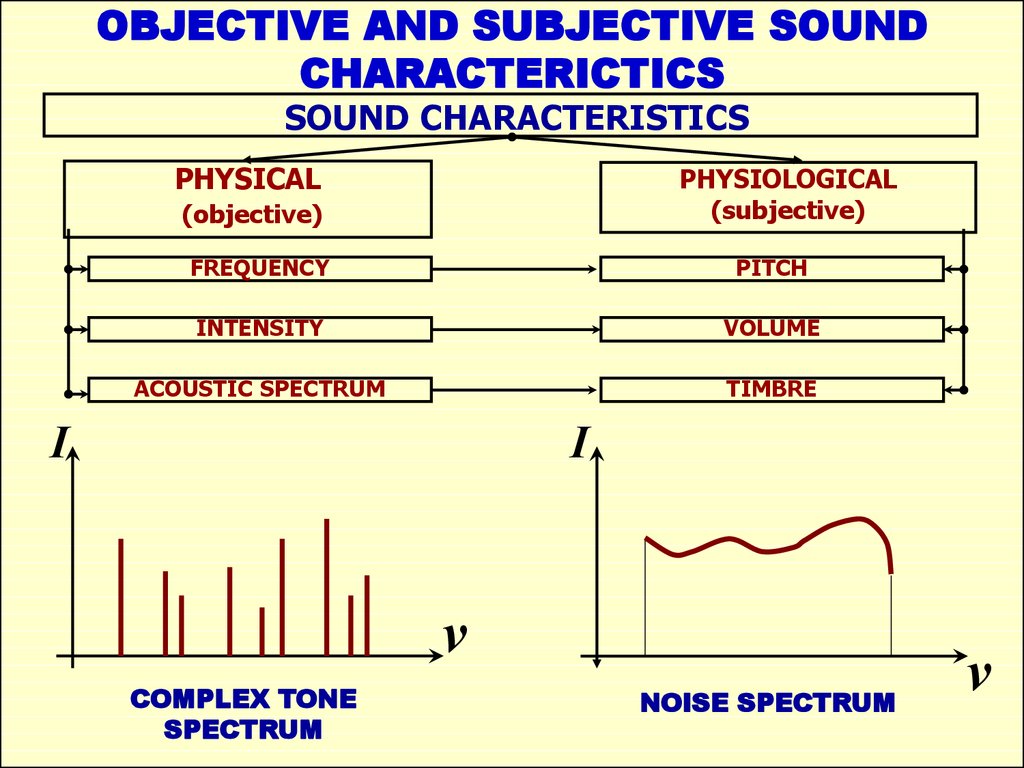
OBJECTIVE AND SUBJECTIVE SOUNDCHARACTERICTICS
SOUND CHARACTERISTICS
PHYSICAL
PHYSIOLOGICAL
(subjective)
(objective)
FREQUENCY
PITCH
INTENSITY
VOLUME
ACOUSTIC SPECTRUM
TIMBRE
І
І
ν
COMPLEX TONE
SPECTRUM
NOISE SPECTRUM
ν
11.
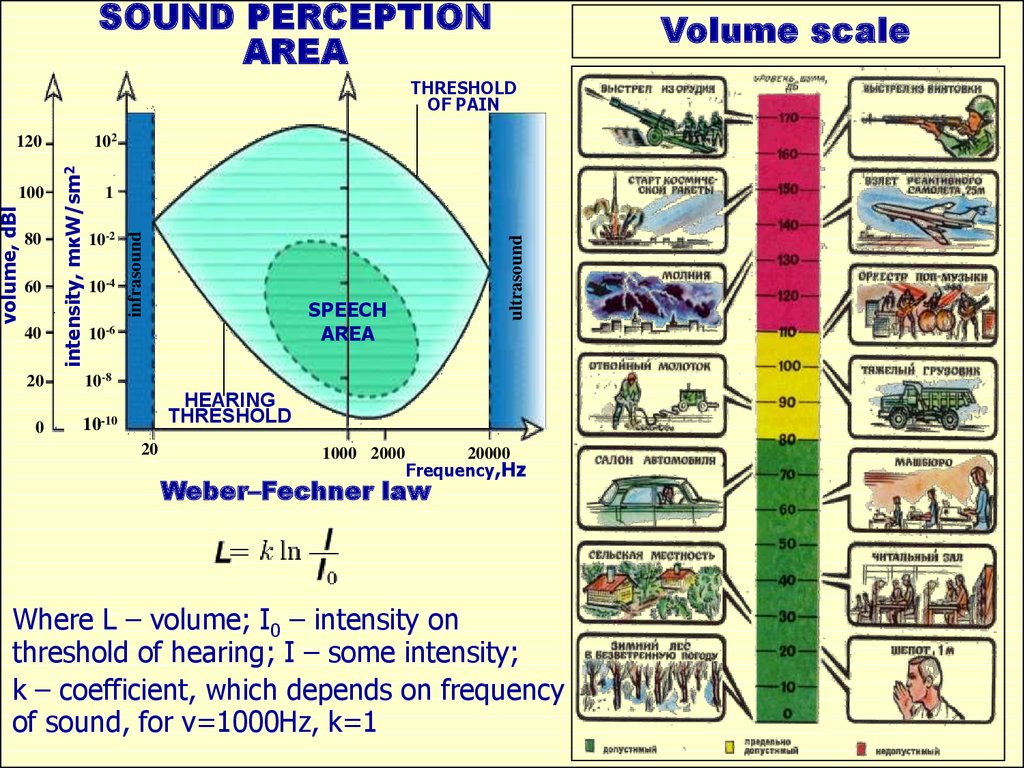
SOUND PERCEPTIONAREA
Volume scale
THRESHOLD
OF PAIN
102
60
40
10-2
10-4
SPEECH
AREA
10-6
20
10-8
0
10-10
ultrasound
80
1
infrasound
volume, dBl
100
intensity, mкW/sm2
120
HEARING
THRESHOLD
20
1000 2000
20000
Frequency,Hz
Weber–Fechner law
Where L – volume; I0 – іntensity on
threshold of hearing; I – some intensity;
k – coefficient, which depends on frequency
of sound, for ν=1000Hz, k=1
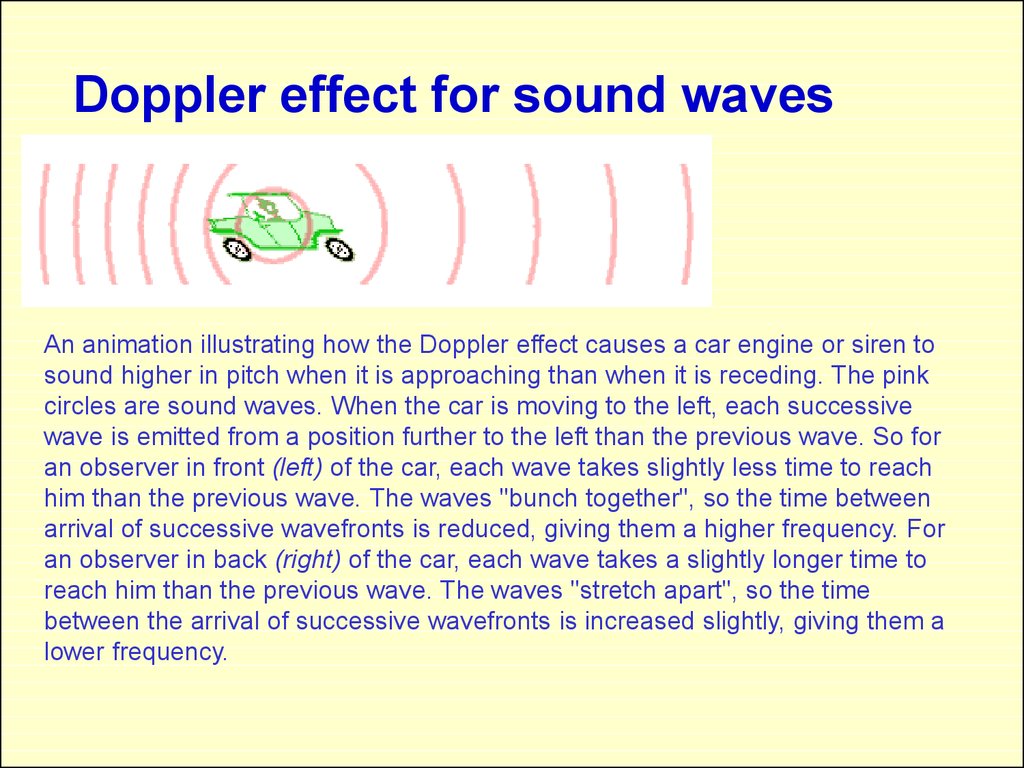
12. Doppler effect for sound waves
The Doppler effect (or Doppler shift), named after Austrian physicist Christian Doppler whoproposed it in 1842 in Prague, is the change in frequency of a wave for an observer moving
relative to the source of the wave. It is commonly heard when a vehicle sounding a siren or
horn approaches, passes, and recedes from an observer. The received frequency is higher
(compared to the emitted frequency) during the approach, it is identical at the instant of
passing by, and it is lower during the recession.
u – velocity of receiver relative to the medium (positive, if it moves
towards the source). ω0 – frequency the source releases the waves,
c – velocity of waves spreading in medium, v – velocity of source of
waves relative to medium (positive, if source moves towards the
receiver, negative if moves away from receiver).
13.
Doppler effect for sound wavesAn animation illustrating how the Doppler effect causes a car engine or siren to
sound higher in pitch when it is approaching than when it is receding. The pink
circles are sound waves. When the car is moving to the left, each successive
wave is emitted from a position further to the left than the previous wave. So for
an observer in front (left) of the car, each wave takes slightly less time to reach
him than the previous wave. The waves "bunch together", so the time between
arrival of successive wavefronts is reduced, giving them a higher frequency. For
an observer in back (right) of the car, each wave takes a slightly longer time to
reach him than the previous wave. The waves "stretch apart", so the time
between the arrival of successive wavefronts is increased slightly, giving them a
lower frequency.
14.
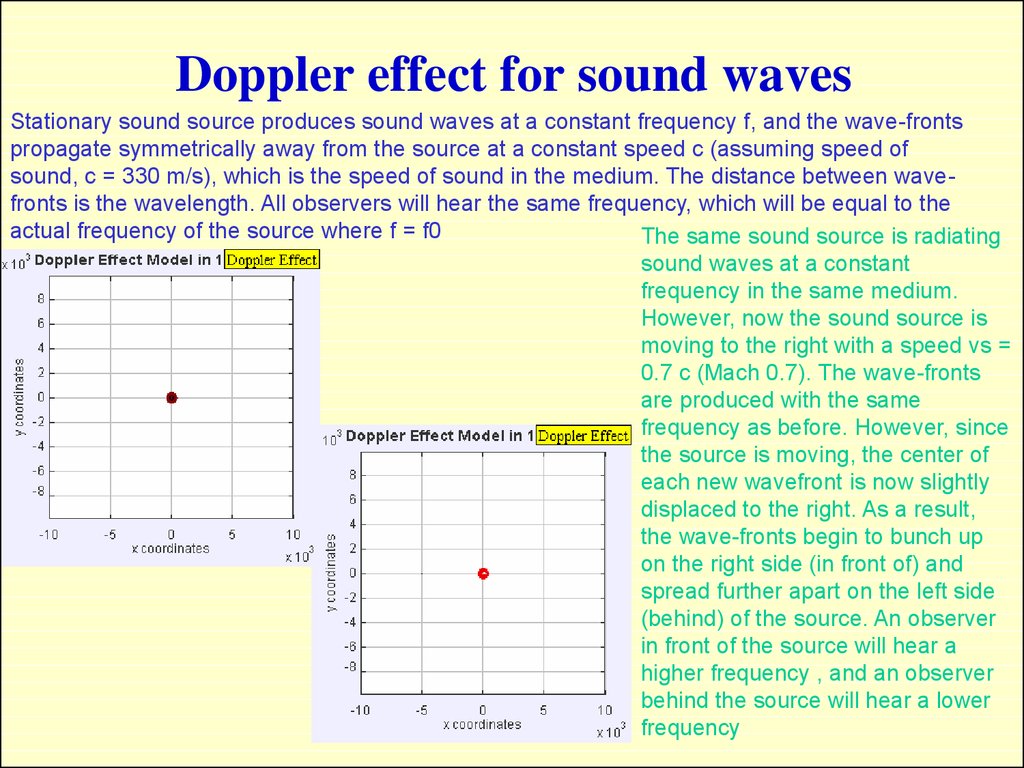
Doppler effect for sound wavesStationary sound source produces sound waves at a constant frequency f, and the wave-fronts
propagate symmetrically away from the source at a constant speed c (assuming speed of
sound, c = 330 m/s), which is the speed of sound in the medium. The distance between wavefronts is the wavelength. All observers will hear the same frequency, which will be equal to the
actual frequency of the source where f = f0
The same sound source is radiating
sound waves at a constant
frequency in the same medium.
However, now the sound source is
moving to the right with a speed vs =
0.7 c (Mach 0.7). The wave-fronts
are produced with the same
frequency as before. However, since
the source is moving, the center of
each new wavefront is now slightly
displaced to the right. As a result,
the wave-fronts begin to bunch up
on the right side (in front of) and
spread further apart on the left side
(behind) of the source. An observer
in front of the source will hear a
higher frequency , and an observer
behind the source will hear a lower
frequency
15.
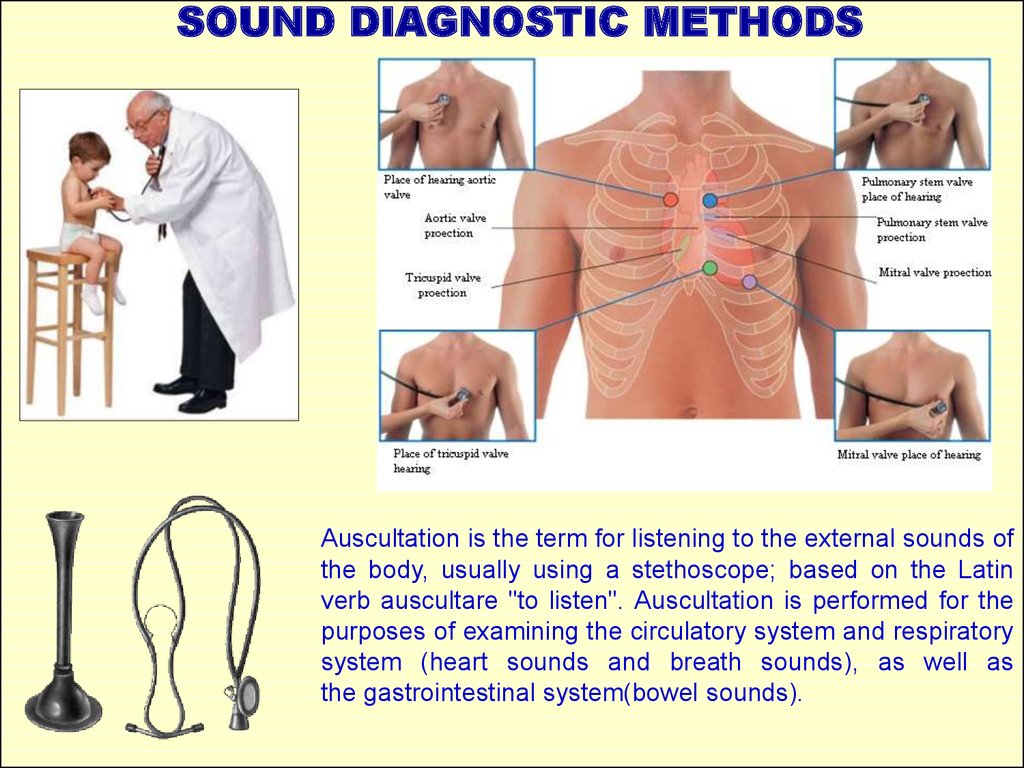
SOUND DIAGNOSTIC METHODSAuscultation is the term for listening to the external sounds of
the body, usually using a stethoscope; based on the Latin
verb auscultare "to listen". Auscultation is performed for the
purposes of examining the circulatory system and respiratory
system (heart sounds and breath sounds), as well as
the gastrointestinal system(bowel sounds).
16.
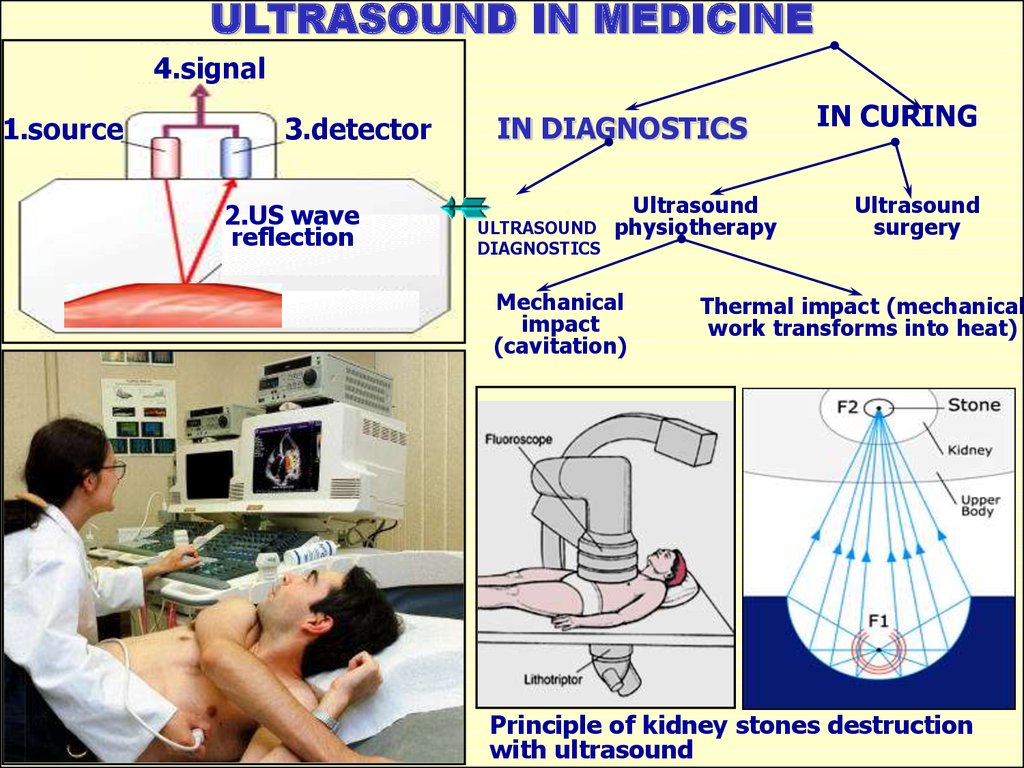
ULTRASOUND IN MEDICINE4.signal
1.source
УЗИ
3.detector
2.US wave
reflection
IN DIAGNOSTICS
ULTRASOUND
DIAGNOSTICS
Ultrasound
physiotherapy
Mechanical
impact
(cavitation)
IN CURING
Ultrasound
surgery
Thermal impact (mechanical
work transforms into heat)
Principle of kidney stones destruction
with ultrasound
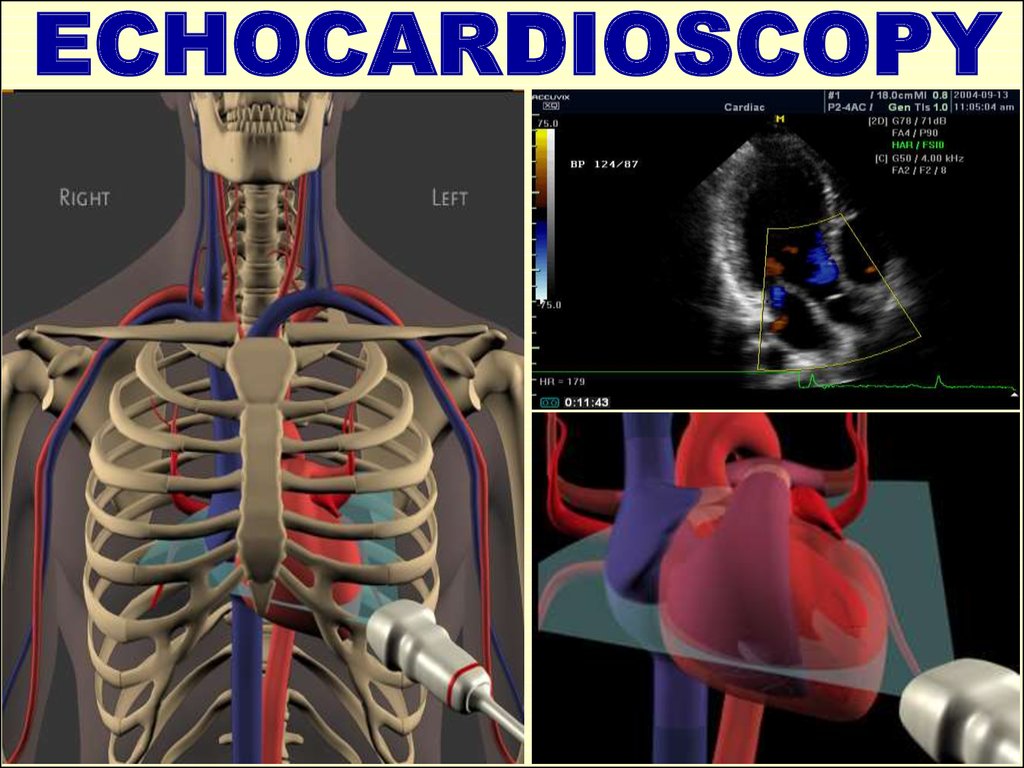
17. ULTRASOUND IMAGING
Ultrasound imaging (syn: USD, echography, ultrasonography) —diagnostics method which gives the possibility to obtain the image
of patient’s inner structures. This method is based on sound waves
with frequency above the human range of hearing application.
Modern USI apparatus
Ultrasound transducer
18. US scanning modes
A-mode or “Amplitude mode” - A single transducer scans a linethrough the body with the echoes plotted on screen as a function
of depth. Therapeutic ultrasound aimed at a specific tumor or
calculus is also A-mode, to allow for pinpoint accurate focus of
the destructive wave energy.
В-mode or “brightness mode” - In B-mode ultrasound, a linear array
of transducers simultaneously scans a plane through the body that
can be viewed as a two-dimensional image on screen.
М-mode “motion mode” - M stands for motion. Ultrasound pulses are
emitted in quick succession - each time, either an A-mode or B-mode
image is taken. Over time, this is analogous to recording a video in
ultrasound. As the organ boundaries that produce reflections move
relative to the probe, this can be used to determine the velocity of
specific organ structures.
D –mode or “doppler mode" - this mode makes use of the Doppler
effect in measuring and visualizing blood flow
19. 3D USI
3D USI gives a three dimensional image. USI transducer getsa number of images of investigated area of a body. Computer
forms a 3d picture from these images.
3d image makes possible to examine the structures or
processes from different sides. It makes the diagnostics more
accurate and reliable.
3D USI of a fetus and a child born
4D USI
4D - four dimensions USI. The fourth dimension is time.
Modern technologies allow to reconstruct the 3d image in real
time regime so it looks like a movie.
20. Dopplerography
Spectral doppler common carotid arteryTranscranial doppler.
Color doppler mapping
The method is based on encoding the doppler shift of frequency
in colors. The method shows the flows of blood in large vessels
and in heart. Red color shows the flow going towards the
transducer? Blue color shows the flow going away from
transducer. Dark shades of these colors correspond to low
speed, light shades - high. Disadvantages: unable to obtain an
image of small blood vessels with a small velocity of blood
flow. Advantages: Allows you to examine both morphological
state of vessels and blood flow rate.