
 Английский язык
 Образование
Похожие презентации:


Interpret Charts
1.
2.
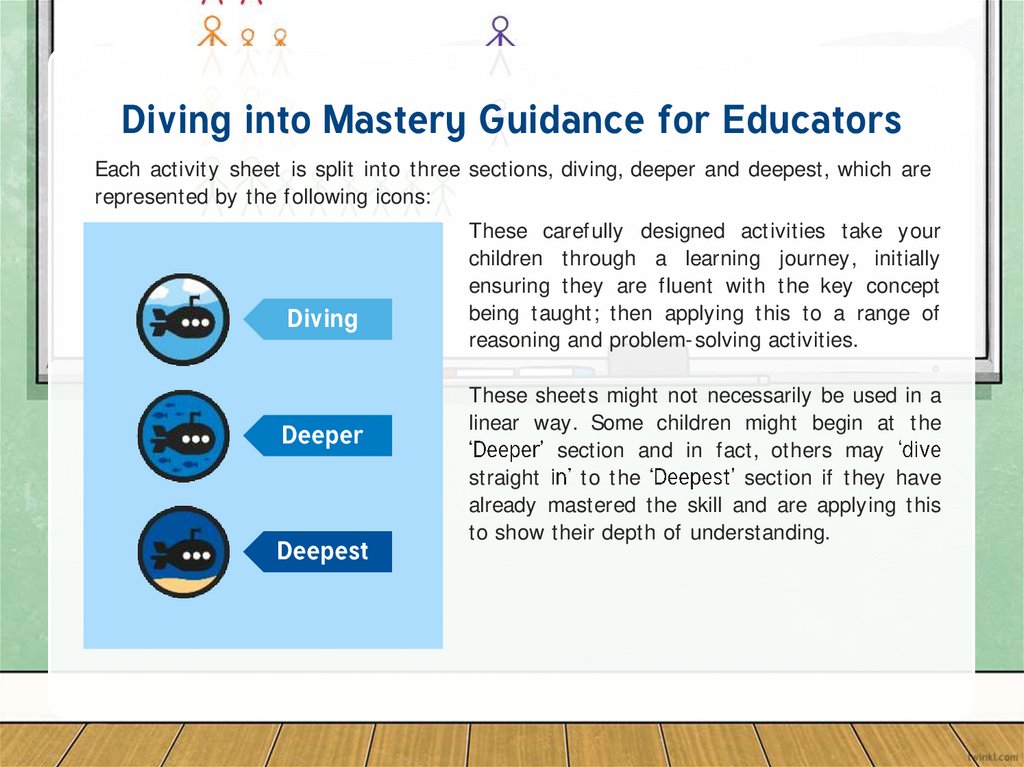
Diving into Mastery Guidance for EducatorsEach activity sheet is split into three sections, diving, deeper and deepest, which are
represented by the following icons:
Diving
Deeper
Deepest
These carefully designed activities take your
children through a learning journey, initially
ensuring they are fluent with the key concept
being taught; then applying this to a range of
reasoning and problem-solving activities.
These sheets might not necessarily be used in a
linear way. Some children might begin at the
section and in fact, others may
straight
to the
section if they have
already mastered the skill and are applying this
to show their depth of understanding.
3.
National Curriculum Objective• Interpret and present discrete and continuous data using appropriate
graphical methods, including bar charts and time graphs.
4.
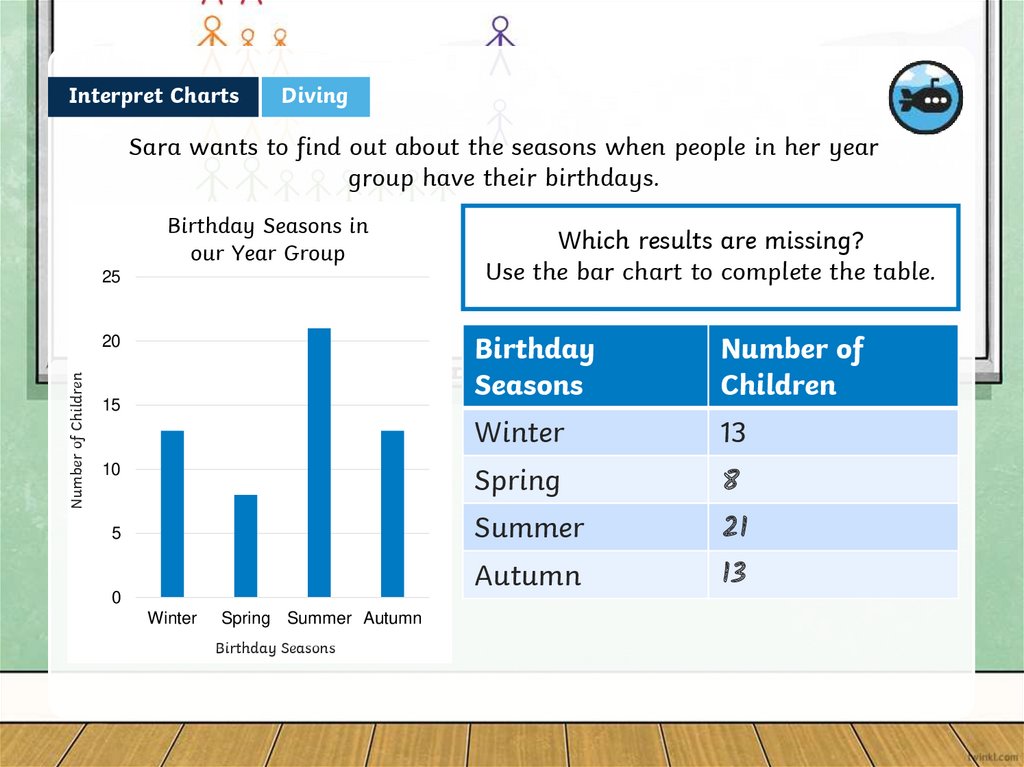
Interpret ChartsDiving
Sara wants to find out about the seasons when people in her year
group have their birthdays.
Birthday Seasons in
our Year Group
25
Number of Children
20
15
10
5
0
Winter
Spring Summer Autumn
Birthday Seasons
Which results are missing?
Use the bar chart to complete the table.
Birthday
Seasons
Number of
Children
Winter
13
Spring
8
Summer
21
Autumn
13
5.
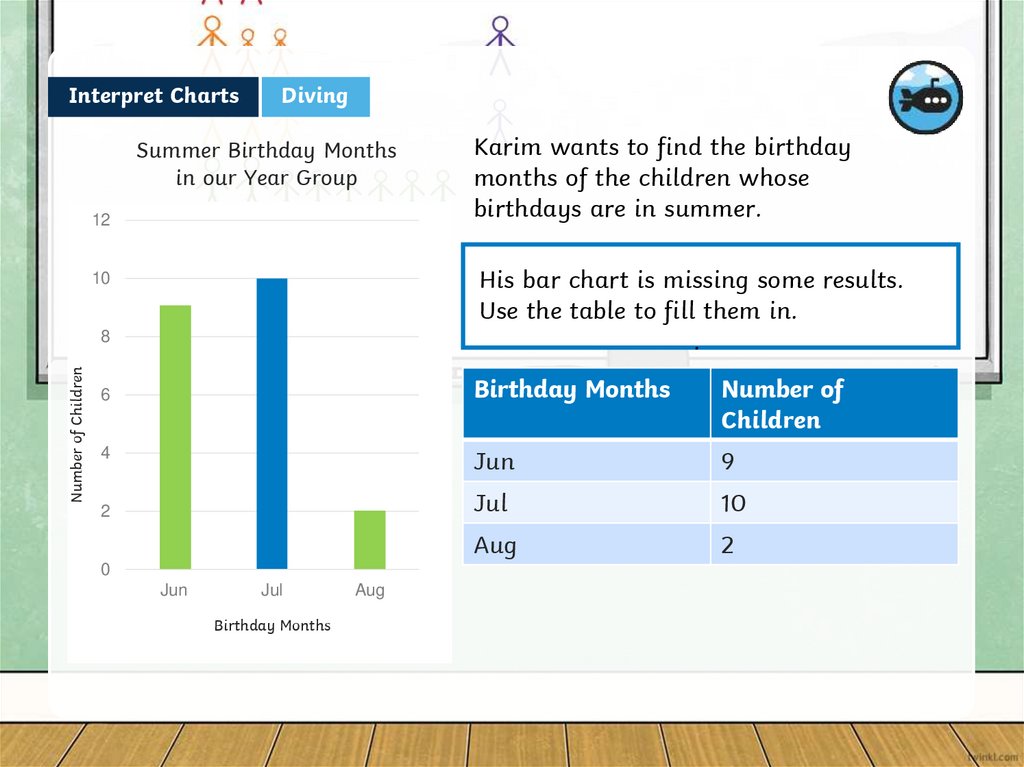
Interpret ChartsDiving
Summer Birthday Months
in our Year Group
12
His bar chart is missing some results.
Use the table to fill them in.
.
10
8
Number of Children
Karim wants to find the birthday
months of the children whose
birthdays are in summer.
6
Birthday Months
Number of
Children
4
Jun
9
Jul
10
Aug
2
2
0
Jun
Jul
Birthday Months
Aug
6.
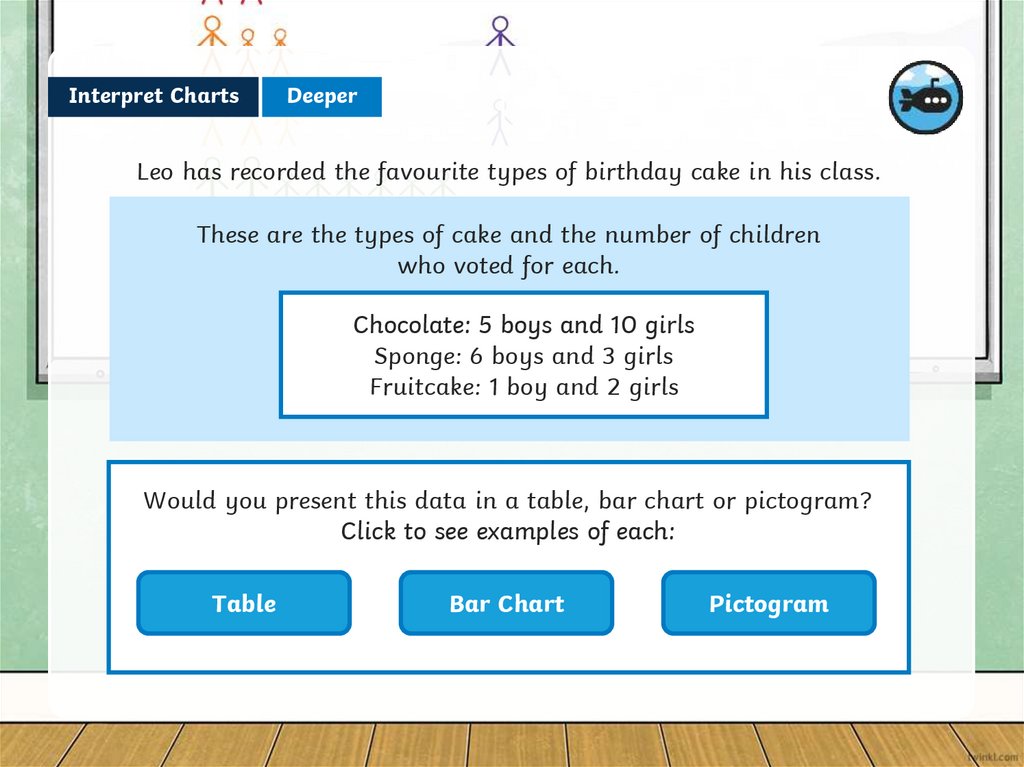
Interpret ChartsDeeper
Leo has recorded the favourite types of birthday cake in his class.
These are the types of cake and the number of children
who voted for each.
Chocolate: 5 boys and 10 girls
Sponge: 6 boys and 3 girls
Fruitcake: 1 boy and 2 girls
Would you present this data in a table, bar chart or pictogram?
Click to see examples of each:
Table
Bar Chart
Pictogram
7.
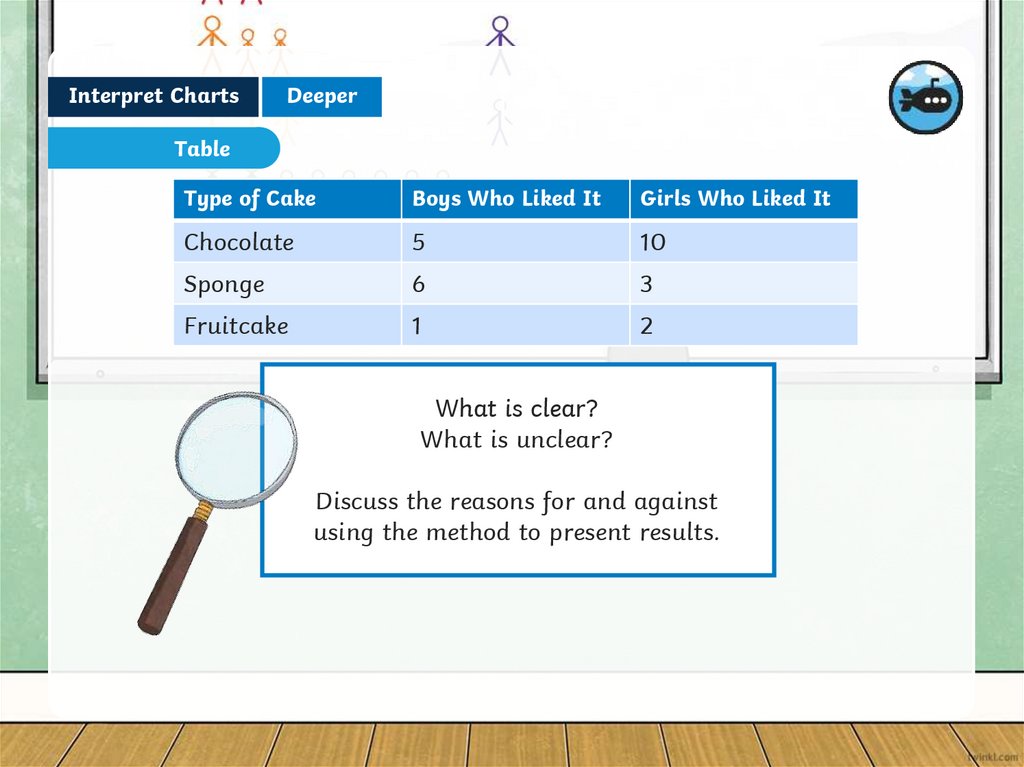
Interpret ChartsDeeper
Table
Type of Cake
Boys Who Liked It
Girls Who Liked It
Chocolate
5
10
Sponge
6
3
Fruitcake
1
2
What is clear?
What is unclear?
Discuss the reasons for and against
using the method to present results.
8.
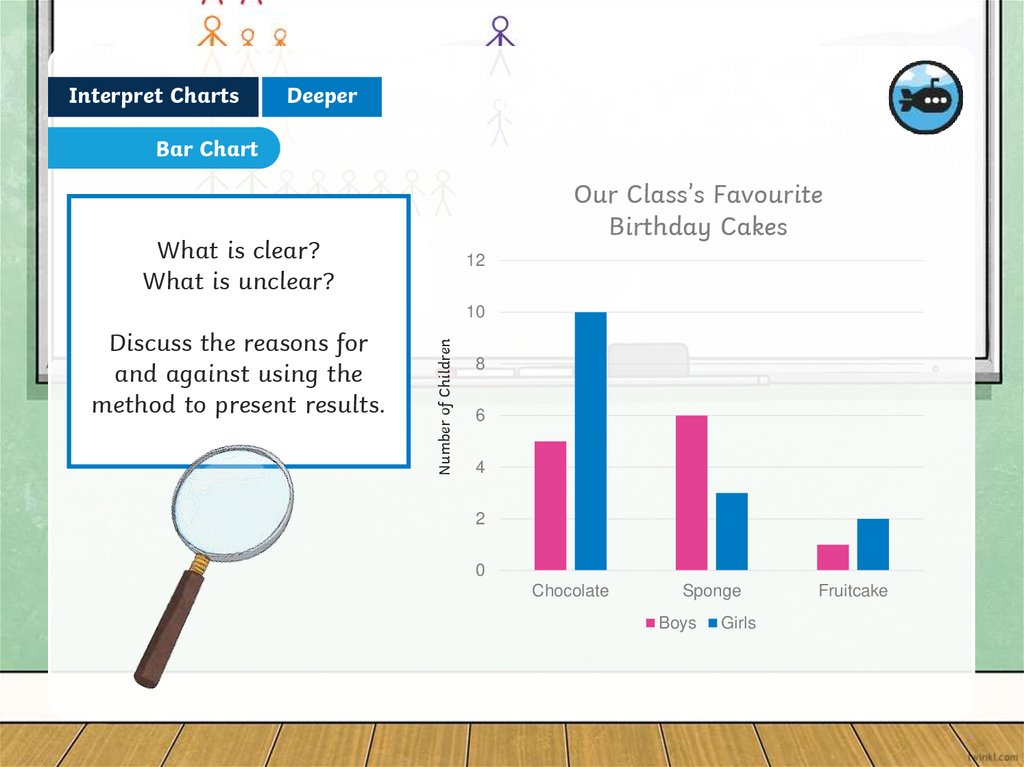
Interpret ChartsDeeper
Bar Chart
Our Class’s Favourite
Birthday Cakes
What is clear?
What is unclear?
12
Discuss the reasons for
and against using the
method to present results.
Number of Children
10
8
6
4
2
0
Chocolate
Sponge
Boys
Girls
Fruitcake
9.
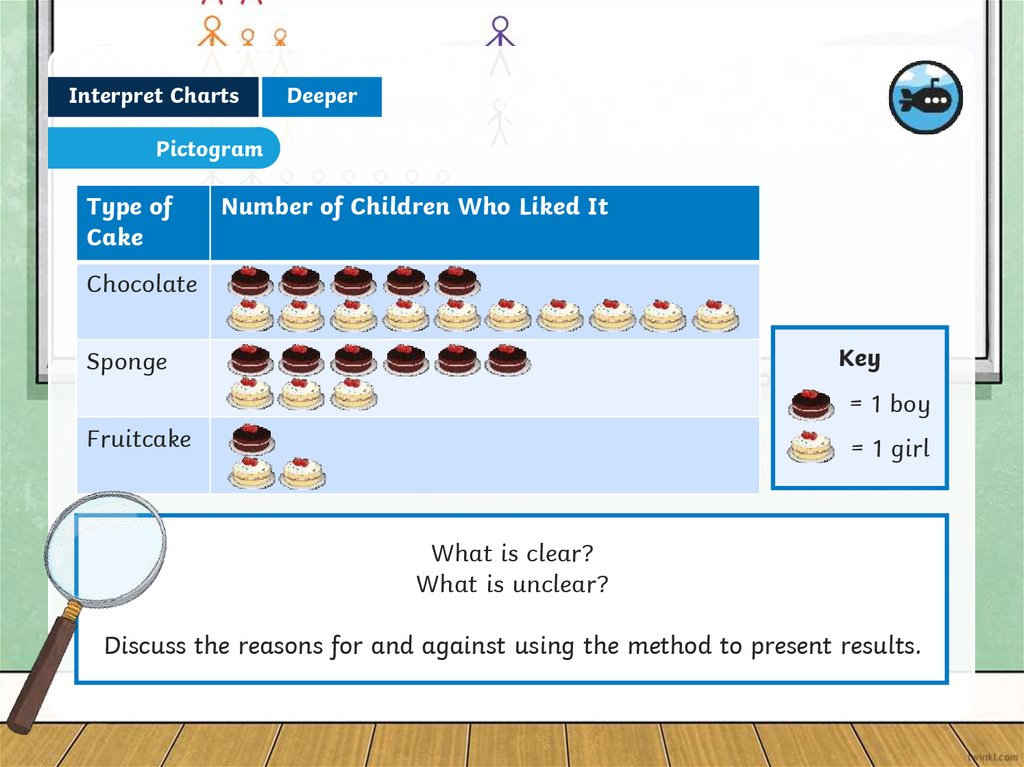
Interpret ChartsDeeper
Pictogram
Type of
Cake
Number of Children Who Liked It
Chocolate
Key
Sponge
= 1 boy
Fruitcake
= 1 girl
What is clear?
What is unclear?
Discuss the reasons for and against using the method to present results.
10.
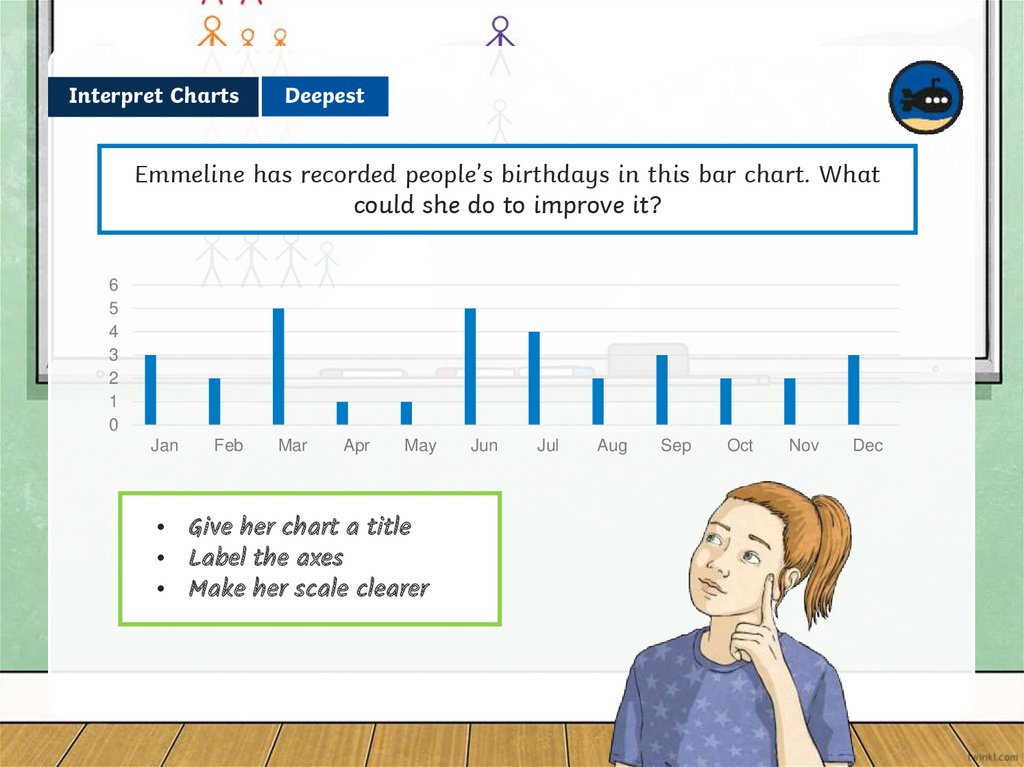
Interpret ChartsDeepest
Emmeline has recorded people’s birthdays in this bar chart. What
could she do to improve it?
6
5
4
3
2
1
0
Jan
Feb
Mar
Apr
May
• Give her chart a title
• Label the axes
• Make her scale clearer
Jun
Jul
Aug
Sep
Oct
Nov
Dec
11.
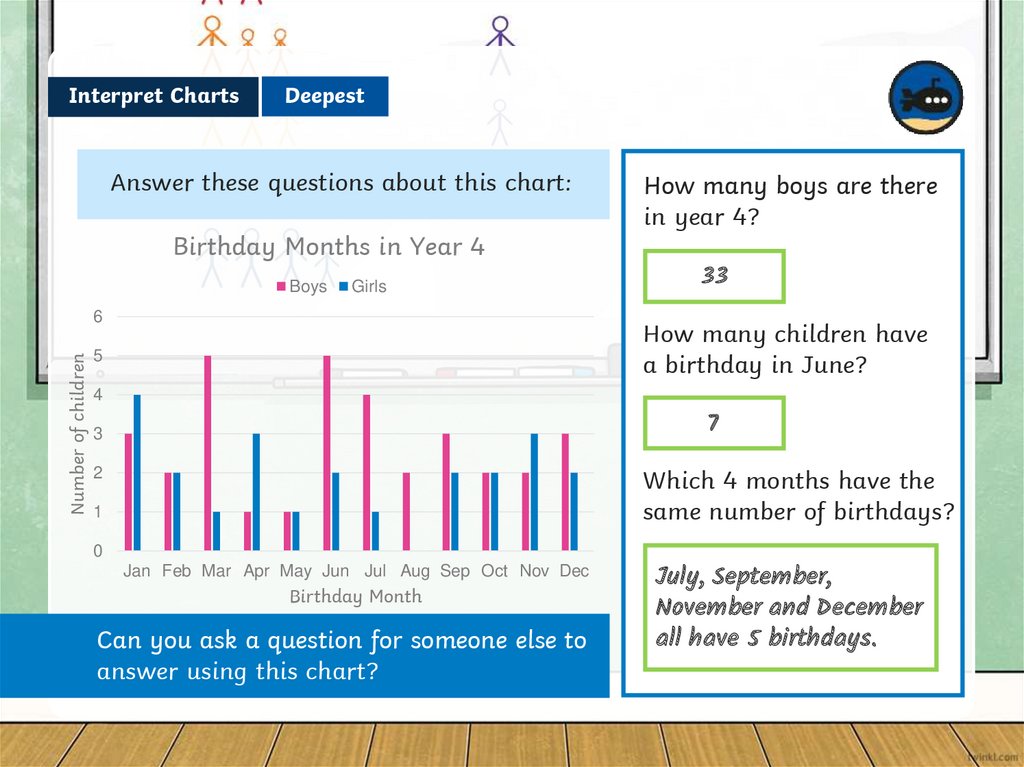
Interpret ChartsDeepest
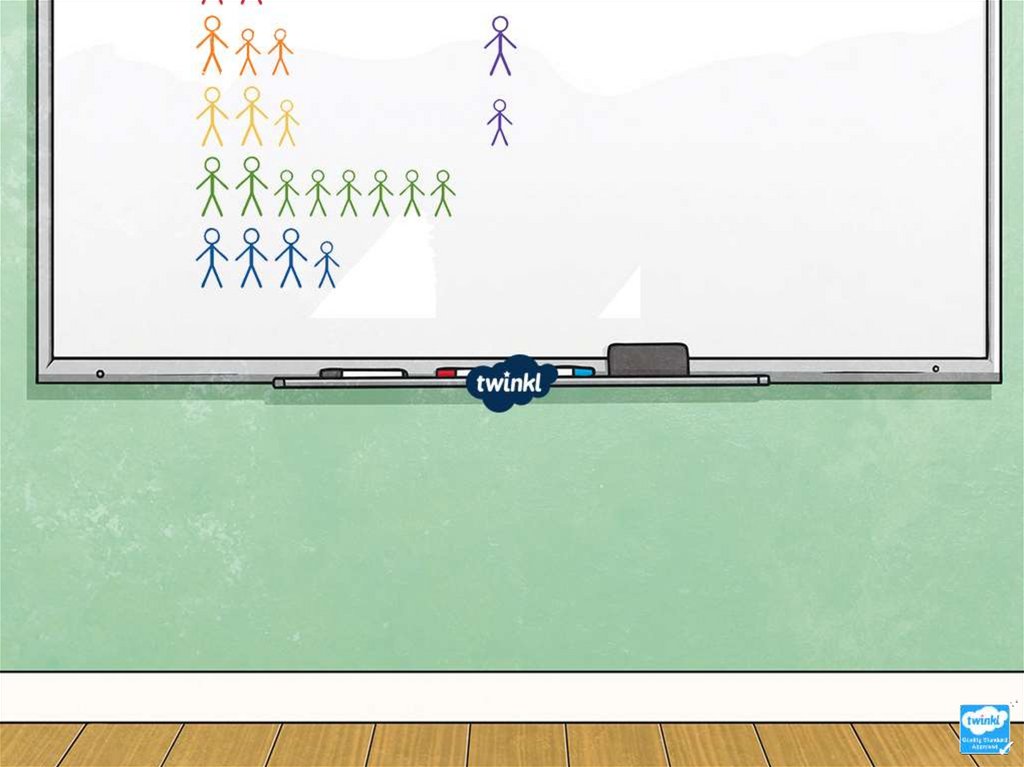
Answer these questions about this chart:
Birthday Months in Year 4
Boys
Girls
Number of children
6
How many boys are there
in year 4?
33
How many children have
a birthday in June?
5
4
7
3
Which 4 months have the
same number of birthdays?
2
1
0
Jan Feb Mar Apr May Jun Jul Aug Sep Oct Nov Dec
Birthday Month
Can you ask a question for someone else to
answer using this chart?
July, September,
November and December
all have 5 birthdays.
12.
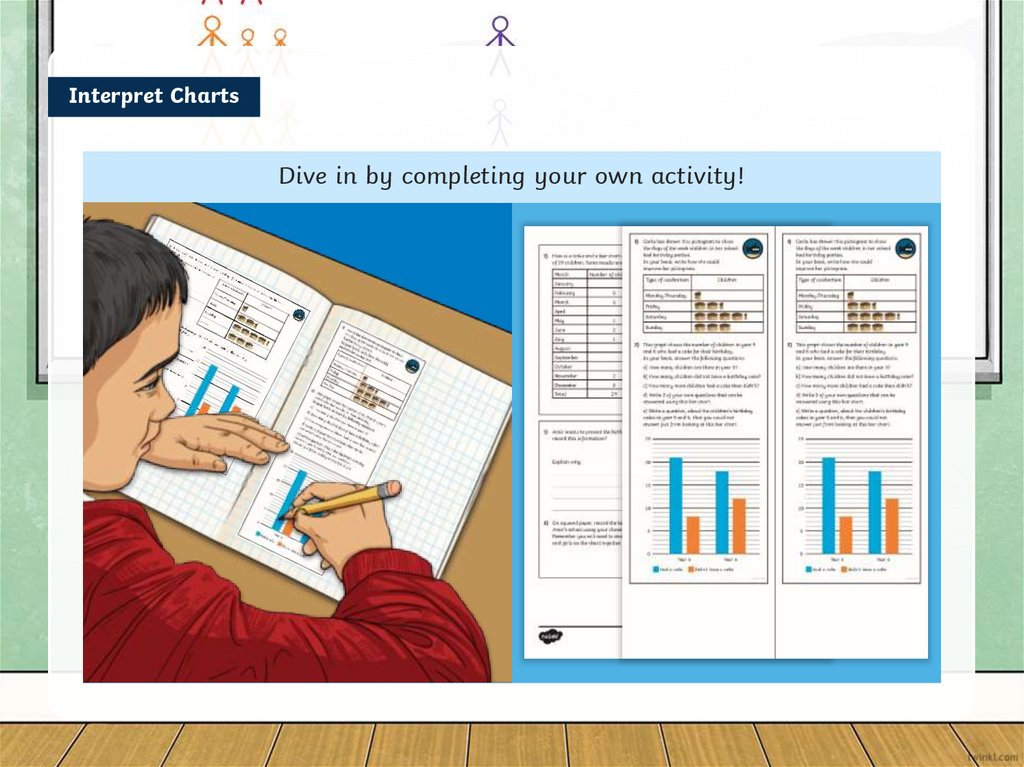
Interpret ChartsDive in by completing your own activity!
13.
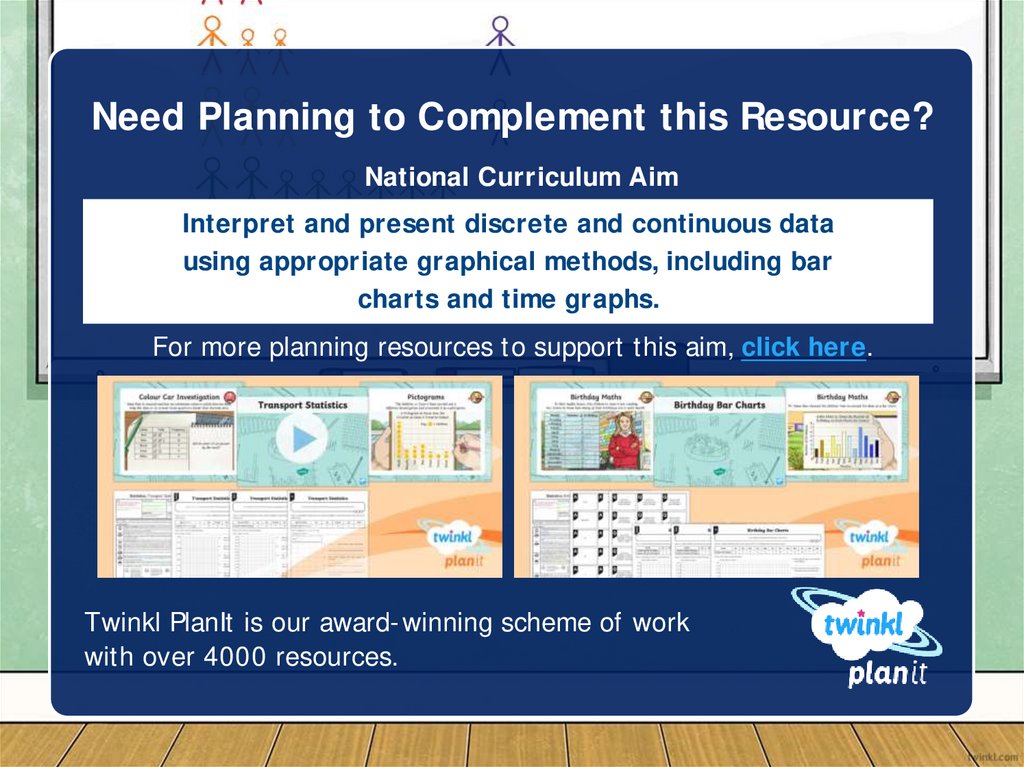
Need Planning to Complement this Resource?National Curriculum Aim
Interpret and present discrete and continuous data
using appropriate graphical methods, including bar
charts and time graphs.
For more planning resources to support this aim, click here.
Twinkl PlanIt is our award-winning scheme of work
with over 4000 resources.