
 История
Похожие презентации:


1995: An Important Inflection Point in Recent Geophysical History
1.
“1995: An ImportantInflection Point in
Recent Geophysical
History”
2.
• The paper builds upon previous research I have done linking changes in underwaterseismic activity and global temperatures
• In a 2016 paper titled The Correlation of Seismic Activity and recent Global warming, I
established the link between the seismic activity along the mid-ocean ridges and global
temperatures. Rationale: More earthquakes = more geothermal heat release.
• Well established in the literature that geothermal heating of ocean bottom intensifies the
thermohaline circulation.
• Net effect is to transport more heat into the Arctic. Transporting more heat into the Arctic
kicks off a sequence of events that amplify warming in the Arctic.
• That cascading of effects leads us to conclude that much of the recent warming is
caused by this thermohaline intensification.
• The sudden jump in temperatures occurred in 1997, 2 years after there was a
corresponding jump in mid ocean seismic activity.
• We tie in the 1995 jump in mid ocean seismic activity with a number of other geophysical
processes.
3.
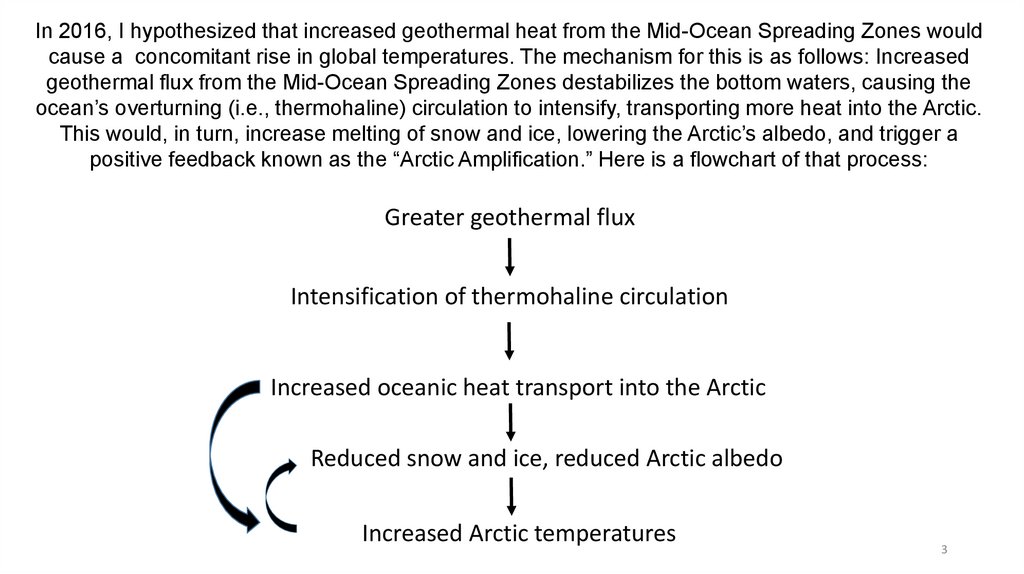
In 2016, I hypothesized that increased geothermal heat from the Mid-Ocean Spreading Zones wouldcause a concomitant rise in global temperatures. The mechanism for this is as follows: Increased
geothermal flux from the Mid-Ocean Spreading Zones destabilizes the bottom waters, causing the
ocean’s overturning (i.e., thermohaline) circulation to intensify, transporting more heat into the Arctic.
This would, in turn, increase melting of snow and ice, lowering the Arctic’s albedo, and trigger a
positive feedback known as the “Arctic Amplification.” Here is a flowchart of that process:
Greater geothermal flux
Intensification of thermohaline circulation
Increased oceanic heat transport into the Arctic
Reduced snow and ice, reduced Arctic albedo
Increased Arctic temperatures
3
4.
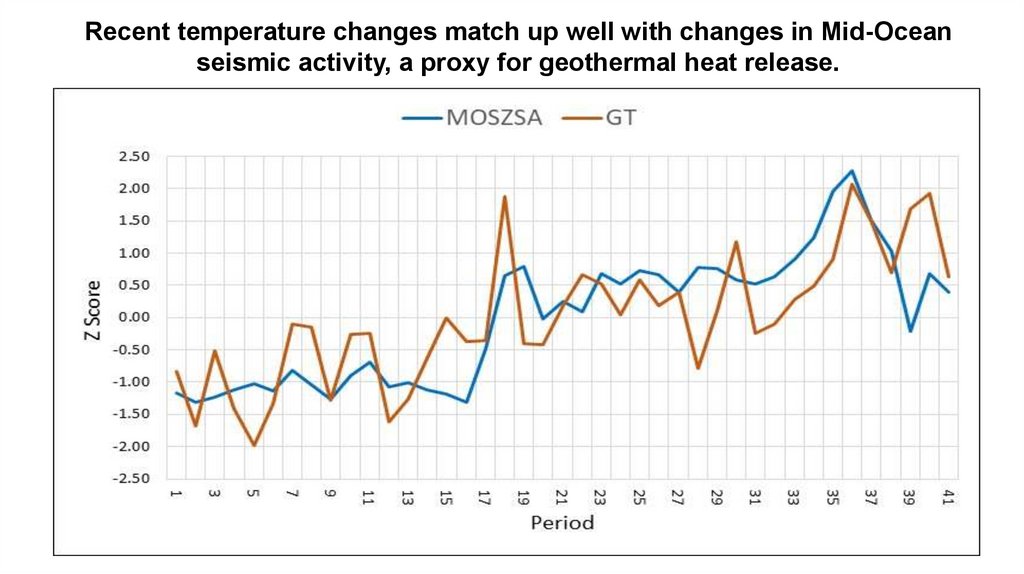
Recent temperature changes match up well with changes in Mid-Oceanseismic activity, a proxy for geothermal heat release.
5.
A review of the literature from a variety of geophysical specialties, to include seismology,marine geology, oceanography, climatology, glaciology, and geodesy, reveals that a
number of geophysical systems saw significant change commencing in 1995
6.
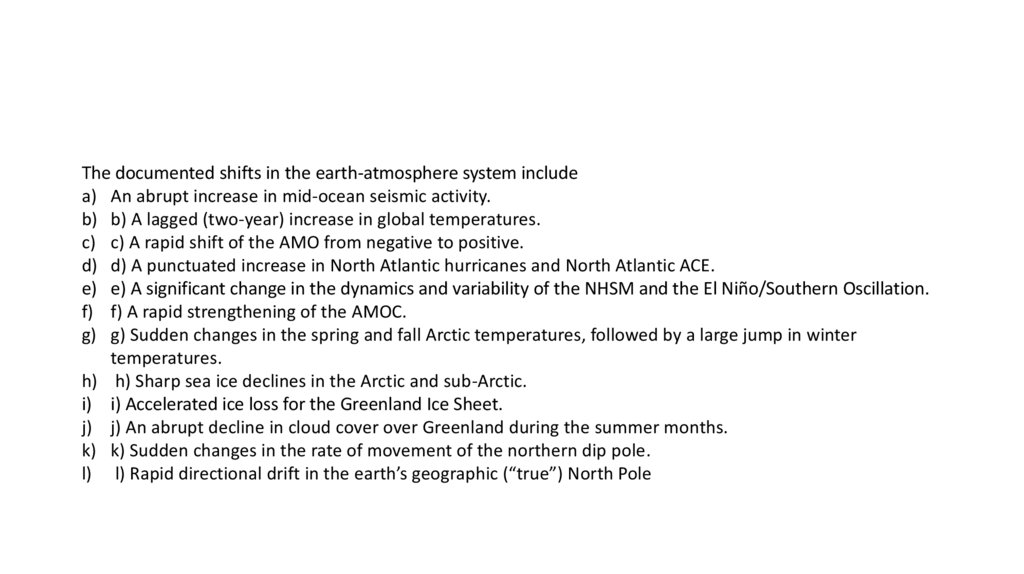
The documented shifts in the earth-atmosphere system includea) An abrupt increase in mid-ocean seismic activity.
b) b) A lagged (two-year) increase in global temperatures.
c) c) A rapid shift of the AMO from negative to positive.
d) d) A punctuated increase in North Atlantic hurricanes and North Atlantic ACE.
e) e) A significant change in the dynamics and variability of the NHSM and the El Niño/Southern Oscillation.
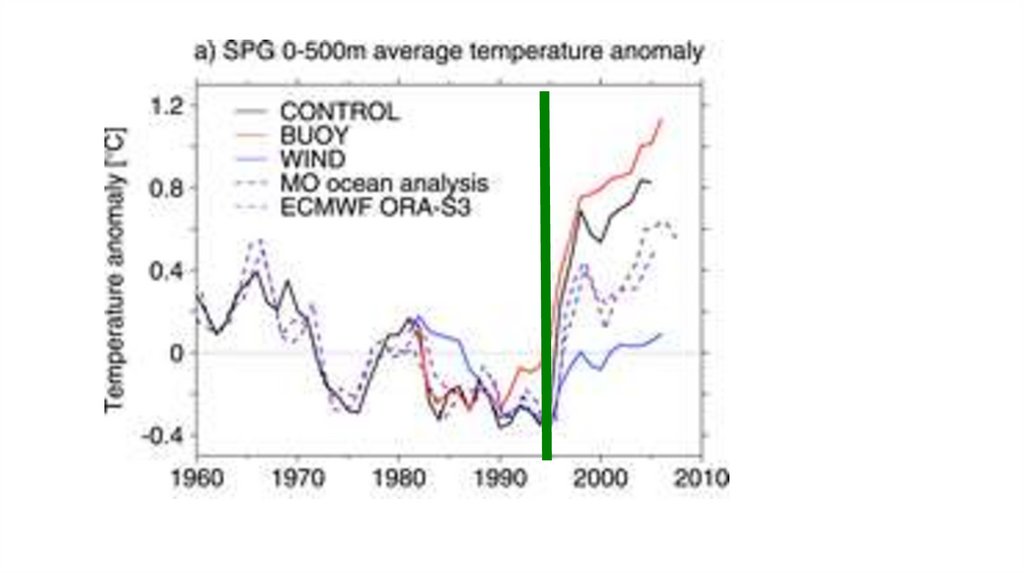
f) f) A rapid strengthening of the AMOC.
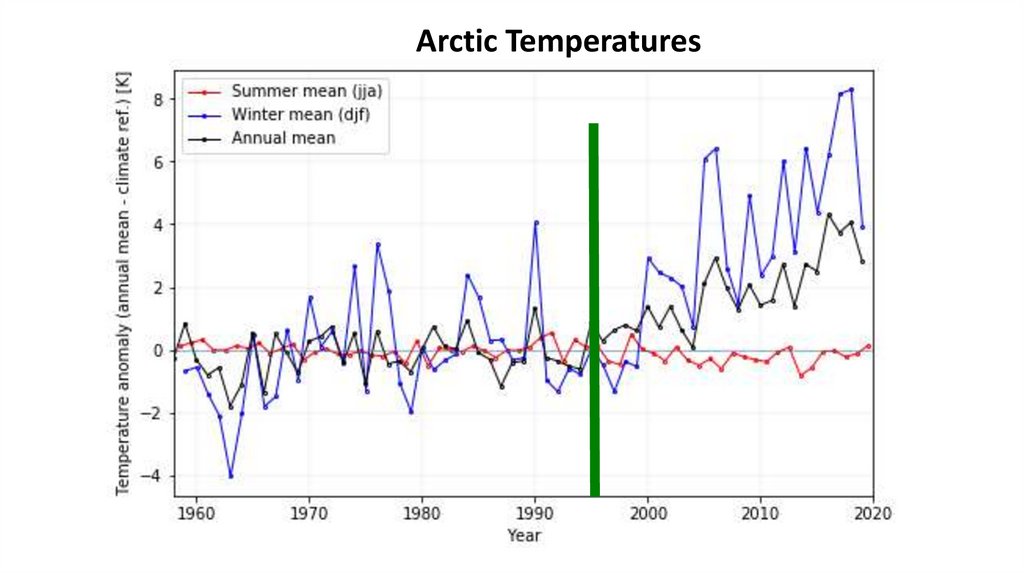
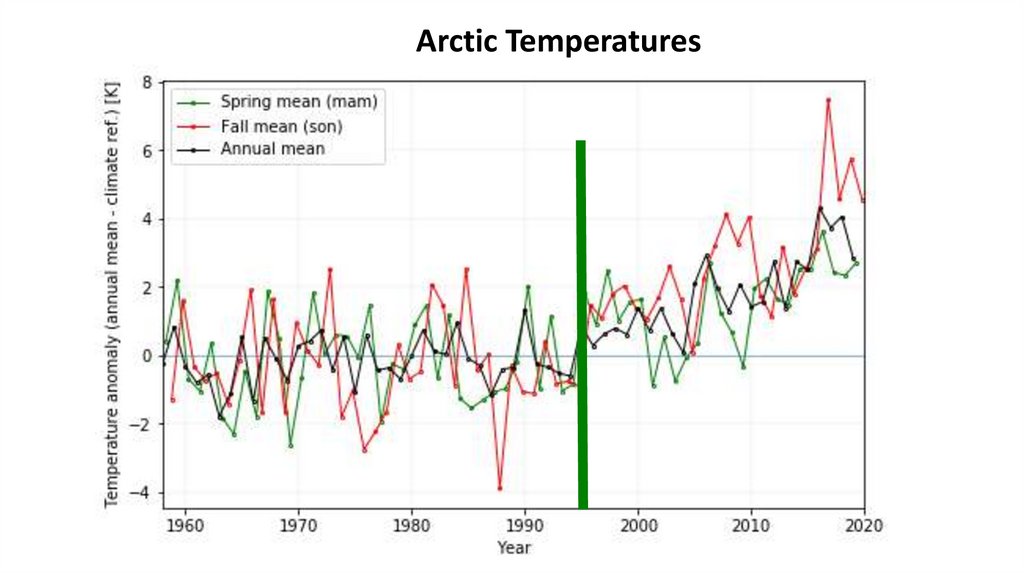
g) g) Sudden changes in the spring and fall Arctic temperatures, followed by a large jump in winter
temperatures.
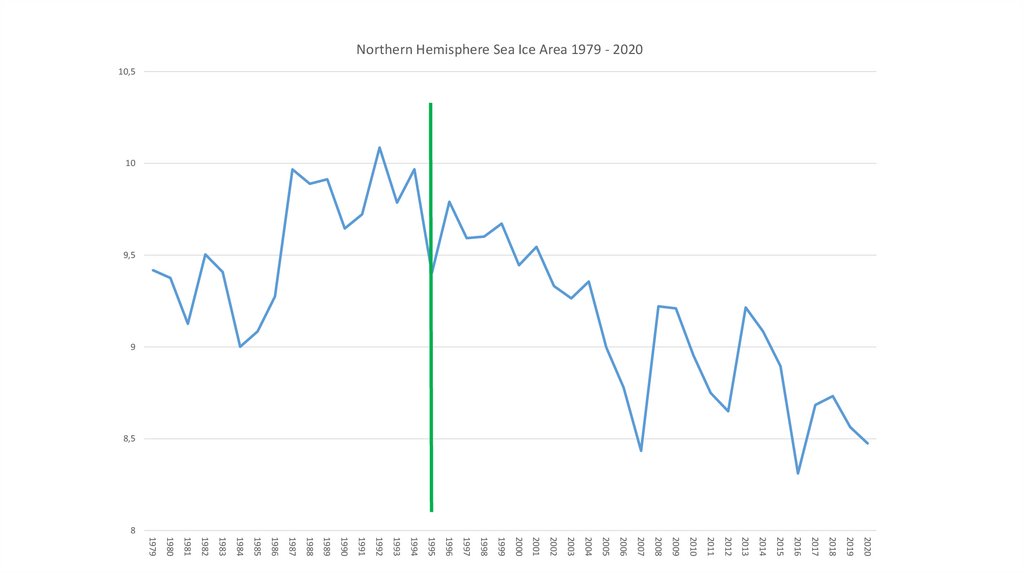
h) h) Sharp sea ice declines in the Arctic and sub-Arctic.
i) i) Accelerated ice loss for the Greenland Ice Sheet.
j) j) An abrupt decline in cloud cover over Greenland during the summer months.
k) k) Sudden changes in the rate of movement of the northern dip pole.
l) l) Rapid directional drift in the earth’s geographic (“true”) North Pole
7.
an increase in MOSZSA in 1995 was indicative of greater geothermal flux along theglobe’s mid-ocean spreading zones. This heightened flux intensified the thermohaline
circulation, resulting in ATL and a strengthening of the AMOC. This gave rise to higher
Arctic and North Atlantic SST. These higher SST were expressed as a shift of the
AMO from a negative to a positive phase, creating an environment that was conducive
to an increased frequency of North Atlantic hurricanes, a significant jump in ACE,
stronger monsoons, and amplified El Niño episodes. These changes initiated a
diminution of Arctic Sea ice, reduced cloud cover in the Greenland sector, and rising
Arctic temperatures in the fall, spring and winter seasons.
8.
AMO Index0,4
0,3
0,2
0,1
0
-0,1
-0,2
-0,3
-0,4
2018
2017
2016
2015
2014
2013
2012
2011
2010
2009
2008
2007
2006
2005
2004
2003
2002
2001
2000
1999
1998
1997
1996
1995
1994
1993
1992
1991
1990
1989
1988
1987
1986
1985
1984
1983
1982
1981
1980
1979
9.
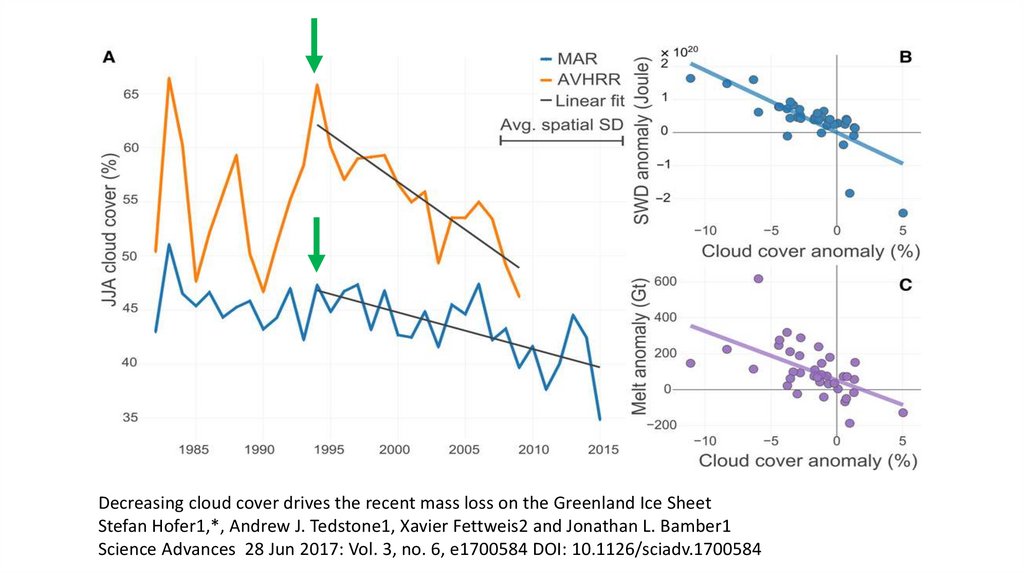
Decreasing cloud cover drives the recent mass loss on the Greenland Ice SheetStefan Hofer1,*, Andrew J. Tedstone1, Xavier Fettweis2 and Jonathan L. Bamber1
Science Advances 28 Jun 2017: Vol. 3, no. 6, e1700584 DOI: 10.1126/sciadv.1700584
10.
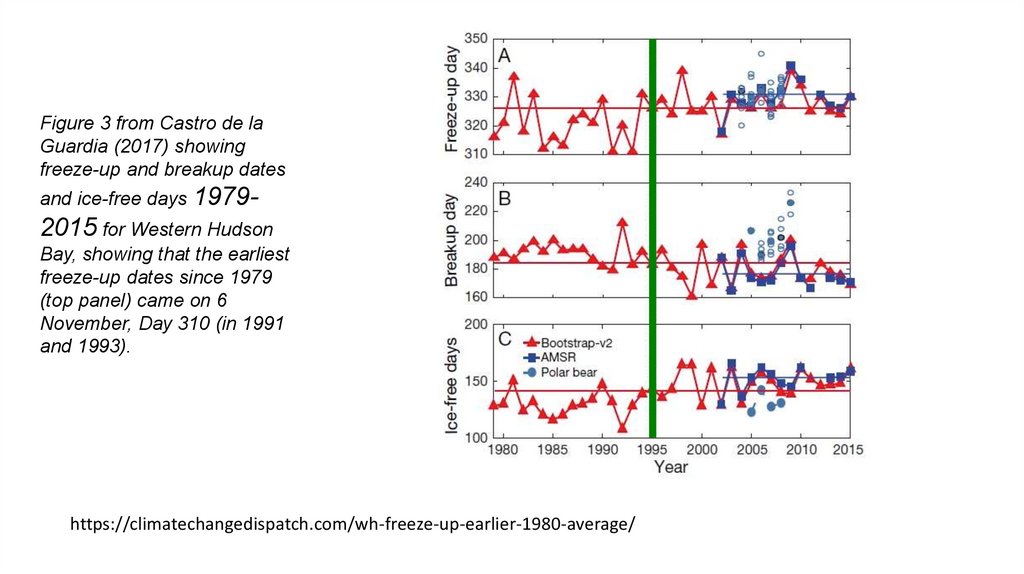
Figure 3 from Castro de laGuardia (2017) showing
freeze-up and breakup dates
and ice-free days 1979-
2015 for Western Hudson
Bay, showing that the earliest
freeze-up dates since 1979
(top panel) came on 6
November, Day 310 (in 1991
and 1993).
https://climatechangedispatch.com/wh-freeze-up-earlier-1980-average/
11.
12.
Arctic Temperatures13.
Arctic Temperatures14.
Northern Hemisphere Sea Ice Area 1979 - 202010,5
10
9,5
9
8,5
8
2020
2019
2018
2017
2016
2015
2014
2013
2012
2011
2010
2009
2008
2007
2006
2005
2004
2003
2002
2001
2000
1999
1998
1997
1996
1995
1994
1993
1992
1991
1990
1989
1988
1987
1986
1985
1984
1983
1982
1981
1980
1979
15.
We must• Continue to verify the linkages between mid ocean seismic activity and global temps
• Build more data on ocean temps at depth (ARGO)
• Begin to establish numericalrelationships between mid ocean activity and
• Thermohaline strength
• Snow and ice dynamics
• Monsoon and El Nino dynamics
• Hurricane frequencies and strengths
• Cloud cover, particularly in the Arctic\
Continue to monitor CO@ levels and do head to head comparisons between all of these
drivers.