


")


")


")


Похожие презентации:


")


Volcanism generated ocean heat waves and biodiversity
1.
Volcanism generatedocean heat waves and
biodiversity
Wyss Yim
Association for Geoconservation, Hong Kong /
Department of Earth Sciences, The University of Hong Kong
Acknowledgements – NOAA, NASA and Wikipedia. This research is a contribution to the Volcanic Impacts on Climate
and Society (VICS) Working Group of the Past Global Changes Project.
Presentation to the Creative Society on April 30th, 2022
2.
PlanBackground information
Four regional examples of ocean heat waves studied –
2012 North Atlantic Blob
2013-2016 North Pacific Blob
2018-2019 Southwest Indian Ocean Blob
2019-2020 South Pacific Blob
Conclusions
3.
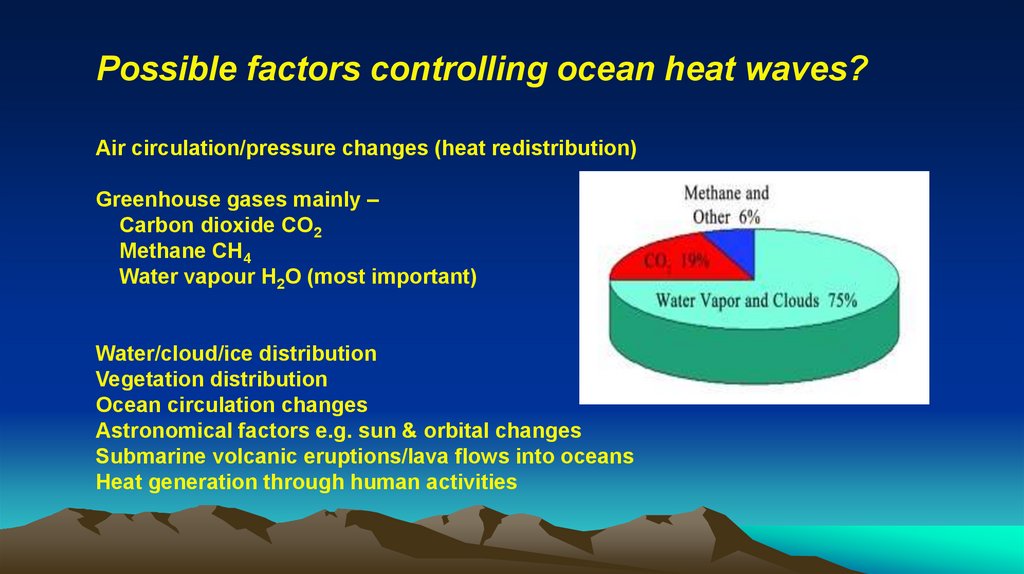
Possible factors controlling ocean heat waves?Air circulation/pressure changes (heat redistribution)
Greenhouse gases mainly –
Carbon dioxide CO2
Methane CH4
Water vapour H2O (most important)
Water/cloud/ice distribution
Vegetation distribution
Ocean circulation changes
Astronomical factors e.g. sun & orbital changes
Submarine volcanic eruptions/lava flows into oceans
Heat generation through human activities
4. What is the order of importance?
1st orderAstronomical forcing and the Sun e.g. glacial/interglacial cycles, solar cycles,
monsoons and seasons
2nd order
Volcanism generated geothermal heat/plate climatology
www.plateclimatology.com
How geological forces affect the hydrosphere and atmosphere including
terrestrial and submarine volcanic eruptions, their associated circulation
changes and the release of gases
3rd order
Human-induced changes including urbanization, water cycle changes and
emissions of greenhouse gases
5.
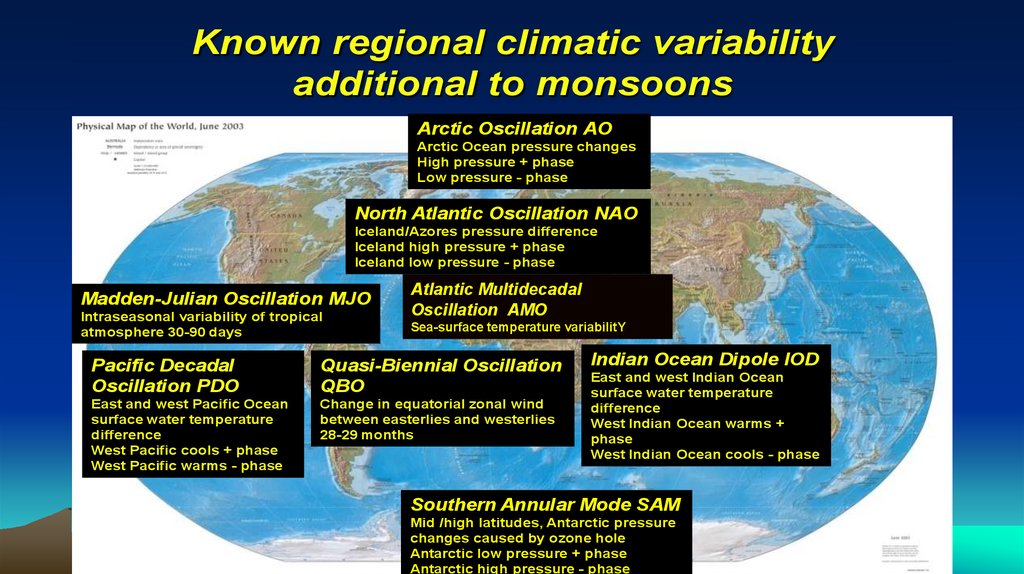
Known regional climatic variabilityadditional to monsoons
Arctic Oscillation AO
Arctic Ocean pressure changes
High pressure + phase
Low pressure - phase
North Atlantic Oscillation NAO
Iceland/Azores pressure difference
Iceland high pressure + phase
Iceland low pressure - phase
Madden-Julian Oscillation MJO
Intraseasonal variability of tropical
atmosphere 30-90 days
Atlantic Multidecadal
Oscillation AMO
Sea-surface temperature variabilitY
Pacific Decadal
Oscillation PDO
Quasi-Biennial Oscillation
QBO
East and west Pacific Ocean
surface water temperature
difference
West Pacific cools + phase
West Pacific warms - phase
Change in equatorial zonal wind
between easterlies and westerlies
28-29 months
Indian Ocean Dipole IOD
East and west Indian Ocean
surface water temperature
difference
West Indian Ocean warms +
phase
West Indian Ocean cools - phase
Southern Annular Mode SAM
Mid /high latitudes, Antarctic pressure
changes caused by ozone hole
Antarctic low pressure + phase
Antarctic high pressure - phase
6.
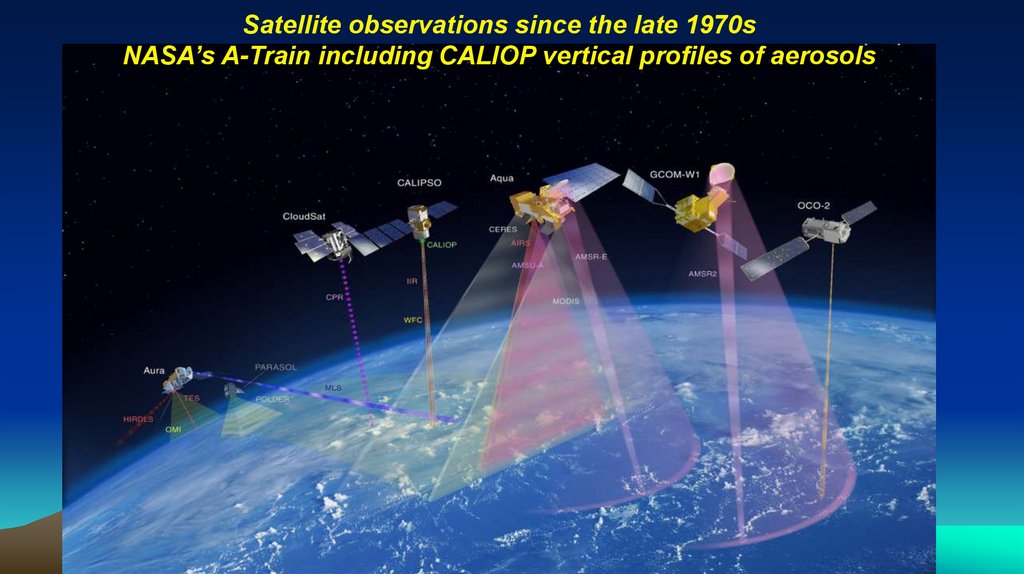
Satellite observations since the late 1970sNASA’s A-Train including CALIOP vertical profiles of aerosols
7. ARGO ocean network of operational floats since early 2000s
8. An irregularly periodic variation in winds and sea surface temperatures over the tropical eastern Pacific Ocean, affecting the
What is ENSO?El Niño Southern Oscillation
Note – Pre-industrial era existence shown by coral archives.
An irregularly periodic variation in winds and sea surface temperatures over the tropical eastern
Pacific Ocean, affecting the climate of much of the tropics and subtropics. The warming phase of the sea
temperature is known as El Niño and the cooling phase as La Niña. The Southern Oscillation is the
accompanying atmospheric component, coupled with the sea temperature change: El Niño is
accompanied by high air surface pressure in the tropical western Pacific and La Niña with low air surface
pressure there.
Southern Oscillation Index time series 1876-2017
pressure difference between Darwin and Tahiti
Source: Wiki
9. Why ENSOs occur in the Pacific?
Note – Volcanism within the ocean basins currently comprises 70% of Earth’s magma output.10.
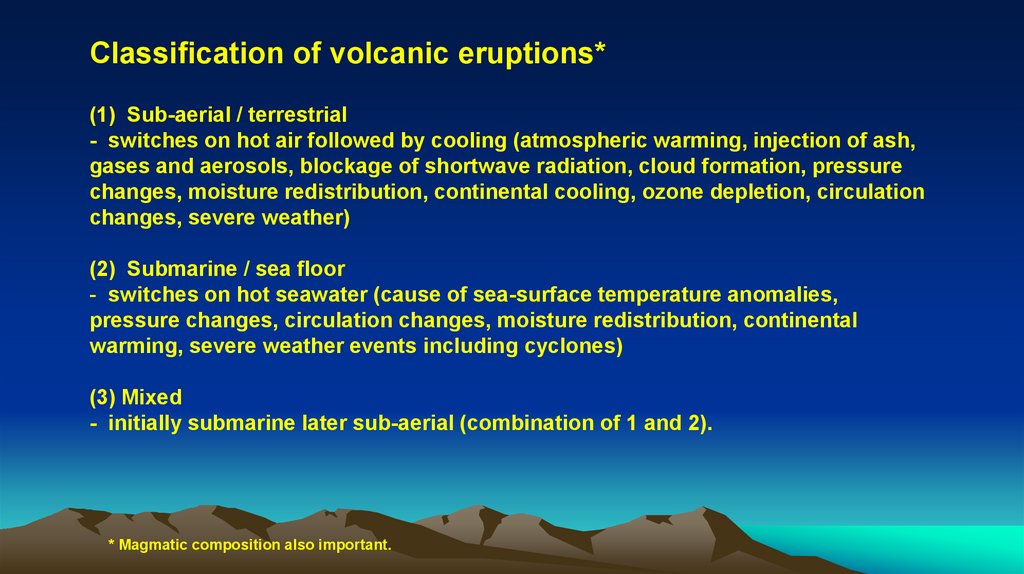
Classification of volcanic eruptions*(1) Sub-aerial / terrestrial
- switches on hot air followed by cooling (atmospheric warming, injection of ash,
gases and aerosols, blockage of shortwave radiation, cloud formation, pressure
changes, moisture redistribution, continental cooling, ozone depletion, circulation
changes, severe weather)
(2) Submarine / sea floor
- switches on hot seawater (cause of sea-surface temperature anomalies,
pressure changes, circulation changes, moisture redistribution, continental
warming, severe weather events including cyclones)
(3) Mixed
- initially submarine later sub-aerial (combination of 1 and 2).
* Magmatic composition also important.
11.
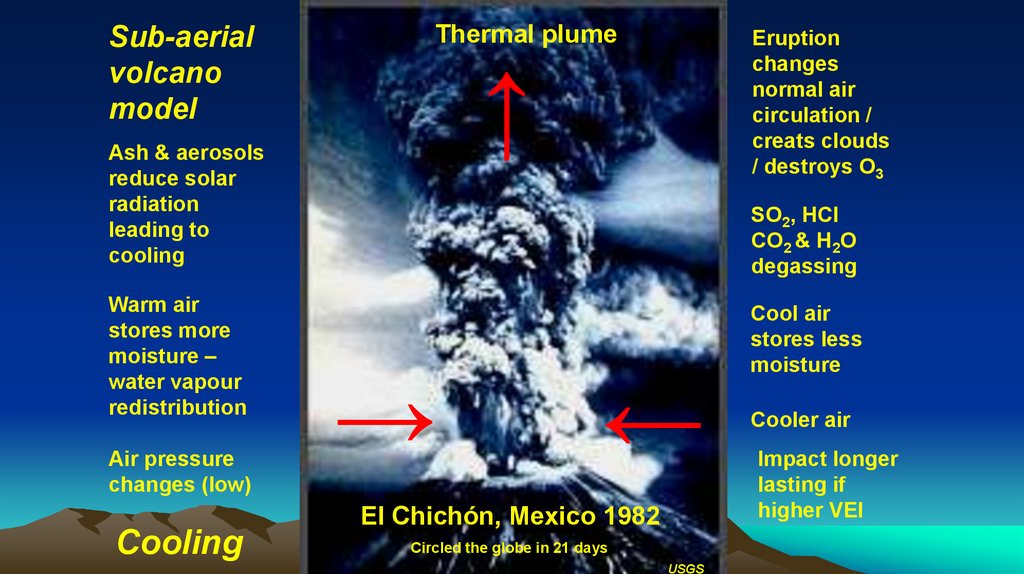
Sub-aerialvolcano
model
Thermal plume
↑
Ash & aerosols
reduce solar
radiation
leading to
cooling
Warm air
stores more
moisture –
water vapour
redistribution
Air pressure
changes (low)
Cooling
Eruption
changes
normal air
circulation /
creats clouds
/ destroys O3
SO2, HCl
CO2 & H2O
degassing
→
←
El Chichón, Mexico 1982
Circled the globe in 21 days
USGS
Cool air
stores less
moisture
Cooler air
Impact longer
lasting if
higher VEI
12. Volcanic Explosivity Index (VEI)
Used for theestimation of
explosiveness of
volcanic eruptions
on land (subaerial)
E-15, 2010
(Newhall and Self
1982)
Acid magma
most explosive
8
Above VEI 2
regional impacts
on weather
already detectable
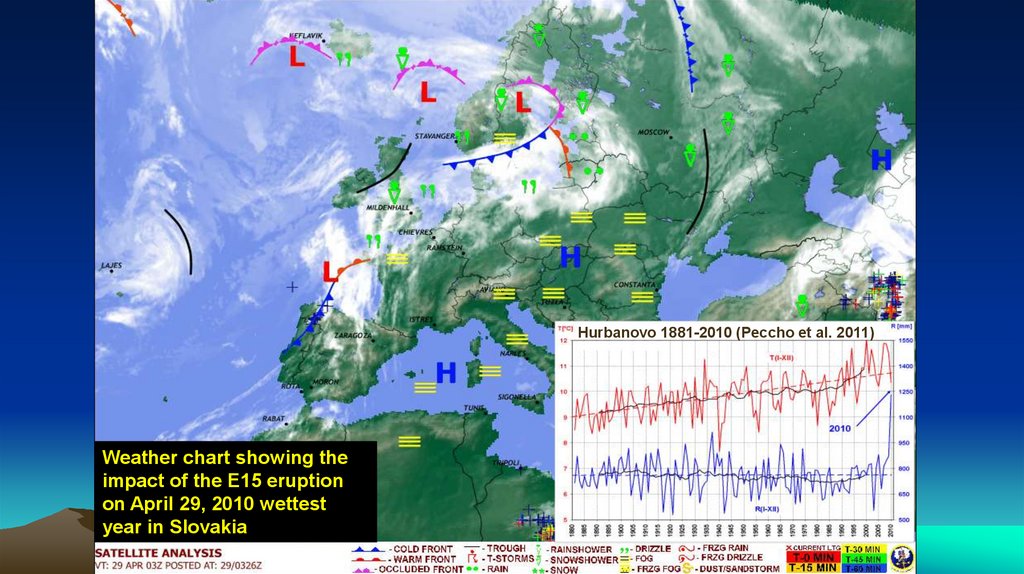
13. Why study the present day? e.g. Iceland 2010 event
Eyjafjallajökull (E-15)April 14, 2010 eruption
Impact – Slovakia wettest
year since 1881
Most reliable record – Information age
Importance – societal e.g.
farming, climate model testing
( Meteorological observations
( Satellite observations since ~1980
( Weather disaster media reports
( Aviation safety studies
14.
Hurbanovo 1881-2010 (Peccho et al. 2011)Weather chart showing the
impact of the E15 eruption
on April 29, 2010 wettest
year in Slovakia
15. Submarine volcano model
Examples –El Hierro volcano, Canary islands
10/2011 – 3/2012
El Hierro
Nishinoshima, 940 km south of
Tokyo 3/2013-9/2015
Off Mayotte 11/2018-4/2019
Switching on hot seawater
basaltic lavas ~1200oC
Warming
NASA
Possible effects –
Heating up seawater
Pressure changes
Surface wind changes
Sea-level changes
Ocean current changes
Polar sea ice changes
Biodiversity changes
16. Statistics on submarine volcanoes
Total number~1 million
Number rising 1 km from seabed
75,000
Magma output in oceanic ridges
75%
Active submarine volcanoes
~5000
Important facts –
Geothermal heat is released during eruptions changing the ‘normal’
ocean circulation
Known for volcanic ecosystems
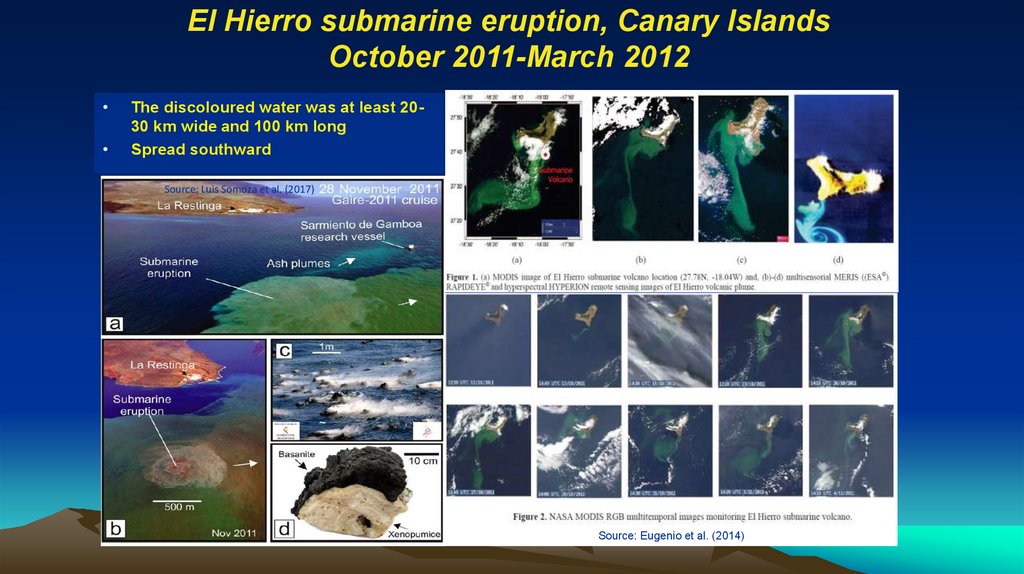
17.
El Hierro submarine eruption, Canary IslandsOctober 2011-March 2012
The discoloured water was at least 2030 km wide and 100 km long
Spread southward
Source: Luis Somoza et al. (2017)
Source: Eugenio et al. (2014)
18. What was the observed impact of the hot seawater in the North Atlantic Basin overlooked by atmospheric scientists?
Brownish plume createdSource: Daily mail reporter
(2011)
Source: Daily Mail
A new island emerged briefly from the sea
along the coast of Restinga, Canary Islands
19. North Atlantic Blob – combined effect of the Sun and El Hierro on SST on 28 June 2012
Greater warm seawater penetrationEl Hierro
10/20113/2012
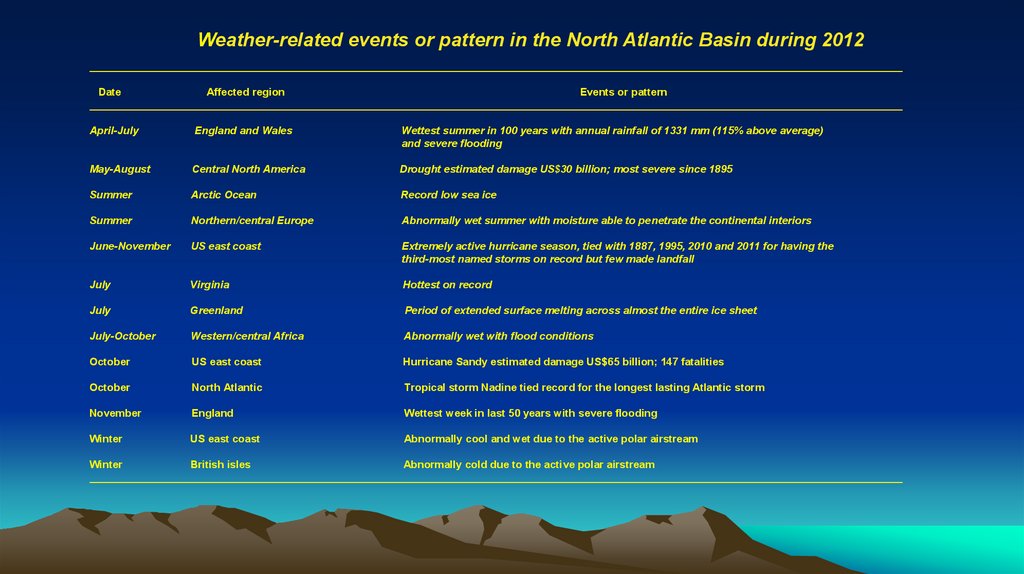
20.
Weather-related events or pattern in the North Atlantic Basin during 2012__________________________________________________________________________________________________________________________________________
Date
Affected region
Events or pattern
__________________________________________________________________________________________________________________________________________
April-July
England and Wales
Wettest summer in 100 years with annual rainfall of 1331 mm (115% above average)
and severe flooding
May-August
Central North America
Drought estimated damage US$30 billion; most severe since 1895
Summer
Arctic Ocean
Record low sea ice
Summer
Northern/central Europe
Abnormally wet summer with moisture able to penetrate the continental interiors
June-November
US east coast
Extremely active hurricane season, tied with 1887, 1995, 2010 and 2011 for having the
third-most named storms on record but few made landfall
July
Virginia
Hottest on record
July
Greenland
Period of extended surface melting across almost the entire ice sheet
July-October
Western/central Africa
Abnormally wet with flood conditions
October
US east coast
Hurricane Sandy estimated damage US$65 billion; 147 fatalities
October
North Atlantic
Tropical storm Nadine tied record for the longest lasting Atlantic storm
November
England
Wettest week in last 50 years with severe flooding
Winter
US east coast
Abnormally cool and wet due to the active polar airstream
Winter
British isles
Abnormally cold due to the active polar airstream
__________________________________________________________________________________________________________________________________________
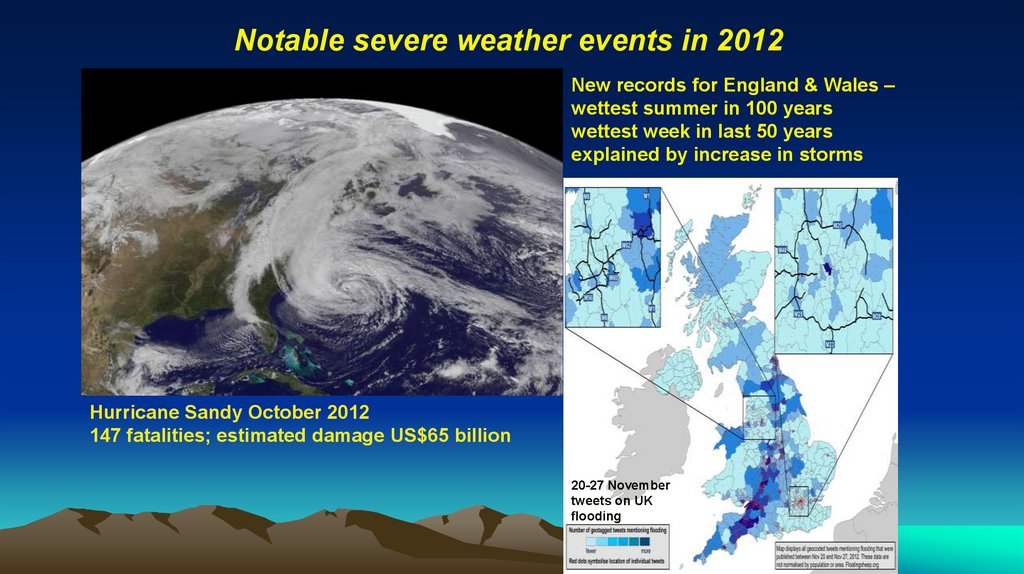
21.
Notable severe weather events in 2012New records for England & Wales –
wettest summer in 100 years
wettest week in last 50 years
explained by increase in storms
Hurricane Sandy October 2012
147 fatalities; estimated damage US$65 billion
20-27 November
tweets on UK
flooding
22. 2012-2016 volcanic eruptions in the Pacific
_____________________________________________________________________________________________________Date
Volcano
Activity
_____________________________________________________________________________________________________
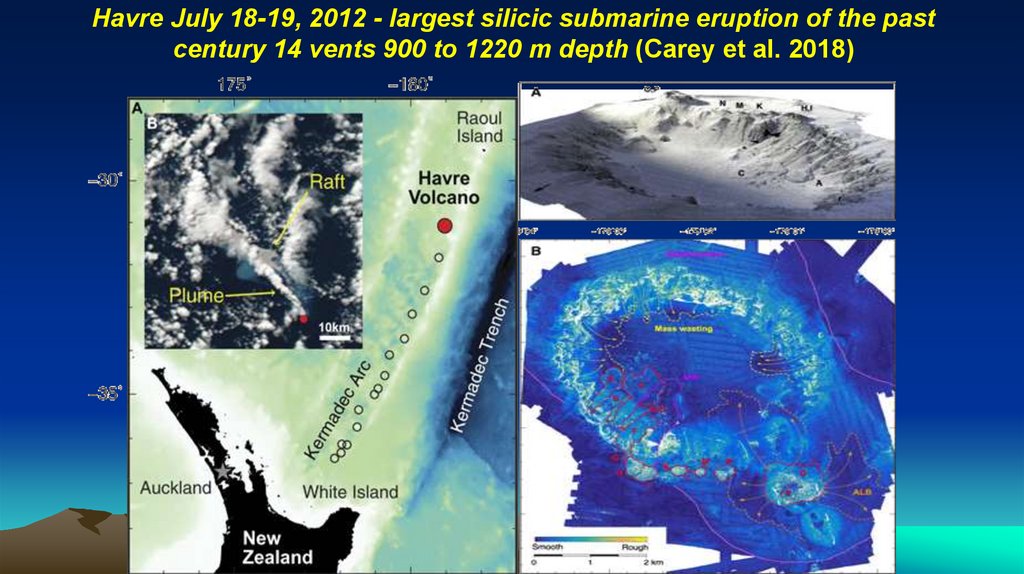
7/2012
Havre, north of
New Zealand
Largest deep-ocean silicic eruption of the past century with a 400 km2 pumice
raft, lava sourced from 14 vents 900-1220 m depth
3/20139/2015
Nishino-shima,
940 km South
of Tokyo
Eruption was initially submarine until a new island appeared in November
2013
12/20141/2015
Hunga,
Tonga
Initially submarine until a new island was created
5/20156/2015
Wolf,
Galapagos
Basaltic lava flows into the Pacific Ocean
7/2016Kilauea,
Basaltic lava flows into the Pacific Ocean
onwards
Hawaii
_____________________________________________________________________________________________________
23.
Havre July 18-19, 2012 - largest silicic submarine eruption of the pastcentury 14 vents 900 to 1220 m depth (Carey et al. 2018)
24. Nishino-shima submarine/terrestrial eruption 940 km south of Tokyo March 2013 to August 2015
Image on November 13, 2013: Japan Coast GuardSubmarine eruption began in March 2013
Image on December 8, 2013: NASA
25. Main trigger of 2014-2016 ENSO sea-surface temperature anomalies created the North Pacific Blob on January 2, 2014
BlobNishino-shima eruption
3/2013-8/2015
Blob
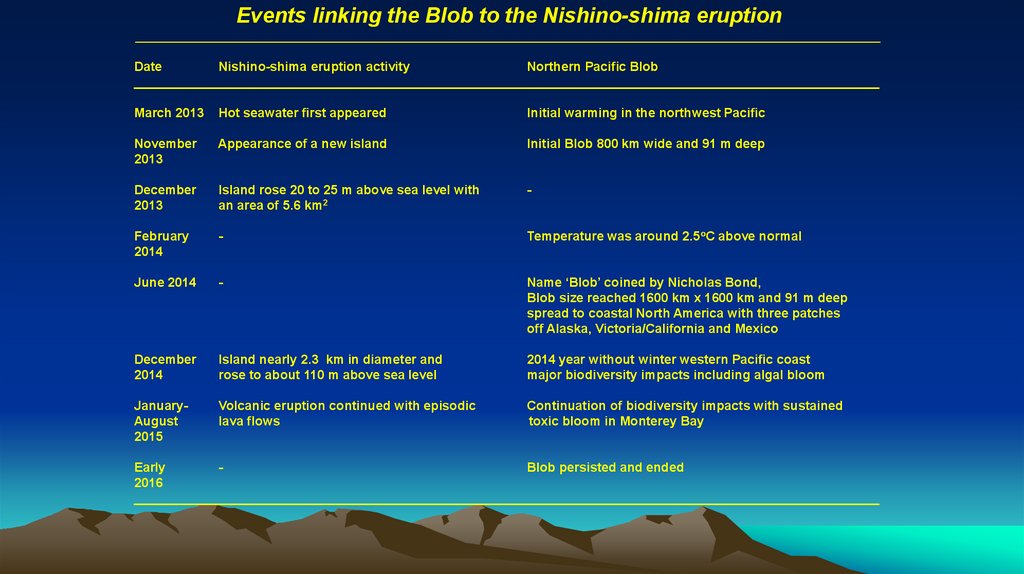
26.
Events linking the Blob to the Nishino-shima eruption_________________________________________________________________________________________________________
Date
Nishino-shima eruption activity
Northern Pacific Blob
_________________________________________________________________________________________________________
March 2013
Hot seawater first appeared
Initial warming in the northwest Pacific
November
2013
Appearance of a new island
Initial Blob 800 km wide and 91 m deep
December
2013
Island rose 20 to 25 m above sea level with
an area of 5.6 km2
-
February
2014
-
Temperature was around 2.5oC above normal
June 2014
-
Name ‘Blob’ coined by Nicholas Bond,
Blob size reached 1600 km x 1600 km and 91 m deep
spread to coastal North America with three patches
off Alaska, Victoria/California and Mexico
December
2014
Island nearly 2.3 km in diameter and
rose to about 110 m above sea level
2014 year without winter western Pacific coast
major biodiversity impacts including algal bloom
JanuaryAugust
2015
Volcanic eruption continued with episodic
lava flows
Continuation of biodiversity impacts with sustained
toxic bloom in Monterey Bay
Early
Blob persisted and ended
2016
_________________________________________________________________________________________________________
27. The Blob separated into three parts on September 1, 2014
Arctic sea ice retreat1
Kuroshio
weakening
Warm water
build up in slack
areas of gyres
2
3
Antarctic sea ice expansion
Ocean circulation
28. Pressure distribution during the North Pacific Blob
RidiculouslyResilient
Ridge
Polar
vortex
2014 and 2015
two years with
extraordinary
mild winters
NOAA
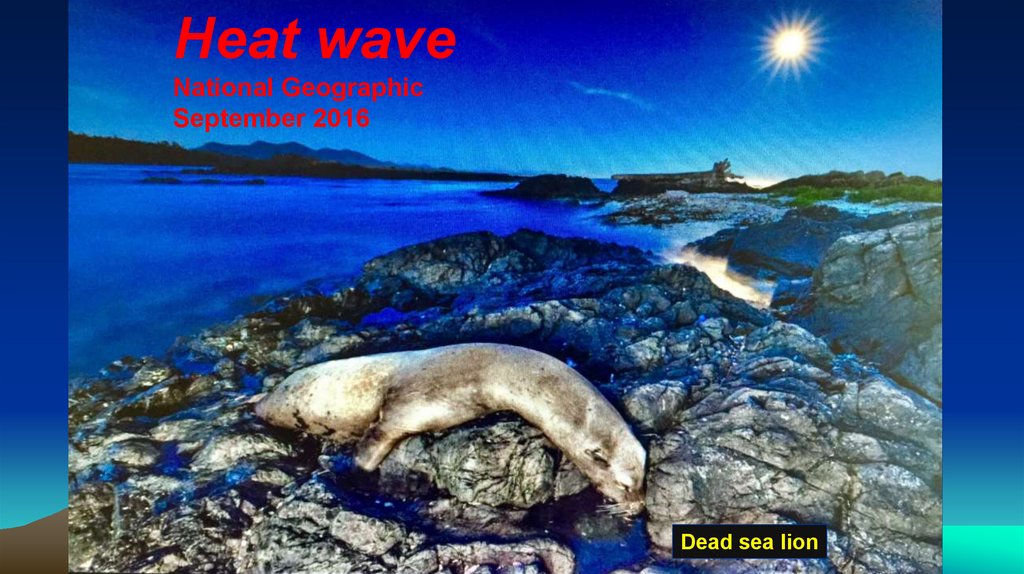
29.
Heat waveNational Geographic
September 2016
Dead sea lion
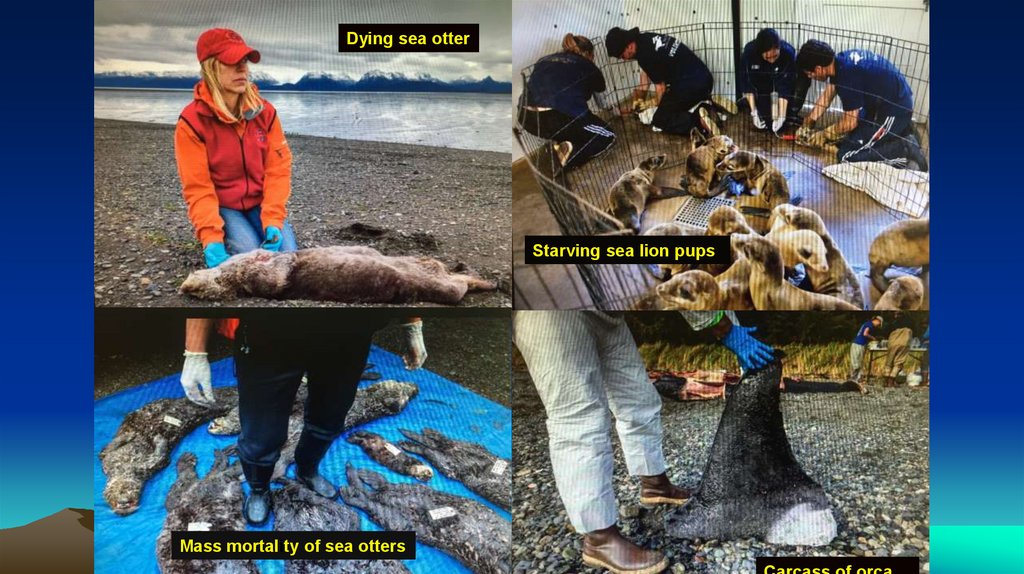
30.
Dying sea otterStarving sea lion pups
Mass mortality of sea otters
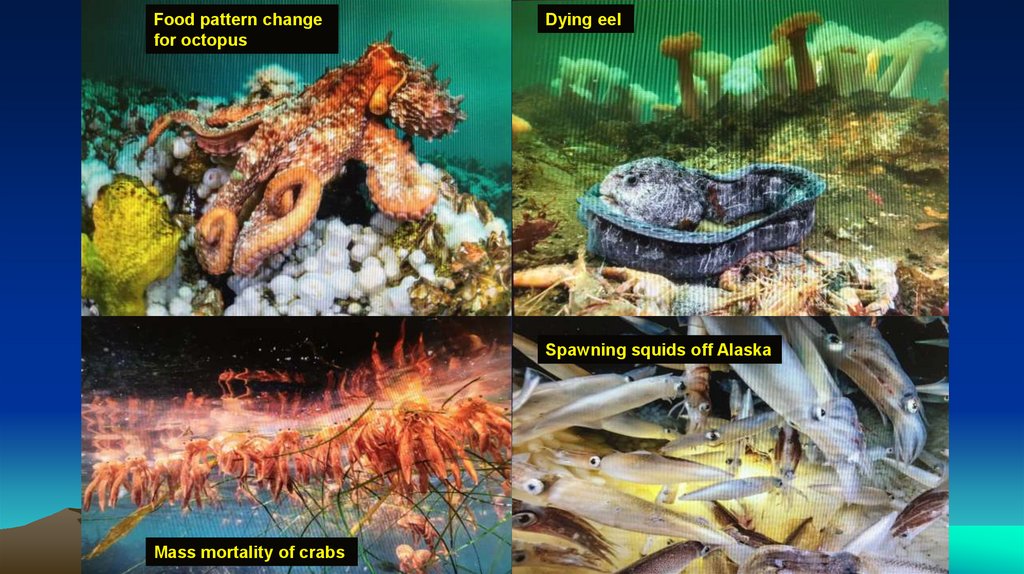
31.
Food pattern changefor octopus
Dying eel
Spawning squids off Alaska
Mass mortality of crabs
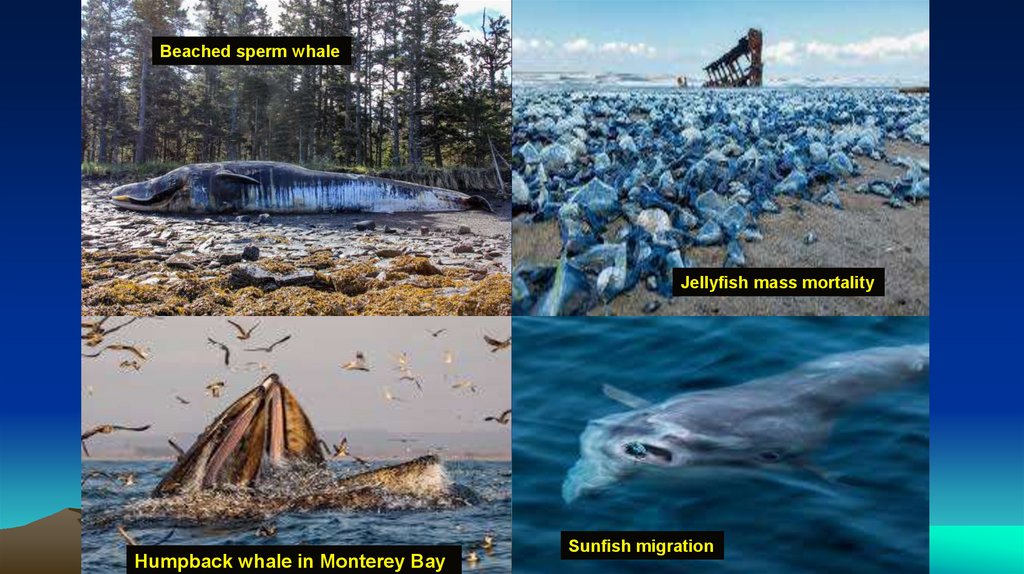
32.
Beached sperm whaleJellyfish mass mortality
Humpback whale in Monterey Bay
Sunfish migration
33. Ecosystem changes
Warm seawater much less nutrient rich than cold seawaterImpacts –
Reduction in coastal upwelling
Reduction in phytoplankton productivity with knock on effects on
zooplankton
Food chain effect
Salmon catches dropped drastically
Death of almost 1 million birds between summer 2015 to Spring 2016 (reported
by the Guardian on January 16, 2020)
Tropical organisms including squids migrated to Alaskian coast
34. Toxic algal bloom along the west coast of North America
35. Sea-surface temperature anomalies on June 29, 2015 after the Wolf eruption ended
Coralbleaching
Hunga eruption
12/2014-1/2015
Wolf eruption
5-7/2015 with
lava flow entering
the ocean
36. A natural cause of Great Barrier Reef coral bleaching in January 2015
Note - Rise in ocean acidity caused by SO2 degassing may also be at work.37. ENSO 2014-2016 was stronger because of the Blob comparison of seawater temperature anomaly US west coast
Source: Tseng (2017)38. Comparison of sea-level anomaly 1997 and 2015 Source: Jentoft-Nilsen (2015)
39. Comparison of ocean surface topography during El Niño 1997-1998 and 2015-2016
NASA40. Eruption of Wolf volcano, Galapagos late May to June 2015 VEI 4
NASANASA
NASA
thinkgalapagos.com
41. Establishment of the strong and long-lasting 2014-2016 El Niño August 31, 2015
42. Arctic sea ice changes 2007-2017 Explained by the release of geothermal heat through volcanism (Source: Clutz 2017)
El Hierro10/20113/2012
Nishino-shima
3/2013-9/2015
43. Arctic sea ice extent 2007-2016 Source: National Snow & Ice Data Centre
Arctic sea ice extent 2007-2016Source: National Snow & Ice Data Centre
Record minimum
Gradual decline
44. Influence on minimum Arctic sea ice extent
Winter 2014-2016Summer 2014-2016
Source: NISDC.org
45. Ranking of Arctic monthly air temperatures 1979-2017
NOAA46. New submarine volcanic eruption discovered in the Mozambique Channel November 2018-May 2019
47. Multibeam sonar waves, reflecting off the sea floor southeast Mayotte, showing an 800-m-tall volcano with a 5 km diameter anda
rising gas-rich plumeCause of
warming in
Southwest
Indian Ocean
Blob
48. Global map of sea-surface temperature anomalies on November 18, 2019
NorthPacific
NorthBlob
Pacific
Blob
Southwest
Indian Ocean
Southwest
Blob
Indian Ocean
Blob
Record cyclone
season
49. Lateiki submarine eruption, Tonga new island created November 7, 2019
Old island destroyed and replaced by a bigger new island50. Global map of sea-surface temperature anomalies on November 21, 2019
Lateikisubmarine
eruption,
Tonga
51. Global map of sea-surface temperature anomalies on December 9, 2019
WhiteIsland
eruption
52. Global map of sea-surface temperature anomalies on December 19, 2019
SouthPacific
Blob
53. Statistics of the South Pacific Blob
Marine heat wave east of New Zealand – High pressure, sunnysky and light wind
1 million square kilometers (size of Texas)
6 degree Celsius above normal
Total thickness of hot seawater 50 metres
Prof. J. Renwick – Heated by the sun through natural causes
not by global warming
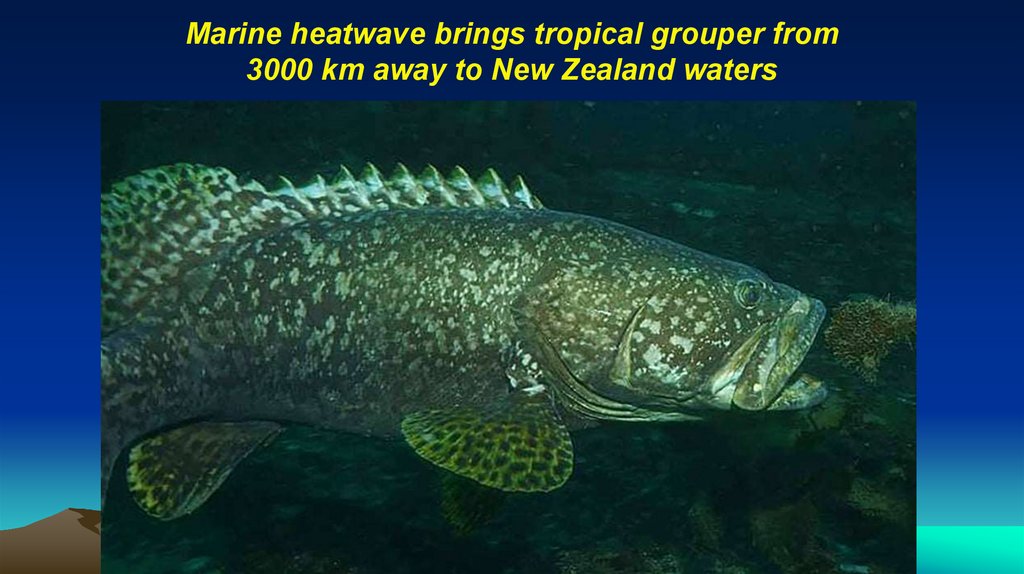
54.
Marine heatwave brings tropical grouper from3000 km away to New Zealand waters
55. Submarine volcanic eruptions contributing geothermal heat to the South Pacific Blob
56. Landsat images showing dramatic melting in the Eagle Island region of Antarctica on February 4, 2020 in comparison to February
13, 2020. Source: NASA57. Map derived from the Goddard Earth Observing System model representing air temperatures at 2 m above the ground on February 9,
2020. Source: NASA.58. Conclusions
(1) Volcanism is an underestimated natural cause of ocean heat waves.(2) All 4 case studies of regional ocean heatwaves were caused mainly by the
release of geothermal heat through volcanism.
(3) Man-made carbon dioxide from fossil fuels are not responsible for such heat
waves.
(4) The occurrence of heat waves may influence the sea-ice extent in both the
Arctic and the Antarctic.
(5) The biodiversity changes observed were of a temporary nature which is
inconsistent with global warming.
(6) Because sulphur oxides released into seawater through volcanism is much
more acidic than carbon dioxide, it is more likely to cause coral bleaching.