


 Moscow – Central Federal Region, 2013 (green borders)")

")
")


 and population of EAEU countries), 1990-2016")


 and objective reasons for problems.")


, military and R&D expenditures, oil extraction and prices")


 US$")


 Leonid Grigoriev – New York Times: 12 Sept. 1991")
 Leonid Grigoriev – New York Times: 12 Sept. 1991")


")
")


, 2013")


")


:")
:")

, 174 countries, 1992")
")


")
")
")


")


")
")
")
")


")


")


 US$")


 in Russia, 1990, 1997, 2007, 2015/2016")


, bln USD-2012, by industry, by region")


")
")
")

")


")


 US$")


 Английский язык
Похожие презентации:


")
")


Economy of Russia
1. Economy of Russia. History 14.01.2019
Professor Leonid GrigoryevHSE, Moscow
www.leonidgrigoryev.com
2. GDP per capita 1000 – 2000, international $, log.scale
23. Attempt to reconstruct the world economy dynamics
34. Economic history quest: Malthusian trap
Source: http://krugman.blogs.nytimes.com/2009/07/01/the-malthusian-insult/comment-page4/?_r=0 (taken from Brad de Long)4
5. Development rates of countries differ
Environment: tropics, moderate, North, heath, islands and remote areasPrimary states and rent concentration
Mesopotamia – Egypt – China = scientific-and-technological advance
from China to Europe and back in the 30-53 latitude!!!
Vladivostok - Astrakhan: 6300 km: 132 and 48 Eastern longitude
Genghis Khan and Zheng Khe
Little space for Christian European states competing fiercely
Brodel (the importance of the seaside). Mediterranean!
Technical advance spurred by necessity and overcrowding. Wars…
Ancient Rus in forests between the Heath and Europe
5
6. Legal Systems of the World
Source: stolen from Wikipedia6
7. The Great Divergence
China, India, Japan, Arabs were helpless against Turkey and Europe inXV-XVI cent. Why?
Cities and finances of the XVI-XVII cent. (%%) – Koot (2013).
Institutions of competitiveness and reinvestment of profits!?
Pomerantz “The Great Divergence” (2000) – problems of the Asian
disruption and lagging behind in 1700-1870. Asia fell behind during the
Industrial revolution.
America before Columb and Africa – disrupted development.
Colonialism means demolition of elites, institutions, rent and resources
withdrawal.
Governance, wealth and social distribution differ a lot.
Technological advance in Europe XIV-XX cent.
Stagnation in China, fragmentation processes in Asia
Russia between the East and the West: huge army expenditures
7
8. Key problems of the Russian history
Millennium+ with no peace, regular wars…Big wars – Borders = Pattern of surrounding
Revolution and XX C. = series of Catastrophes
Crush of the SU aggravated all crises… - three transformations: state,
ideology, ownership.
1990-s - shock for people and change of elites.
People have fixed feelings on external danger.
Russian Elite behaves like other Great Elites.
“Declared Loser” now resists new rules, Cold war.
8
9. Ratio of GDP per capita of the USSR/Russia to the USA
Russia/USAUSSR/USA
9
10. Problems at the end of the 1980s.
Growth in different countries became stable, living standards wereincreasing, scientific-and-technological advance was going. China – turnoff
in 1986. Growth in the USSR slowed down plummeting to -2% in 1990.
Observable savings ratio – 25%, with the deflator and discounting factors
- about 50%, military expenditure = $250 bil. in 1988
Degradation of rent redistribution among the union republics, the feeling
of “burden of the center”
IWEIR (ИМЭМО) – reported the growth and scientific-and-technological
advance to the OECD, economists raised alarm – ECO=№11 – 1987
Monetary overhang, antialcohol measures, external debts and help to the
3rd-world countries
Public fatigue, annoyance, queues and lack of prospects. Tsoy (ASSA 1987): «We wait for the changes!»
10
11. Moscow princedom, 1533 (in red) Moscow – Central Federal Region, 2013 (green borders)
1112. History – till 1533
Russian elites – “driving under influence”: Normans since VIII century,Byzantium since X, Nomad neighboring (Steppy) – ever (before Mongols
in XIII)
Languages accent: North Russian = O and G; South Russian = A and H;
Moscow = A and G …
No Peace for Millennium, tough Princes and North land Monasteries.
Chivalry suppressed by wars? Schism since 1054,
Catholic Crusades in Baltics, Difficult contacts with European powers.
Constantinople – “Treachery of 1204” for Orthodoxies
Mongols Invasion of 1237-40 – South (Kiev) goes to Lithuania and
Poland. Double rent for 10-15 Centuries, paid by poor peasantry: to
Khans and Princes
13-15 Centuries: Slow growth, no metals, furs=oil.
First “preventive” embargo for metals in 1480s
12
13. History – 1533- 1991 (1)
1533 – turning point for enlarging – post Saint Bartholomewmassacre and Stockholm massacre, Henry the Eight etc.
Ivan the “Terrible”: Siberia – Baltic and South Steppy
South Borders’ every year protection and the seeking the Sea
access. Absorbing tribal nobility into Tsars' Court – contrary to
British – Tatars khans, Georgian princes and Baltic barons
Good Imperia and Bad Imperia – by interests of Political Elites
British interests: Uprising in India, Crimea war and “Kim”.
13
14. History – 1533- 1991 (2)
WWI and Romanov’s Crush, Revolution out of mainstream;Purges and industrialization – huge losses and difficult
memory;
WWII – heroics cherished for Danger, Losses and Sufferings!
Russia changed the World in 1991 for better, not losing Cold
War!
But Freedom came with a disaster for masses…
14
15. Remaining European empires
Empires were established by ”cool” adventurers followed byboyars and Streltsy
Old empires had been established after the Crusades:
Denmark (Baltic - England); Sweden (Baltic); Poland; Turkey
(Byzantium)
Colonial empires: Netherlands, Portugal, Spain, France, Great
Britain (slave-trade). Continental: Austria, Russia, Germany
United (or organized at least) Europe: Charlemagne, Treaty of
Westphalia, Napoleon, Vienna treaty, Hitler, UNO and coalitions,
EU
15
16. Договора Руси с Византией, 860… 912
Нестор - В Повести временных лет об этом договоре сказано:«В год 6420 (912). Послал Олег мужей своих заключить мир и
установить договор между греками и русскими, говоря так:
"Список с договора, заключенного при тех же царях Льве и
Александре. Мы от рода русского - Карлы, Инегелд, Фарлаф,
Веремуд, Рулав, Гуды, Руалд, Карн, Фрелав, Руар, Актеву, Труан,
Лидул, Фост, Стемид - посланные от Олега, великого князя
русского, и от всех, кто под рукою его, - светлых и великих князей,
и его великих бояр, к вам, Льву, Александру и Константину,
великим в Боге самодержцам, царям греческим…»
16
17. Договора Руси с Византией, 860… 912
Русско-византийский договор (907-912). Заключенпосле успешного похода на Константинополь
князя Олега. Основными его положениями было
восстановление мирных и добрососедских
отношений между двумя
странами. Византия обязалась платить Руси
ежегодную дань в солидных размерах и
выплатить единовременную контрибуцию
деньгами, золотом, вещами, тканями и др.,
оговаривает размер выкупа каждому воину и
месячное содержание для русских купцов.
17
18. 1533 – 1917, 1991 – the Big Bang
Ivan the “Terrible”: Siberia – Baltic and South SteppySouth Borders’ every year protection and the seeking the Sea access.
Absorbing tribal nobility into Tsars' Court – contrary to British – Tatars
khans, Georgian princes and Baltic barons
Good Imperia and Bad Imperia – by interests of Political Elites
British interests: Uprising in India, Crimea war and “Kim”.
Romanov’s Crush, Failure of Elites to adapt
WW I – final mistake (Durnovo) Revolution out of mainstream;
Purges and industrialization – huge losses and difficult memory;
WWII – heroics cherished for Danger, Losses and Sufferings!
Russia changed the World in 1991 for better, not losing Cold War!
But Reforms turned out to be disaster for masses…
18
19. Empire is what it is
By A.N. Kuropatkin, the Nikolai II Minister of War count, there hadbeen 72 years of peace and 128 years of war for Russia during XVIII
and XIX century. Only 4 from 33 wars were defensive and 29 –
offensive, launched either for “the boundaries extension” (what can
be understood) either for “the interest of public policy” (what is
much more difficult to be understood).
Defensive wars: the Great Northern war, some of the Russo-Turkish
Wars, the 1812 war (Napoleon) and the Eastern War. This was
common for all the empires – Austria, Prussia, France and Great
Britain.
19
20. What exactly has to be transformed during a country transition?
The most crucial thing is property and control handover and controlover economic decision-making.
Political system, civil society and political parties, rights and values
Free commerce authorization, external markets are open for
competition (but to what extent?)
Financial system setting up (calculations, savings, financial tools)
Transformation of rights for the mass elements of savings: houses,
pensions, shares
Jobs, income and society structure
20
21. How deals on territorial changes are hold
Potential elites and legitimacyNegotiations, elites` interests
Arrangements (referendums on territories) on the national issues
Property arrangements
Language arrangements
International arrangements
Colonies, India, Ireland, Bangladesh, Czechoslovakia, Yugoslavia
In the case of the USSR collapse there was no agreement
21
22. Might the development and transformation issues be resolved?
Goals of the transformation: democracy and market economyLong-term development goal: to achieve middle-developed market economy
from middle-developed planned economy
Was the goal of integrating set down? It appears that it wasn`t.
Strategy and chaos: «the market will make it» – both the woes of the
institutes` transformation and development
The Goal and Resources correspondence
Resources – Subjects of the two goals achievement
The factor of the USSR collapse (the 1990 negotiations), GKChP 1991 and the
factor of economic disruption
22
23. Difficulties and losses of the transitional period boost phobias:
Foreign capital as a threatCorruption omnipotence – the excuse of doing nothing
External criticism – the source of troubles
…and manias:
Foreign capital as panacea
Chasing – global competition
Conspiracy – our own disorder
The problem of the countries income distribution
We should have started in 1990 with -2% GDP and not in 1991
with -16% GDP
23
24. …and utopias:
Ideal policy existsGovernance instead of initiative
All-purpose instruments
Sudden leaps for no reason
Quick solutions for long-term problems
Little importance of institutional design
Possibility of the institutions direct transfer
Anticipation of the very same results with change of an institute context
24
25. What did Russia obtained after the collapse?
Territory – more than 80% and natural resourcesPopulation – 51%
Industry – approximately 60%
Agriculture – about 50%
The gross of the army (nuclear)
Universities and science – more than 90% (“in lay terms”)
Embassies and foreign buildings – exchange for debts
Russia paid all the debts of USSR (with 1994 debt restructuring) and
gave to all the 14 countries “zero debts”
More mining and extraction (with Kazakhstan)
Less manufacturing (Belarus and to the West as a whole)
25
26. Dynamics of GDP per capita PPP (2011 prices) and population of EAEU countries), 1990-2016
Population, mln peopleGDP per capita PPP (2011 prices)
1990
2000
2010
2016
1990
2000
2010
2016
Armenia
3,5
3,1
2,9
2,9
3,7
2,9
6,7
8,2
Belarus
10,2
10,0
9,5
9,5
8,4
7,6
16,2
16,7
Kazakhstan
16,3
14,9
16,3
17,8
13,1
10,0
20,1
23,4
Kyrgyz Rep.
4,4
4,9
5,4
6,1
3,5
2,1
2,8
3,3
Russia*
148,3
146,6
142,8
146,7*
20,6
14,1
23,1
24,0*
For reference
Azerbaijan
Georgia
4,8
4,4
3,9
3,7
8,0
3,3
6,7
9,3
Turkey
53,9
63,2
72,3
79,5
11,4
13,9
18,0
23,7
Uzbekistan
20,5
24,7
28,6
31,8
3,1
2,5
4,2
6,0
Ukraine
51,9
49,2
45,9
42,7
10,5
4,8
7,8
7,7
* Including Republic of Crimea and Sevastopol
Source — World Bank
27. Death, birth and natural increase in Russia, 1960-2015s
2728. GDP PPP per capita, constant US$
28Source: World Bank
29. Key topics – crush of 1990-s
GDP = minus 43%, jump in Suicides and MurdersFailure of Transition to mainstream: privatization for Oligarchs, high
Inequality, concentration of property
SU’s dissolution without agreements – aggravation!
Soviet ideology had gone very fast – to vacuum…
Limited numbers of strong industries: Resources, Energy, Agriculture,
Nuclear, Defense, Space etc.
Oil prices helped to meet immediate needs.
People feel much safer after collapse of 1990s.
Two million educated emigrated… +Access to Info!
Education and oil money – reestablishing of hard core.
29
30. Russia: GDP level, Suicide and Homicide, qtr., s.a. 2006-2015
3031. Russians speaking English and Russian & the Internet access
Russians speaking English and Russian & the Internetaccess
Percentage of Households
with Access to Internet
Possession of Mobile
Telephone (%)
Possession of Personal
Computer (%)
2010
2015
2010
2015
2010
2015
Brazil
27,1
54,5
91,8
93,4
34,9
53,5
Canada
78,4
85,9
78,1
87,2
82,6
85,5
China
23,7
54,2
86,9
94,6
35,4
49,6
Germany
72,9
85,0
88,9
93,5
80,8
88,3
Italy
59,0
75,4
88,8
92,6
64,8
72,5
Russia
41,3
72,1
93,0
96,6
55,0
72,5
South Africa
10,1
50,6
85,8
96,3
18,3
23,4
Spain
59,1
78,7
94,6
96,7
68,7
75,9
32. Society after 1/4 Century of Transition
Current Russian Socio-economic realty is the result partly of Soviettimes, mostly from 1990-s transition.
Privatization and Inequality connected! Transformation failed to support
educated social strata, create mass shareholding, stable civil society!
Recessions and oil-price fluctuations dominate the economic and social
situation.
Tough Russian History – Tough Russian Mentality – it always here,
fatalistic and used to hardship.
Pressure from outside puts Russian Elites on defensive and leads to
consolidation, the old style. New Cold war was the convenient “gift” from
outside. It goes since 2012.
32
33. Key topics – Cold war in minds of Elites
Russians never lost Cold War, better forget it…It is not world of Fukuyama… - it’s of “Fukusima”…
Russian Political Elites want equal footing and recognition of Russian
interests in the World.
Since Russia was considered a Looser, no “interests” for losers – let
them weep! Comfortable…till 2014.
Russian pretense for equality, interests, roles was ignored and Russian
Elites made a last ditch stand.
Failures in Middle East, problems in other places - for R. Elites were
recognition of the urgency of defense.
Elite insists – Russia behaves exactly as super powers.
It was unexpected for West and met with a Cold war…
33
34. Trap of the middle level development?
The «500 days» program 1990; attempts of 1991; IMF and IBRD 19921998; again in 2001; «Coalitions for the future» 2007-08; the Concept oflong-term development (КДР) 2008; «Strategy 2020» in 2013; Sustainable
development goals (Kudrin) 2017-2018; The strategy of the Ministry of
Economy-2035
The necessity of:
•mass shareowner;
•more science & innovations sustainability;
•independence from oil money;
•more equality in personal income;
•entrepreneurship development
becomes evident
34
35. Leonid Grigoryev – some publications
Elites - the Choice for Modernization in “Russia: the Challenges ofTransformation”, P. Dutkiewicz and D. Trenin (Ed), NYUP, 2011.
“The elites’ demand for law: Overcrowded streetcar (tram) effect” // The
Russian Journal of Economics, #3 – 2015, pp 313-327.
«Transformation: For the people or for the elite?» - in “The Social History
of Post-Communist Russia”, Edited by P. Dutkiewicz, V. Kulikov and R.
Sakwa. Routledge, NY, 2016, pp. 58-80.
“Russia in the System of Global Economic Relations” // Strategic Analysis.
Delhi, Vol. 46. 2016. № 6. (special issue: Russia in Global Affairs.) P. 498512.
35
36.
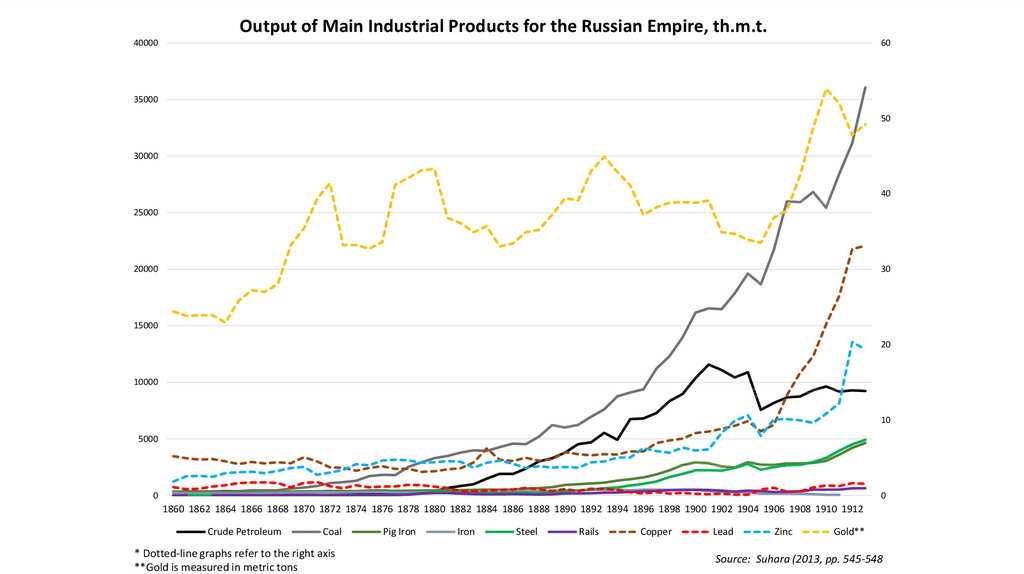
Output of Main Industrial Products for the Russian Empire, th.m.t.40000
60
35000
50
30000
40
25000
20000
30
15000
20
10000
10
5000
0
0
1860 1862 1864 1866 1868 1870 1872 1874 1876 1878 1880 1882 1884 1886 1888 1890 1892 1894 1896 1898 1900 1902 1904 1906 1908 1910 1912
Crude Petroleum
Coal
* Dotted-line graphs refer to the right axis
**Gold is measured in metric tons
Pig Iron
Iron
Steel
Rails
Copper
Lead
Zinc
Gold**
Source: Suhara (2013, pp. 545-548
37.
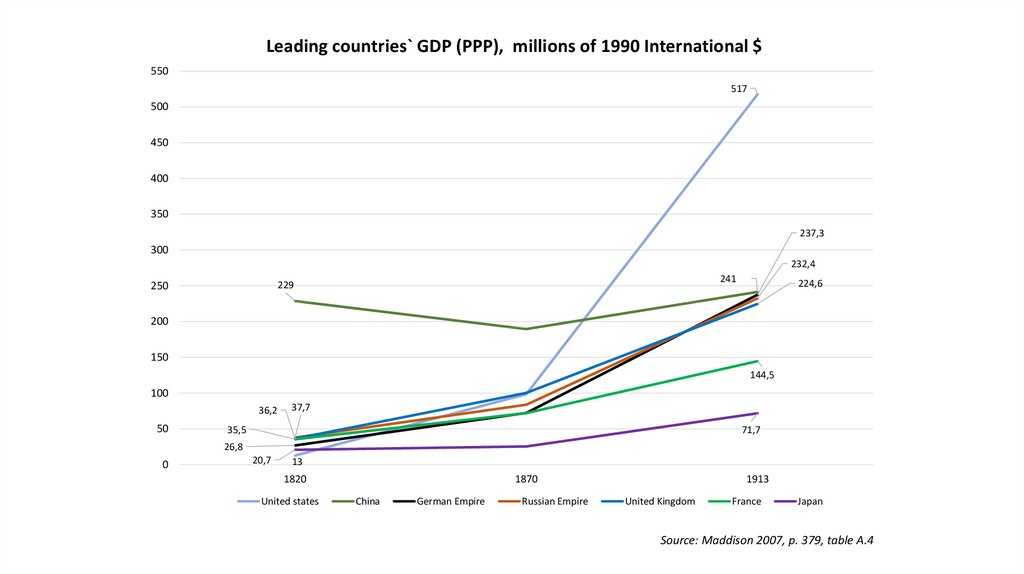
Leading countries` GDP (PPP), millions of 1990 International $550
517
500
450
400
350
237,3
300
232,4
250
241
229
224,6
200
150
144,5
100
36,2
50
37,7
35,5
71,7
26,8
0
20,7
13
1820
United states
1870
China
German Empire
Russian Empire
1913
United Kingdom
France
Japan
Source: Maddison 2007, p. 379, table A.4
38.
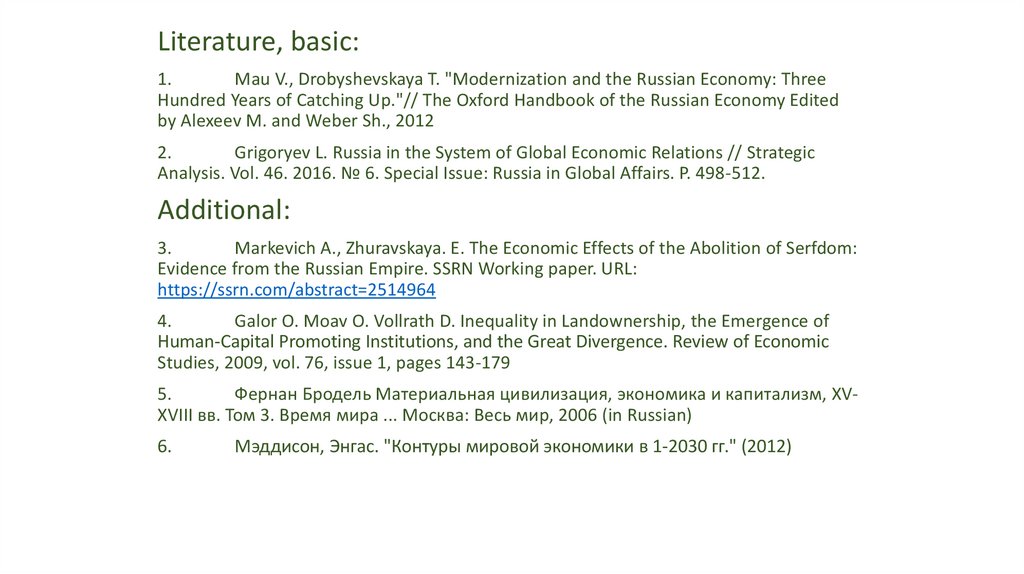
Literature, basic:1.
Mau V., Drobyshevskaya T. "Modernization and the Russian Economy: Three
Hundred Years of Catching Up."// The Oxford Handbook of the Russian Economy Edited
by Alexeev M. and Weber Sh., 2012
2.
Grigoryev L. Russia in the System of Global Economic Relations // Strategic
Analysis. Vol. 46. 2016. № 6. Special Issue: Russia in Global Affairs. P. 498-512.
Additional:
3.
Мarkevich A., Zhuravskaya. E. The Economic Effects of the Abolition of Serfdom:
Evidence from the Russian Empire. SSRN Working paper. URL:
https://ssrn.com/abstract=2514964
4.
Galor O. Moav O. Vollrath D. Inequality in Landownership, the Emergence of
Human-Capital Promoting Institutions, and the Great Divergence. Review of Economic
Studies, 2009, vol. 76, issue 1, pages 143-179
5.
Фернан Бродель Материальная цивилизация, экономика и капитализм, XVXVIII вв. Том 3. Время мира ... Москва: Весь мир, 2006 (in Russian)
6.
Мэддисон, Энгас. "Контуры мировой экономики в 1-2030 гг." (2012)
39. Transformations of 1917-2018 (ideology, ownership, country’s configuration) and objective reasons for problems.
21.01.2019Professor Leonid Grigoryev, HSE,
Moscow
www.leonidgrigoryev.com
40. Topics for discussion:
Russian in 1913 – Development V InstitutionsEuropean politics and WWI
WWI – Game Changer
Russian economic future WITHOUT wars?
Human losses at 1914-1920
Great October Revolution – post war changes
Fate of European empires: Austria-Hungary, Germany,
Turkey. Return of national states.
Belgian, British, French, Portuguese empires survival till
aftermath of WW II
Topics for discussion:
41. History
Millennium+ with no peace, regular invasionsNormans, Byzantium, Nomads before Mongols
Big wars – Borders = Pattern of surrounding
Revolution and XX C. = series of Catastrophes
Dissolution of the SU aggravated all crises…
Difficult shock for people and elites
People have fixed feelings on external danger
Pressing on the state (or Russian language) is not taken easy
by people, not just propaganda
Russian Elite insists, it copies other Great Elites
If somebody resists on new rules, it may be Cold…
41
42. The Empire Map
Олифирова Т.И.43. Periods of Russian History in XX-XXI C
Periods of Russian History in XXXXIC
• Tsar Nikolai II – till 1917
Revolution and Civil war – 1917- 1920
Recovery – 1920 – 1928
Stalin’s industrialization – 1930-1941
WW II – 1939 – 1945; USSR and USA –1941-1945
Reindustrialization – 1945 – 1990
Transition crisis – 1990 – 1998
Slow recovery – 1999 – 2002
Oil prices up and fast growth – 2002-2008
Slow growth – 2009 - 2018
44.
Leading countries` GDP (PPP), millions of 1990 International $550
517
500
450
400
350
237,3
300
232,4
250
241
229
224,6
200
150
144,5
100
36,2
50
37,7
35,5
71,7
26,8
0
20,7
13
1820
United states
1870
China
German Empire
Russian Empire
1913
United Kingdom
France
Japan
Source: Maddison 2007, p. 379, table A.4
45.
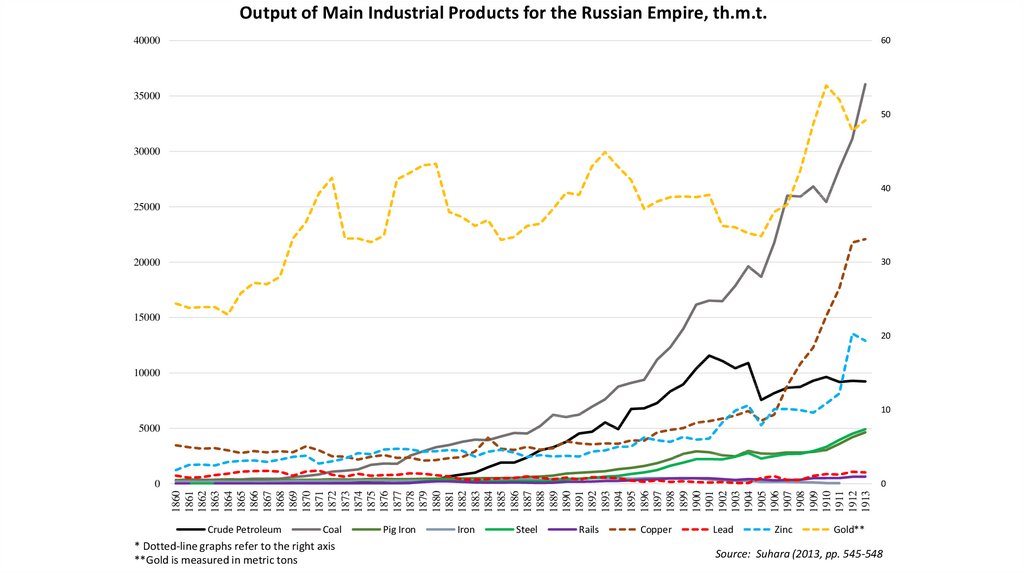
Output of Main Industrial Products for the Russian Empire, th.m.t.60
40000
35000
50
30000
40
25000
30
20000
15000
20
10000
10
5000
0
1860
1861
1862
1863
1864
1865
1866
1867
1868
1869
1870
1871
1872
1873
1874
1875
1876
1877
1878
1879
1880
1881
1882
1883
1884
1885
1886
1887
1888
1889
1890
1891
1892
1893
1894
1895
1896
1897
1898
1899
1900
1901
1902
1903
1904
1905
1906
1907
1908
1909
1910
1911
1912
1913
0
Crude Petroleum
Coal
* Dotted-line graphs refer to the right axis
**Gold is measured in metric tons
Pig Iron
Iron
Steel
Rails
Copper
Lead
Zinc
Gold**
Source: Suhara (2013, pp. 545-548
46. Real national income per head, 1913 to 1927/28: year-on-year percent change on Soviet territory and at 1913 prices
Soviet territory and at 1913prices
Source: Markevich A., Harrison M. Great War, Civil War, and Recovery:
Russia’s National Income, 1913 to 1928
30
47. Postwar recovery: The GDPs of selected Eurasian countries in 1928, percent of 1913
countries in 1928, percentof 1913
Source: Markevich A., Harrison M. Great War, Civil War, and
Recovery: Russia’s National Income, 1913 to 1928
31
48. European Empires and Unions
Empires were established by ”cool” adventurers followed by“Boyars and Streltsy” = “Lords and Troops”
Old empires had been established after the Crusades till 16 C.:
Denmark (Baltic - England); Sweden (Baltic); Poland; Turkey
(Byzantium); German conglomerate of 12
Colonial empires since 16 C.: Belgian (Congo), Netherlands,
Portugal, Spain, France, Great Britain. Germans - too late…
Continental: Austria-Hungary, Russia, Turkey…
First “World war” – the Netherlands against Portugal: in 17 C.
United (organized at least) Europe: Charlemagne, Treaty of
Westphalia, Napoleon, Vienna treaty, Hitler’s attempt, EU
Cost of Empires, cost of breakdown, cost of national states.
15
49. Russian and Soviet economic and demographic losses in four crises
Source: Markevich A., Harrison M. Great War, Civil War,and Recovery: Russia’s National Income, 1913 to 1928
29
50. 1990 - 2018
Three Transformations:State configuration
Politics and ideology
Ownership
Steps of 1992: free trade, open external trade, free
prices
Case of Poland
“500 days” – Yavlinski, Yasin + 10 (LG in)
Summer 1990
All subsidies down
Assets and Debts sharing
14
51. GDP PPP per capita, constant US$
51Source: World Bank
52. Economic history quest: Growth of transition economies. 1990 – 2017,GDP PPP per capita, 1990 = 100
Source: World Bank13
53. Key topics – crush of 1990-s
GDP = minus 43%, jump in Suicides and MurdersFailure of Transition to mainstream: privatization for
Oligarchs, high Inequality, concentration of property
SU’s dissolution without agreements – aggravation!
Soviet ideology had gone very fast – to vacuum…
Limited numbers of strong industries: Resources,
Energy, Agriculture, Nuclear, Defense, Space etc.
Oil prices helped to meet immediate needs.
People feel much safer after collapse of 1990s.
Two million educated emigrated… +Access to Info!
Education and oil money – reestablishing of hard core.
53
54. What did Russia obtain after the collapse?
Territory – more than 80% and natural resourcesPopulation – 51%
Industry – approximately 60%
Agriculture – about 50%
The gross of the army (nuclear)
Universities and science – more than 90% (“in lay terms”)
Embassies and foreign buildings – exchange for debts
Russia paid all the debts of USSR (with 1994 debt restructuring)
and gave to all the 14 countries “zero debts”
More mining and extraction (with Kazakhstan)
Less manufacturing (Belarus and to the West as a whole)
54
55. Russia key indicators, growth for the period,%
Source: Rosstat55
56. GDP, Industry production and Gross Fixed Capital Production, 1961-2007
Source: Rosstat, CSU USSR, IEF calculations56
57. GDP (2000=100), military and R&D expenditures, oil extraction and prices
GDP (2000=100), military and R&D expenditures,oil extraction and prices
57
58. Russia: GDP level, Suicide and Homicide rates, 1989-2010
GDP (left scale)Suicide rate (right scale)
per 100 000
2010
2009
2008
2007
2006
2005
10
2004
40
2003
15
2002
50
2001
20
2000
60
1999
25
1998
70
1997
30
1996
80
1995
35
1994
90
1993
40
1992
100
1991
45
1990
110
1989
1989 = 100
Russia: GDP level, Suicide and Homicide rates, 1989-2010
Homicide rate (right scale)
58
59. Russia: GDP level, Suicide and Homicide, qtr., s.a.2006-2015
5960. Consumer Expenditure on Durable Goods, US$, Current Prices, 2000-2015
Source: Euromonitor60
61. Society after 1/4 Century of Transition
Current Russian Socio-economic realty is the result partlyof Soviet times, mostly from 1990-s transition and of course
of recent developments.
Recession and oil-price fluctuations dominate the
economic and social situation.
Transformation failed to support educated social strata,
create mass shareholding, stable civil society!
Tough Russian History – Tough Russian Mentality – it
always here, fatalistic and used to hardship.
Pressure from outside puts Russian Elites on defensive and
leads to consolidation of old style. And Cold war is the
convenient gift from outside. It goes since 2012.
61
62. Key topics – Cold war in minds of Elites
minds of ElitesRussians never lost Cold War, better forget it…
It is not world of Fukuyama… - it’s of “Fukusima”…
Russian Political Elites want equal footing and
recognition of Russian interests in the World.
Since Russia was considered a Looser, no “interests”
for losers – let them weep! Comfortable…till 2014.
Russian pretense for equality, interests, roles was
ignored and Russian Elites made a last ditch stand.
Failures in Middle East, problems in other places - for
R. Elites were recognition of the urgency of defense.
Elite insists – Russia behaves exactly as super powers.
It was unexpected for West and met with a Cold war…
62
63. Military expenditure, in constant (2015) US$
USAChina
Russia
Saudi Arabia
France
India
United Kingdom
Japan
Germany
Republic of Korea
Italy
Australia
Brazil
Israel
Canada
Turkey
constant (2015) US$
1988
1998
2008
587,4
398,8
683,8
20,2
32,7
113,5
(1989)
250,0
14,0
41,4
(USSR)
23,3
31,4
50,0
57,7
51,1
53,6
17,9
22,8
41,0
59,4
47,8
64,4
34,5
40,9
40,2
58,2 (West
42,1
39,5
G)
14,1
20,1
29,5
31,7
32,4
34,3
12,1
13,6
19,6
14,5
14,8
20,6
14,3
12,5
14,7
16,9
12,5
17,9
7,9
16,3
13,8
Source: SIPR, 2017I
% GDP
1998 2008
3,0
4,2
2016
606,2
1988
5,7
225,7
2,5 (1989)
1,7
1,9
1,9
70,3
-
3,0
3,3
5,3
61,4
55,7
55,6
54,2
41,6
15,2
3,6
3,7
3,8
0,9
2,8
(West G)
4,3
2,3
2,2
2,1
17,1
2,0
2,9
14,3
2,7
2,8
2,4
1,0
7,4
2,3
2,6
2,4
1,0
10,4
2,3
2,5
1,9
1,0
1,5
1,3
1,2
2,9
1,9
1,9
1,7
7,9
1,3
3,3
2,6
1,7
1,8
1,5
6,5
1,3
2,3
2,7
1,5
2,0
1,3
5,8
1,0
2,0
63
41,0
37,3
28,0
24,4
22,8
17,8
15,5
15,0
2016
3,3
64. Russians know English and Russian & got access
Russians know English and Russian & got accessCountry
Percentage of
Possession of
Possession of Mobile
Households with Access
Personal Computer
Telephone (%)
to Internet
(%)
Years
2010
2015
2010
2015
2010
2015
Brazil
27,1
54,5
91,8
93,4
34,9
53,5
Canada
78,4
85,9
78,1
87,2
82,6
85,5
China
23,7
54,2
86,9
94,6
35,4
49,6
Germany
72,9
85,0
88,9
93,5
80,8
88,3
Italy
59,0
75,4
88,8
92,6
64,8
72,5
Russia
41,3
72,1
93,0
96,6
55,0
72,5
South Africa
10,1
50,6
85,8
96,3
18,3
23,4
Spain
59,1
78,7
94,6
96,7
68,7
75,9
65.
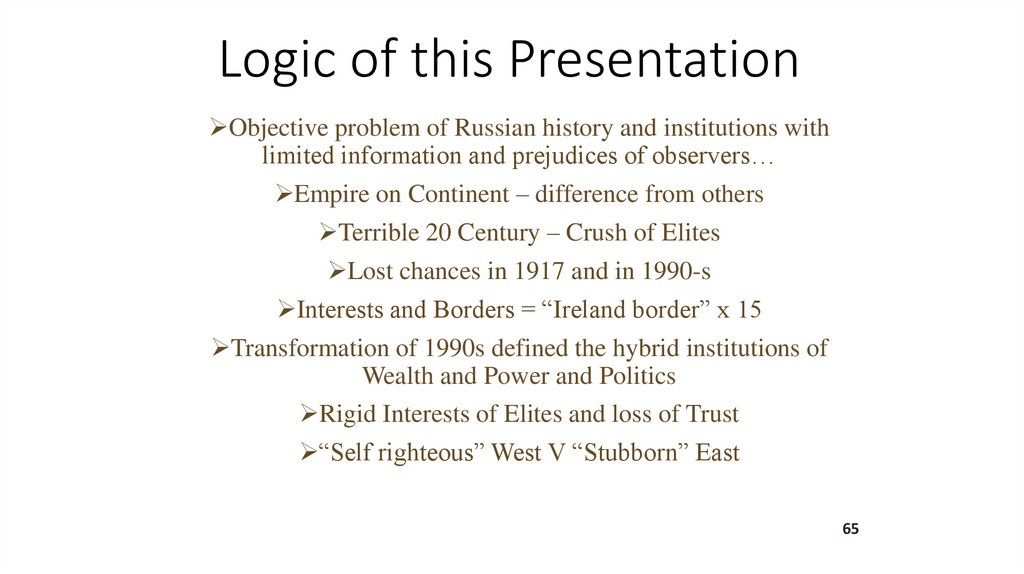
Logic of this PresentationObjective problem of Russian history and institutions with
limited information and prejudices of observers…
Empire on Continent – difference from others
Terrible 20 Century – Crush of Elites
Lost chances in 1917 and in 1990-s
Interests and Borders = “Ireland border” x 15
Transformation of 1990s defined the hybrid institutions of
Wealth and Power and Politics
Rigid Interests of Elites and loss of Trust
“Self righteous” West V “Stubborn” East
65
66. Ratio of GDP per capita of the USSR/Russia to the USA
Russia/USAUSSR/USA
66
67. Literature:
“Transition to Market Economy” (in collaboration), Moscow, 1990, a.k.a. "500 days.Transition to the Market", St. Martins Press, NY, 1991;
Elites - the Choice for Modernization in “Russia: the Challenges of Transformation”, P.
Dutkiewicz and D. Trenin (Ed), NYUP, 2011.
“Mechanisms of Global Governance: economic analysis” (with AKudin). // “Voprosy
Ekonomiki”, 7, 2013, pp. 4-28.
«Transformation: For the people or for the elite?» - in “The Social History of PostCommunist Russia”, Edited by P. Dutkiewicz, V. Kulikov and R. Sakwa. Routledge, NY, 2016,
pp. 58-80.
“Russia in the System of Global Economic Relations” // Strategic Analysis. Delhi, Vol. 46.
2016. № 6. (special issue: Russia in Global Affairs.) P. 498-512.
“Markevich A., Harrison M. «Great War, Civil War, and Recovery - Russia's National
Income, 1913 to 1928» Journal of Economic History, Vol. 71, Issue 03, 2011
Mau V., Drobyshevskaya T. Modernization and the Russian Economy: Three Hundred Years
of Catching Up // The Oxford Handbook of the Russian Economy Edited by Alexeev M. and
Weber Sh., 2012
28
68. Russia - transformations of 1990-2018 Privatization and Ownership and corporate governance "Even God cannot change the past"
Russia - transformations of 1990-2018Privatization and Ownership
and corporate governance
"Even God cannot change the past"
Agathorn, 4 C BC
28.01.2019
Professor Leonid Grigoryev,
HSE, Moscow
www.leonidgrigoryev.com
69. No warning for the People of the USSR
"No leader has yet had the courage to tell the peoples of theSoviet Union of the obvious: that the transition to a market
economy will entail much hardship. Western living
standards will not be achieved overnight. The creation of a
middle class that can stabilize social and political life will
take time. After a lifetime’s worth of a central controlled
economy, there are no alternatives to hard work, modesty
and patience."
Leonid Grigoriev – New Yok Times
12.09.1991
2
70. GDP PPP per capita, constant US$
Source: World Bank70
71. Russia key indicators, growth for the period,%
Source: Rosstat71
72. Key topics – crush of 1990-s
1990-sGDP = minus 43%, jump in Suicides and Murders
Failure of Transition to mainstream: privatization for
Oligarchs, high Inequality, concentration of property
SU’s dissolution without agreements – aggravation!
Soviet ideology had gone very fast – to vacuum…
Limited numbers of strong industries: Resources, Energy,
Agriculture, Nuclear, Defense, Space etc.
Oil prices helped to meet immediate needs.
People feel much safer after collapse of 1990s.
Two million educated emigrated… +Access to Info!
Education and oil money – reestablishing of hard core.
72
73. Transformation Debates 1987-1992
Transformation Debates 198719921987 – "ECO" = 70 years since 1917; Aganbegian,
Kornai, Gaidar, Yasin – Yavlinskiy
"500 days" plan as last chance on soft landing
1991 – Putsch, GDP minus 18%; SU exit;
Choice of the Future – "Sauna Decision"
Liberalization, Opening the economy,
Macroeconomic stabilization, Privatization
Speed vs institution building; Coase theorem!!
Choice of Elites – nobody was actually consulted:
dissolution and speed
6
74. "Soviets need a unified Free Economy" (1/2) Leonid Grigoriev – New York Times: 12 Sept. 1991
"Soviets need a unified Free Economy" (1/2)Leonid Grigoriev – New York Times: 12 Sept. 1991
"The swiftness of the collapse of Soviet Communism did not allow
democratic forces time to study various routes to economic reform or
develop exercise to carry them out. Virtually all leading politicians in
the Soviets republics have their own vision of the system to be built –
a tower of Babel of economic reform."
In what direction should they go? Today, three competing programs
are being discussed in Moscow. Two would leave economic changes in
the hands of individual republics, thereby slowing reform. But the
third, advocated by the economist Grigory Yavlinsky and offered as a
formal agreement yesterday, recommends the preservation of a strong
economic union including an integrated banking system and single
currency. Mr. Yavlinsky and Yevgeny Yasin, who helped craft the plan,
are correct in warning of economic collapse if their four-to-six week
timetables is ignored.
7
75. "Soviets need a unified Free Economy" (2/2) Leonid Grigoriev – New York Times: 12 Sept. 1991
"Soviets need a unified Free Economy" (2/2)Leonid Grigoriev – New York Times: 12 Sept. 1991
Privatization. Everyone agrees this is the linchpin of the
reform, but the new republic leaders are puzzled about
how to privatize the large heavy industries. Who’s going
to invest in nuclear submarine plant?
Then there’s a fear factor. Western economists are urging
large-scale privatization in all sectors of economy, but the
new leadership fears complete collapse if it turns over the
means of production to untested entrepreneurs. It has no
choice, however. I’ve had countless conversations with
bureaucrats who want to privatize their companies but
keep their control over the property. The problem is that
these bureaucrats may also retain their commandeconomy style of decision-making.
8
76. Global Choice of privatization
To privatize:Lands, houses, infrastructure, firms, natural
resources, financial assets, human capital
Ownership, enjoying proceeds, management
Corporate Governance and Management
Programs of Privatization: Sale, Insiders’, Peoples’
Declarations of intent – technologies – outcomes
UK, France, Argentina, Brazil
DDR, Poland, Czechoslovakia, Russia
9
77.
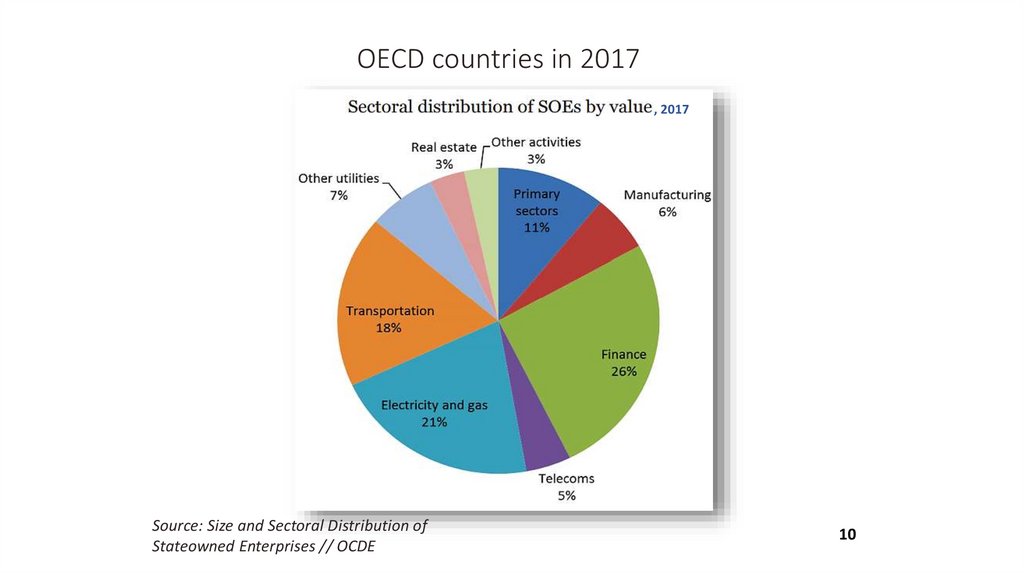
OECD countries in 2017, 2017
Source: Size and Sectoral Distribution of
Stateowned Enterprises // OCDE
10
78. 1990 - 2018
Three TransformationsState configuration = dissolution of the USSR into 15
Politics and ideology – total loss of old, what new?
Ownership change = crucial role in the long-term
Sequence: free trade, open external trade, free prices
Privatization – at once or after stabilization
Summer 1990: "500 days" – Yavlinski, Yasin + 10 (LG)
All central subsidies down
Rubles printed by 15 Central Banks
Inter republican trade down, political conflicts
Assets and Debts sharing with republics
11
79. Ronald Сoase and transaction costs
Stigler 1966: "the Coase theorem thus asserts thatunder perfect competition private and social costs
will be equal".
Cooter, 1987 - New Palgrave Dictionary of Economics:
"The initial allocation of legal entitlement does not
matter from an efficiency perspective so long as the
transaction costs of exchange are nil".
Coase received Nobel prize in 1991 for his work of
1937 "Theory of Firm" (born in 1910). Too late to
influence universities and Bretton-Woods for works
on transition.
After all privatizations "transaction costs of
exchange" were too high for easy reallocation. Finders
keepers, losers weepers.
12
80. Bundle of Rights – Honore 1961 – Ownership (1/2)
(1) The Right to Possess: The right to possess, viz. to haveexclusive physi cal control of a thing, or to have such
control as the nature of the thing admits, is the
foundation on which the whole superstructure of
ownership rests. It may be divided into two aspects, the
right (claim) to be put in exclusive control of a thing and
the right to remain in control.
(2) The Right to Use: The present incident and the next
two overlap. On a wide interpretation ·of 'use',
management and income fall within use. On a narrow
interpre tation, 'use' refers to the owner's personal use
and enjoyment of the thing owned. On this inter pretation
it excludes management and income.
13
81. Bundle of Rights – Honore 1961 – Ownership (2/2)
(3) Right to manage is the right to decide how and bywhom the thing owned shall be used.
(4) The Right to the Income: To use or occupy a thing
may be regarded as the simplest way of deriving an
income from it, of enjoying it.
(5) The Right to the Capital: The right to the capital consists
in the power to alienate the thing and t.he liberty to
consume, waste or destroy the whole or part of it: clearly
it has an important economic aspect.
14
82. Privatization and Choice of Objectives
Interests in Privatization differ:Nation – soft transition to new institutes
Nation - effective owner & modernization = investments
New owners – at least stability of property rights
Budgets – financing during crisis
Politicians – Machiavellian priv.: to win next elections
Outsiders: non return to socialism and "cheap buy"
To whom: managers, workers, households
Reformers: fast run from planned economy
Voucher system as Speed solution = 45 th. enterprises in 19931999 for little money – nothing to Budget
Ulterior Property Rights = Managers with "Right to use"
82
83. Institutional conditions for effective privatization
Conditions within acountry
A company`s conditions (environment)
Competitive
High controllability;
good market-oriented Solution: to sell
conditions
Low controllability;
lack of marketoriented conditions
Solution: to sell,
paying special
attention to
competition
Source: Kikery S, Nelis J., Shirly M., 1992, p.5.
Non-competitive
Solution: to provide the necessary
regulative environment and consider selling
afterwards
Solution: to consider privatization or
management agreements; set marketoriented political goals; form pertinent
regulative environment; consider selling
afterwards
16
84.
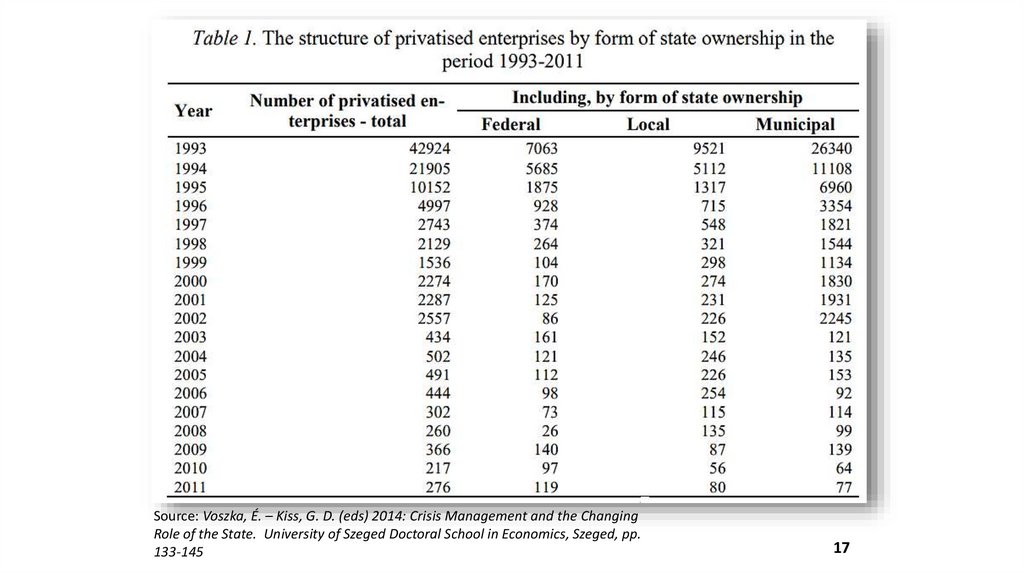
Source: Voszka, É. – Kiss, G. D. (eds) 2014: Crisis Management and the ChangingRole of the State. University of Szeged Doctoral School in Economics, Szeged, pp.
133-145
17
85.
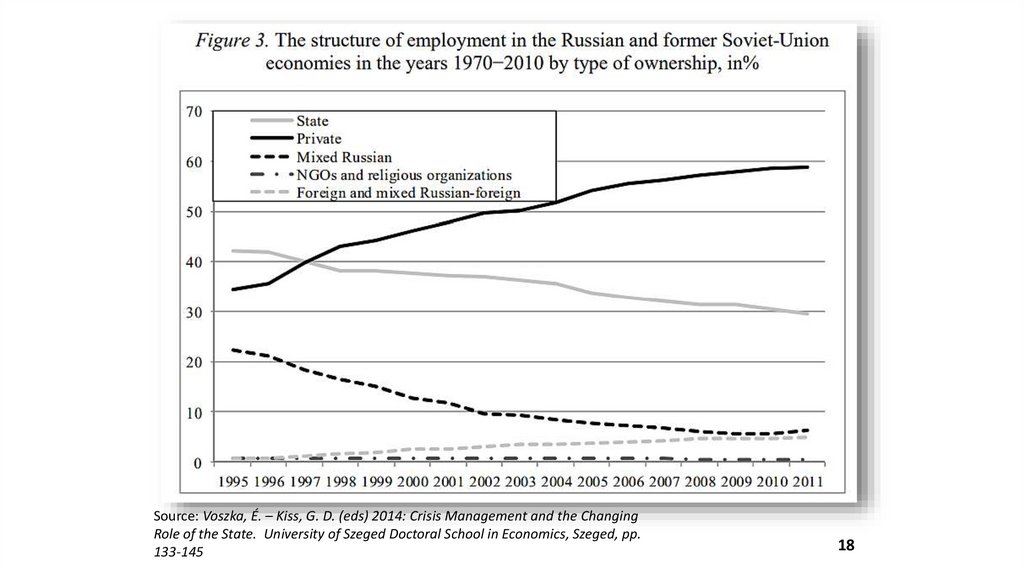
Source: Voszka, É. – Kiss, G. D. (eds) 2014: Crisis Management and the ChangingRole of the State. University of Szeged Doctoral School in Economics, Szeged, pp.
133-145
18
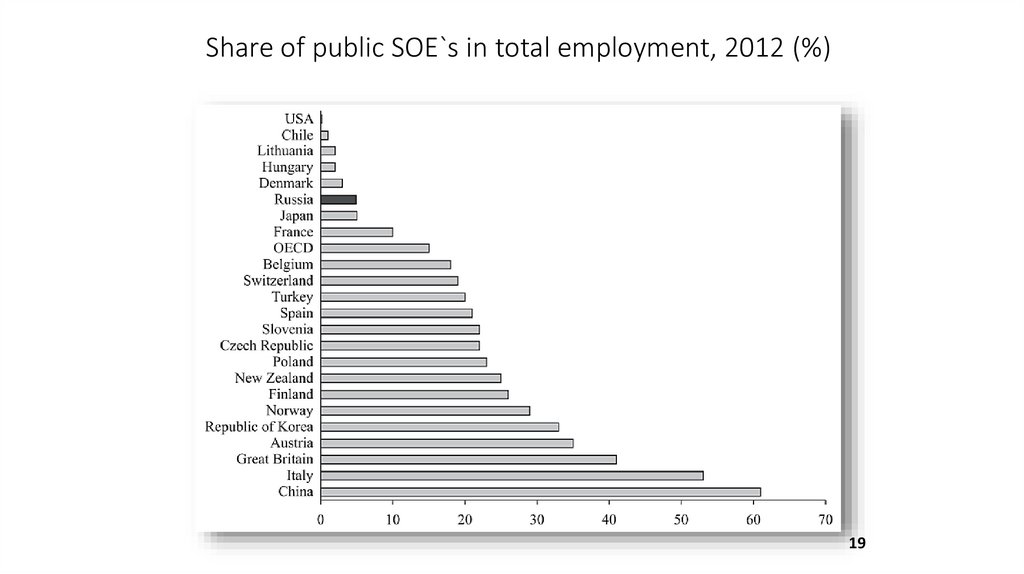
86.
Share of public SOE`s in total employment, 2012 (%)19
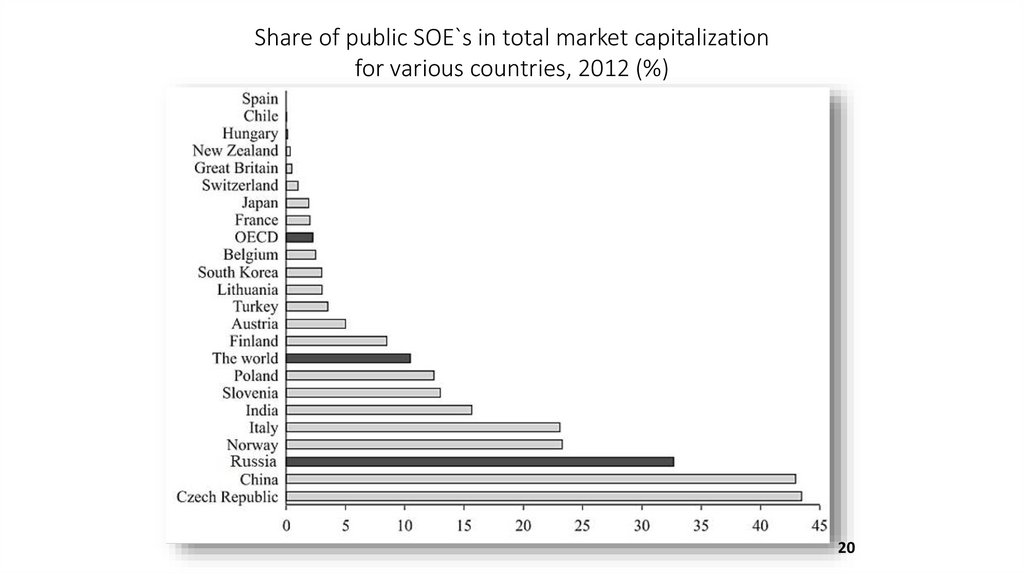
87.
Share of public SOE`s in total market capitalizationfor various countries, 2012 (%)
20
88. Privatization revenues, 1990-1999, bill. dollars
Countries/years
1990
1991
1992
1993
1994
1995
1996
1997
1998
1999
Argentina
7,5
2,8
5,7
4,7
0,89
1,2
0,64
4,4
0,51
16,16
Brazil
0,04
1,6
2,4
2,6
2,1
0,99
5,7
18,7
32,4
4,4
Mexico
3,16
11,3
6,9
2,1
0,77
0,17
1,5
4,5
0,99
0,29
Hungary
0,48
0,79
0,78
1,7
1,5
3,9
0,95
2,1
0,34
1,4
Poland
0,06
0,34
0,24
0,73
0,64
0,98
0,61
2,2
2,44
3,9
Russia
-
0,04
0,09
0,11
0,84
1,0
1,2
4,2
0,91
0,76
Turkey
0,44
0,21
0,78
0,48
0,35
0,57
0,29
0,47
1,01
0,04
Source: Goskomstat, Jan.2002, World Bank Privatization Database, Global
Development Finance 2001
21
89. Outcome of privatization in Russia
Politicians and Reformers may believe in their decisionsBut actual results are the genuine judge for the solution!
Big assets left with the state or gone to oligarchs
Small property – local solutions, low competition
Difficulty with property rights for businesses
Corruption with a weak state
Real role and value of vouchers is unknown
Mass ownership of shares never materialized
Debt for shares of 1996 – and elections
Disillusion of masses by 1993 – and by 1996
Crush 1998 and return of the state later on
22
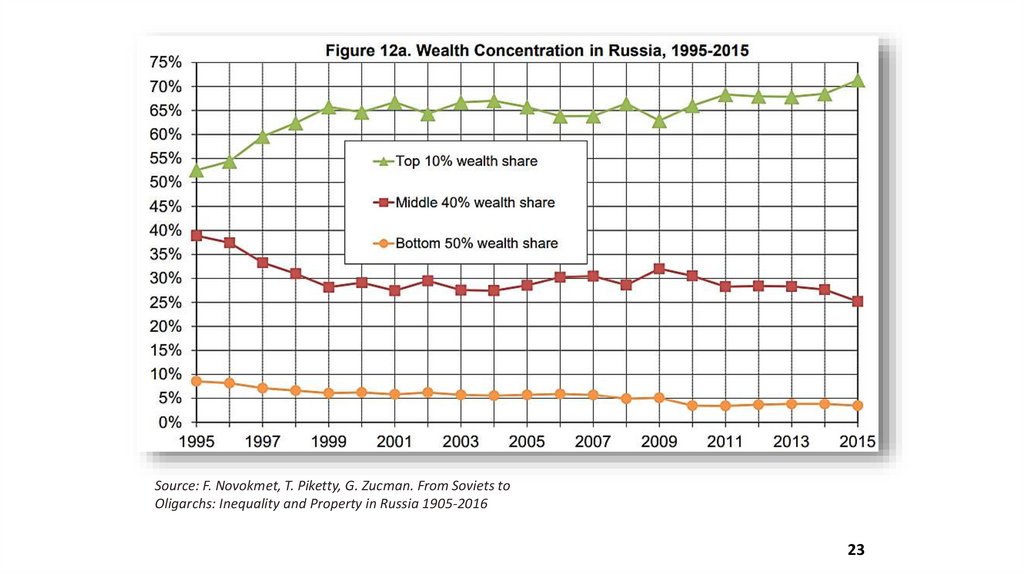
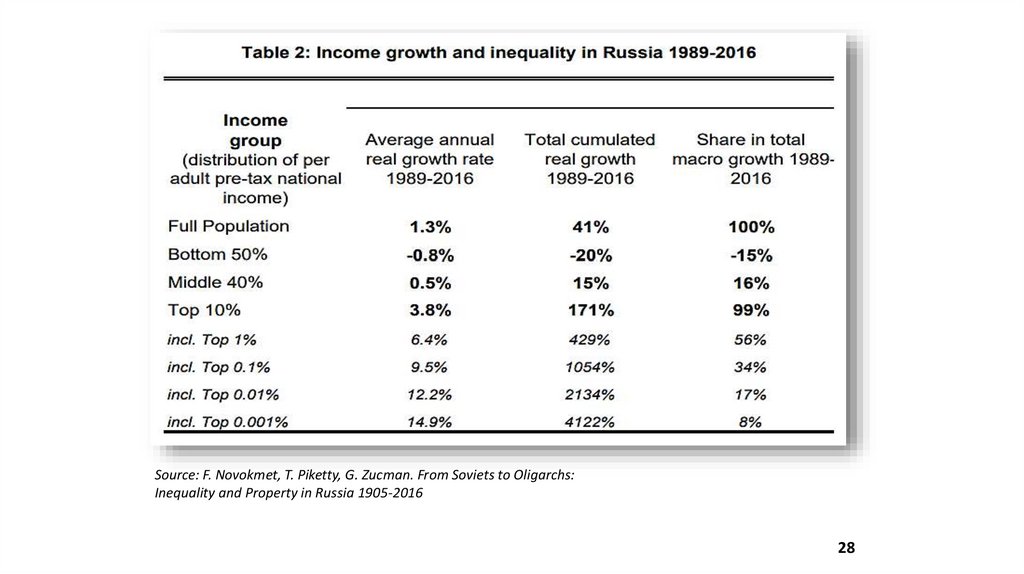
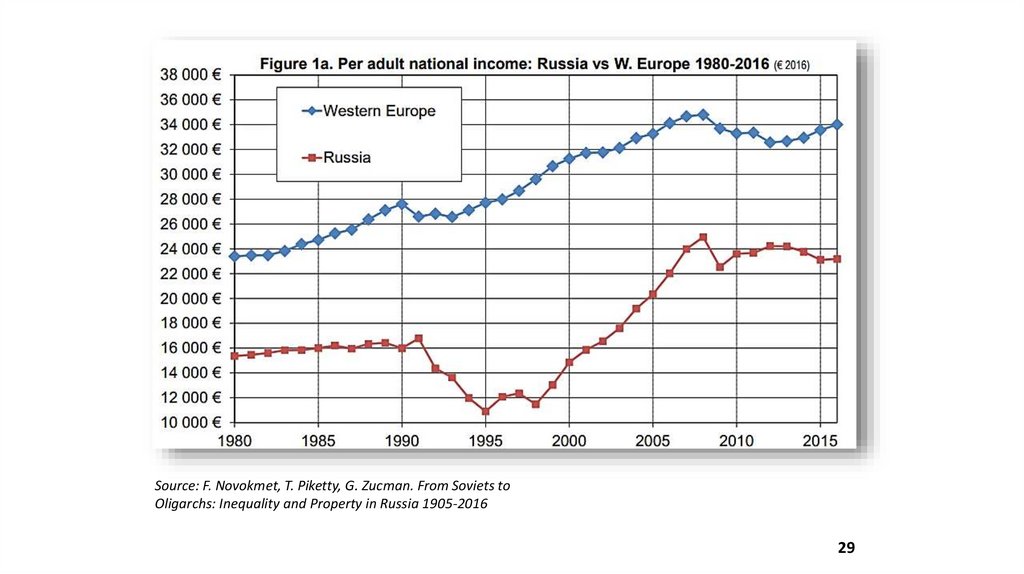
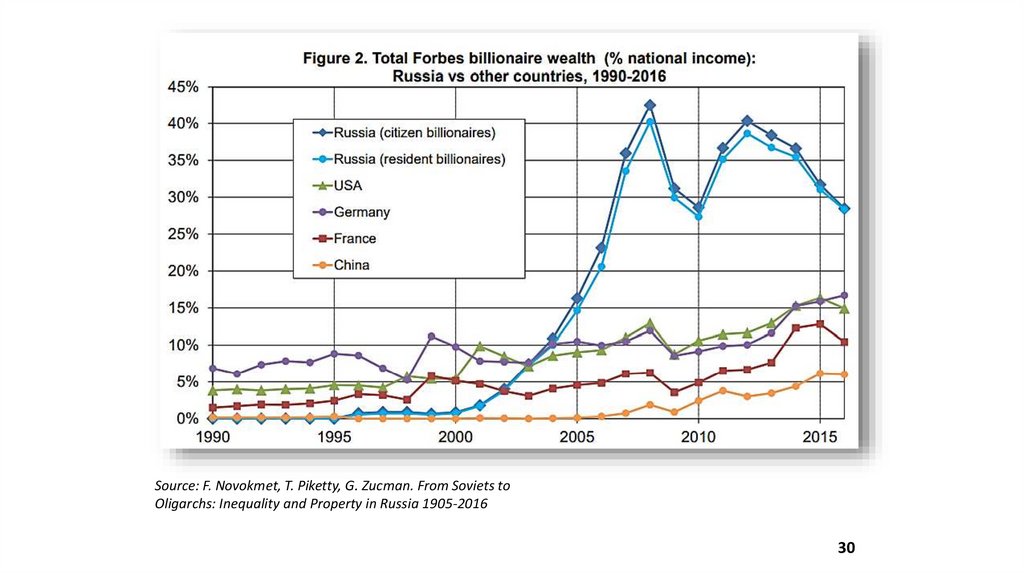
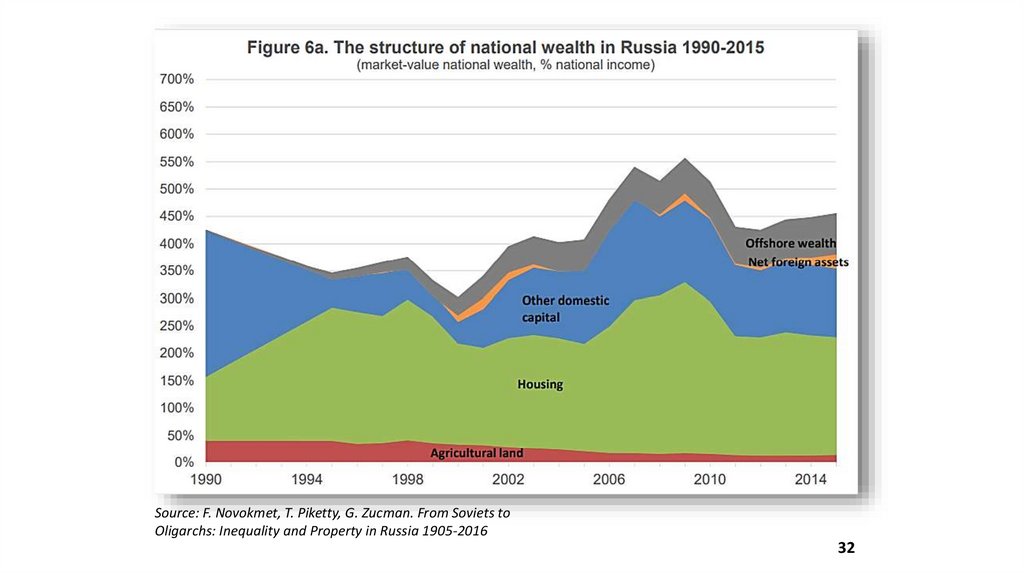
90.
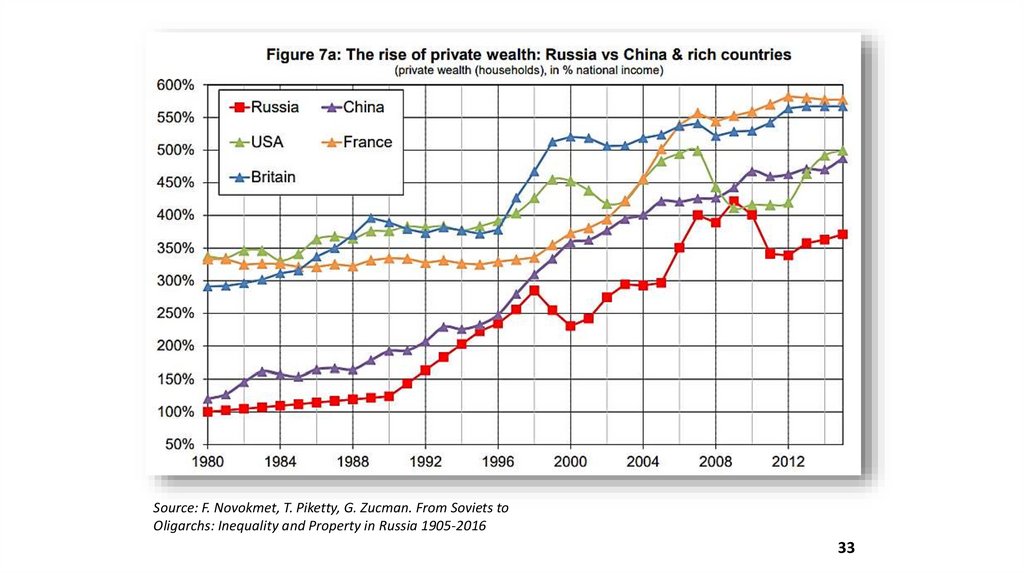
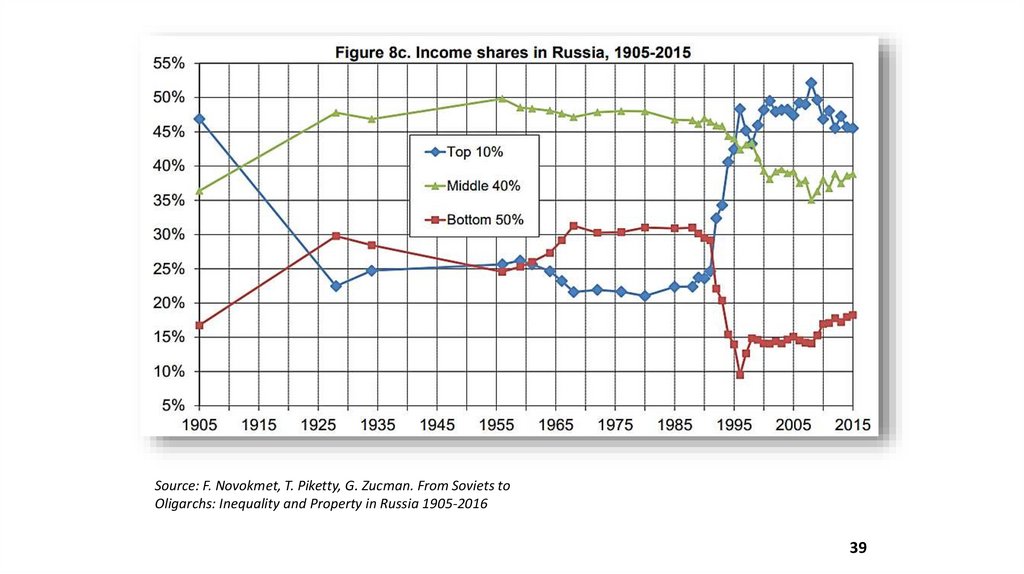
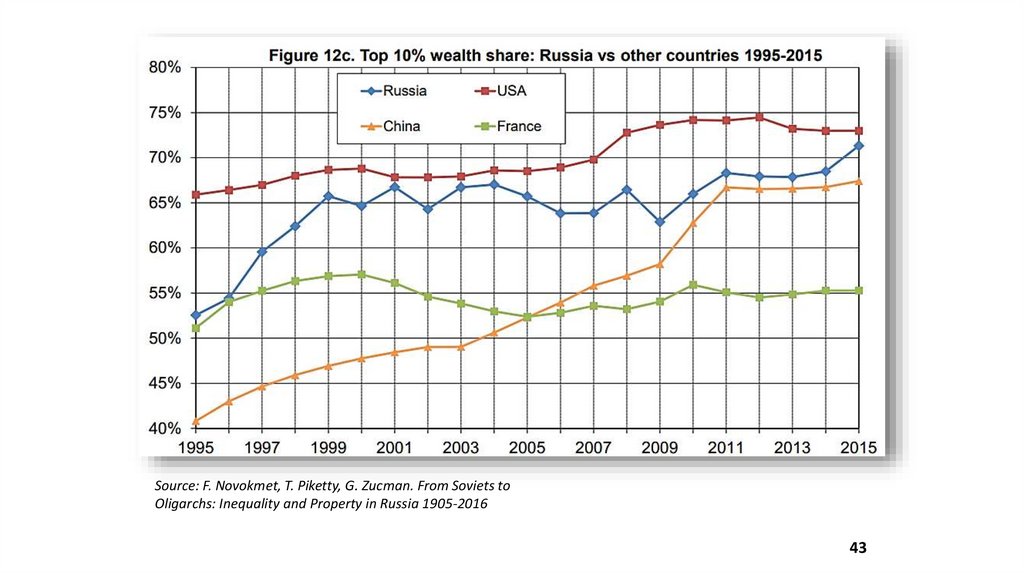
Source: F. Novokmet, T. Piketty, G. Zucman. From Soviets toOligarchs: Inequality and Property in Russia 1905-2016
23
91. SOE shares among countries’ top ten firms (%), 2013
Source: State-owned enterprises in theglobal economy // WEF
24
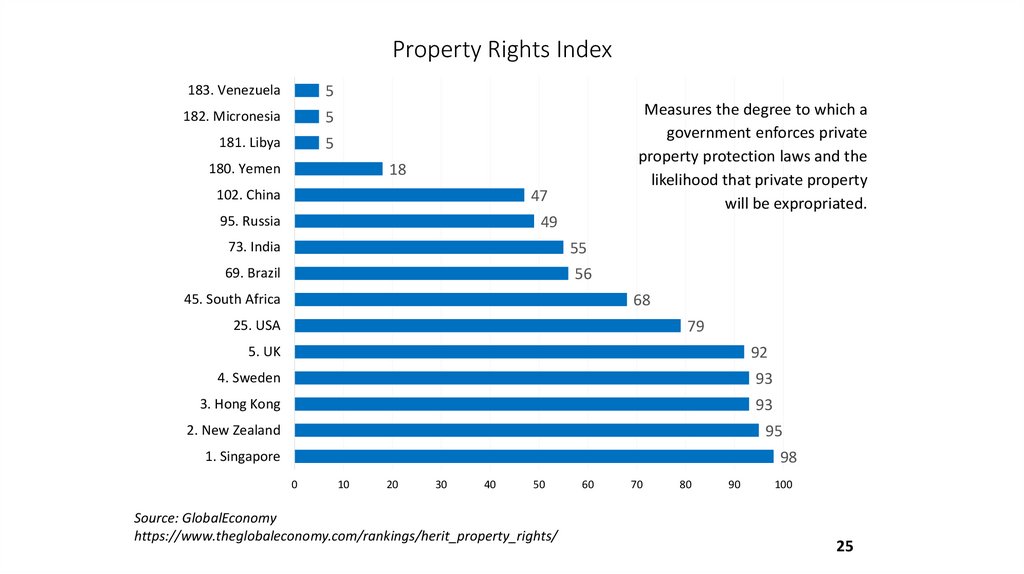
92.
Property Rights Index183. Venezuela
5
182. Micronesia
5
181. Libya
5
180. Yemen
Measures the degree to which a
government enforces private
property protection laws and the
likelihood that private property
will be expropriated.
18
102. China
47
95. Russia
49
73. India
55
69. Brazil
56
45. South Africa
68
25. USA
79
5. UK
92
4. Sweden
93
3. Hong Kong
93
2. New Zealand
95
1. Singapore
98
0
10
20
30
40
50
Source: GlobalEconomy
https://www.theglobaleconomy.com/rankings/herit_property_rights/
60
70
80
90
100
25
93. Calculations of Piketty and Co
Russia made its way to high concentration of Property in1993-1996 – superior to Old West! (Long before Putin)
Was it a goal of Reformers?
Top private companies without mass shareholding.
State companies encroaching on private business.
Big enterprises under old managers or mirky characters.
Low dividends, while high Rate of Return.
Big money made in 1990-s and Offshore camping.
Low market valuation = closely held companies.
26
94.
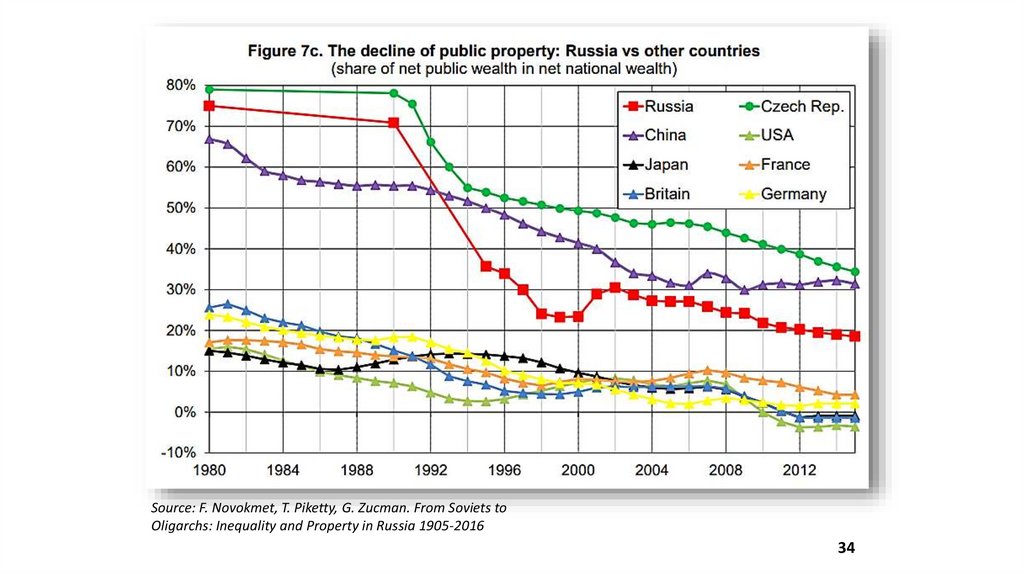
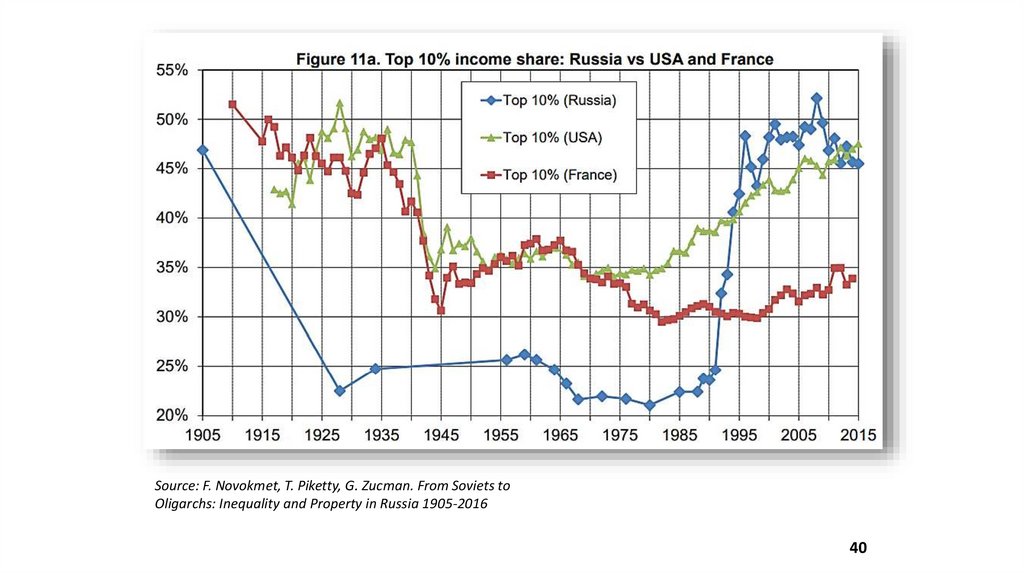
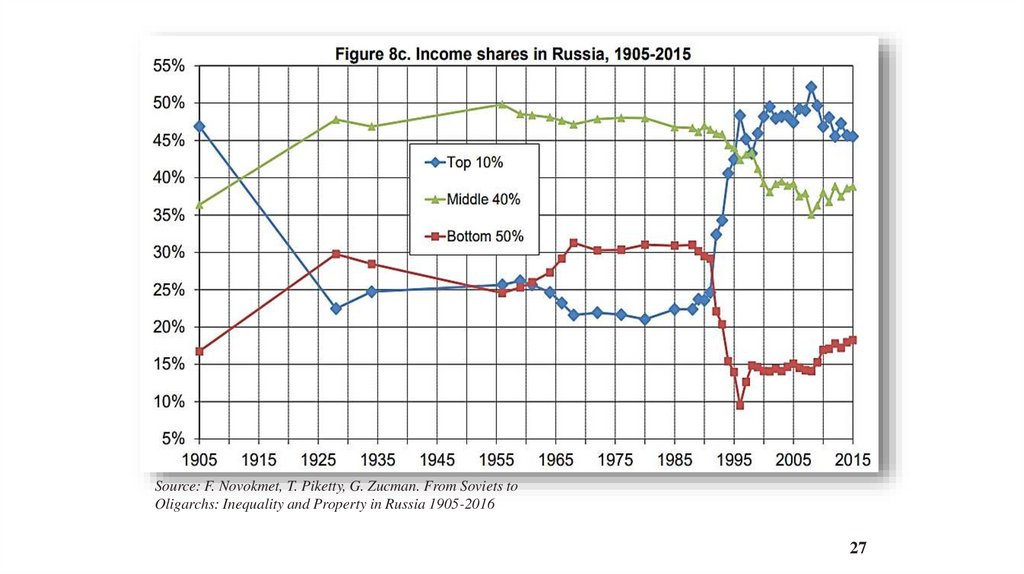
Source: F. Novokmet, T. Piketty, G. Zucman. From Soviets to Oligarchs:Inequality and Property in Russia 1905-2016
27
95.
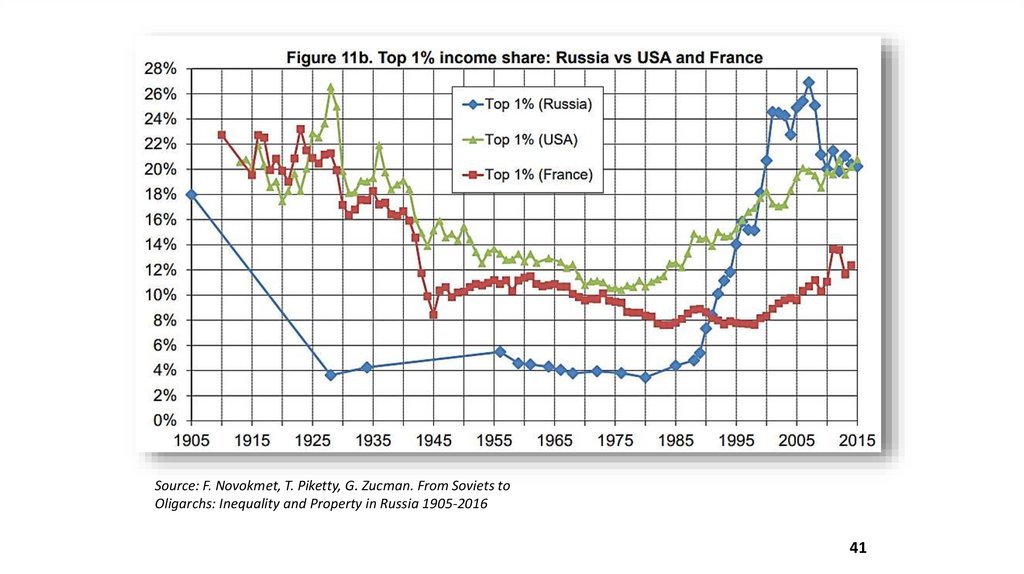
Source: F. Novokmet, T. Piketty, G. Zucman. From Soviets to Oligarchs:Inequality and Property in Russia 1905-2016
28
96.
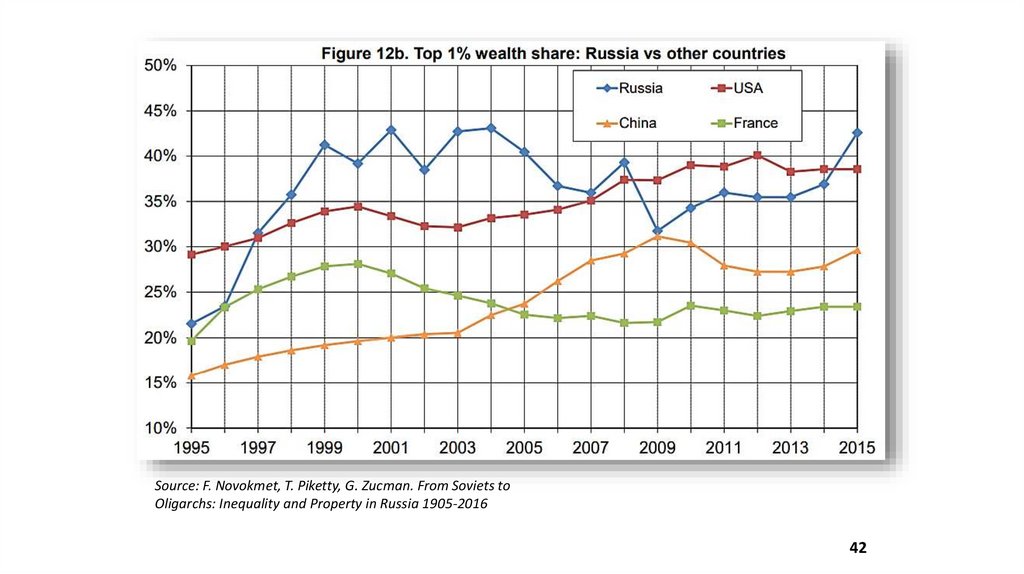
Source: F. Novokmet, T. Piketty, G. Zucman. From Soviets toOligarchs: Inequality and Property in Russia 1905-2016
29
97.
Source: F. Novokmet, T. Piketty, G. Zucman. From Soviets toOligarchs: Inequality and Property in Russia 1905-2016
30
98.
Source: F. Novokmet, T. Piketty, G. Zucman. From Soviets toOligarchs: Inequality and Property in Russia 1905-2016
31
99.
Source: F. Novokmet, T. Piketty, G. Zucman. From Soviets toOligarchs: Inequality and Property in Russia 1905-2016
32
100.
Source: F. Novokmet, T. Piketty, G. Zucman. From Soviets toOligarchs: Inequality and Property in Russia 1905-2016
33
101.
Source: F. Novokmet, T. Piketty, G. Zucman. From Soviets toOligarchs: Inequality and Property in Russia 1905-2016
34
102. Byproducts of Wealth Distribution
Inequality may be measured differently. Might havebeen a correct approach – to look at the distribution
along society!
Best major = Share of income belonging to 10th decile.
Gini is difficult for interpretation – the most of variety
connected to the share of the Rich. The rest is similar.
Share of 1% is impressive but mostly reflects the
fluctuation of the stock pricing. Passive ownership!
The 10th decile normally concentrates households
from Upper Class and Upper Middle Stratum.
Once formatted the Inequality becomes rigid.
35
103.
Wealth share of topdecile by country,
2000-2014
Russia
Latin America
Mexico
Argentina
Brazil
Chile
Anglo-Saxon and Israel
United Kingdom
United States
Israel
South&East Europe
Italy
Spain
Greece
Poland
Central&North Europe
France
Germany
Netherlands
Sweden
Czech Republic
Switzerland
Africa
South Africa
Asia&…
Japan
India
China
Year
2000 (%)
2001 (%)
2014 (%)
2014-2000
(pp)
GDP per capita Income share
(PPP, current) held by highest
2014
10%
77,1
76,7
84,8
7,70
24 805
31
68,9
63,1
69,4
67,6
63,2
61,3
69,4
62,7
64,4
71,8
73,3
68,9
-4,50
8,70
3,90
1,30
17 880
22 582
16 096
22 971
38,9
31,8
41,7
24,2
51,5
74,6
62,4
52,4
74,7
65,4
54,1
74,6
67,3
2,60
0,00
4,90
39 510
54 596
32 691
28,6
29,6
31,3
52,6
54,1
54,8
69,9
47,9
52,4
49
60,5
51,5
55,6
56,1
62,8
-1,10
1,50
1,30
-7,10
35 486
33 711
25 858
25 105
26,2
25,2
26,2
25,9
56,4
63,9
55,2
69,7
62,7
73,4
51
61,5
53,5
68,8
60,1
71,9
53,1
61,7
54,8
68,6
67,3
71,9
-3,30
-2,20
-0,40
-1,10
4,60
-1,50
40 374
45 888
47 354
45 986
29 925
58 087
24,7
24,4
22,9
21,4
22,2
72,2
69,1
71,7
-0,50
13 046
53,8
51
65,9
48,6
49,1
73,6
58,7
48,5
74
64
-2,50
8,10
15,40
37 389
5 855
12 879
24,8
28,8
30
Source:
The World Bank
Global Wealth
Databook 2014
(Credit Suisse)
104.
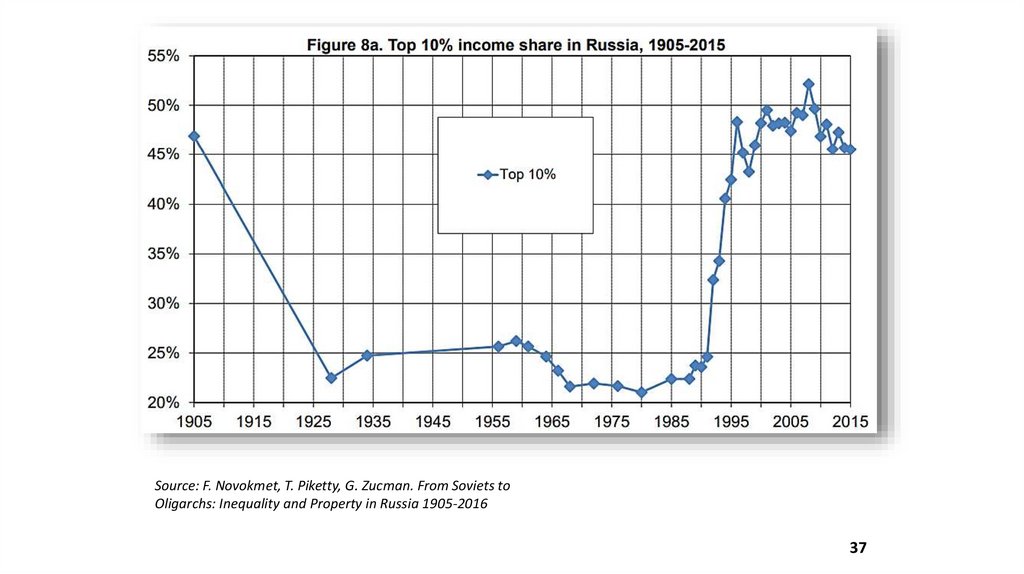
Source: F. Novokmet, T. Piketty, G. Zucman. From Soviets toOligarchs: Inequality and Property in Russia 1905-2016
37
105.
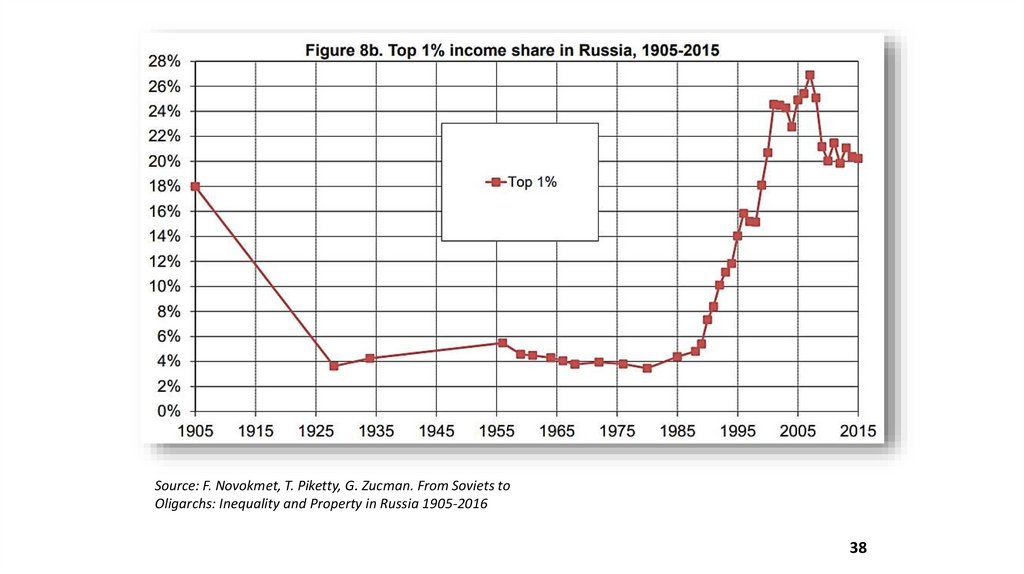
Source: F. Novokmet, T. Piketty, G. Zucman. From Soviets toOligarchs: Inequality and Property in Russia 1905-2016
38
106.
Source: F. Novokmet, T. Piketty, G. Zucman. From Soviets toOligarchs: Inequality and Property in Russia 1905-2016
39
107.
Source: F. Novokmet, T. Piketty, G. Zucman. From Soviets toOligarchs: Inequality and Property in Russia 1905-2016
40
108.
Source: F. Novokmet, T. Piketty, G. Zucman. From Soviets toOligarchs: Inequality and Property in Russia 1905-2016
41
109.
Source: F. Novokmet, T. Piketty, G. Zucman. From Soviets toOligarchs: Inequality and Property in Russia 1905-2016
42
110.
Source: F. Novokmet, T. Piketty, G. Zucman. From Soviets toOligarchs: Inequality and Property in Russia 1905-2016
43
111. Literature:
Kornai Y. The Socialist System: The Political Economy ofCommunism. Oxford University Press, chapter 3, 1992.
Biais B. and Perotti E. "Machiavellian Privatization"
The AER, Vol. 92, No. 1 (March, 2002), pp. 240-258 .
Brown J. David, Earle S. John, and Scott Gehlbach
"Privatization" // The Oxford Handbook of the Russian
Economy Edited by Alexeev M. and Weber Sh., 2012
Hoff K., J. Stuglitz "The creation of the rule of law and
the legitimacy of property rights: the political and
political and economic consequences of a corrupt
privatization"
44
112. Leonid Grigoryev – some publications
publicationsGrigoryev L. "Ulterior Property Rights" (chapter) in "The Post-Soviet
Economy". Edited by A. Ausland, Pinter, London, 1992;
"Transition to Market Economy" (in collaboration), Moscow, 1990 OR
"500 days. Transition to the Market", St. Martins Press, NY, 1991;
"Conflicts of interests and Coalitions. //"Pro et Contra", September 2007.
"Mechanisms of Global Governance: economic analysis" (with AKudin).
// "Voprosy Ekonomiki", 7, 2013, pp. 4-28.
"The elites’ demand for law: Overcrowded streetcar (tram) effect" // The
Russian Journal of Economics, #3 – 2015, pp 313-327.
«Transformation: For the people or for the elite?» - in "The Social History
of Post-Communist Russia", Edited by P. Dutkiewicz, V. Kulikov and R.
Sakwa. Routledge, NY, 2016, pp. 58-80.
45
113. Global Structure Inequality: Income and Wealth (4.02. 2019)
Tenured Professor Leonid GrigoryevHigher School of Economics, Moscow
www.leonidgrigoryev.com
114. Births, Deaths And Natural Increase Dynamics in Russia, 1960-2015
19601961
1962
1963
1964
1965
1966
1967
1968
1969
1970
1971
1972
1973
1974
1975
1976
1977
1978
1979
1980
1981
1982
1983
1984
1985
1986
1987
1988
1989
1990
1991
1992
1993
1994
1995
1996
1997
1998
1999
2000
2001
2002
2003
2004
2005
2006
2007
2008
2009
2010
2011
2012
2013
2014
2015
1960-2015
25
20
15
10
5
0
-5
-10
Death rate, crude (per 1,000 people)
Birth rate, crude (per 1,000 people)
Прирост
Growth
2
115. World Population and GDP in Various Dimensions, 1992–2016
World Population and GDP in Various Dimensions, 1992–2016
1992
2000
2008
2016
World
5,5
4,3
48,7
6,1
4,9
63,3
6,8
5,4
87,1
7,4
6,1
112,2
World without China
46,5
58,6
76,6
92,3
World
8,9
10,3
12,9
15,1
World without China
10,8
12,1
14,1
15,2
World
–
16,0
24,5
17,0
World without China
–
11,4
16,7
8,1
China
World
–
39,1
99
50,0
115
64,3
81
77,6
World without China
38,1
47,8
59,3
68,0
World
7,2
8,2
9,5
10,4
World without China
8,9
9,8
10,9
11,2
Indicator
World population, bill.
people
GDP (PPP), trillion int. doll.
GDP per capita by PPP,
thousand int. doll.
Increase in average GDP
(PPP) per capita, %
GDP, trillion post. USD
(2010)
GDP per capita, thousand.
post. USD (2010)
World
World without China
11
5
116. Key points (1/2):
Inequality between countries changes, Clusters goapart.
Global economic growth has not changed the key
parameter – the share of 10th decil in the most of the
developed and developing countries – 2014;
Between 1992 and 2016 the global GDP (PPP) per capita
had grown by 40%. But except for success of few
countries (China etc.) the inequality by countries has not
changed in many respects; China also got Inequality.
Great Recession somewhat reduced top incomes in
some countries, but in the upturns the Rich gets the
Premium – not the Poor or the Middle.
4
117. Key points (2/2):
Domestic inequality is rigid, Growth is not changingdistances for deciles.
As we know, a number of the Governments turned
now on the Rich for better collection of taxes, and
Public – for less rewards for Managers.
High Inequality in Anglo-Saxon countries connected
with strong Vertical lifts.
Transitional Inequality appears quite stubborn.
China has formatted high inequality in 30ty years of
fast economic growth.
5
118. Gini coefficient reflects mostly variation in rich deciles. Gini in comparison with IS -10th
Income share owned by top 10%60
50
40
Canada
30
Australia
20
y = 0,7555x + 1,233
R² = 0,9392
10
10
20
30
40
50
60
70
Gini ratio
6
119. Average and weighted average GDP per capita, PPP current prices (thousand USD and thousand int. dollars), 174 countries, 1992
and 201611
9
120. UN sustainable development goal №10. Reduce inequalities (1/2)
Socio-economic parameters of various countries, 2000 and 2013/14Indicator
Year
Russia
Users (per 100
persons)
2000
Labor force with
tertiary education
(% of the total)
Expenditure on R&D
(% of GDP)
USA Germany Brazil
Spain
Poland
2.0
43.1
30.2
2.9
13.6
7.3
2014
70,5
87.4
86.2
57.6
76.2
66.6
2000
24.8
(2002)
34.8
23.5
–
26.7
12.3
2014
56.3
(2013)
33.8
27
13.4
(2013)
37.2
31
2000
1.0
2.6
2.4
1.0
0.9
0.6
2013
1.1
2.8
(2012)
2.9
1.2
(2012)
1.2
0.9
8
121. Income Inequality – International Comparison, 2014 or latest available
CountryRussian
Federation
Mexico
Brazil
Argentina
Chile
United States
United Kingdom
Israel
Italy
Spain
Greece
Hungary
Poland
Bulgaria
Ukraine
France
Germany
Netherlands
Sweden
Czech Republic
GDP per
capita (PPP),
GINI
2011, 2016,
index, %
thousand
U.S. $
23,2
17,9
15,1
19,9
24,0
57,5
42,6
37,9
38,2
36,3
26,8
26,7
27,8
19,2
8,3
41,5
48,7
50,9
49,2
34,7
41,59
48,21
51,48
42,67
50,45
41,06
32,57
42,78
35,16
35,89
36,68
30,55
32,08
36,01
24,09
33,1
30,13
27,99
27,32
26,13
Income share held by
lowest
10%
lowest
20%
second
20%
third
20%
fourth
20%
highest
20%
highest
10%
2,3
1,9
1,2
1,6
1,7
1,7
2,9
1,7
1,9
1,7
1,7
3,0
3,3
2,0
4,5
3,1
3,4
3,4
3,2
3,9
5,9
5,1
3,6
4,8
4,6
5,1
7,5
4,6
6,2
5,8
5,6
7,8
8,0
6,2
10,5
7,8
8,4
8,9
8,7
9,6
10,1
8,8
7,9
9,6
8,3
10,3
12,3
9,6
12,3
11,9
11,7
13,4
12,5
12,2
14,6
12,6
13,1
13,9
14,3
14,5
14,5
12,7
12,6
14,9
12,1
15,4
17,0
15,5
17,0
17,0
17,2
17,6
16,8
16,6
18,0
16,5
17,2
17,6
17,8
17,9
21,2
18,9
19,6
22,9
18,3
22,7
23,1
22,9
22,8
23,5
23,3
22,7
22,6
22,4
22,4
21,8
22,7
22,5
23,0
21,9
48,3
54,5
56,3
47,8
56,7
46,4
40,1
47,4
41,7
41,8
42,3
38,6
40,2
42,7
34,7
41,2
38,6
37,1
36,2
36,1
32,2
39,7
40,7
30,8
41,5
30,2
24,7
31,3
26,3
25,9
26,7
23,9
25,2
27,4
20,6
26,8
23,7
22,6
21,5
22,2
122. Personal Consumption in Selected Countries, 2016
WorldBrazil
South Africa
Russia
China
India
Kazakhstan
Belarus
Turkey
Poland
Ukraine
Developed
countries
Canada
Japan
USA
France
Germany
Italy
UK
Source: Euromonitor
Share of personal
consumption in GDP,
%
56,7
Share of different product types in consumption, %
Durable
9,2
Semi-durable
7,4
Non-durable
28,9
Services
54,5
61,8
61,1
49,1
38,6
59,1
53,4
53,1
62,9
58,5
64,8
10,2
8,2
12,1
7,3
3,3
5,9
11,9
18,3
10,5
8,0
7,6
8,4
7,0
9,5
8,3
12,1
8,9
5,7
7,5
6,6
39,3
39,9
49,1
34,7
41,0
53,9
53,0
38,3
43,2
56,8
43,0
43,4
31,8
48,5
47,4
28,1
26,2
37,6
38,8
28,6
59,3
9,5
7,2
23,0
60,3
56,2
54,8
67,3
53,4
50
61,2
61,3
12,9
8,2
8,8
9,1
11,2
8,5
10,1
7,3
5,6
6,7
7,6
9,1
8,1
10,8
23,9
27,3
17,8
30,6
27,3
34,0
21,5
55,9
59,0
66,6
52,6
52,3
49,3
57,7
10
123. Attitudes and Happiness
Transformation has reduced expectations of statesupport. Not Russia is the center of paternalism
Connection between level of development (GDP
per capita) and happiness is limited
Fully satisfied share among the people with
highest income in BRICS countries in 1990-2014 is
about one quarter, and it’s not the simple function
of level
By countries the distributions of satisfaction of life
in Brazil and Russia are on opposite in one aspect:
28.7% fully satisfied in Brazil and 6,6% - in Russia.
GDP level per head of both countries are similar
11
124. The degree of agreement of respondents with the statement “Government should reduce differences in income levels” - country
average (ESS)** 1 - "strongly agree", 5 - "strongly disagree"
12
125. Level of life satisfaction in BRICS countries by income level, 1990-2014, %
Income levelLowest
2
3
4
5
6
7
8
9
Highest
Fully NOT
satisfied
13,2
7,8
5,4
4,4
3,5
2,6
2,0
1,8
2,8
3,9
2
5,8
6,6
3,9
2,3
2,2
1,4
1,8
1,8
1,5
1,5
3
8,5
10,3
10,6
6,7
5,1
3,1
3,0
3,4
5,6
2,5
4
7,3
6,2
6,7
6,5
5,2
4,2
3,7
3,6
4,7
2,5
5
17,1
20,2
21,1 18,9 17,4 12,2 11,7 10,5 12,8
9,2
6
8,2
8,7
9,6
8,2
8,2
7
8,5
10,9
13,1 15,2 15,6 17,8 16,8 15,7 13,0
14,2
8
9,7
11,6
12,6 15,6 16,9 21,3 22,7 23,8 20,1
20,5
9
5,3
5,9
6,4
10,6 12,9 16,1 15,4
11,3
16,5
11,8
10,8 11,9 14,7 14,7 15,9 15,1 15,9
26,2
100
100
100
100
Fully satisfied
Total
100
11,4 11,1 12,0
7,3
8,3
100 100
100
9,5
8,1
100 100 100
13
126. Level of life satisfaction in BRICS countries, 1990-2014, %
Level of life satisfaction in BRICS countries, 19902014, %BRICS
Brazil
China
India
Russia
South
Africa
5,3
2,3
2,7
5,8
8,0
5,8
3,3
1,2
2,8
3,4
4,7
3,3
3
6,6
1,9
3,9
11,2
9,0
5,0
4
5,6
2,8
4,8
3,6
9,1
6,4
5
16,4
12,2
11,6
25,8
19,9
12,2
6
10,0
7,6
13,9
7,2
11,2
9,9
7
13,9
12,3
14,8
15,7
12,7
13,4
8
16,2
19,6
21,7
9,6
13,6
17,9
9
8,7
11,4
10,7
5,1
5,3
10,9
Fully satisfied
14,1
28,7
13,1
12,5
6,6
15,2
Total
100
100
100
100
100
100
Fully NOT
satisfied
2
14
127. Access to Internet, mobile phone and personal computer usage, % households, 2010, 2015
Access to Internet, %Mobile phone, %
Personal computer, %
Country
2010
2015
2010
2015
2010
2015
Germany
72,9
85,6
93
99,1
80,8
88,3
Spain
59,1
77
94,6
96,6
69
79,1
Poland
63,4
76,8
91,8
96,4
68,7
75,2
Russia
41,3
72
85,8
96,2
55
72,8
Brazil
27,1
50,6
88,8
94,9
34,9
54,2
China
23,7
50,3
88,9
94
35,4
48,1
South
Africa
10,1
39,5
89,8
93,9
18,3
29,7
India
4,2
17,1
55,7
76,2
6,1
14,2
15
128. Russia: from quasi egalitarian to?
Yasin’s work of 2010: only top 20% are better off to1991; 4th quintal a bit better; 3d is “the same”; two
other much lower.
Please, mark: we do not have a systematic picture of re
stratification. We definitely know that the most of
surveys give the same response from the citizens – big
privatization is not legitimized after quarter a century,
But no political forces are claiming nationalization or
any serious redistribution of the assets,
Intellectuals are more concerned about lost
generations for children, emigration and losses in arts
and sciences.
Relatively high growth in 2000-2014 came too late for
compensation for long losses for the most of people.
16
129. Real cash income dynamics by 20% - income groups, 1991–2009 гг., %
E.Yasin et all, 2011 - HSE17
130. Re-stratification of the society
I could not find a study of the “navigation” of socialgroups between 1990 and 2000,
Yasin’s study indicate 5th quintile doubled its income
(constant prices) by 2007. Warning: it’s NOT the same
5th quintile of 1990 but “mixture”.
All people from the budget sector without skills for
new market suffered probably the worst,
Intellectuals were without big advantages in the SU,
but respected and had interesting occupations which
were lost,
Length of the recession was another key issue: 10
years (1990-1999) V recession in the CEE (1989-1994).
Here comes the fight for assets, corruption and
banditry.
18
131. Seven Stratas of Society
Upper class – income, rent, etc.: (1) Upper upper and (2)Lower upper. Small part of the society (except for the USA).
Middle class – the question of definitions. Historical middle
class (before Karl Marks). Mark’s Class and Middle Class –
what’s now?
Middle class in developed and developing countries: the
capital – province, formation.
(3) Upper Mid., (4) Middle Mid., (5) Lower Mid. – up to 70%
in developed, distinctions with developing
3 layers – general: earn by themselves, education, property
(apartments, etc.), savings, behaviour, self-identification,
firmness.
Lower: (6) Upper lower (workers); (7) Lower lower (lumpens)
– by countrie
131
132. Russia: Middle class structure in 2000s (T. Maleva)
Socioprofessionalstatus
Income
21,2%
21,9%
6,9%
39,5%
Selfidentification
20
133. Dynamics of inequality in Russia (1/2)
High social inequality in Russia has formed in the1990s;
Since 2000 the distribution of the population
incomes by 20% groups (quintiles) remained
practically unchanged;
The significant economic growth of 2000-2008
did not lead to the inequality reduction, although
nominal per capita incomes increased significantly.
13
3
134. Dynamics of inequality in Russia (2/2)
Share of income by 20-percent groups of population, %Source: Rosstat
13
4
135. Transformation of society: features
features10 years of economic decline (minus 43) lead to different
cumulative degree of income loss by strata,
Destruction of wellbeing, plans, financial assets (hyper
inflation and bank failure); deterioration of housing etc.
Main suffered groups ay first: industry workers, teachers,
military personnel
By the way – impoverished society supports teachers, doctors
and priests at its own ”above bottom” level,
Winners take it all! Formation of entrepreneurs and owners not an over night story. Good instincts but bad traders,
Income structure was set by 2000 – practically no change.
Top 10% comprises high classes plus upper middle strata.
13
5
136. Income and Wealth Inequality
Inequality has a long history – in Europe and in Asia.Estimated Gini=50% in XIX Century
In 1920 – it goes down, after 1980 – soars
Business cycles and trends – usual effects
Gini is not the best, unlike the share of 10% (decile)
Table on Income corresponds to Wealth inequality
(mostly financial wealth)
THE WEALTH REPORT – see for yourselves
Share of Wealth of 10% = USA = 75%, China = 65%,
Russia =85%, Italy= 52%, the Netherlands = 55%
24
137.
Wealth share of top decile by country, 2000-2014 (The World Bank Global Wealth Databook 2014 (Credit Suisse)Year
Russia
Latin America
Mexico
Argentina
Brazil
Chile
Anglo-Saxon and Israel
United Kingdom
United States
Israel
South&East Europe
Italy
Spain
Greece
Poland
Central&North Europe
France
Germany
Netherlands
Sweden
Czech Republic
Switzerland
Africa
South Africa
Asia&…
Japan
India
China
GDP (PPP) per
capita, current,
2014
24 805
Income share
held by highest
10%
31
2000 (%)
2001 (%)
2002 (%)
77,1
76,7
84,8
2014-2000
(ppp)
7,70
68,9
63,1
69,4
67,6
63,2
61,3
69,4
62,7
64,4
71,8
73,3
68,9
-4,50
8,70
3,90
1,30
17 880
22 582
16 096
22 971
38,9
31,8
41,7
24,2
51,5
74,6
62,4
52,4
74,7
65,4
54,1
74,6
67,3
2,60
0,00
4,90
39 510
54 596
32 691
28,6
29,6
31,3
52,6
54,1
54,8
69,9
47,9
52,4
49
60,5
51,5
55,6
56,1
62,8
-1,10
1,50
1,30
-7,10
35 486
33 711
25 858
25 105
26,2
25,2
26,2
25,9
56,4
63,9
55,2
69,7
62,7
73,4
51
61,5
53,5
68,8
60,1
71,9
53,1
61,7
54,8
68,6
67,3
71,9
-3,30
-2,20
-0,40
-1,10
4,60
-1,50
40 374
45 888
47 354
45 986
29 925
58 087
24,7
24,4
22,9
21,4
22,2
72,2
69,1
71,7
-0,50
13 046
53,8
51
65,9
48,6
49,1
73,6
58,7
48,5
74
64
-2,50
8,10
15,40
37 389
5 855
12 879
24,8
28,8
30
13
7
138. UN sustainable development goal №10. Reduce inequalities (2/2)
Distribution of financial income of the population in Russia,by quintiles, %, 1970-2015
Share of population quintiles, %
Year
First (With
The Least
Income)
Second
Third
Fourth
Fifth (With
The Most
Income)
1970
7.8
14.8
18.0
22.6
36.8
1980
10.1
14.8
18.6
23.1
33.4
1990
9.8
14.9
18.8
23,8
32.7
1999
6.0
10.5
14.8
21.1
47.6
2008
5.1
9.8
14.8
22.5
47.8
2015
5.3
10.0
15.1
22.8
47.0
26
139.
Source: F. Novokmet, T. Piketty, G. Zucman. From Soviets toOligarchs: Inequality and Property in Russia 1905-2016
27
140.
Source: F. Novokmet, T. Piketty, G. Zucman. From Soviets toOligarchs: Inequality and Property in Russia 1905-2016
28
141.
Source: F. Novokmet, T. Piketty, G. Zucman. From Soviets toOligarchs: Inequality and Property in Russia 1905-2016
29
142. Conclusion: Russia
Russia has made the detour from European incomedistribution to Latin American one. We recorded it in
2000 – now it’s the stable result of transition.
Inequality is similar to Anglo – Saxon, but Russia lacks the
that vertical mobility and entrepreneurship.
Financially sustainable middle class is within 30% of
households, and little has changed in the upturn of
2000s.
Distribution in Russia – judging by the income share of
top 10% of population – is quite Latin American.
The State has some degree of “independence” from taxpayers due to high oil-rent.
Political system is based on the weak middle class and
weak civil society
30
143.
31144. Literature – 1
• Atkinson Anthony “Inequality. What can be done?”, Cambridge, Harvard Un. Press, 2015.• Grigoryev Leonid, Alla Salmina “Inequality in Russia during transformation: to Europe or Latin America?”,
IPSA-ECPR Joint Conference, Sao Paulo, 2011
• Grigoryev Leonid. Russia in the System of Global Economic Relations // Russia in Global Affairs. Delhi, 2016,
pp. 498-512.
• Kuznets Simon. Economic growth and income inequality // Am. Ec. Review. 1955, vol. 45. №1, P. 1-28.
• Milanovic Branko. Income, Inequality, and Poverty during the Transition from Planned to Market Economy
// WorldBank Regional and Sectoral Studies, 1998. Available at:
http://documents.worldbank.org/curated/en/229251468767984676/pdf/multi-page.pdf.
• Milanovic Branko. Income, Inequality, and Poverty during the Transition from Planned to Market Economy.
Available at: http://documents.worldbank.org/curated/en/229251468767984676/pdf/multi-page.pdf.
• OECD. Income Inequality and Poverty. Available at: http://www.oecd.org/social/inequality-andpoverty.htm.
• Piketty Thomas. Capital in the Twenty-First Century. Cambridge: Harvard University Press, 2014.
• Stiglitz George. The price of inequality. Than the stratification of society threatens our future. 2016.
• Rajan R., Zingales L. Saving Capitalism from the Capitalists. Princeton: Princeton Un. Press, 2004.
• Leonid M. Grigoryev, Victoria Pavlyushina Social inequality: Problems of stagnation in 2000–2016 “Voprosy Ekonomiki”, 2018, #10, pp.29-52
32
145. Literature - 2
• Григорьев Л.М, Павлюшина В.А. Социальное неравенство в мире и в России. Доклад о человеческомразвитии в РA. Аналитический центр при Правительстве РФ, Москва, 2016.
• Григорьев Л, Салмина А. «Структура” социального неравенства современного мира: проблемы
измерения. «Социологический журнал», №3, 2013, стр. 5-16.
• Цели устойчивого развития ООН и Россия. Под ред. С.Н.Бобылева и Л.М.Григорьева, М., АЦ, 2016.
• Григорьев Л., Павлюшина В. «Бразилия: в ловушке среднего уровня развития», в «Мир новой
экономики», №2, 2016 с. 28-37.
• Григорьев Л. Социальное неравенство в мире – интерпретация неочевидных тенденций. Журнал
НЭА, №3 (31), 2016, с.160-170.
• Григорьев Л., Павлюшина В. «Социальное неравенство как проблема экономической стратегии
России», в «Мир новой экономики», №3, 2017. Малева Т.М., Бурдяк А.Я., Тындик А.О. Социальная
структура российского общества в зеркале демографии // Журнал Новой экономической ассоциации,
2016, №4 (32), с. 62–85.
• Григорьев Л.М. и В.А.Павлюшина «Межстрановое неравенство и проблема стадий развития»,
«Вопросы экономики», №7, 2018, стр.5-29.
• Салмина А. Избыточное неравенство и развитие человеческого потенциала. Доклад о человеческом
развитии в Российской Федерации. Аналитический центр при Правительстве РФ, М., 2014, с. 84-106.
• Средние классы: экономические и социальные стратегии / под ред. Т.М. Малевой. Московский Центр
Карнеги. М.: Гендальф, 2003.
Прогресс и риски: Неравенство и человеческое развитие в Восточной Европе, Турции и Центральной
Азии. Доклад ПРООН. 2016.
33
146. Growth and Macro 11.02.2019
Professor Leonid GrigoryevHSE, Moscow
www.leonidgrigoryev.com
147. Ratio of GDP per capita of the USSR/Russia to the USA
Russia/USASource: Maddison Project
USSR/USA
14
7
148. Growth factors – long-run demand
Infrastructure – roads and communications,Housing = new tendencies – two dwellings
Modernization of Equipment: industry etc.
Consumer Durables
Regional differences and development
Defense sector – quite “cheap” modernization
Oil sector = driver or milk cow
Financial sector – too weak for credits
Foreign money = cheap or expensive?
3
149. Contribution to real GDP growth from production side
4150. Contribution to real GDP growth from demand side
5151. Main economic indicators of the Russian Federation, 2007-2010, 2014-2017 (1/4)
Federation, 2007-2010,2014-2017 (1/4)
6
152. Main economic indicators of the Russian Federation, 2007-2010, 2014-2017 (2/4)
Federation, 2007-2010,2014-2017 (2/4)
6
153. Main economic indicators of the Russian Federation, 2007-2010, 2014-2017 (3/4)
Federation, 2007-2010,2014-2017 (3/4)
7
154. Main economic indicators of the Russian Federation, 2007-2010, 2014-2017 (4/4)
8155. Russia key indicators, growth for the period, %
Source: Rosstat15
5
156. Industrial production, 1990—2017*, 1998 = 100
*Half year 2017Source: Rosstat
10
157. Labour productivity growth rates in the world, the OECD region and emerging ,arkets and developing economies
Source: The Conference Boars Total Economy Database(Adjusted version), May 2017
11
158. Growth of labour productivity, capital deepening and TFP in the market sector of the Russian economy in 1995-2014 (annual
Growth of labour productivity, capital deepening and TFPin the market sector of the Russian economy in 19952014 (annual growth rate)
Source: Russia KLEMS, 2017
12
159. Gross profit and wages as a percentage of GDP (right scale)
13160. Percentage gap in GDP per worker in some Central and East Europe economies and Russia, arranged by levels in 1972 (% gap
relative to US)Source: The Conference Boars Total Economy
Database, May 2015
14
161. Income ratio by quintile, population, %; Gini coefficient, 2013-2018
15Source: Rosstat
162. Population income distribution, thousand roubles, 2013-2018
Source: Rosstat16
163. Personal consumption structure in Russia, 1990-2017
Personal consumptionstructure in Russia, 19902017
Source: Euromonitor
17
164. Real disposable income, real wages and consumer spending, 2012-2017
18165. Key interest rates of the leading countries` Central banks, 2007–2017
Key interest rates of the leadingcountries` Central banks, 2007–
2017
Source — Thomson Reuters, Baker Hughes
16
5
166. Actual CPI and survey inflationary expectations, 2010-2017 (by November)
166
167. Federal Budget Expenditures
167
168. Foreign Trade Main Parameters
22169. Military expenditure, in constant (2015) US$
USAChina
Russia
Saudi Arabia
France
India
United Kingdom
Japan
Germany
Republic of Korea
Italy
Australia
Brazil
Israel
Canada
Turkey
constant (2015) US$
1988
1998
2008
587,4
398,8
683,8
20,2
32,7
113,5
(1989)
250,0
14,0
41,4
(USSR)
23,3
31,4
50,0
57,7
51,1
53,6
17,9
22,8
41,0
59,4
47,8
64,4
34,5
40,9
40,2
58,2 (West
42,1
39,5
G)
14,1
20,1
29,5
31,7
32,4
34,3
12,1
13,6
19,6
14,5
14,8
20,6
14,3
12,5
14,7
16,9
12,5
17,9
7,9
16,3
13,8
Source: SIPR, 2017I
% GDP
1998 2008
3,0
4,2
2016
606,2
1988
5,7
225,7
2,5 (1989)
1,7
1,9
1,9
70,3
-
3,0
3,3
5,3
61,4
55,7
55,6
54,2
41,6
15,2
3,6
3,7
3,8
0,9
2,8
(West G)
4,3
2,3
2,2
2,1
17,1
2,0
2,9
14,3
2,7
2,8
2,4
1,0
7,4
2,3
2,6
2,4
1,0
10,4
2,3
2,5
1,9
1,0
1,5
1,3
1,2
2,9
1,9
1,9
1,7
7,9
1,3
3,3
2,6
1,7
1,8
1,5
6,5
1,3
2,3
2,7
1,5
2,0
1,3
5,8
1,0
2,0
41,0
37,3
28,0
24,4
22,8
17,8
15,5
15,0
2016
3,3
16
9
170. CPI, key interest rate CBR, ruble to $ rate and key % minus CPI
24171. Share of households in possession of some household durables and gadgets in Russia, 1992-2017
gadgets in Russia, 19922017Source: Euromonitor
25
172. Regional structure of the population and GRP (gross regional product) in Russia, 1990, 1997, 2007, 2015/2016
*Including the Crimea and SevastopolSource: Rosstat
172
173. Retail sales 2015-2016, per capita by type of regions
Source: Rosstat, Analytical center calculations17
3
174. Share of non-food goods expenditures in consumer spending of Russian families by quintiles, 2013-2018
Source: Rosstat28
175. Share of alcohol expenditures in consumer spendings of Russian families by quintiles, 2013-2018
Source: Rosstat29
176. Total area, number of flats and mean flats` area in houses built by legal entities and individuals, million square meters and
thousand square meters, 2008-20172008 2009 2010 2011 2012 2013 2014 2015
Taken into use, total, including:
Total area, mln.sq.m.*
64
60
58
62
66
70 84,2 85,3
Number of flats, th.
768 702 717 786 838 929 1124 1195
Mean area, sq.m.
83
85
82
79
78
76
75
71
Individuals (private, predominantly single family houses)
Total area, mln.sq.m.*
27
29
25
27
28
31 36,2 35,3
Number of flats, th.
200 210 192 201 211 228 268 272
Mean area, sq.m.
137 136 133 133 134 134 135 130
Legal entities (multifamily dwelling)
Total area, mln.sq.m.*
37
31
33
36
37
40 48,0 50,1
Number of flats, th.
568 492 525 585 627 701 856 923
Mean area, sq.m.
65
64
63
61
60
57
56
54
*Total floor space, mln.sq.m. calculated as the number of flats and
their mean area multiplication.
2016 2017
80,2 79,3
1167 1139
69
70
31,8 33,0
251 244
127 135
48,4 46,3
916 895
53
52
30
177. Recession and implications
Recessionand
Recession is difficult for everybody
Unofficial evaluations
gave the loss of GDP to sanctions as 1 p.p.
implications
of GDP, the rest is “oil”.
Budget is close to Maastricht norms
Devaluation brought further separation of “have” and “have not”
in terms of financial stability
Upper strata has purchased “enough”; poor do not have money
Agriculture and Mining keep growing
Real personal income declined, real wages turned up. It is not
enough to consumer spending recovery.
Investments are traditionally slow – it is not just %
31
178. Conclusion: Russia
Russia has made the detour from European income distribution toLatin American one in 1990s. We recorded it in 2000 – now it’s the
stable result of transition.
Gini coefficient in RF is similar to Anglo – Saxon, but Russia lacks their
vertical mobility and entrepreneurship.
Financially sustainable middle class is within 30% of households - a
little change in the upturn of 2000s.
Distribution in Russia – judging by the income share of top 10% of
population – is quite Latin American.
The oil rent gave the State has some degree of “independence” from
income tax-payers.
Key issues: ownership structure and corporate governance; no mass
shareholding; oligarchs of 1990s and rigid social structure – the risks of
returning poverty.
17
8
179. Literature:
Voskoboynikov, I. "Sources of long run economic growth in Russia beforeand after the global financial crisis." Russian Journal of Economics 3 (2017):
348-365.URL: https://rujec.org/article/27998/;
Kudrin A., Gurvich E. A new growth model for the Russian economy.”
Russian Journal of Economics 1 (2015) 30–54;
Mau V. “Russian economic policy: Challenges of growth” Russian Journal of
Economics 4 (2018) 87–107;
The Russian Economy: Modest Growth Ahead. 39 Russia Economic Report
2018 // World Bank Group. URL:
https://openknowledge.worldbank.org/bitstream/handle/10986/29913/1272
54-WP-PUBLIC-ADD-SERIESJunefinalRussiaEconomicReportENG.pdf?sequence=1&isAllowed=y
179
180.
Economy & Energy18.02.2019
Professor Leonid Grigoryev
www.leonidgrigoryev.com
181. Energy – history and theory
Energy waves – replacement by efficiency, costs,for mass use of specific technology, abundance;
Changes were coming by firms with technology
and access to invest, financing and policies;
UK in XIX = cheap coal for industrial revolution;
Oil in XX – Gas – Nuclear, RES, New role of Climate
Advanced tech. and mass use;
Energy security: development, poverty, finance;
2
182. Energy: history
Source: A. Makarov, A. Makarov. Laws of Power Industry Development: ElusoryEssence. Thermal Engineering, Vol. 57, No 13, 2010
3
183. Dynamics of the real prices for the key primary products 1901-2010, where 2007 = 100
Source: OECD, World Bank, IEF estimates18
3
184. Dynamics of the global energy consumption and GDP, 1971 - 2015
Source: IEA5
185. GDP energy capacity: developed countries,1970 – 2016
Source: IEA18
5
186. GDP energy capacity: developing countries,1971 - 2015
Source: IEA18
6
187. Average per capita energy consumption, 1970 - 2016
Source: IEA18
7
188. Comparison of the prices for different fuels, 2000 – 2016, $ / barrels of oil equivalent
Source: BP9
189. The Structure of World Energy Consumption, 1971 and 2015, % total consumption
CoalNatural gas
Hydro
Source: IEA
Oil and oil products
Nuclear energy
Renewable energy
sources
18
9
190.
Global fuel mix is becoming more diversified, gas and RESare demonstrating the highest growth (2016)
Primary energy demand by fuel
(in 2015 and increase by 2040),
Probable Scenario
Structure of primary energy demand by
fuel in 2015 and in 2040, Probable
Scenario
mtoe
2040
5 000
2040
4 000
2015
3 000
11%
3%
6%
4%
2% 10%
1%
5%
Oil
27%
31%
Hydro
28%
0
Source: Global and Russian Energy Outlook-2016, ERI RAS-AC
Coal
Nuclear
2 000
1 000
Gas
25%
22%
Bioenergy
24%
Other renewables
12
190
191. Geopolitics & Rational Changes
Geopolitics & Rational ChangesGrowth and Energy consumption
Embargo of Arab OPEC 1973 and Fear of Security
Energy Transition: Actual processes and Expectations
Climate Change prevention = Kyoto and Paris 2015
EU-2020 and EU-2050 - Decarbonization and MFG
import in EU (please see Makarov)
Russian 10% of World primary energy and 5 p.p.
export.
China (65% coal), India and South Africa
Poverty Vs Climate
13
192. World GDP and Trade Growth rate, %, 1995‑2018
World GDP and Trade Growth rate, %, 1995-2018Source: IMF, WEO April 2017 Edition
19
2
193. Carbon Dioxide Emissions, 1985-2017
Source: BP Stat. Review 201719
3
194. Geopolitics steps over trade, development and Global problems’ solutions
World is losing stability but keeps talking about Climate changeprevention, Water, Food, Poverty. Middle class role?
Global community is losing the Battle of Mitigation
Growth is not bringing more Equality, in or between!
New growth regime for GDP and Trade
Stable Energy Prices for next decades ($50-70)?
Promoting Growth requires New Globalization:
•Stability of “game’s rules”
•Long horizons of planning – investments needs
•Predictability of world development
•Sustainable Development Goals
14
195. GDP and Primary Energy Consumption, annual growth rates, 1991 - 2017
GDP and Primary Energy Consumption, annual growth rates, 1991 2017GDP (PPP const. 2011, World Bank)
World
OECD
USA
EU
Japan
Non-OECD
Brazil
Russia
India
China
World
OECD
Non-OECD
Primary energy consumption
1991- 20032010- 19912009
2002
2008
2017
2002
3,0
4,7
-0,4
3,5
1,6
2,7
2,4
-3,5
2,0
1,4
3,4
2,2
-2,8
2,1
1,4
2,3
2,5
-4,3
1,5
0,4
0,9
1,2
-5,4
1,1
1,2
3,5
7,6
3,0
4,9
1,8
2,6
4,8
-0,1
0,4
3,5
-2,2
7,1
-7,8
1,4
-2,8
5,8
8,0
8,5
6,8
4,4
10,2
11,6
9,4
7,6
4,5
Energy consumption (p. %) minus GDP
-1,4
-1,3
-1,7
Source: World Bank, BP
20032008
3,2
0,5
0,1
0,1
0,0
6,1
4,4
1,3
6,6
10,5
(p.%)
-1,5
-1,8
-1,4
-1,6
-4,8
-4,8
-5,8
-8,6
1,4
-0,6
-4,7
7,5
4,4
20102017
1,6
0,1
0,0
-0,7
-1,4
2,7
1,6
0,6
4,9
3,3
-1,2
-1,4
-1,6
-1,9
-1,9
-2,1
2009
19
5
196. Oil and Gas Consumption, annual growth rates, 1991 - 2017
WorldOECD
USA
EU
Japan
Non-OECD
Brazil
Russia
India
China
World
OECD
Non-OECD
Oil consumption
Gas consumption
1991- 20032010- 1991- 200320102009
2009
2002
2008
2017
2002
2008
2017
1,4
1,5
-1,7
1,3
2,1
3,3
-2,8
2,1
1,2
-0,3
-4,9
0,0
2,6
1,6
-3,2
1,2
1,5
-0,5
-4,6
0,4
1,5
0,9
-1,8
1,9
0,5
-0,1
-5,3
-0,9
2,6
0,9
-6,3
-1,6
-0,1
-2,2
-10,4
-1,6
3,3
3,3
-6,7
2,4
1,6
4,0
2,2
2,7
1,5
5,2
-2,4
2,8
3,4
4,2
0,2
1,4
14,5
9,6
-19,5
4,6
-6,1
1,2
-4,1
1,5
-1,1
1,9
-5,5
0,1
6,1
4,4
5,1
4,9
6,8
7,1
20,9
-1,3
6,7
6,5
3,8
4,2
5,9
19,1
10,1
12,0
Oil / Gas consumption (poins %) minus GDP (points %)
-1,6
-3,1
-1,3
-2,1
-0,9
-1,4
-2,4
-1,4
-1,5
-2,7
-1,4
-2,0
-0,1
-0,8
0,4
-0,7
-1,8
-3,4
-0,8
-2,1
-1,9
-2,3
-5,2
-2,0
*Calculated index
Source: World Bank, BP
19
6
197. Coal consumption and Electricity generation, annual growth rates, 1991 - 2017
WorldOECD
USA
EU
Japan
Non-OECD
Brazil
Russia
India
China
Coal consumption
1991- 200320102009
2002
2008
2017
1,1
5,3
-1,5
0,5
0,4
0,3
-10,5
-2,8
1,3
0,1
-12,0
-5,6
-2,7
-1,8
-11,9
-2,5
2,7
2,4
-15,5
0,6
1,8
8,4
2,9
1,7
1,1
1,4
-19,3
1,9
-4,3
-0,7
-8,5
0,3
3,6
7,4
8,3
5,6
3,6
10,7
4,8
1,1
Electricity generation
1991- 200320102009
2002
2008
2017
2,7
3,8
-0,8
2,4
2,2
1,6
-4,0
0,0
2,1
1,2
-4,2
-0,4
1,6
0,9
-4,9
-0,3
1,8
1,6
-5,9
-1,8
3,5
6,9
2,9
4,6
3,6
4,9
0,7
2,0
-1,6
2,6
-4,5
0,7
6,0
5,4
6,2
6,9
8,5
12,8
6,3
6,4
Coal consumption / Electricity generation (p %) minus GDP (p %)
World
OECD
Non-OECD
-1,9
-2,3
-1,6
*Calculated index
Source: World Bank, BP
0,5
-2,1
0,7
-1,2
-7,3
-0,1
-2,9
-4,7
-3,0
-0,4
-0,5
0,0
-0,9
-0,8
-0,6
-0,4
-0,5
-0,1
-1,1
-1,9
-0,2
19
7
198. Global Energy Balance, mln tons, 2015
StocksThe share in
(reserves) Consumption consumptio
change
n%
Production
Import
Export
Coal
3865,0
791,7
820,3
-7,1
3829,2
28,1
Oil and oil products
4416,3
3562,1 3612,7
-31,3
4334,3
31,8
Natural gas
2975,7
868,7
883,4
-17,2
2943,7
21,6
Nuclear energy
670,7
0,0
0,0
0,0
670,7
4,9
Hydropower
334,4
0,0
0,0
0,0
334,4
2,5
Renewable energy sources
(except hydro)
1519,6
20,7
16,6
0,3
1524,0
11,2
Total
13790,0
-55,1
13647,4
100,0
Source: IEA
5307,9 5395,5
19
8
199. Energy poverty
Electricity Access, Regional SummaryRate of access
National
WORLD
Developing Countries
Africa
North Africa
Sub-Saharan Africa
Developing Asia
China
India
Indonesia
Other Southeast Asia
Other Developing Asia
Central and South America
Middle East
Source: IEA, World Energy Outlook 2017
2000
73%
64%
34%
90%
23%
67%
99%
43%
53%
67%
32%
87%
91%
2016
86%
82%
52%
100%
43%
89%
100%
82%
91%
89%
73%
97%
93%
Urban
Rural
2016
96%
94%
77%
100%
71%
97%
100%
97%
99%
97%
87%
98%
98%
2016
73%
70%
32%
99%
23%
81%
100%
74%
82%
82%
65%
86%
79%
Population
without access
(million)
2016
1060
1060
588
<1
588
439
239
23
42
135
17
17
20
200. Global energy supply investment in 2014 – 2035, IEA estimate (2014), bln USD-2012, by industry, by region
Total: 40 165 bln USD (year-2012 prices)Source: IEA, World Energy Investment Outlook 2014
20
0
201. Example of interfuel substitution
Source:IEA22
202. OPEC & RUSSIA
OPEC & RUSSIA203. Export Incomes in OPEC countries and Russia, bln. $, 2000-2017
Source: Analytical Center24
204. The acceptable price in budget leveraging, 2000-2017
The acceptable price in budget leveraging, 2000201720
4
205.
Russian Primary Energy Consumption, mln toeSource: BP
20
5
206. GDP, export and import of Russia, y/y, 2015-2017
Source: Thomson Reuters Datastream20
6
207.
Russian export of energy, mln toeSource: ERI RAS
20
7
208.
Russian Primary Energy Consumption, mln toe2015
2016
Oil
144,2
148,0
2,6%
Natural Gas
362,5
351,8
-3,0%
Coal
92,2
87,3
-5,3%
Nuclear Energy
44,2
44,5
0,6%
Hydro electric
38,5
42,2
9,8%
Renewables
0,15
0,16
7,2%
Total
681,7
673,9
-1,1%
Source: BP
20
8
209. Conclusions on OPEC+
Oil prices of $55 - $70 helped to Global growth restoration in2016-2018
Global forecast for 2040 is still open page.
May be peak at 110 mbd. of oil extraction
Incomes are more important than records of output
Energy transition is inevitable, but speed and scope are not
rigid
Huge investments needs for transition, reducing energy poverty
China, India and Africa are still in coal for a long time.
Emission of GHG is still growing, Paris 2015 is to be reviewed.
OPEC+ to reinvest export incomes into development.
Beware of demography in Middle East
There is no Global Energy Strategy!
30
210. World Energy Transition and Future
World is undergoing Energy transition, but still not that fast asGreen people hope.
Current oil prices are secured the Global Growth in 2016-2018.
Car are still mostly non-electric in stock and in annual sales.
Energy sector and any changes in its structure require huge
investments.
One mbd a day per year = looking to 100 mbd in 2019
Climate Change prevention V Energy Poverty and Development
needs
American oil takes quite a bite from others in 2018
Prices are stable due to growing demand and decline of output.
Sanctions as a factor of pricing – Fall of 2018
Stability of pricing corridor depends on coordination – to
assure price wars avoidance.
31
211. Literature 1
1. Григорьев Л.М., Чапыгина А.В. «Саудовская Аравия – нефть и развитие»,«Мировая Энергетическая политика», №7, 2002.
2. Григорьев Л.М., Крюков В.А. «Мировая энергетика на перекрестке дорог:
какую дорогу выбрать России?» - «Вопросы экономики», №12, 2009.
3. Россия, Газпром и Центральная Азия-Центр: интересы и отношения. В
“Russian Energy Security and Foreign Policy”, Ed. By A. Dellecker and Th.
Gomart, London and New York, IFRI, Routledge, 2011, стр.147-169.
4. Макаров И.А., Соколова А.К. «Оценка углеродоемкости внешней торговли
России», «Экономический журнал ВШЭ», №3, 2014.
5. «Энергетические субсидии в современном мире». Страны «Группы
двадцати», под редакцией Л. М. Григорьева, А. А. Курдина –, 2014.
6. Григорьев Л.М., Курдин А.А. «Дисбаланс нефтяного рынка: технологии,
экономика, политика.» - «Энергетическая политика», №1, 2015.
7. «Прогноз энергетики мира и России до 2040 года», Научный руководитель
А.А.Макаров, Т.А.Митрова, Л.М.Григорьев и др. ИНЭИ РАН и АЦ, М. 2016.
32
212. Literature 2
“Global and Russian Energy Outlook Up To 2040”, IES,RAS,2016
“Domestic Debates on Climate in Russia”, L.Grigoryev,
I.Makarov, A.Salmina, “Climate Change, Sustainable
Development, and Human Security”, Ed. Dhirendra K. Vajpeyi,
Lexington Books, 2013, chap. 9, pp. 249-280.
2018 Outlook for Energy: A View to 2040 [online] IEA:
http://cdn.exxonmobil.com/~/media/global/files/outlookfor-energy/2018/2018-outlook-for-energy.pdf.
I. Makarov and A. Sokolova “Carbon EmissionsEmbodied in
Russian trade: implications for Climate Policy ” - Review
of European and Russian Affairs 11 (2), 2017.
33
213. Macro & 4.03.2019
Macro &4.03.2019
Professor Leonid Grigoryev
HSE, Moscow
www.leonidgrigoryev.com
214. Upcoming events
4 of March – Macro light questions forstudents
11 of March – lecture on Transition and
discussion
16 of March – test by groups
18 of March - Discussion of the crucial topics
25 of March at 12:00 – Exam
2
215. Ratio of GDP per capita of the USSR/Russia to the USA
Russia/USASource: Maddison Project
USSR/USA
21
5
216. Growth factors – long-run demand
Infrastructure – roads and communications,Housing = new tendencies – two dwellings
Modernization of Equipment: industry etc.
Consumer Durables
Regional differences and development
Defense sector – quite “cheap” modernization
Oil sector = driver or milk cow
Financial sector – too weak for credits
Foreign money = cheap or expensive?
3
217.
Source: Haver Analytics4
218. Contribution to real GDP growth from production side
5219. Contribution to real GDP growth from demand side
6220. Main economic indicators of the Russian Federation, 2007-2010, 2014-2017 (1/3)
Federation, 2007-2010,2014-2017 (1/3)
7
221. Main economic indicators of the Russian Federation, 2007-2010, 2014-2017 (2/3)
Federation, 2007-2010,2014-2017 (2/3)
8
222. Main economic indicators of the Russian Federation, 2007-2010, 2014-2017 (3/3)
9223. Industrial production, 1990—2017*, 1998 = 100
*Half year 2017Source: Rosstat
10
224. Gross profit and wages as a percentage of GDP (right scale)
11225. Income ratio by quintile, population, %; Gini coefficient, 2013-2018
12Source: Rosstat
226. Population income distribution, thousand roubles, 2013-2018
Source: Rosstat13
227. Personal consumption structure in Russia, 1990-2017
Personal consumptionstructure in Russia, 19902017
Source: Euromonitor
14
228. Share of households in possession of some household durables and gadgets in Russia, 1992-2017
gadgets in Russia, 19922017Source: Euromonitor
15
229. Actual CPI and survey inflationary expectations, 2010-2017 (by November)
16230. Federal Budget Expenditures
17231. Foreign Trade Main Parameters
18232. Military expenditure, in constant (2015) US$
USAChina
Russia
Saudi Arabia
France
India
United Kingdom
Japan
Germany
Republic of Korea
Italy
Australia
Brazil
Israel
Canada
Turkey
constant (2015) US$
1988
1998
2008
587,4
398,8
683,8
20,2
32,7
113,5
(1989)
250,0
14,0
41,4
(USSR)
23,3
31,4
50,0
57,7
51,1
53,6
17,9
22,8
41,0
59,4
47,8
64,4
34,5
40,9
40,2
58,2 (West
42,1
39,5
G)
14,1
20,1
29,5
31,7
32,4
34,3
12,1
13,6
19,6
14,5
14,8
20,6
14,3
12,5
14,7
16,9
12,5
17,9
7,9
16,3
13,8
Source: SIPR, 2017I
% GDP
1998 2008
3,0
4,2
2016
606,2
1988
5,7
225,7
2,5 (1989)
1,7
1,9
1,9
70,3
-
3,0
3,3
5,3
61,4
55,7
55,6
54,2
41,6
15,2
3,6
3,7
3,8
0,9
2,8
(West G)
4,3
2,3
2,2
2,1
17,1
2,0
2,9
14,3
2,7
2,8
2,4
1,0
7,4
2,3
2,6
2,4
1,0
10,4
2,3
2,5
1,9
1,0
1,5
1,3
1,2
2,9
1,9
1,9
1,7
7,9
1,3
3,3
2,6
1,7
1,8
1,5
6,5
1,3
2,3
2,7
1,5
2,0
1,3
5,8
1,0
2,0
41,0
37,3
28,0
24,4
22,8
17,8
15,5
15,0
2016
3,3
19
233. Relative Stability of main economic indicators
234. CPI, key interest rate CBR, ruble to $ rate and key % minus CPI
21235.
Note: Seasonally adjusted quarterly growth,annualized. PMI stands for Purchasing Manager’s
Index.
22
236.
Source: CBR and Haver Analytics23
237.
**SA – Seasonally Adjusted
Source: Rosstat and Haver Analytics
24
238.
Source: CBR25
239.
Source: CBR.26
240.
Source: CBR27
241.
Source: Rosstat, World Bank28
242. Recession and implications
Recessionand
Recession is difficult for everybody
Unofficial evaluations
gave the loss of GDP to sanctions as 1 p.p.
implications
of GDP, the rest is “oil”.
Budget is close to Maastricht norms
Devaluation brought further separation of “have” and “have not”
in terms of financial stability
Upper strata has purchased “enough”; poor do not have money
Agriculture and Mining keep growing
Real personal income declined, real wages turned up. It is not
enough to consumer spending recovery.
Investments are traditionally slow – it is not just %
29
243. Conclusion: Russia
Russia has made the detour from European income distribution toLatin American one in 1990s. We recorded it in 2000 – now it’s the
stable result of transition.
Gini coefficient in RF is similar to Anglo – Saxon, but Russia lacks their
vertical mobility and entrepreneurship.
Financially sustainable middle class is within 30% of households - a
little change in the upturn of 2000s.
Distribution in Russia – judging by the income share of top 10% of
population – is quite Latin American.
The oil rent gave the State has some degree of “independence” from
income tax-payers.
Key issues: ownership structure and corporate governance; no mass
shareholding; oligarchs of 1990s and rigid social structure – the risks of
returning poverty.
30
244. Literature:
Voskoboynikov, I. "Sources of long run economic growth in Russia before andafter the global financial crisis." Russian Journal of Economics 3 (2017): 348365.URL: https://rujec.org/article/27998/;
Mau V., Drobyshevskaya T. "Modernization and the Russian Economy: Three
Hundred Years of Catching Up."// The Oxford Handbook of the Russian Economy
Edited by Alexeev M. and Weber Sh., 2012.
Grigoryev L. Russia in the System of Global Economic Relations // Strategic
Analysis. Vol. 46. 2016. № 6. Special Issue: Russia in Global Affairs. P. 498-512.
Mau V. “Russian economic policy: Challenges of growth” Russian Journal of
Economics 4 (2018) 87–107;
The Russian Economy: Modest Growth Ahead. 39 Russia Economic Report 2018
// World Bank Group. URL:
https://openknowledge.worldbank.org/bitstream/handle/10986/29913/12725
4-WP-PUBLIC-ADD-SERIESJunefinalRussiaEconomicReportENG.pdf?sequence=1&isAllowed=y
31